
Abstract
Endovascular reperfusion therapy is increasingly used for acute ischemic stroke treatment. The occurrence of parenchymal hemorrhage is clinically relevant and increases with reperfusion therapies. Herein we aimed to examine the optimal perfusion CT-derived parameters and the impact of the duration of brain ischemia for the prediction of parenchymal hemorrhage after endovascular therapy. A cohort of 146 consecutive patients with anterior circulation occlusions and treated with endovascular reperfusion therapy was analyzed. Recanalization was assessed at the end of reperfusion treatment, and the rate of parenchymal hemorrhage at follow-up neuroimaging. In regression analyses, cerebral blood volume and cerebral blood flow performed better than Delay Time maps for the prediction of parenchymal hemorrhage. The most informative thresholds (receiver operating curves) for relative cerebral blood volume and relative cerebral blood flow were values lower than 2.5% of normal brain. In binary regression analyses, the volume of regions with reduced relative cerebral blood volume and/or relative cerebral blood flow was significantly associated with an increased risk of parenchymal hemorrhage, as well as delayed vessel recanalization. These results highlight the relevance of the severity and duration of ischemia as drivers of blood-brain barrier disruption in acute ischemic stroke and support the role of perfusion CT for the prediction of parenchymal hemorrhage.
Introduction
Endovascular therapy (ET) is increasingly used for acute ischemic stroke treatment due to proximal vessel occlusions and its clinical benefit over best medical therapy in selected patients has been recently shown.1–3 The risk of intracerebral hemorrhage increases with reperfusion therapies and is associated with increased morbidity and mortality. 4 Therefore, the identification of clinical and radiological predictors of hemorrhagic complications in patients with acute stroke receiving reperfusion therapies is highly relevant.
The pathophysiological mechanisms involved in the appearance of cerebral hemorrhage associated with reperfusion therapies are multiple, including several processes such as the severity and duration of brain ischemia, toxicity secondary to thrombolytic drugs and procedure-related direct vessel damage.5,6 Of those mechanisms, the severity of brain ischemia can be reliably quantified using dynamic contrast-enhanced magnetic resonance imaging (MRI) or computerized tomography (CT) by measuring cerebral blood flow (CBF), cerebral blood volume (CBV) or time-based variables such as Tmax, mean transit time (MTT), time to peak (TTP) or delay time (DT). MRI-based clinical studies of patients with acute stroke treated or not with thrombolysis have shown that very severe reductions of CBV (termed as Very Low CBV) are strongly associated with the risk of PH,7–9 particularly when delayed reperfusion occurs after thrombolysis. 8 Using perfusion CT, the risk of hemorrhagic transformation has been related to a myriad of perfusion measures such as low relative CBV values, 10 low relative CBF values, 11 longer relative MTT or Tmax values,11,12 and severe hypoperfusion detected in TTP maps. 13 Specifically in patients receiving endovascular reperfusion therapies, reduced pretreatment CBV or CBF values measured with perfusion CT have been associated with poor clinical outcomes, 14 including the risk of development of intracranial hemorrhage.15,16 However, the best perfusion CT parameters and thresholds for the prediction of PH and their relationship with the occurrence and timing of reperfusion have not been sufficiently addressed in this patient population. Moreover, the identification and validation of these biomarkers may be relevant for risk stratification of acute stroke patients receiving multimodal reperfusion therapies and for the evaluation of neuroprotective therapies in the setting of clinical trials.
Here we performed a comprehensive analysis of whole-brain perfusion CT maps to assess the relevance of the severity and duration of brain ischemia in predicting the risk of parenchymal hemorrhage in acute stroke secondary to proximal arterial occlusion treated with endovascular reperfusion therapies. Expressly, we aimed to examine the optimal parameters and thresholds of perfusion maps for the prediction of PH after ET and to evaluate the impact of the timing from the onset of ischemia to reperfusion on the risk of PH.
Materials and methods
Patients
Patients were part of a prospectively collected clinical registry of acute ischemic stroke treated with reperfusion therapies in a single Comprehensive Stroke Center. The study population included consecutive patients with occlusions in the carotid territory treated with endovascular recanalization therapy between March 2010 and July 2013. Additional inclusion criteria for this analysis were: (1) the availability of a technically adequate pre-treatment whole-brain perfusion CT scan, and (2) the availability of a post-treatment follow-up neuroimaging adequate for evaluating the development of hemorrhagic transformation. Post-treatment follow-up neuroimaging included Dual Energy CT (DE-CT) or MRI. DE-CT scan was required instead of plain CT scan to allow an accurate differentiation between blood and contrast media extravasation. 17 A total of 146 patients fulfilled these criteria and were finally included in the study. A contemporary group of 51 patients was not included because of vertebro-basilar location of the arterial occlusion (n = 24), absence of baseline perfusion CT imaging (n = 7), technically inadequate perfusion CT acquisition (n = 10), no availability of follow-up DE-CT or MRI (n = 10). ET was performed in patients with a proximal artery occlusion on CT angiography if the patients and/or their legal representatives signed a written informed consent accepting to receive ET and to be included in the registry. The presence of a malignant profile in perfusion CT and the absence of mismatch in patients with symptoms lasting >4.5 h from the onset of stroke were exclusion criteria for receiving ET. This pre-treatment perfusion evaluation was performed using a commercially available semi-automated perfusion analysis software (Siemens) based on the maximum slope model of perfusion. Infarct core was segmented based on a CBV threshold of 0.6 relative to the contralateral white matter and ischemic penumbra was segmented based on a TTP relative threshold of 6 s compared to contralateral hemisphere for identification of critically hypoperfused tissue. In patients with proximal occlusions, malignant profile was defined as infarct core higher than 70 ml, and mismatch profile was defined as the presence of a hypoperfusion lesion that was higher or equal than 120% of the infarct core. Data were stored in a local database and declared to a Web-based registry that satisfied all legal requirements for protection of personal data, monitored by the Catalan Health Department. The study protocol was also approved by the local Clinical Research Ethics Committee from Hospital Clínic of Barcelona under the requirements of Spanish legislation in the field of biomedical research, the protection of personal data (15/1999) and the standards of Good Clinical Practice, as well as with the Helsinki Declaration of 1975/1983.
Patients were admitted into an intermediate care Stroke Unit and were managed by certified stroke neurologists following the European Stroke Organization Guidelines. The qualifying strokes were classified according to the Trial of Org 10172 in Acute Stroke Treatment (TOAST) criteria after a complete diagnostic workup. 18 Demographics, risk factors, laboratory tests, neuroimaging, concomitant therapies, clinical course, and functional outcome were prospectively collected. Neurological status was monitored with the National Institutes of Health Stroke Scale (NIHSS) score and functional outcome was quantified with the modified Rankin Scale (mRS) score at 3 months.
Imaging protocol
The imaging protocol included a baseline multimodal whole-brain CT scan, which included a plain CT (140 Kv, 127 mAs, FoV 225 mm, matrix 512 × 512, slice thickness 5 mm), a CT angiography (120 Kv, 663 mAs, FoV 261 mm, matrix 512 × 512, slice thickness 0.6 mm), and a perfusion CT performed before ET. When systemic recombinant tissue plasminogen activator (rt-PA) was administered, the multimodal neuroimaging was performed at the end of rt-PA infusion. The Alberta Stroke Program Early CT Score (ASPECTS) was assessed on baseline CT, and collaterals were scored on CT angiography according to a validated grading system (Tan scale) that ranged from 0 to 3 (0, absent collateral supply; 1, collateral supply filling <50%; 2, collateral supply filling >50% but <100% of the occluded arterial territory; and 3, 100% collateral supply). 19 After ET, a DE-CT and/or an MRI were performed within 72 h [median 38 (IQR 17–72) h] of hospital admission. The implemented DE-CT protocol allowed simultaneous imaging acquisition at 100 kV/250 mAs and 140 kV/250 mAs, and a 20 × 0.6 mm collimation. The MRI included diffusion-weighted images (DWI, parameters: Repetition time (TR)/echo time (TE) 10,800/89 ms, matrix 192 × 192, Field of View (FoV) 240 mm, slice thickness 3 mm, directions x,y,z, b-values: 0 and 1000 mm/s2) and gradient.echo T2*-weighted (GRE: TR/TE 764/26 ms; matrix 384 × 512; FoV 240 mm; slice thickness 5 mm) sequences. The bleeding complications were scored on follow-up brain imaging (up to 72 h) according to the European Cooperative Acute Stroke Study (ECASS) criteria as hemorrhagic infarction (HI) and parenchymal hematoma (PH) type 1 and type 2. 20 Symptomatic intracranial hemorrhage was defined as any PHs associated with an increment of at least 4 points in the NIHSS score. Investigators blinded to clinical data and baseline perfusion CT analysis (AR, SA) evaluated in consensus the post-treatment imaging studies.
Final vessel patency was graded on digital subtraction angiography (DSA) at the end of ET according to the Thrombolysis in Cerebral Infarction (TICI) classification (Grade 0, no perfusion; Grade 1, penetration with minimal perfusion; Grade 2a, partial filling of the entire vascular territory; Grade 2b, complete filling, but the filling is slower than normal; Grade 3, complete perfusion). For this analysis recanalization was defined as a grade 2–3 if it was obtained at the end of ET and was further classified as early if obtained within the first 6 h from symptom onset or delayed if obtained after 6 h.
Perfusion CT imaging analysis
Threshold-finding perfusion CT analysis
Range of explored thresholds in CT maps.
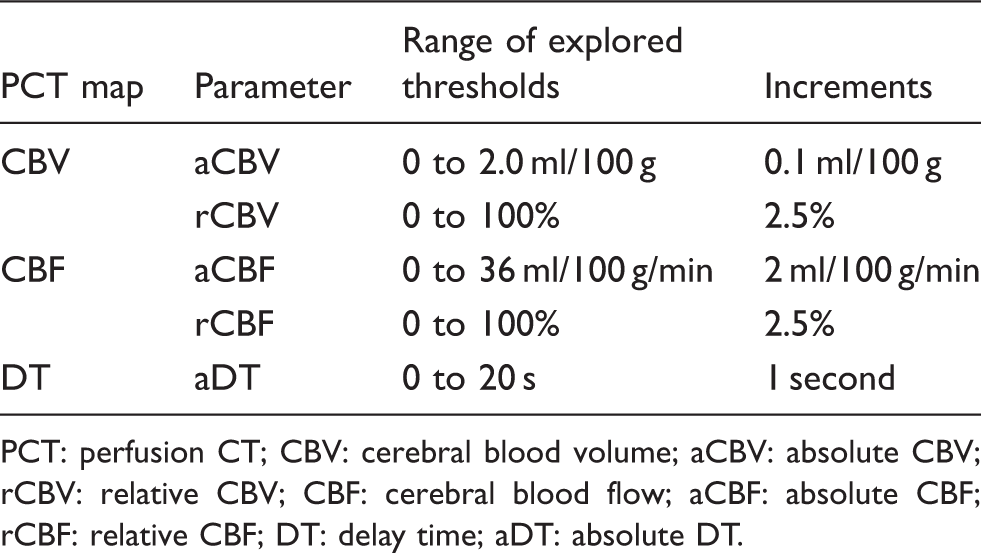
PCT: perfusion CT; CBV: cerebral blood volume; aCBV: absolute CBV; rCBV: relative CBV; CBF: cerebral blood flow; aCBF: absolute CBF; rCBF: relative CBF; DT: delay time; aDT: absolute DT.
Perfusion CT-MRI coregistered regions of interest analysis
Patients who developed PH at follow-up and had both baseline perfusion CT and follow-up MRI (n = 19) were additionally analyzed to explore the differences in baseline perfusion values between three coregistered regions of interest delineated in MRI: non-infarcted tissue, infarcted tissue, and tissue with hemorrhagic transformation. The MR imaging protocol included DWI and GRE sequences. Each MR image (DWI and GRE) was coregistered to the corresponding perfusion CT map using a rigid co-registration protocol implemented with Statistical Parametric Mapping (SPM8, Functional Imaging Laboratory, University College London, London, UK). DWI and GRE lesions were delineated using AMIRA software by means of a semi-automated thresholding method to identify regions of interest with high DWI and low GRE signal intensity. DWI lesions were defined as pixels exceeding the DWI signal intensity of the contralateral hemisphere by more than three standard deviations and GRE lesions as pixels with intensity below 20% of the mean in the contralateral hemisphere. DWI and GRE Regions of Interest (ROI) were then placed in the coregistered perfusion CT maps and automatically mirrored to the contralateral hemisphere. The mean values of CBF, CBV and DT in the respective individual perfusion CT maps were extracted and compared within these ROIs.
Statistics
Continuous variables were reported as mean (standard deviation, SD) or median (interquartile range, IQR) and were compared with the Student t-test, ANOVA, Mann–Whitney, or Kruskal-Wallis tests as appropriate. Categorical variables were compared with the χ2 and Fisher exact tests. Receiver-operating characteristic (ROC) curve analysis was performed to determine the most accurate perfusion CT parameter, and the optimal threshold for each parameter for the prediction of PH. After transformation to the third root to approach normality, the selected perfusion CT parameters were included in binary logistic regression models to evaluate their association with the risk of PH. In each model, the coefficient of determination (R2), and information criteria indicators, such as the Akaike’s information criterion (AIC) and the Bayesian information criterion (BIC) were calculated to compare their predictive effects on the risk of PH. A better model is evidenced by a lower AIC, a lower BIC, and a higher R2. 22 Univariated logistic regression models were used to assess the value of the selected perfusion measures (relative CBV and CBF) to predict the risk of PH. Afterwards, multivariate logistic regression models were used to adjust the estimations for the effect of time from stroke onset to recanalization, baseline NIHSS and pre-stroke antithrombotic use (p values lower than 0.10 on univariate analysis), and for other potential relevant confounding variables such as age, gender and treatment modality (primary ET versus rescue ET). The analyses were performed using SPSS Version 19.0 and the level of significance was established at the 0.05 level (2-sided).
Results
Demographics, baseline and procedure related variables according to the occurrence of PH.
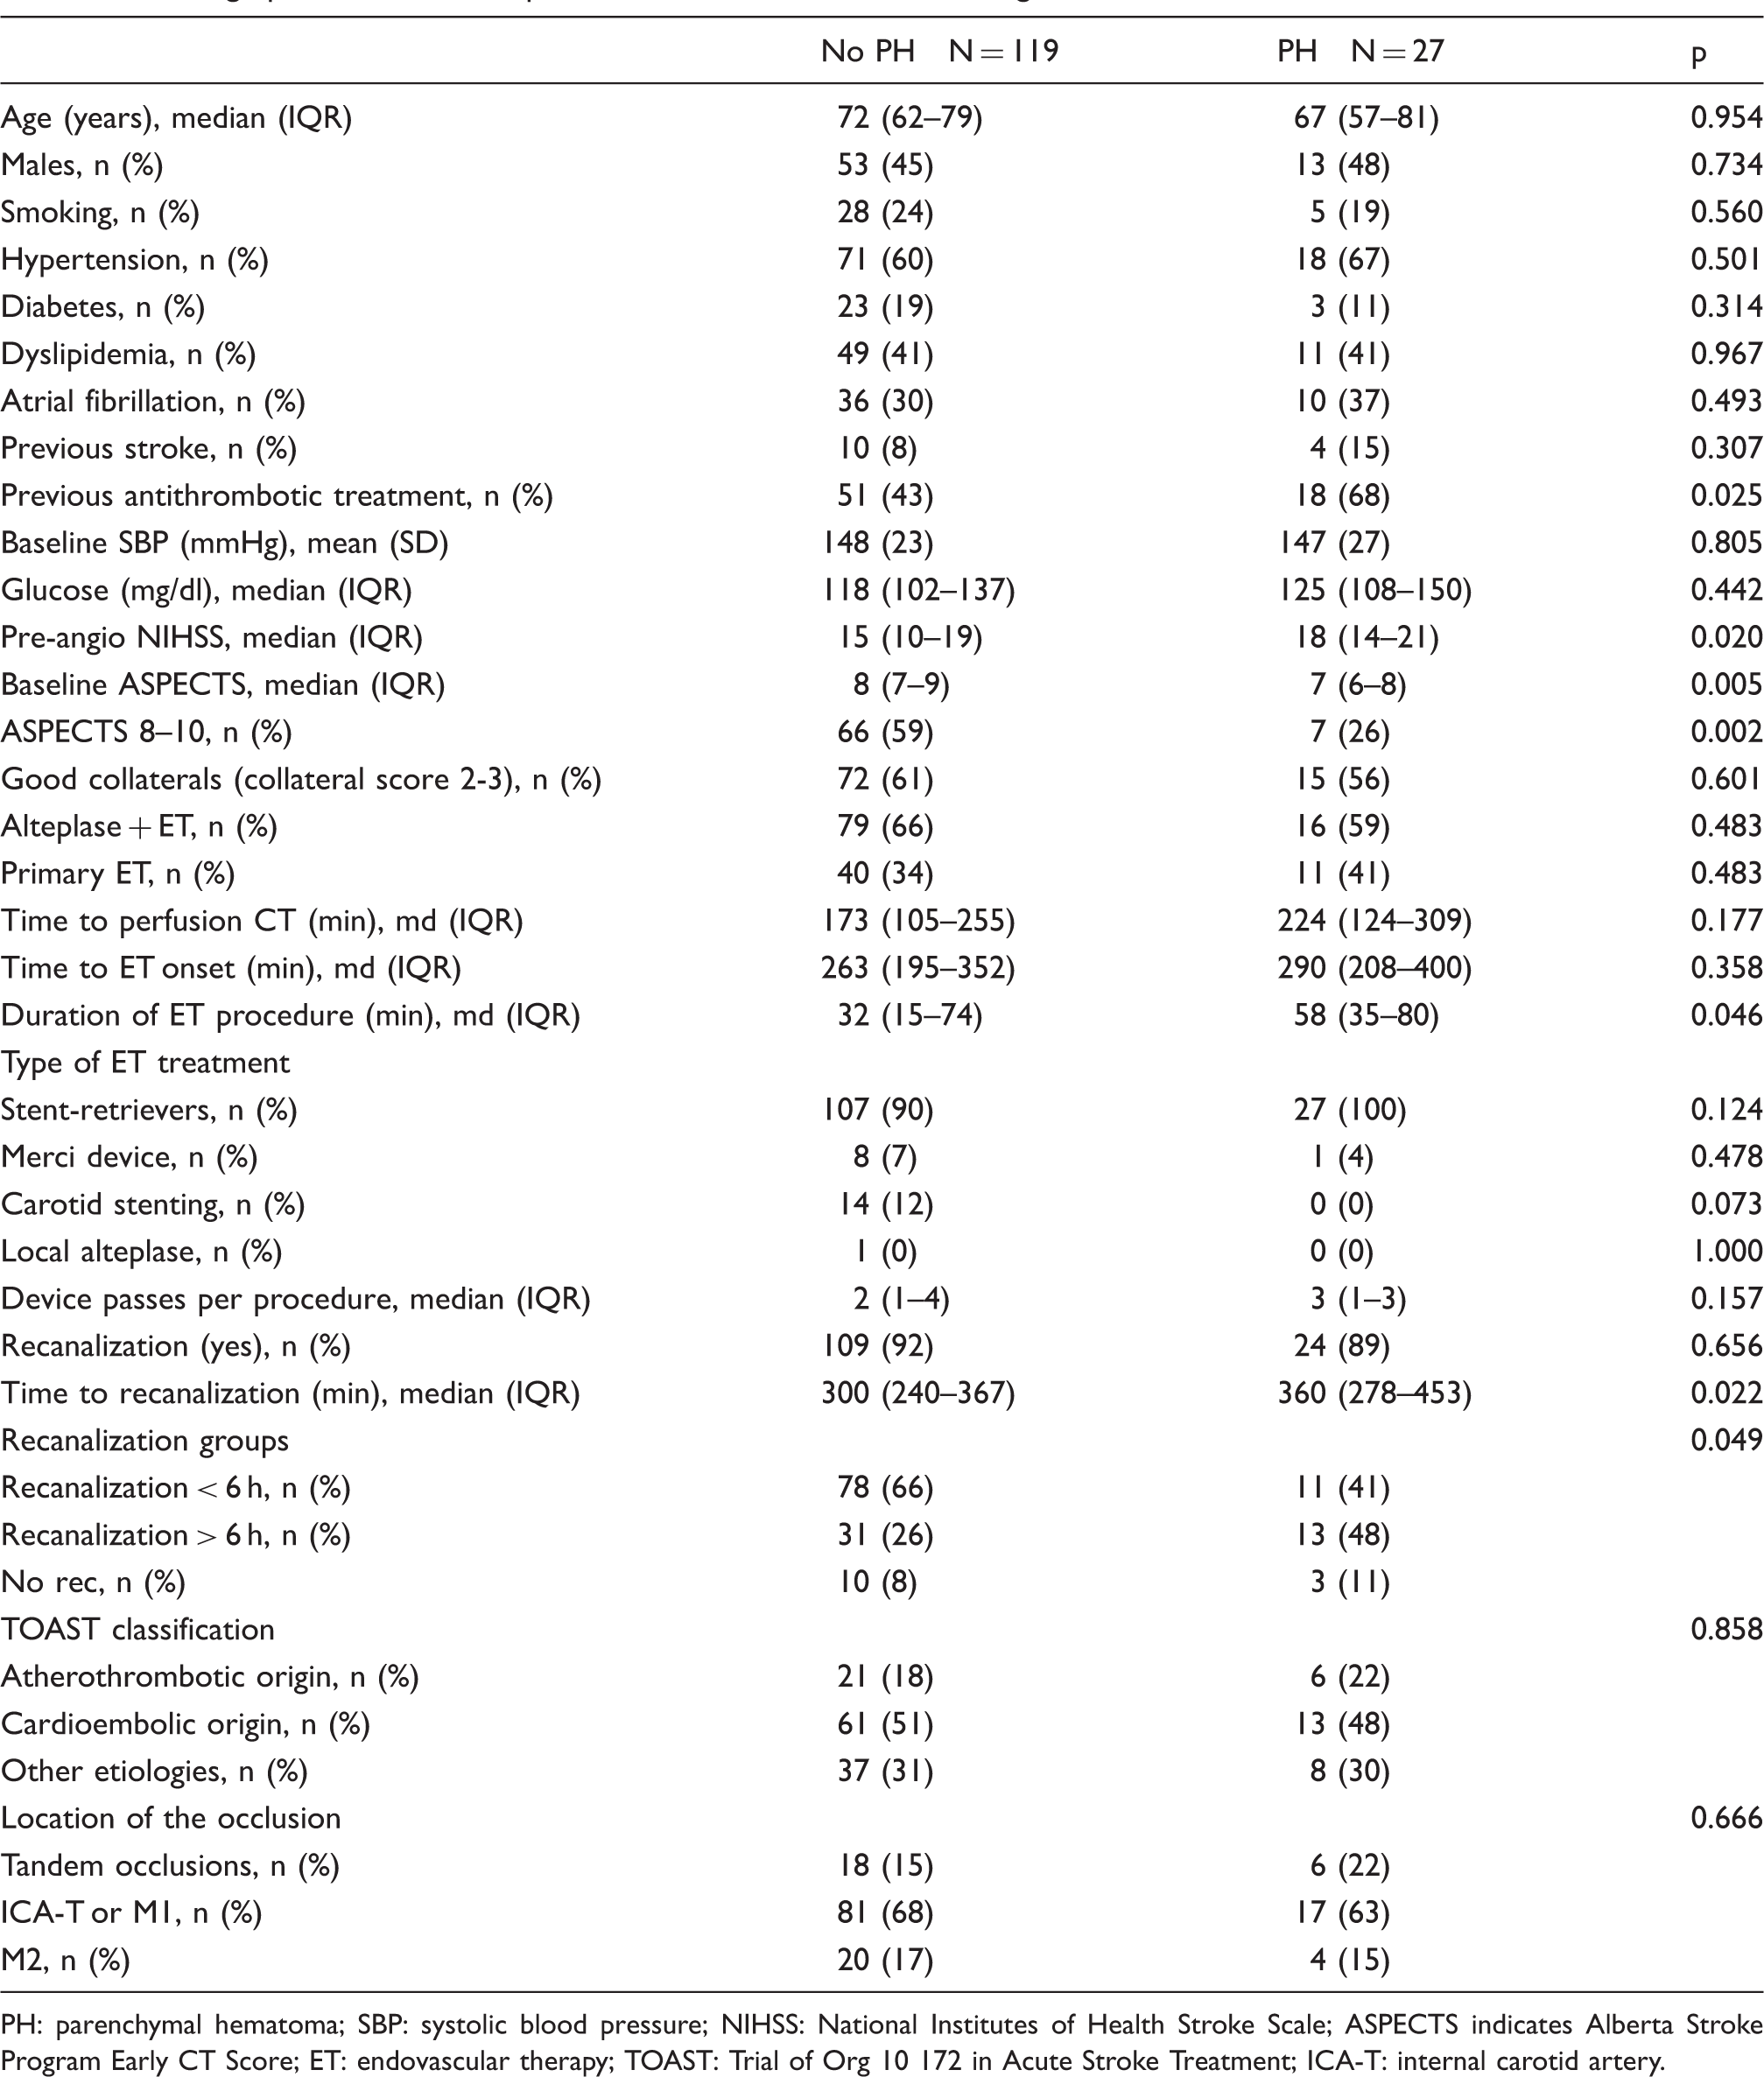
PH: parenchymal hematoma; SBP: systolic blood pressure; NIHSS: National Institutes of Health Stroke Scale; ASPECTS indicates Alberta Stroke Program Early CT Score; ET: endovascular therapy; TOAST: Trial of Org 10 172 in Acute Stroke Treatment; ICA-T: internal carotid artery.
Perfusion parameters and risk of PH: ROC and regression analysis
Regression analysis.
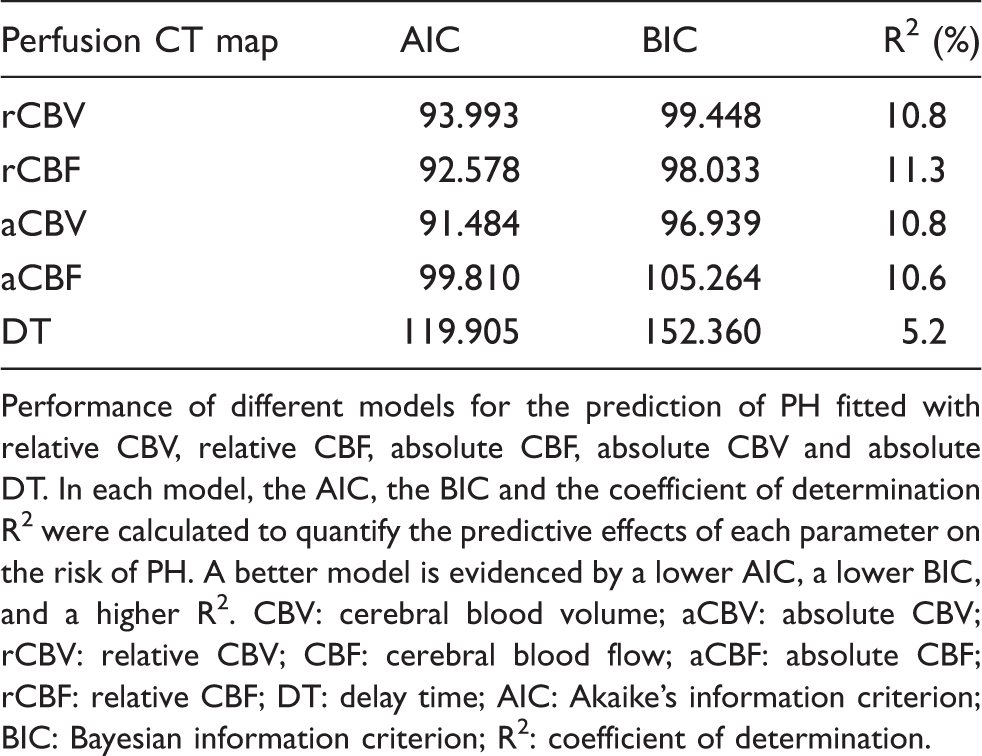
Performance of different models for the prediction of PH fitted with relative CBV, relative CBF, absolute CBF, absolute CBV and absolute DT. In each model, the AIC, the BIC and the coefficient of determination R2 were calculated to quantify the predictive effects of each parameter on the risk of PH. A better model is evidenced by a lower AIC, a lower BIC, and a higher R2. CBV: cerebral blood volume; aCBV: absolute CBV; rCBV: relative CBV; CBF: cerebral blood flow; aCBF: absolute CBF; rCBF: relative CBF; DT: delay time; AIC: Akaike’s information criterion; BIC: Bayesian information criterion; R2: coefficient of determination.
ROC analysis: best thresholds and volumetric cut-off points for the prediction of PH within each perfusion CT map.
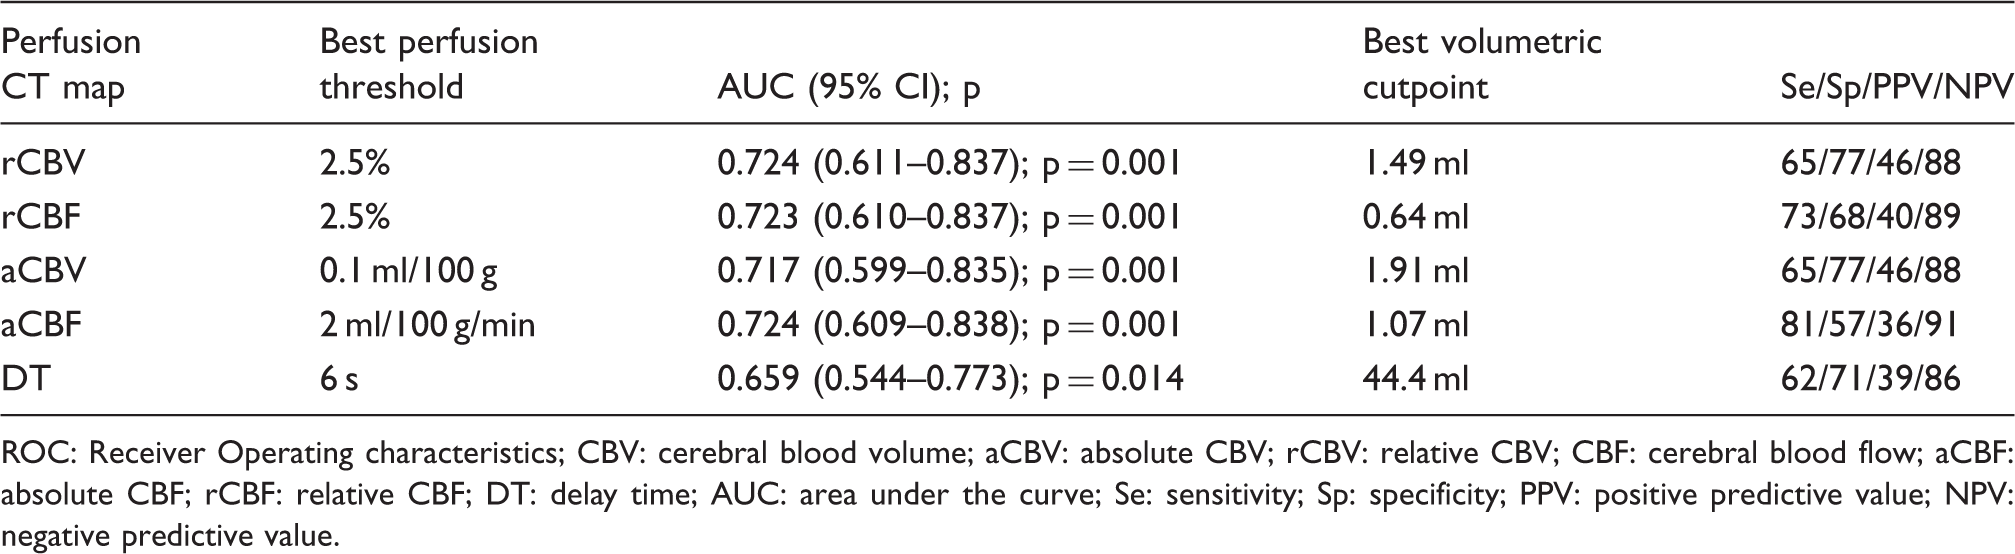
ROC: Receiver Operating characteristics; CBV: cerebral blood volume; aCBV: absolute CBV; rCBV: relative CBV; CBF: cerebral blood flow; aCBF: absolute CBF; rCBF: relative CBF; DT: delay time; AUC: area under the curve; Se: sensitivity; Sp: specificity; PPV: positive predictive value; NPV: negative predictive value.
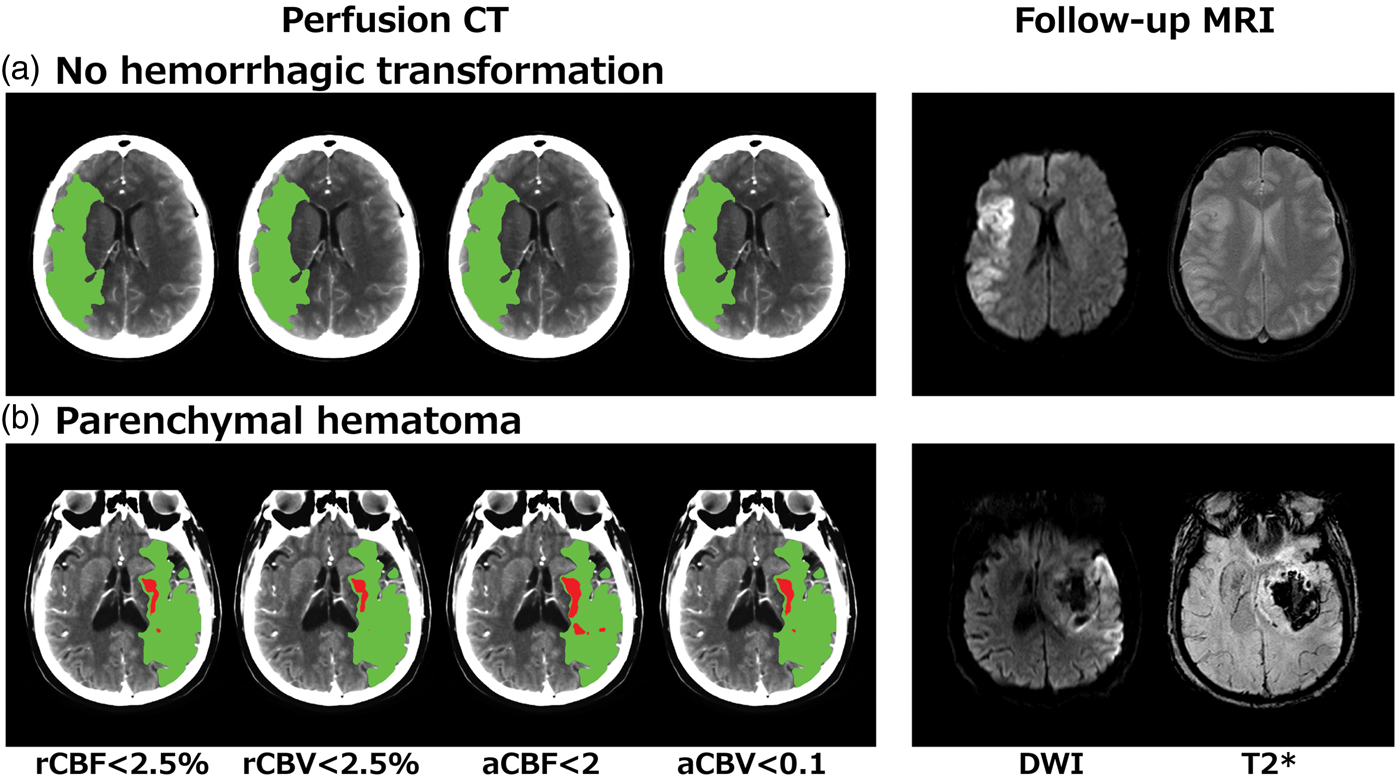
Illustrative cases showing regions of severe ischemia (red areas) assessed with the best identified thresholds on each perfusion map, in relation with hypoperfused tissue (green areas) and follow up MRI. (
A total of 83 (57%) patients had non-truncated curves, and 14 (17%) of them had PH at follow-up. In this subset of patients, a sensitivity analysis showed that the optimal thresholds obtained with ROC analyses were perfusion values lower than 2.5% of normal brain in the contralateral hemisphere for relative CBV [Area Under the Curve (AUC) 0.622, 95%CI 0.458–0.787] and CBF (AUC 0.627, 95%CI 0.462–0.791) parameters, and the best absolute thresholds were 0.1 ml/100 g for CBV (AUC 0.628, 95%CI 0.462–0.794) and 2 ml/100 g/min for CBF (AUC 0.623, 95%CI 0.455–0.791), as in the whole study sample. The best perfusion threshold for DT was 8 s (AUC 0.600, 95%CI 0.428–0.773).
Perfusion parameters and risk of PH: perfusion CT-MRI coregistered regions of interest analysis
A perfusion CT-MRI coregistered regions of interest analysis was performed including those patients with PH who had baseline perfusion CT and follow-up MR imaging (n = 19 of 27). In this subgroup of patients we explored the baseline perfusion CT values of brain regions that at follow up MRI were classified as infarcted tissue without hemorrhagic transformation, tissue with hemorrhagic transformation, and non-infarcted contralateral tissue. As shown in Figure 2, infarct regions that developed PH at follow-up showed lower values of CBV and CBF, but similar values of DT at baseline, compared with infarct regions that did not develope PH. As expected, normal tissue had higher CBV and CBF values, and shorter DT values than finally infarcted tissue (either with or without hemorrhagic transformation).
Differences in pre-treatment baseline perfusion values between regions classified as non-infarcted tissue (normal tissue, NT), infarcted tissue (DWI regions, yellow label), and tissue with hemorrhagic transformation (PH regions, red label) in follow-up MRI of patients who developed parenchymal hematomas (PH) (n = 19). (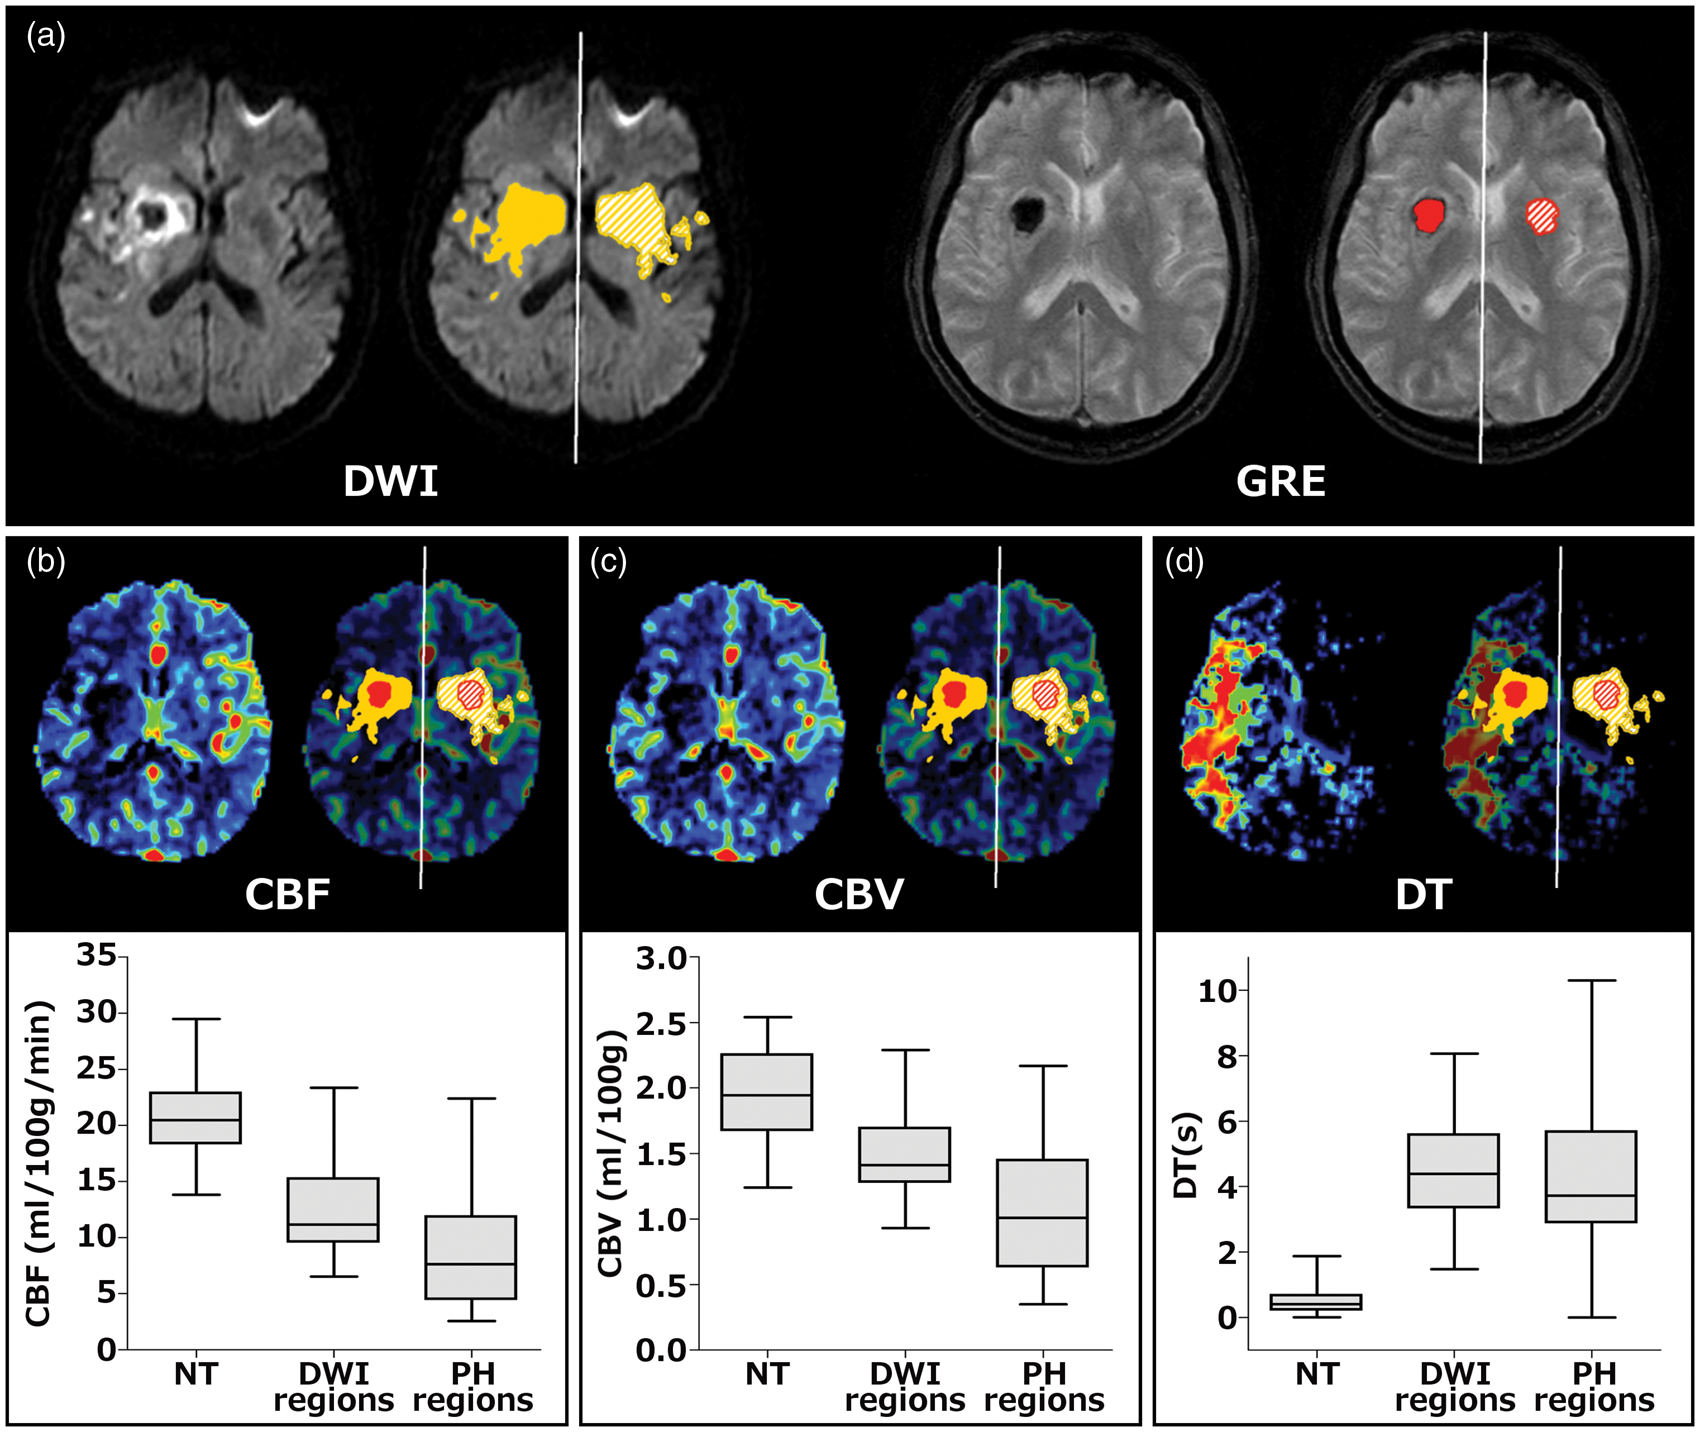
Time to recanalization from stroke onset and risk of PH
From the 146 included patients, a total of 133 (91%) recanalized at the end of ET, and 13 (9%) did not recanalize. Early recanalization (<6 h from stroke onset) was observed in 89 (61%) patients, and delayed recanalization (>6 h) in 44 (30%). In reference to patients with early recanalization, the rate of PH was significantly higher in patients with delayed recanalization (OR 2.97, 95%CI 1.20–7.35; p = 0.018), but not in those without recanalization (OR 2.12, 95%CI 0.51–8.95; p = 0.303). In models adjusted for baseline stroke severity, the rate of poor outcome was increased in patients with delayed recanalization (OR 2.45, 95%CI 1.10–5.44; p = 0.028) and in those without recanalization (OR 6.66, 95%CI 1.57–28.22; p = 0.010), in reference to patients achieving early recanalization. In the subset of patients with recanalization, longer onset to reperfusion times (OTR) were associated with a gradually increased risk of poor outcome (OR 1.15 per each decile of OTR increase, 95%CI 1.03–1.30; p = 0.025) and with an increased risk of PH (OR 1.22 per each decile of OTR increase, 95%CI 1.03–1.44; p = 0.023).
Multivariate models for the prediction of PH
Relative CBF and CBV parameters instead of absolute values were used for multivariate analyses. As shown in Figure 3, the volume of regions with low relative CBV and/or CBF was associated with an increased risk of PH and the associations remained significant in models adjusted for the effect of recanalization status at follow up, age, gender, baseline stroke severity, treatment modality and prior antithrombotic use. Delayed recanalization (>6 h), but not early recanalization (<6 h) or absence of recanalization, was also associated with an increased risk of PH. After excluding patients without recanalization (n = 13), the associations of low rCBV, low rCBF and OTR time with the risk of PH remained significant in unadjusted and adjusted models.
Models for prediction of parenchymal hematoma at follow-up neuroimaging.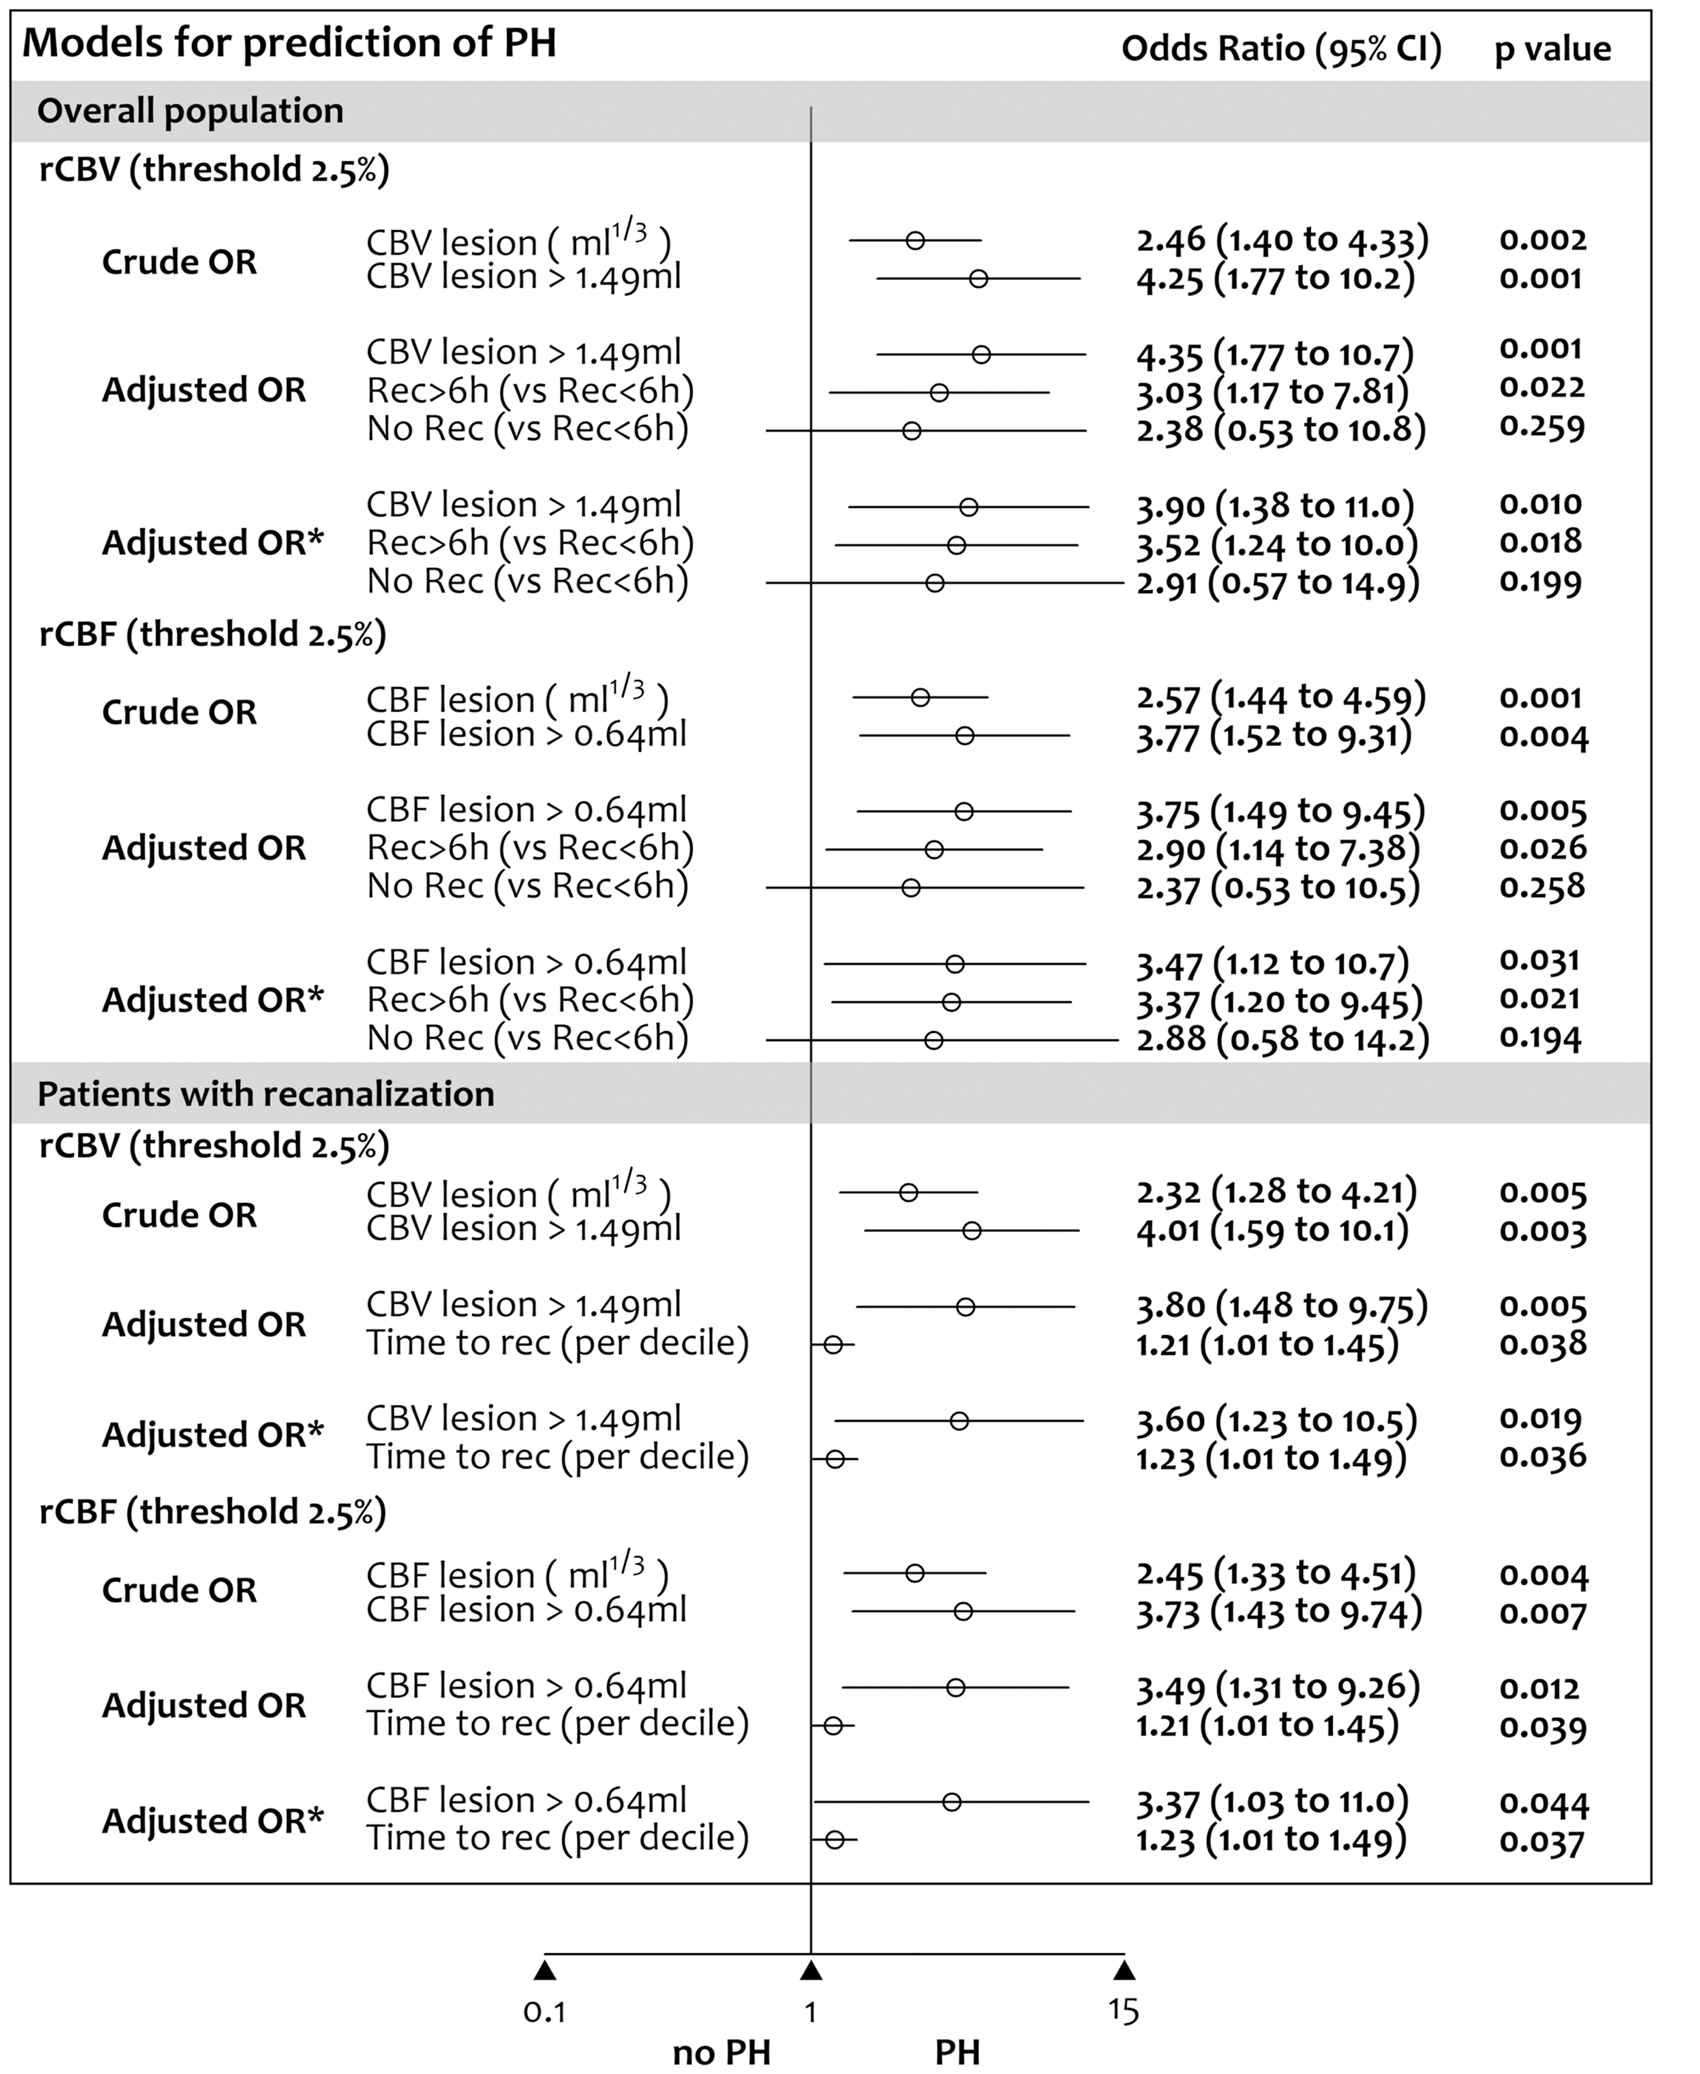
The interaction between recanalization status and the volume of regions with low rCBV (p = 0.294) or low rCBF (p = 0.479) was not significant. Moreover, in patients with recanalization at the end of ET, the interaction between OTR time and the volume of regions with low rCBV (p = 0.286) or low rCBF (p = 0.456) was neither significant. Finally, there was no significant association between the volume of regions with low CBV and/or CBF values in regression analyses restricted to symptomatic PH (data not shown).
Discussion
In this threshold-finding study we implemented a comprehensive analytic approach of whole-brain perfusion CT data to identify the best hemodynamic parameters for prediction of PH after ET in a homogeneous cohort of patients with proximal occlusions in the carotid territory. The present study demonstrated a consistent association between regions with severe reductions of relative CBV and/or CBF and an increased risk of PH. The study also suggested that delayed recanalization may also be associated with hemorrhagic complications, in contrast with earlier recanalization or permanent arterial occlusion. Collectively, these results highlighted the relevance of the severity and duration of ischemia as drivers of blood-brain barrier (BBB) disruption in acute ischemic stroke, and supported the role of perfusion CT in the prediction of the risk of PH after ET.
Experimental cerebral ischemia impairs vascular integrity and results in the loss of microvascular structures and erythrocyte extravasation,23,24 in a process which is dependent on the intensity and duration of the lack of flow. 25 In human stroke, blood flow can be reliably quantified with dynamic contrast-enhanced neuroimaging, such as perfusion CT. 21 In this perfusion CT based study, CBV and CBF derived thresholds were more informative of the risk of PH than those extracted from DT maps. The best CBV or CBF thresholds for predicting the development of PH were values lower than 2.5% of mean CBF and CBV values in normal brain. These results contrast with a previous threshold-finding study where the optimal observed perfusion CT derived parameters and thresholds were a Tmax > 14 s, a rCBF lower than 30% and a rCBV lower than 35% of normal brain tissue. 12 Beyond the differences in perfusion CT acquisition and post-processing protocols that were used in these studies, herein we included a highly homogeneous stroke population treated with endovascular reperfusion therapy. This selected population contrast with the former study in which only half of the patients received systemic thrombolysis thus precluding the high rate of early reperfusion encountered in our study. In concordance with previous MRI derived data, 7 the thresholds identified in this perfusion CT study did better than the total volumes of non-viable tissue, total hypoperfused tissue or tissue at risk, as defined with validated thresholds. Overall, these data may indicate that the amount of tissue with an extreme reduction of perfusion would be the most relevant hemodynamic parameter for promoting early BBB damage, particularly when multimodal reperfusion therapy is administered to achieve early recanalization. Nevertheless, further studies are warranted to assess the effect of the severity of hypoperfusion in acute stroke patients according to the occurrence of early reperfusion or to the administration of different reperfusion strategies.
The aim of recanalization therapies is to achieve an early reperfusion of the ischemic tissue to prevent brain infarction. However, the reperfusion of a severely ischemic tissue may lead to harmful consequences, which include brain edema, hemorrhagic complications or a combination of them. This deleterious process is called reperfusion injury and implies a myriad of mechanisms such as oxidative stress, inflammation and activation of proteolytic enzymes that finally involve the disruption of the BBB. 26 In the experimental setting, the duration of ischemia prior to reperfusion is strongly related to the risk of hemorrhagic complications. 27 Postischemic reperfusion can impair vascular function and exacerbate ischemic injury after longer durations of ischemia and reperfusion. 28 In experimental models of thromboembolic middle cerebral artery occlusion in rats the duration of brain ischemia prior to reperfusion parallels an increased risk and severity of hemorrhagic transformation. Thus, after 6 h of occlusion the risk of PH was significantly increased in comparison with shorter occlusion times (3 h) or permanent occlusion. 29 Accordingly, in humans with cardioembolic stroke, recanalization occurring beyond 6 h is associated with an increased risk of hemorrhagic transformation. 30 Moreover, a longer time from stroke onset to the administration of recanalization therapies is associated with the presence of permeability derangements on post-treatment dynamic contrast-enhanced multimodal MRI, 31 a reliable predictor of hemorrhagic complications in acute stroke. 32 In agreement with these clinical and experimental data, we found that the risk of PH was increased in patients with delayed recanalization (over 6 h of stroke onset). Moreover, even in patients achieving early recanalization at the end of ET, we also found a significant association between the time delay to recanalization and the risk of PH. Reassuringly, this association was maintained in models adjusted by the effect of relevant confounders. However, the limited number of events in patients with delayed or absence of recanalization precludes the generalizability of this association and calls for the implementation of further adequately powered prospective studies. Overall, the data further support that reperfusion may be more deleterious for the integrity of the BBB in patients with longer duration of ischemia. There remains to be shown in clinical trials whether this potential pernicious effect of delayed reperfusion may be ameliorated with neuroprotective or vasculoprotective therapies. According to our data, patients with regions of severe ischemia and longer expected delays from stroke onset to recanalization may represent a target population for these therapies. Importantly, it is essential to remark that this study was not designed to assess the role of perfusion CT in the selection of patients for endovascular reperfusion therapies. Given the strong beneficial effects in terms of clinical outcome of endovascular reperfusion therapies recently shown in clinical trials, the presence of regions of severe reductions of CBF or CBV in perfusion CT should not preclude the treatment of patients otherwise eligible for receiving endovascular reperfusion therapies.
The low positive predictive value and high negative predictive value of the best performing thresholds indicate that severe ischemia may be a necessary but not sufficient mediator for PH. Previous MRI-based clinical studies showed that delayed reperfusion of regions with severe reductions of CBV was strongly associated with PH in patients receiving systemic thrombolysis.8,33 Others showed that early reperfusion had no influence on the risk of PH in acute stroke patients treated or not with thrombolysis. 9 In agreement with the latter study, we did not find a significant interaction between perfusion CT markers of severe ischemia and timing of recanalization in the prediction of PH although the lack of this relationship may be related to an underpowered sample size. Whether reperfusion driven by ET would be more deleterious in patients with larger areas of very severe ischemic deficits should be assessed in further studies.
For this analysis we evaluated the incidence of PH in follow-up neuroimaging explorations performed within the first 72 h of therapy to gather a sufficient number of events to be analyzed. The use of this time point may partly explain why in this cohort of patients PH rates were higher than that reported in recent studies of ET. Likewise, MR imaging including gradient-recall echo sequence is more sensitive and more reliable than CT for detecting hemorrhagic transformation in the acute phase of ischemic stroke. 34 In this study, hemorrhagic transformation was evaluated in gradient-recall echo MRI in 19 (70%) and in CT in 8 (30%) of the patients who developed PH. Of note, the rate of PH at the first neuroimaging after ET (within 24 h; n = 14, 9.6%) and the rate of symptomatic PHs (n = 7, 4.8%) were similar to those reported in the literature.35–37 We did not find a significant association between the volume of regions with low CBV and/or CBF values in regression analyses restricted to symptomatic hemorrhagic transformation, although this study was not powered to analyse their association with perfusion measures due to the low number of symptomatic PHs. Additional studies should be performed to determine the association of these biomarkers with clinically relevant hemorragic transformation after ischemic stroke.
The use of whole-brain perfusion CT was a strong point of the study as it allowed obtaining perfusion measures of most of the affected brain tissue. The inclusion of patients treated with ET also allowed an accurate estimation of times from stroke onset to recanalization. Moreover, patients were collected consecutively and managed following a homogeneous therapeutic protocol. Nonetheless, the study has several limitations. First, the assessment of perfusion with dynamic CT in acute stroke is a static evaluation of a multifaceted and time-dependent process. Secondly, perfusion measures may be affected by multiple factors, including the acquisition protocols, the brain coverage and the post-processing platforms. 38 Regarding the acquisition protocols, a limited acquisition time (<60 s) may result in a delayed arrival of contrast agent with a consequent truncation of tissue TACs that may preclude accurate calculation of perfusion CT parameters with a shift towards overestimation of perfusion deficits. To minimize the effect of delayed bolus arrival due to the relatively short scan acquisition time used in this study, perfusion CT maps were calculated using a validated deconvolution algorithm with delay and dispersion correction.21,39 These delay-insensitive algorithms have been shown to be more reliable and accurate for measuring hypoperfused and non viable tissue volumes than delay-sensitive software. 39 Moreover, the consistency of the thresholds found in the whole population was confirmed in a sensitivity subgroup analysis that included only those patients without truncated TACs. As a note of caution, the parameter thresholds obtained in this study may depend on the post-processing platform and the acquisition protocols that were employed and may not be generalizable to other methodologies. Additionally, we were not able to obtain direct measures of the permeability of the blood-brain barrier due to the short perfusion CT acquisition protocol. Indeed, the quantification of the passage of contrast agents from the vascular compartment to the brain across the vascular endothelium as a marker of BBB derangement is overestimated when first-pass perfusion CT data is used, and delayed acquisitions (up to 210 s) are necessary to obtain unbiased measures. Furthermore, it will be of potential interest to evaluate the relationship between very severe reductions of CBF/CBV and direct measurements of BBB damage, as those obtained by means of the quantification of BBB permeability using dynamic contrast-enhanced MRI or adequately extended perfusion CT acquisitions. As an additional limitation, the post-processing software (Siemens) used for the real-time selection of patients for receiving endovascular reperfusion therapy was different from the post-processing software (MIStar) used to execute the comprehensive analysis of perfusion maps. Finally, we considered the recanalization status at the end of ET as a surrogate measure of reperfusion, although these two phenomena may not always occur simultaneously. 40
In summary, this study shows that the identification of severe perfusion deficits evaluated with perfusion CT is predictive of the risk of hemorrhagic complications after endovascular reperfusion therapy of acute ischemic stroke. Moreover, delayed recanalization seems to be associated with an increased risk of parenchymal hemorrhage after thrombectomy. These two factors should be considered in the evaluation of strategies aimed to protect the blood-brain barrier in addition to early and complete recanalization in this patient population. Nevertheless, the presence of regions of severe reductions of CBF or CBV in perfusion CT should not preclude the treatment of patients otherwise eligible for receiving endovascular reperfusion therapies.
Footnotes
Funding
The author(s) disclosed receipt of the following financial support for the research, authorship, and/or publication of this article: This work was supported by a grant from the Spanish Ministry of Economy and Competitiveness (PI13/01268, funded as part of the Plan Nacional R + D + I and cofinanced by ISCIII-Subdirección General de Evaluación and by the FEDER).
Declaration of conflicting interests
The author(s) declared no potential conflicts of interest with respect to the research, authorship, and/or publication of this article.
Authors’ contributions
AR and CL contributed equally to this work. AR and CL obtained the clinical data, performed the post-processing of the perfusion maps and wrote the first draft of the manuscript. RT, ALR and LO supervised the post-processing of perfusion maps and the image analysis. XU and LLl obtained the clinical data. SA and AC designed the study, interpreted the data and wrote the final draft of the manuscript.