
Abstract
There is increasing evidence that erythropoietin (Epo) has a protective function in cerebral ischemia. When used for treatment, high Epo plasma levels associated with increases in blood viscosity, however, may counteract beneficial effects of Epo in brain ischemia. The authors generated two transgenic mouse lines that overexpress human Epo preferentially, but not exclusively, in neuronal cells. In mouse line tg21, a fourfold increase of Epo protein level was found in brain only, whereas line tg6 showed a dramatic increase of cerebral and systemic transgene expression resulting in hematocrit levels of 80%. Cerebral blood flow (CBF), as determined by bolus tracking magnetic resonance imaging, was not altered in the tg6 line. The time-to-peak interval for the tracer, however, increased approximately threefold in polyglobulic tg6 mice. Immunohistochemical analysis revealed an increase in dilated vessels in tg6 mice, providing an explanation for unaltered CBF in polyglobulic animals. Permanent occlusion of the middle cerebral artery (pMCAO) led to similar perfusion deficits in wild-type, tg6, and tg21 mice. Compared with wild-type controls, infarct volumes were not significantly smaller (22%) in tg21 animals 24 hours after pMCAO, but were 49% enlarged (P < 0.05) in polyglobulic tg6 mice. In the latter animals, elevated numbers of Mac-1 immunoreactive cells in infarcted tissue suggested that leukocyte infiltration contributed to enlarged infarct volume. The current results indicate that moderately increased brain levels of Epo in tg21 transgenic mice were not sufficient to provide significant tissue protection after pMCAO. The results with tg6 mice indicate that systemic chronic treatment with Epo associated with elevated hematocrit might deteriorate outcome after stroke either because of the elevated hematocrit or other chronic effects.
In response to hypoxia, the adult kidney increases synthesis of the hematopoietic growth factor erythropoietin (Epo) (Jelkmann, 1992). In turn, elevated Epo plasma levels lead to increased red blood cell mass. The authors and others have shown that Epo may also have direct functions in the nervous system. Epo mRNA has been found in murine, rat, monkey, and human brain (Marti et al., 1996; Bernaudin et al., 1999). Binding sites for Epo have been demonstrated in the mouse brain (Digicaylioglu et al., 1995) and Epo-receptor expression has been described previously (Bernaudin et al., 1999; Morishita et al., 1997). The primary source of Epo in the brain appears to be astrocytes (Marti et al., 1996; Masuda et al., 1994), although neurons also have been reported to express Epo (Bernaudin et al., 2000). The Epo receptor appears to be mainly located on neurons (Morishita et al., 1997). Epo may stimulate neuronal function and viability through activation of Ca2+ channels in vitro (Assandri et al., 1999) and in vivo (Koshimura et al., 1999). Supporting this hypothesis, Epo has been shown to protect primary cultured neurons from N-methyl-d-aspartate receptor–mediated glutamate toxicity (Morishita et al., 1997. Several recent studies also have provided evidence for a protective role of Epo in brain ischemia (Marti et al., 2000). Delayed neuronal death in the hippocampus after transient forebrain ischemia in the mongolian gerbil was ameliorated when intraventricular infusion of Epo was initiated 8 hours before ischemia (Sakanaka et al., 1998). Moreover, a significant reduction of infarct volume was obtained in rat and mice after permanent focal cerebral ischemia (Bernaudin et al., 1999; Brines et al., 2000; Sadamoto et al., 1998). Consequently, a therapeutic use of Epo in brain ischemia and other neurodegenerative diseases has been proposed. As a potential limitation for the treatment of brain ischemia, it has to be considered that Epo, when present in the blood stream, can result in a dramatic increase of blood hematocrit and, thus, blood viscosity. This increase in viscosity may have detrimental effects in brain ischemia.
To investigate the potential risk of an Epo treatment, the authors used two Epo-overexpressing transgenic mouse lines. Expression of human Epo cDNA was driven by the human platelet-derived growth factor (PDGF) B-chain promoter that preferentially directs transgene expression to neuronal cells (Sasahara et al., 1991), the most prominent example being amyloid precursor protein overexpressing mice (Games et al., 1995). Transgene expression, although to a smaller degree, also can be found in heart and lung tissue. Indeed, in one line (tg6), in addition to brain expression serum Epo levels were increased approximately 12-fold, which in turn doubled the hematocrit value to approximately 80% (Ruschitzka et al., 2000; Wagner et al., 2001). Interestingly, increased red blood cell counts (polyglobulia) in these mice did not lead to cardiovascular dysfunction or thromboembolic complications. In a second mouse line (tg21), expression was confined to brain cells with normal serum levels of Epo and, thus, normal blood hematocrit levels (42%). The authors subjected these two mouse lines to a permanent occlusion of the middle cerebral artery (pMCAO) to explore the involvement of Epo and Epo-increased blood viscosity in the pathophysiology of focal brain ischemia.
MATERIALS AND METHODS
Animals and general characterization
Epo-overexpressing transgenic mice were generated as described previously (Ruschitzka et al., 2000). Briefly, full-length human Epo cDNA driven by the PDGF B-chain promoter was microinjected into the pronuclei of fertilized oocytes derived from B6C3 hybrid mice. One resulting transgenic mouse line TgN(PDGFBEPO)321ZbZ (tg6) showed increased Epo levels in plasma and brain as determined by radioimmunoassay (Wenger et al., 1998). This polyglobulic line was bred by mating hemizygous males to wild-type females. Half of the offspring was hemizygous for the transgene, whereas the other half was wild type and thus used as control animals. The second transgenic mouse line termed TgN(PDGFBEPO)322ZbZ (tg21) was bred to homozygosity. All procedures and experimental protocols were performed in accordance with the Swiss animal protection laws.
Induction of cerebral ischemia
For all experiments, 3-to 6-month-old male transgenic animals (weighing 20 to 30 g) were used. Their nontransgenic littermates were used as controls. Before and after surgery, animals were housed under standard condition with free access to mouse chow and tap water. Irreversible occlusion of the left MCA was performed as described previously (Wiessner et al., 1999). Briefly, animals were anesthetized with 2% isoflurane in a 70%/30% (volume) nitrous oxide/oxygen mixture, and the right MCA was exposed by subtemporal craniectomy using an operating microscope (Wild AG, Heerbrugg, Switzerland). The artery then was occluded by bipolar electrocoagulation. Afterwards, retracted soft tissue was replaced, wounds were sutured, anesthesia was discontinued, and mice were returned to their cages. Body temperature was maintained at 37°C during surgery and until 2 hours after animals regained consciousness. Then animals were returned to their home cages and allowed free access to food and water. In wild-type (n = 19) and tg21 (n = 9) animals, no mortality was observed after pMCAO, whereas in the tg6 group (n = 16) 3 animals died during the night after surgery.
Bolus tracking perfusion magnetic resonance imaging
Five animals from each group were randomly selected and subjected to perfusion-weighted magnetic resonance imaging (MRI). Magnetic resonance imaging experiments were performed on a 4.7 Tesla 30-cm bore Spectrospin DBX (Bruker, Karlsruhe, FRG) equipped with a 20-cm self-shielded gradient system. A homebuilt “Alderman-Grant” type of resonator (Aldermann and Grant, 1979) with a 20-mm inner diameter was used previously. A T2*-weighted snapshot pulse sequence (Haase, 1990) with repetition time = 5.6 milliseconds and echo time = 6.0 milliseconds has been applied, the pulse angle being set to 15°. The field of view was 22 × 22 mm2, and the matrix size was 128 × 32. A transverse slice (1.5-mm thick) 4 mm posterior to the rhinal fissure was recorded in 499 milliseconds. In a bolus tracking perfusion experiment (Belliveau et al., 1990; Rudin et al., 1997), 40 (wild type, tg21) or 64 (tg6) consecutive images were acquired and 50 μL ENDOREM® (Laboratoire Guerbet, Aulnay-sous-Bois, France) was infused into the femoral vein after the tenth image during 2 seconds. The infusion pump was controlled by the imaging pulse program sequence.
Computation of magnetic resonance parameter images and image analysis
The time-to-peak—that is, delay between the beginning of the tracer infusion and the peak of its first brain passage—was read from nonischemic tissue. The time course of the signal intensity during the bolus fist passage was fitted for each pixel using the γ-variate function and by applying a least squares fitting procedure by means of the software package IDL (Research Systems, Boulder, CO, U.S.A.). Parameter images were computed displaying cerebral blood volume (CBV ∝ time integral of the γ-variate function), mean transit time (MTT = first moment of the tracer transport function), or relative cerebral blood flow (CBF = CBV/MTT).
Parameter images were used for image analysis using image analysis software Analyze (Biomedical Imaging Resource, Mayo Foundation, Rochester, MN, U.S.A.). Ischemic tissue was segmented in CBF images by applying a threshold value approximately 50% of the normal value on the contralateral side. Ischemic area was expressed as percentage area of the ipsilateral hemisphere. Unaffected cerebral blood volume and flow values were the calculated means from the nonischemic tissue.
Determination of infarct volume
Infarct volume was determined 24 hours after MCA occlusion by means of quantitative in vivo MRI. Measurements were performed as described in detail elsewhere (Wiessner et al., 1999). Briefly, the mouse was anesthetized with 1% to 1.5% isoflurane delivered through a facemask and was positioned with its head in a 20-mm resonator. Each animal then was subjected to one imaging cycle, in which 13 contiguous T2-weighted coronal slices of the brain (1.0-mm-thick) were taken using a RARE sequence (optimized parameters: repetition time = 3000 milliseconds; effective echo time = 86 milliseconds; spatial resolution in plane = 86 × 86 μm2). The total measuring time was 5 minutes. Quantitative morphometrical evaluation of single MRI slices was performed using a semiautomatic image analysis software (Analyze, Mayo Clinic, BIR, Rochester, MN, U.S.A.) on a Silicon Graphics O2 computer. The damaged tissue was segmented by setting an intensity threshold. Infarct volume was calculated based on the damaged area in each slice and the distance between slices. These volumes were corrected for brain swelling as described by Swanson et al. (1990) and were expressed in percent of the hemisphere.
Immunohistochemistry
Frozen brains were cut into 10-μm thin sections on a cryostat (Leica, Nussloch, Germany) and thaw-mounted on glass slides (Superfrost+). For complement type-3 receptor (Mac-1, Cd11b) staining a previously described protocol was used (Rupalla et al., 1998). Briefly, sections were fixed for 15 minutes in ice-cold 4% paraformaldehyde. Sections were subsequently incubated at room temperature (RT) for 30 minutes in 0.3% H2O2 (in phosphate-buffered saline (PBS)), 3 × 5 minutes in PBS, 30 minutes at RT in 0.1% bovine serum albumin (BSA)/0.5% rabbit serum (in PBS), 3 hours at RT in 0.1% BSA/primary antibody (1:1000 rat anti mouse CD11b, Serotec, clone No. 5C6). Bound antibody was visualized using a biotinylated secondary antibody (rabbit anti-rat, No. BA4001, Vector Laboratories), an avidin-biotin complex (Vector, Burlingame, CA, U.S.A.), and 3,3′-diaminobenzidine as chromogen. For vascular cell adhesion molecule-1 (VCAM-1) staining, a similar protocol was used except that for fixation cryosections were dried for 30 minutes at RT, incubated for 10 minutes at 0°C in acetone, dried again for 30 minutes at RT, and incubated in acetone for 5 minutes at RT. The primary antibody (Serotec rat anti mouse CD106) was used in a 1:40 dilution and applied for 1.5 hours at RT. For anti-CD31 (PECAM-1) staining, sections were fixed for 20 minutes at −20°C in acetone, followed by 30 minutes in methanol/1% H2O2 at 4°C, and washing in PBS/5% BSA. Primary antibody (rat anti-mouse CD31, Serotec MCA 1364, 1:300 in PBS/5% BSA) was applied overnight at 4°C. Thereafter, sections were washed 6 times in PBS/0.1% Triton-X100. Laminin staining was used as an additional endothelial marker as described previously (Jucker et al., 1992). A rabbit anti-human laminin antibody (Cat. No. AHP239; Serotec, Oxford, England) was applied in a 1:1000 dilution. The staining procedure was similar to that for Mac-1 (see above), except that goat serum was used for blocking, primary antibody incubation was performed overnight at 4°C, and a goat anti-rabbit antibody (1:200, BA1000, Vector Laboratories) was used as secondary antibody.
Statistics
Results are given as mean ± SD. Statistical comparisons between control and treatment groups were made using analysis of variance (Bonferroni, Tukey's, or Fisher's PLSD test). P < 0.05 was considered statistically significant. Calculations were made using a software package (SigmaStat; SPSS, Chicago, IL, U.S.A.) on an IBM personal computer.
RESULTS
Two different transgenic mouse lines overexpressing human Epo driven by the human PDGF B-chain promoter were subjected to pMCAO. Wild-type littermates were used as controls. In mice from line tg6, brain levels of Epo were elevated approximately 26-fold (39.3 ± 8 mU/mg protein, n = 5) as compared with control mice (1.52 ± 0.65 mU/mg protein). Notably, plasma levels of Epo were found to be elevated approximately 12-fold (Ruschitzka et al., 2000), which was accompanied by a doubled hematocrit value (82.5% ± 1.7% in tg6 vs. 42.4% ± 2.6% in wild type). Similarly, leukocyte number increased from 3.1 ± 1.6 × 10⁹/L (wild type) to 8.0 ± 2.4 × 10⁹/L (tg6). Unexpectedly, blood pressure, heart rate, and cardiac output were normal in these mice as described in detail elsewhere (Ruschitzka et al., 2000; Wagner et al., 2001). In contrast, Epo expression in the transgenic line tg21 was more restricted to neural tissue, thereby increasing Epo brain levels approximately 4-fold (6.56 ± 1.22 mU/mg protein, n = 5), but without changes in Epo plasma levels. These mice had a normal hematocrit and white blood cell count. Pathologic examination did not reveal any signs of thromboembolism in all organs tested in both tg21 and tg6 mice, including brain (Fig. 1A and 1B). As compared with wild-type mice, dilated veins on the brain surface were observed in tg6 mice (Fig. 1C and 1D). Eye inspection of the anatomy of intracranial arteries (circle of Willis, MCA) did not reveal obvious differences among the strains.
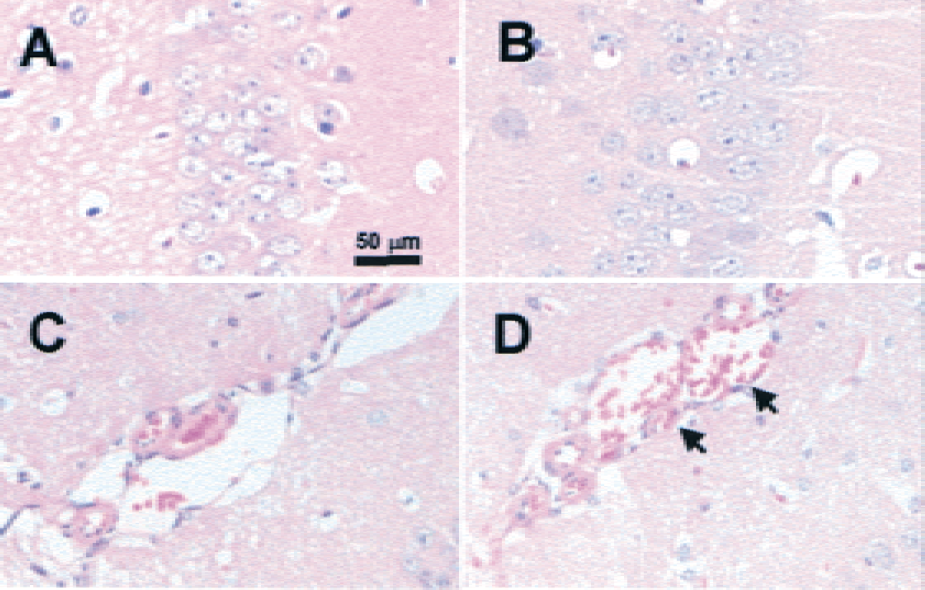
No signs of thromboembolic events in hematoxylin and eosin–stained coronal brain sections of Epo-overexpressing mice (tg6).
Bolus tracking perfusion MRI was used to characterize cerebral blood flow in all strains. This method allows a semiquantitative determination of relative CBV and CBF, and topographic assessment of the perfusion deficits. Moreover, altered blood viscosity can be compared among the different strains by determining the time-to-peak interval after tracer bolus injection or by the MTT of the bolus first passage. The highly elevated hematocrit in tg6 mice was associated with a large delay of the time-to-peak interval for the tracer bolus from approximately 3 seconds in wild-type animals to 8 seconds in tg6 animals (Fig. 2A), which was paralleled by an increase of the MTT from 4.6 ± 0.3 seconds in wild-type mice to 5.9 ± 0.3 seconds in tg6 mice (Fig. 2B). However, the time-to-peak interval (Fig. 2A) and the MTT in tg21 mice (4.4 ± 0.1 seconds;Fig. 2B) was not different from wild-type animals. Compared with control mice, CBV was approximately 35% and 20% larger in tg6 and tg21 mice, respectively (Fig. 2C), without reaching significance. Relative CBF was only marginally different from wild type in tg6 mice (Fig. 2D). In tg21 mice, however, it was significantly raised by approximately 36% as compared with the other strains (Fig. 2D).
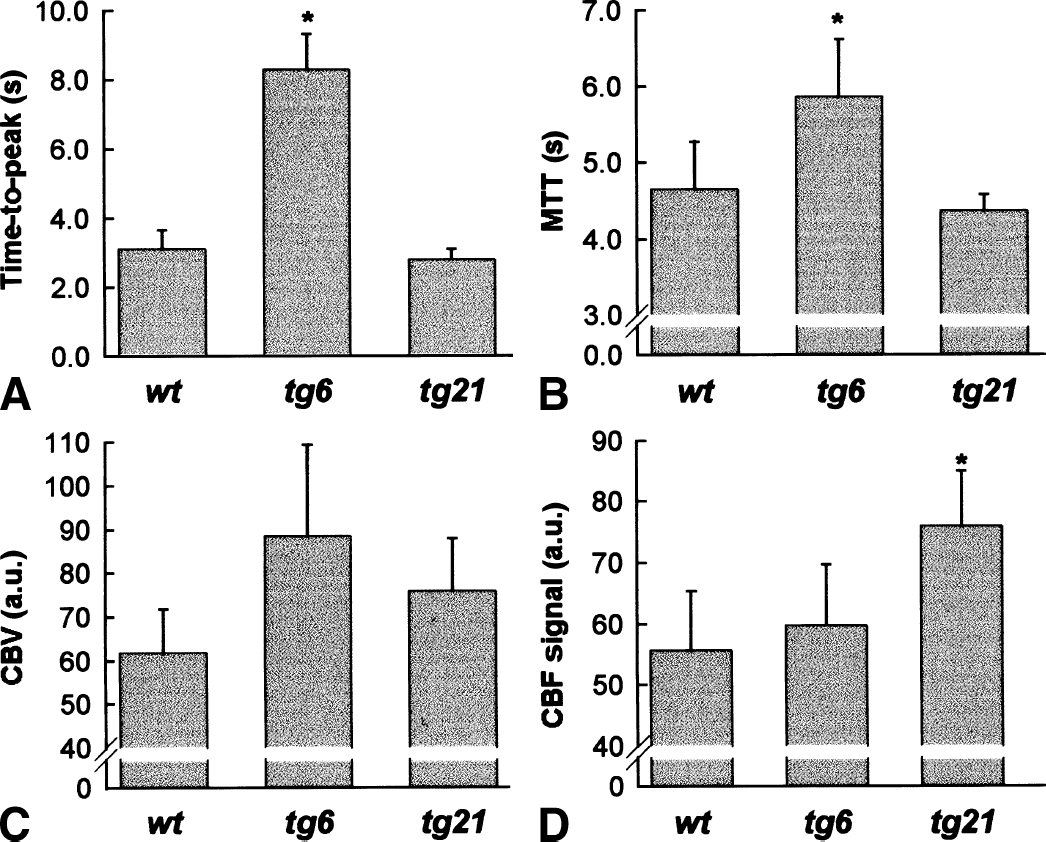
Bolus tracking magnetic resonance imaging revealed normal blood flow, whereas blood viscosity and blood volume were increased in tg6 mice and elevated CBF in tg21 mice.
Unaltered CBF values in tg6 mice (Fig. 2C) indicated a possible compensatory effect to the elevated blood viscosity in tg6 animals at the vascular level. To address this question, the authors stained coronal brain sections with antibodies derived against CD31 (PECAM-1) and laminin, both markers for endothelial cells. CD31 staining in wild-type animals and both transgenic animals showed the typical distribution and density of small diameter brain capillaries (Fig. 3A) and was used for quantification. To this end, three areas of the unlesioned parietal cortex were digitized and the percentage of CD31+ pixels/field was calculated, assuming that this value reflects the capillary density. No significant differences among wild-type animals, tg6 and tg21 mice were observed (wild type: 3.37% ± 0.70%, n = 8;tg6: 3.74% ± 0.91%, n = 8;tg21: 3.75% ± 0.83%, n = 9). The authors observed about 5 vessels per coronal brain section with a larger diameter (20 to 100 μm) and a clearly visible lumen (Fig. 3A). In most cases these vessels were positively stained for VCAM-1 (Fig. 3A). Staining with Mac-1, a marker for monocytes and neutrophils, did not show adherent cells in these vessels in any of the mouse lines (Fig. 3A). Notably, the number of the larger diameter and VCAM-1 positive vessels, however, was significantly increased approximately threefold in tg6 mice (Fig. 3B). In addition, histomorphologic evaluation in tg6 revealed dilated veins on the brain surface and in the meninges (Fig. 1).
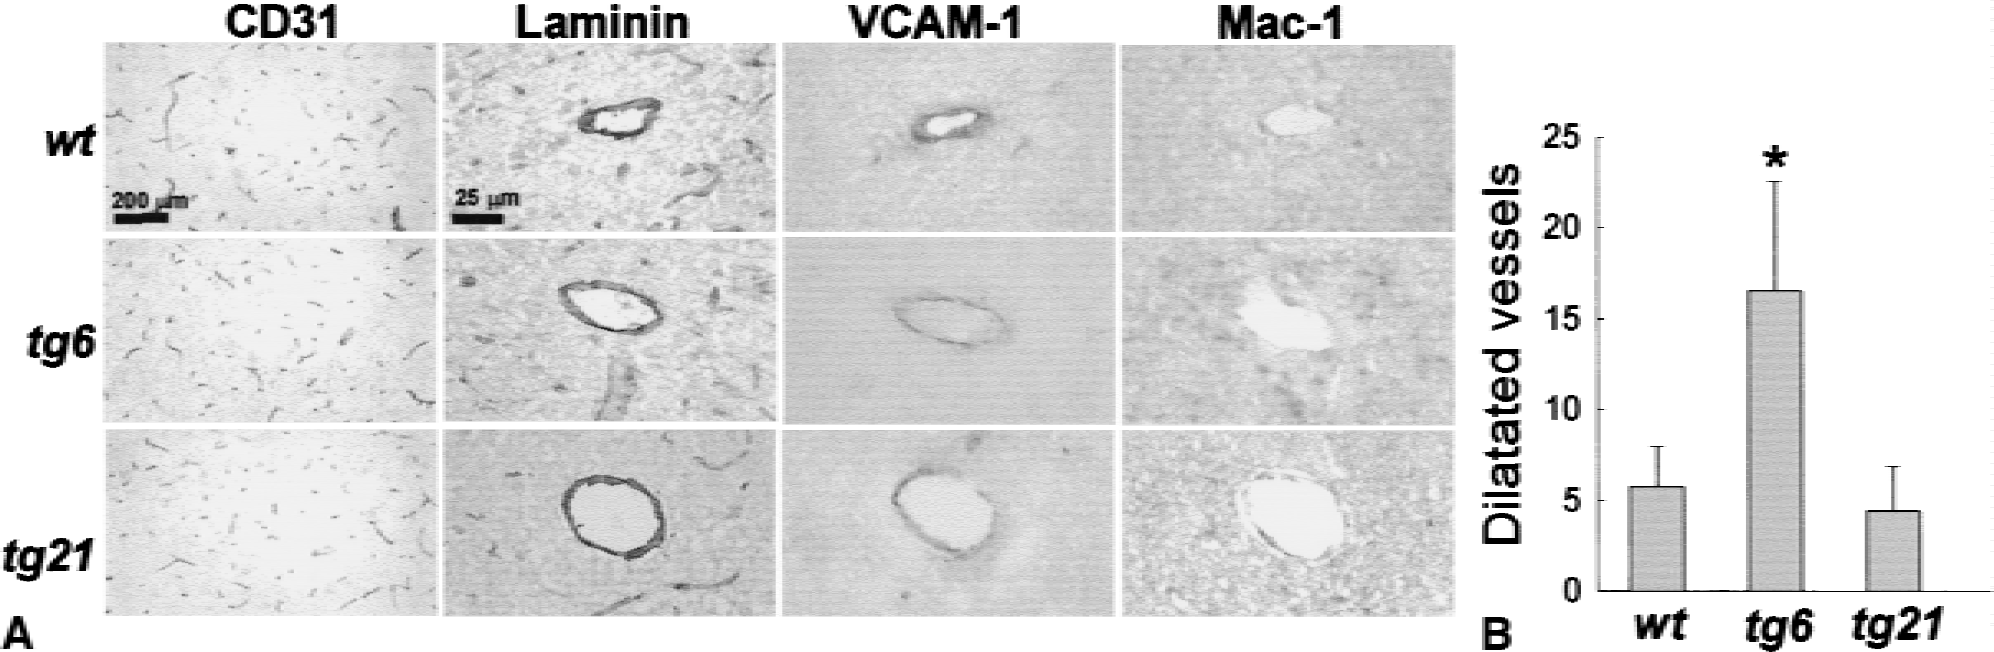
The number of VCAM-1+ vessels with lumens 20 to 100 μm was elevated 3-fold in tg6 mice.
Permanent focal cerebral ischemia was induced by electrocoagulation of the distal part of the right MCA. Blood flow was determined within 30 minutes after artery occlusion with bolus tracking perfusion MRI in a transverse slice (1.5-mm-thick) 4 mm posterior to the rhinal fissure. These measurements demonstrated that MCAO in wild-type animals resulted in ischemia primarily in the parietal cortex (Fig. 4). For quantification of the ischemic area, an arbitrary threshold was chosen that outlined the area with a decrease of the tracer signal by approximately 50%. Using this threshold, approximately 30% of the right hemisphere was ischemic (Fig. 4) in the brain slice selected for analysis. In tg6 and tg21 mice, a similar extent of the right hemisphere was affected, and significant differences were not found. Therefore, the supply territory of the MCA appeared to be similar for all strains.
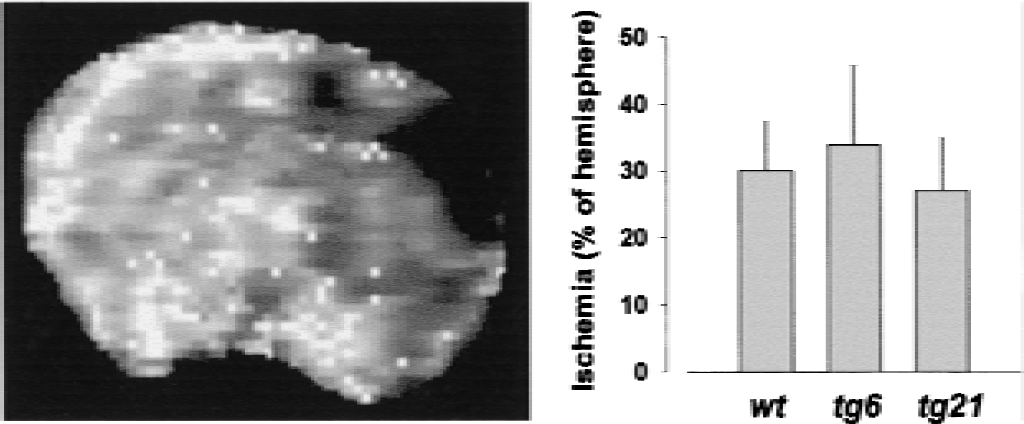
Ischemic areas after middle cerebral artery occlusion were similar in wild-type, tg6, and tg21 mice. Blood flow was determined within 30 minutes after artery occlusion with bolus track magnetic resonance imaging in a transverse slice (1.5-mm-thick) 4 mm posterior to the rhinal fissure (left panel). The perfusion deficit was quantified as percentage of affected area per hemisphere using an arbitrary threshold of 50% signal intensity in the nonischemic hemisphere. Significant differences among the strains were not observed.
One day after pMCAO, vasogenic edema accompanying infarct development was sharply demarcated on T2-weighted MR images and matched histologic manifest tissue damage in the cortex (Fig. 5A). Infarct volumes were calculated based on the damaged area in 13 slices (4 representative slices per animal are shown in Fig. 5B) and the distance between slices (1 mm). It has been shown previously that lesion volumes determined by T2-weighted MR images highly correlate with volumes as determined by conventional histologic methods (Weber et al., 1993; Rudin et al., 1999). The infarct volumes were corrected for brain swelling and calculated as percent of the hemisphere. The hemispheric lesion volume in wild-type, tg6, and tg21 mice was 7.7% ± 5.1%, 15.0% ± 9.7%, and 6.0% ± 2.8%, respectively (Fig. 5C). Thus, mean infarct volume was enlarged in tg6 mice by 49% (P = 0.011), whereas it was reduced by 22% (not significant) in tg21 mice.
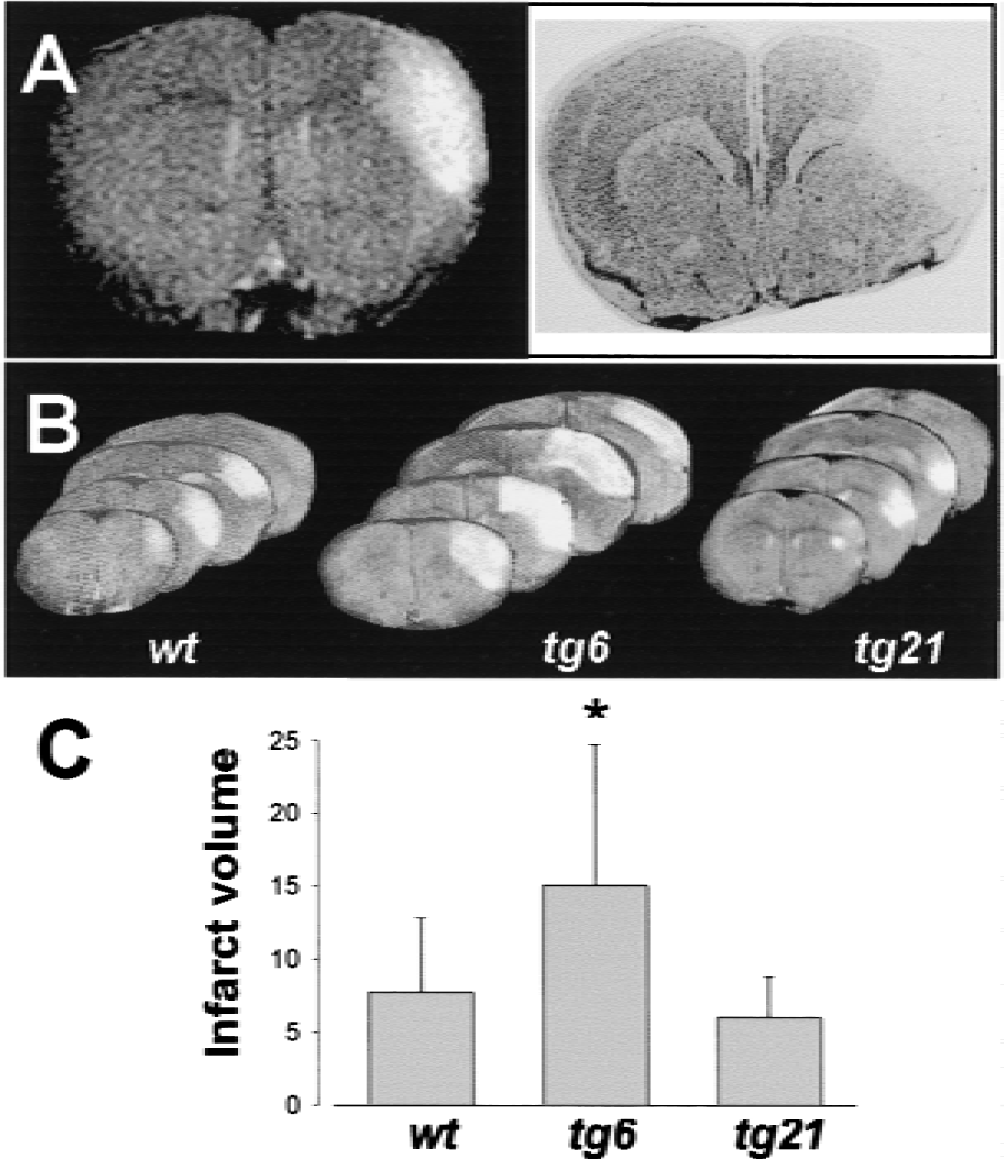
Compared with wild-type animals, infarcts were significantly enlarged in tg6 mice and smaller (not significant) in tg21 mice.
Mac-1 (CD11b) was used to determine the monocyte/neutrophil content of lesioned tissue 24 hours after pMCAO (Fig. 6A). Using a semiquantitative scoring scheme, a significant increase of Mac-1 immunoreactive cells was found in tg6 as compared with wild type and tg21 (Fig. 6B). Mac-1+ cells were observed inside larger caliber capillaries (Fig. 6A, arrows) as determined by laminin staining in neighboring brain sections. Many other cells of the same morphology, however, were found within brain parenchyma since no localization within brain capillaries was obvious (Fig. 6A, open arrows). In brains from tg21 mice, differences in Mac-1 staining as compared with wild-type animals were not observed.
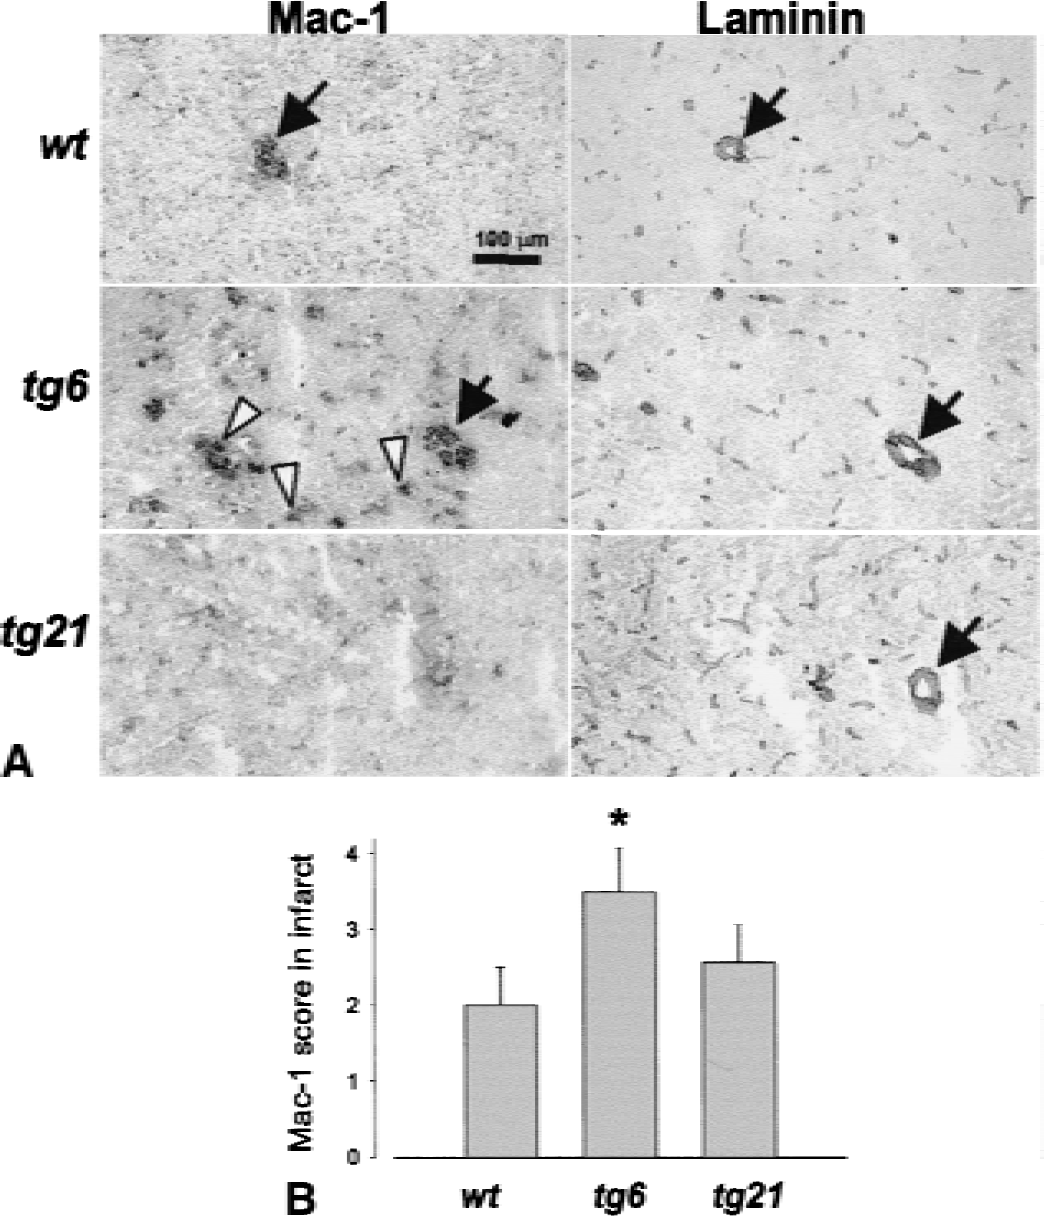
The number of Mac-1+ leukocytes (monocytes and neutrophils) within infarcted tissue was increased in polyglobulic tg6 mice.
DISCUSSION
Epo overexpression in the transgenic mouse line tg21
In the current study, one Epo transgenic mouse line (tg21) showed increased Epo protein levels in the brain (4-fold increase compared with wild type), whereas plasma Epo levels were in the normal range. In this mouse line, a significant elevation (36%) in relative CBF as determined by bolus-tracking MRI was observed. An increase in CBF, thus, may be involved in the protective effect of Epo which has been found in several recent studies in focal cerebral ischemia (Bernaudin et al., 1999; Brines et al., 2000; Sadamoto et al., 1998). Cerebral blood flow measurements were not performed in any of these studies and the protective mechanism remains unclear. Despite the significantly increased CBF in tg21 mice, only a trend toward reduced infarct volumes (22% reduction) after pMCAO was observed, which may be related to the limited number of animals used. In addition, the brain concentration of Epo may have been insufficient in tg21 mice for direct neuroprotective effects of Epo, which have been found in in vitro studies (Marti et al., 1996; Konishi et al., 1993). Assuming that a mouse brain contains 400 mg protein and that the current measurements were 6.5 mU Epo/mg brain protein in tg21 mice, a maximal amount of estimated 2.6 U were constitutively present in the whole brain of tg21 mice. In the published studies Epo was protective when a bolus of 0.4 μg/kg (ca. 40 U) was given 24 hours before onset of MCAO (Bernaudin et al., 1999) or 0.2 to 5 U/d for 28 days starting immediately after MCAO (Sadamoto et al., 1998). Recently, Brines et al. (2000) reported that peripheral (intraperitoneal) application of Epo at high doses (5000 U/kg) was protective even when applied up to 6 hours after MCAO (Brines et al., 2000). It is likely that the peak amounts of brain Epo in these studies were greater than in tg21 mice used in the current study.
Epo overexpression in the transgenic mouse line tg6
The other mouse line used (tg6) had both elevated brain and plasma Epo (26-fold and 10-fold increase over normal, respectively) and had high hematocrit levels (approximately 80%). Bolus tracking perfusion MRI indicated a dramatic increase of blood viscosity, as shown by the long delay of the time-to-peak value of the infused tracer bolus. It is well known that the major determinant of whole blood viscosity is the hematocrit (Harrison, 1989; thus, this finding was expected. Interestingly, however, tg6 animals revealed normal CBF albeit a prolonged MTT of the bolus first passage. Notably, the impact of blood viscosity on CBF is controversial. Although some studies report that changes in blood viscosity changed CBF (Cole et al., 1994; Hurn et al., 1993), others did not find changes and suggested that compensatory vascular responses took place (Brown et al., 1985; Chen et al., 1989; Fan et al., 1980). In the current study, CBV of tg6 animals was larger than in the other strains as predicted by the central volume principle (Meier and Zierler, 1954), which states that MTT is equal to the ratio of tissue blood volume (here CBV) divided by the flow rate (CBF). This tendency to greater CBV indicated a possible compensatory effect at the vascular level to the elevated blood viscosity of tg6 animals. The microcapillary bed of brain parenchyma was visualized with CD31 staining, a common marker for endothelial cells (Plate et al., 1999). Image analysis, however, did not reveal differences between tg6 and wild-type mice. The authors did, however, observe a significant increase of vessels with a diameter approximately 20 to 100 μm. It appears possible that this increase in larger caliber brain capillaries contributed to the elevated CBV and helped to compensate the greater blood viscosity in tg6 mice.
Despite normal basal CBF, infarct volumes after pMCAO in tg6 mice were enlarged by 49% as compared with wild-type mice. In previous studies, basal physiologic parameters have been extensively studied in tg6 mice and it has been demonstrated that mean arterial blood pressure, heart rate, and cardiac output were similar in anesthetized wild-type and transgenic animals (Wagner et al., 2001). Differences in these parameters, therefore, could not account for the observed increase in infarct volume. The authors hypothesized that the mechanisms could be related to an impairment of collateral blood flow in penumbral areas because of the increased blood viscosity. In addition, a direct vasoconstrictor effect of Epo on vessels has been observed in vitro (Buemi et al., 1995). The bolus tracking perfusion MRI measurements of CBF, however, did not suggest a difference in collateral blood flow in the MCA territory between tg6 mice and the wild-type strain, because the perfusion deficit in the cortex after MCAO was very similar in tg6 and wild-type mice. The MRI method used in the current study provides only relative blood flow values; nevertheless, it is sensitive enough to detect even minor changes in collateral blood flow (Müller et al., 1996; Lythgoe et al., 2000). One parameter potentially involved in the enlargement of infarct volumes in tg6 mice is the previously demonstrated adaptive up-regulation of endothelial nitric oxide-synthetase (eNOS) resulting in elevated NO plasma levels in these mice (Ruschitzka et al., 2000). Although endothelial NO synthesis has a beneficial hemodynamic effect in penumbral areas in the early stages after MCAO (Huang et al., 1996), elevated eNOS levels in the endothelial cells of tg6 mice may lead to a burst of NO production reaching cytotoxic levels (Iadecola, 1997). The formation of free radicals associated with NO formation also could result in endothelial activation and subsequent sequestration of monocytes and neutrophils (Mac-1+ cells), which were found to a much larger extent within lesioned areas in tg6 mice as compared with wild-type animals in the current study. This finding also may be related to increased leukocyte counts in blood from tg6 mice. A detrimental role of leukocytes, especially polymorphonuclear neutrophils, has been implicated by the observation that antibody-mediated depletion of these cells reduced infarct volumes after MCAO (Matsuo et al., 1994).
Therapeutic implications
Taken together, the current results revealed that the mouse line tg21 that shows moderately increased brain Epo levels displayed a tendency for a reduction in infarct volume after focal brain ischemia. In contrast, the transgenic mouse line tg6, in which Epo overexpression was associated with elevated hematocrit outcome after experimental ischemia, was significantly worsened. Whether the increase in infarct volume was caused by the elevated hematocrit or by other effects of the chronic systemic up-regulation of Epo in tg6 mice remains to be determined. Given its wide use and safety profile (Fisher, 1998), the previously reported protective effect of Epo in ischemic brain injury has prompted immediate attempts to investigate Epo in human stroke patients. The current study indicates that if prophylactic administration of Epo were to elevate hematocrit as seen in tg6 mice, similar detrimental effects on outcome in human patients might occur. In addition, systemic chronic treatment with Epo associated with elevated hematocrit may deteriorate outcome after stroke either because of elevated hematocrit or other chronic effects.
Footnotes
Acknowledgments:
The authors are grateful to Pascale Brebbia, Francesco D'Amato, and Willi Theilkäs for excellent technical assistance. The authors also thank Hugo Marti, Christian Bauer, J. Fandrey, K. Wagner, and W. Kuschinsky for advice and discussion.