
Abstract
Neonatal hypoxic-ischemic brain injury (HII) and arterial ischemic stroke (AIS) result in irreversibly injured (core) and salvageable (penumbral) tissue regions. Identification and reliable quantification of salvageable tissue is pivotal to any effective and safe intervention. Magnetic resonance imaging (MRI) is the current standard to distinguish core from penumbra using diffusion-perfusion mismatch (DPM). However, subtle MR signal variations between core–penumbral regions make their visual delineation difficult. We hypothesized that computational analysis of MRI data provides a more accurate assessment of core and penumbral tissue evolution in HII/AIS. We used two neonatal rat-pup models of HII/AIS (unilateral and global hypoxic-ischemia) and clinical data sets from neonates with AIS to test our noninvasive, automated computational approach,
Keywords
INTRODUCTION
Neonatal hypoxic-ischemic injury (HII) and arterial ischemic stroke (AIS) lead to devastating sequelae. 1 While the ischemic core consists mainly of dead (necrotic and apoptotic) or irreversibly dying tissues, the ‘stunned’ penumbra is composed of potentially recoverable tissues.2–4 Being able to identify, quantify, and reliably determine such salvageable tissue is pivotal to any effective and safe intervention.
Noninvasive objective quantification of core–penumbral regions, particularly in neonates, is a major diagnostic challenge. Magnetic resonance imaging (MRI) is now the standard method for assessing these injuries. Numerous studies have examined different MRI modalities for assessing patients in clinical trials and for long-term prognosis,5,6 but these have been performed primarily in adults. Furthermore, recent reviews have suggested limitations in the sensitivity and specificity of current methods such as diffusion-perfusion mismatch (DPM) due to the temporal variability of the lesion volume (core plus penumbra) and to the fact that as many as 24% of patients with acute hyperintense diffusion-weighted imaging (DWI) abnormalities (e.g., restricted diffusion) show ‘DWI reversal’.6,7
Lesion salvageability is related, in part, to differences in regional blood flow and mitochondria-mediated metabolism within neurons and glia, 8 and the interdigitated nature of core and penumbral changes over space and time. 2 In animal models, recent studies have used microtubule-associated protein 2 (MAP2) and neuronal nuclei (NeuN) as immunohistochemical (IHC) markers of viable neurons, heat-shock proteins (HSPs) as markers for activated astrocytes to delineate the penumbra, and glial fibrillary acidic protein (GFAP) as a marker of glial cell activity and structural integrity.2,9,10 In clinical studies, while DPM has been used to identify salvageable from nonsalvageable tissues,11–13 recent publications have shown that simple volumetric DPM is misleading and emphasizes the need for coregistration between DWI and perfusion-weighted imaging (PWI) which is challenging, particularly in neonates where PWI data are noisy due to increased brain water content. 14
To provide an alternative strategy that might be applicable to neonatal HII, we have shown that a computational approach to MRI analysis,
In animal models, the current gold standard for ischemic injury (and its core–penumbra) is IHC. As one cannot do IHC in living patients, the current clinical gold standard is DPM. Unfortunately, PWI is not yet the clinical standard of care for newborns, the target group in this investigation, and there are only few medical centers capable of or currently doing PWI in newborns. Hence, we could not show DPM results for the limited clinical data that we present. Instead, we present DPM data from 11-day-old rat pups which is technically very challenging and being reported for the first time.
Our data show that HRS reliably deconstructs the otherwise visually uniform (as perceived by the human eye) MR regions of ischemic injury into subtle subregions with small MR signal variations that correspond to core–penumbral tissues. Such a novel, highly sensitive tool should ultimately facilitate the development of new therapeutic interventions against neonatal HII by improving patient selection and enhancing the reliability of predicting outcomes. Adaptation of the HRS method could also have direct clinical applications for the treatment of adult stroke, for example by (1) providing an alternative to using the time of onset of stroke symptoms as an absolute selection criteria for urgent treatments; (2) extending the opportunity to treat more stroke patients; (3) serve as a potential tool to monitor immediate recanalization postthrombolysis; and (4) become a potentially reliable tool to evaluate efficiency of neuroprotective agents used in the acute poststroke period.
MATERIALS AND METHODS
All animal protocols were approved by the Loma Linda University (LLU) Institutional Animal Care and Use Committee and use of deidentified human newborn MRI data was approved by the LLU Institutional Review Board.
Animal Models of Hypoxic-Ischemic Brain Injury
The Rice Vannucci model (RVM) used in this study has been described previously. 20 Briefly, anesthetized P10 Sprague-Dawley rat pups (Harlan, Livermore, CA, USA) had their right common carotid artery permanently ligated and were then placed with their dams on a warm heating pad (37°C) for recovery. After 2 hours, the pups were exposed to hypoxia (8% oxygen to 92% nitrogen) for 1 to 2 hours (to produce different degrees of injury severity) in a humidified chamber and maintained at 38°C. Pups were then placed in room air (37°C) until they awoke and were then transferred to their mothers.
In addition, a model of bilateral HII was induced using bilateral common carotid artery occlusion (BCAO-H) as previously described by our group. 21 In P10d Sprague-Dawley rat pups, both common carotid arteries were exposed and permanently ligated under isoflurane anesthesia (4% induction, 2% maintenance). The animals were then placed with their dams on a warm heating pad (37°C), recovered for 90 minutes and then exposed to hypoxia (8% oxygen to 92% nitrogen; 38°C) for 1 to 15 minutes to produce ischemic injury of different severities.
Two experiments were undertaken.
T2 relaxation times and diffusion coefficient ranges for normal brain tissue, ischemic lesion, and core–penumbra
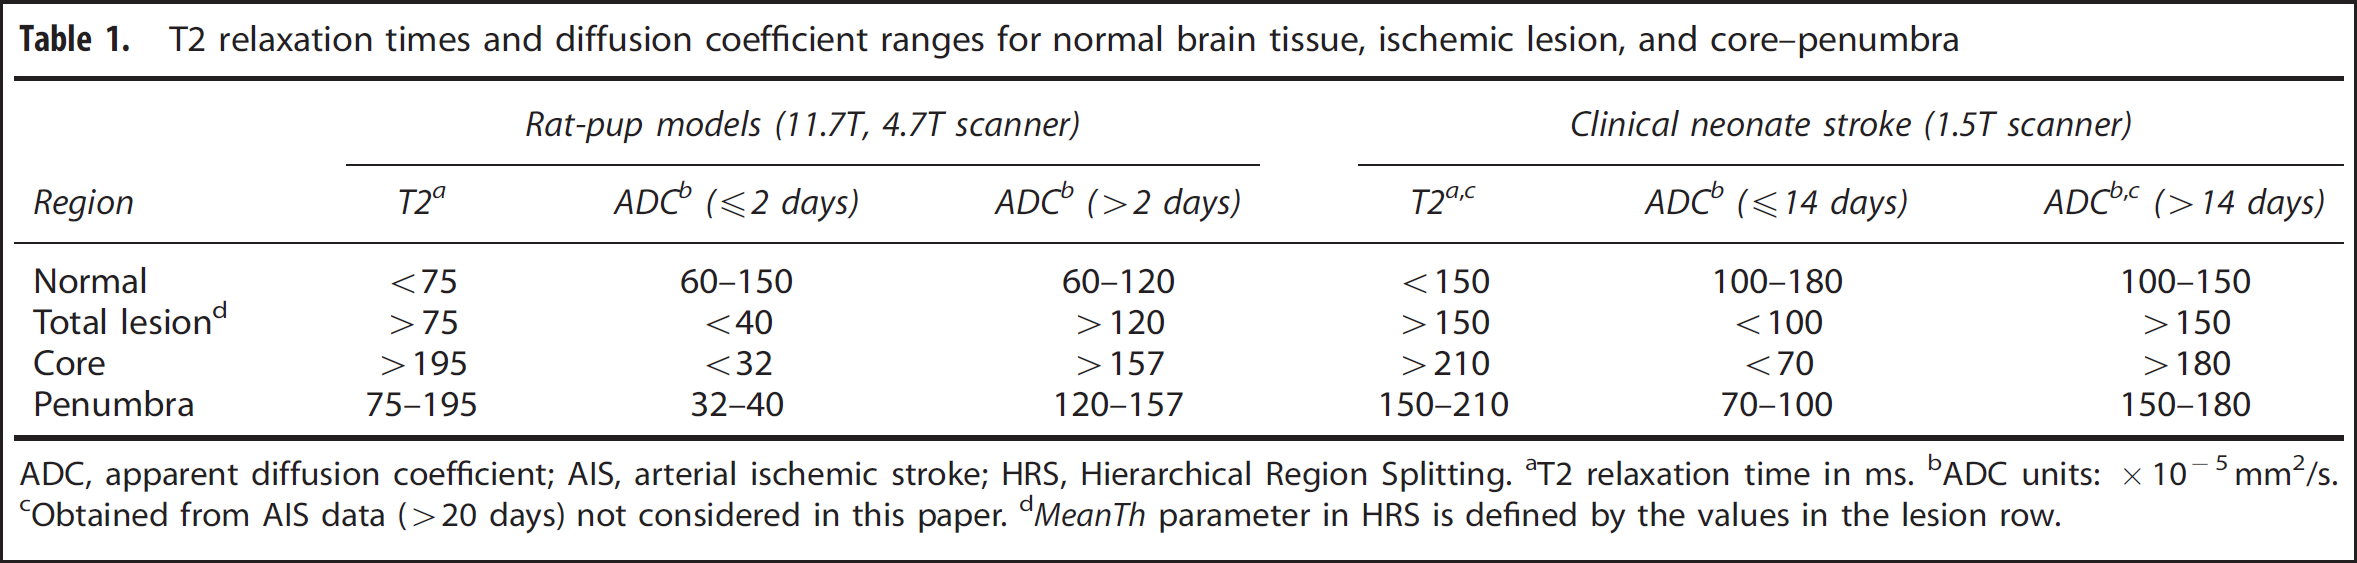
ADC, apparent diffusion coefficient; AIS, arterial ischemic stroke; HRS, Hierarchical Region Splitting.
T2 relaxation time in ms.
ADC units: × 10−5 mm2/s.
Obtained from AIS data (>20 days) not considered in this paper.
Human Neonatal Stroke Subjects
Six term neonates who had been diagnosed with AIS at Loma Linda University Children's Hospital Neonatal Intensive Care Unit were retrospectively selected to evaluate the efficacy of HRS in identifying presumed core–penumbral regions. Inclusion criteria were (1) estimated gestational age ≥ 37 weeks and (2) presence on MRI of a focal restricted diffusion lesion indicative of AIS.
22
The MRI scans in these neonates were acquired within 3 to 17 days after ischemia on a 1.5-T whole body imaging system (Vision; Siemens Medical Solutions, Erlangen, Germany) equipped with a standard quadrature head coil. Turbo spin echo T2WI and echo-planar 2D spin echo DWI sequences were acquired in the axial plane using neuroimaging parameters summarized in Supplementary Table 1. T2 and
Hierarchical Region Splitting Computational Assessment of Core–Penumbral Regions
Detection of core–penumbra builds on our published HRS algorithm
15
by further dichotomizing the extracted injury regions (i.e., lesion). The HRS extraction of the lesion encompasses: (1) skull stripping; (2) removing background noise; (3) rescaling MR values to reduce computational complexity; (4) modeling the histogram of the rescaled MR values as a bimodal distribution with two distinct and distant peaks; (5) splitting the MR image into two subimages using the valley between these two peaks in the histogram; (6) recursively resplitting the bimodal distributions to generate the HRS tree; (7) stopping the recursive splitting based on a set of uniformity criteria; (8) converting the rescaled values back to actual MR values; and (9) extracting the lesion volume based on ‘a priori’ approximate mean MR values (using a threshold
For normal developing brain, water content and mobility decrease with age, as do their T2 map and ADC values. In pilot studies, we determined that the mean T2 of normal appearing brain matter for P10-P30 rat pups was <75 ms and the mean ADC ranged from 60 to 150 × 10−5 mm2/s (Table 1). For T2 maps, we used a
In the current work, the HII lesion is detected by a modified HRS method. The mean value of an HRS subregion that contains mostly normal appearing brain matter can be influenced by components of the lesion or cerebrospinal fluid inside the subregion and the entire subregion might erroneously be classified as ischemic. These outlier subregions were found to have high standard deviation (StdDev) values. The HRS method was modified to compare (mean ± 0.5 × StdDev) (instead of just the mean alone) with the
Diffusion-Perfusion Mismatch Determination of Core/Penumbra
We quantified HII lesion volume from the diffusion-based (1 day after injury) ADC map using a simple pixel-based threshold (ADC < 40; Table 1) followed by morphological cleaning and manual outlier rejection. For PWI, Gadolinium (Gd) contrast agent (~1 mL/1,000 g rat-pup weight) was infused via a femoral artery catheter (Supplementary Table 1). The perfusion-based lesion was detected from CBV maps computed from PWI data. Use of CBV is supported by recent publications 24 reporting that CBV in newborns, in contrast to adults,11–13 better delineates healthy from injured tissues than CBF. We used a simple pixel-based threshold (CBV > 10 mL/g) followed by morphological cleaning and manual outlier rejection to detect the PWI lesion(s). The CBV-based lesion was then superimposed on the CBF and MTT maps to compare perfusion measures for normal and ischemic tissues. For enhanced DPM, we spatially colocalized DWI and PWI data using landmark-based semiautomated coregistration (see below). Overlap of DWI/PWI lesions were designated as core and mismatched regions were considered as penumbra.
Histological/Immunohistochemical Verification of Core/Penumbra
After final imaging, rat pups were perfused with 1 mL of 4% paraformaldehyde/1 g of animal body weight at the rate of 4 mL/min. Brains were extracted from the skull and further postfixed for 24 hours, before being submerged in 30% sucrose solution and sectioned as previously described.
25
Brain tissue sections were cut on a cryostat at 30 to 50
The IHC sections were processed with heated 0.1 mol/L citrate buffer for antigen retrieval followed by immersion in a solution containing 1% bovine-serum albumin, 5% normal serum from the host species of the secondary antibodies, and 0.1% Triton X-100 (TX-100) for 90 minutes at room temperature. Primary antibodies were prepared in a solution containing only bovine-serum albumin and TX-100. Tissue sections were incubated at 4°C for 40 hours with primary antibody. After incubation, sections were washed 3 × 15 minutes in 0.1 mol/L phosphate-buffered saline before treatment with secondary antibodies (Invitrogen, Carlsbad, CA, USA) prepared in 1% bovine-serum albumin + 0.1% TX-100: goat anti-rabbit AlexaFluor 488 (A488; 1:1,000), goat anti-mouse A488 (1:1,000), donkey anti-goat A488 (1:1,000), or fluorescein isothiocyanate (FITC)-conjugated donkey anti-rabbit IgG (1:200; Jackson ImmunoResearch Laboratories, West Grove, PA, USA). After overnight incubation at 4°C, sections were washed 3 × 15 minutes in phosphate-buffered saline, allowed to air dry and coverslipped with VectaShield with DAPI counterstain (Vector Labs, Burlingame, CA, USA). Sections were imaged on an inverted microscope (Olympus, Center Valley, PA, USA) or Carl Zeiss confocal microscope LSM710 (Carl Zeiss MicroImaging, LLC, Thornwood, NY, USA).
Antibodies used were rabbit anti-MAP2 (Millipore, Temecula, CA, USA), rabbit anti-NeuN (Millipore), rabbit anti-GFAP (Millipore), goat anti-Heat Shock Protein 27 (HSP27; Santa Cruz Biotech, Santa Cruz, CA, USA), mouse anti-GFAP (Sigma-Aldrich, St. Louis, MO, USA), or mouse anti-HSP70 (AbCam, Cambridge, MA, USA). MAP2 is an abundant neuronal cytoskeletal protein, while NeuN is a neuron-specific protein, and GFAP, an astrocytic filament protein. These IHC markers were selected because cells in HII tissue are predicted to show changes in cellular location of these proteins and changes in spatial density compared with healthy, unaffected tissue. HSP27 and −70 are proteins found predominantly in astrocytes and neurons, respectively, which are activated in response to cellular stress, such as HII.
Coregistration: Hierarchical Region Splitting versus Diffusion-Perfusion Mismatch and Hierarchical Region Splitting versus immunohistochemistry
Coregistration between modalities was required in three cases: (1) DPM-based core–penumbra computation required registration of DWI/PWI data. The mismatch and core–penumbra are computed in DWI (i.e., ADC) image space (coordinates). (2) Comparison of core–penumbra results from HRS/MRI, manual/IHC, HRS/IHC required registration of digital images of the sectioned IHC tissue and MRI slices at the same bregma level. (3) Comparison of core–penumbra from HRS/T2 map and DPM required registration of corresponding T2 and ADC maps. For these three analyses, we developed an in-house Matlab-based semiautomated co-registration method. Manually selected pairs of landmark points from two modalities (Supplementary Figure 1 shows an example for MR and IHC sections) were used in a least-square estimation method to determine the spatial transformation matrix to map any point or region from either of the modalities to the other. As we previously reported, after coregistration, we computed spatial overlap and mismatch indices of the core–penumbra extracted from different modalities, using the following performance indices: (1) sensitivity, which quantifies true-positive detection, (2) specificity, which signifies the true-negative detection rate, and (3) similarity, which measures location and volume congruency of core– penumbra between
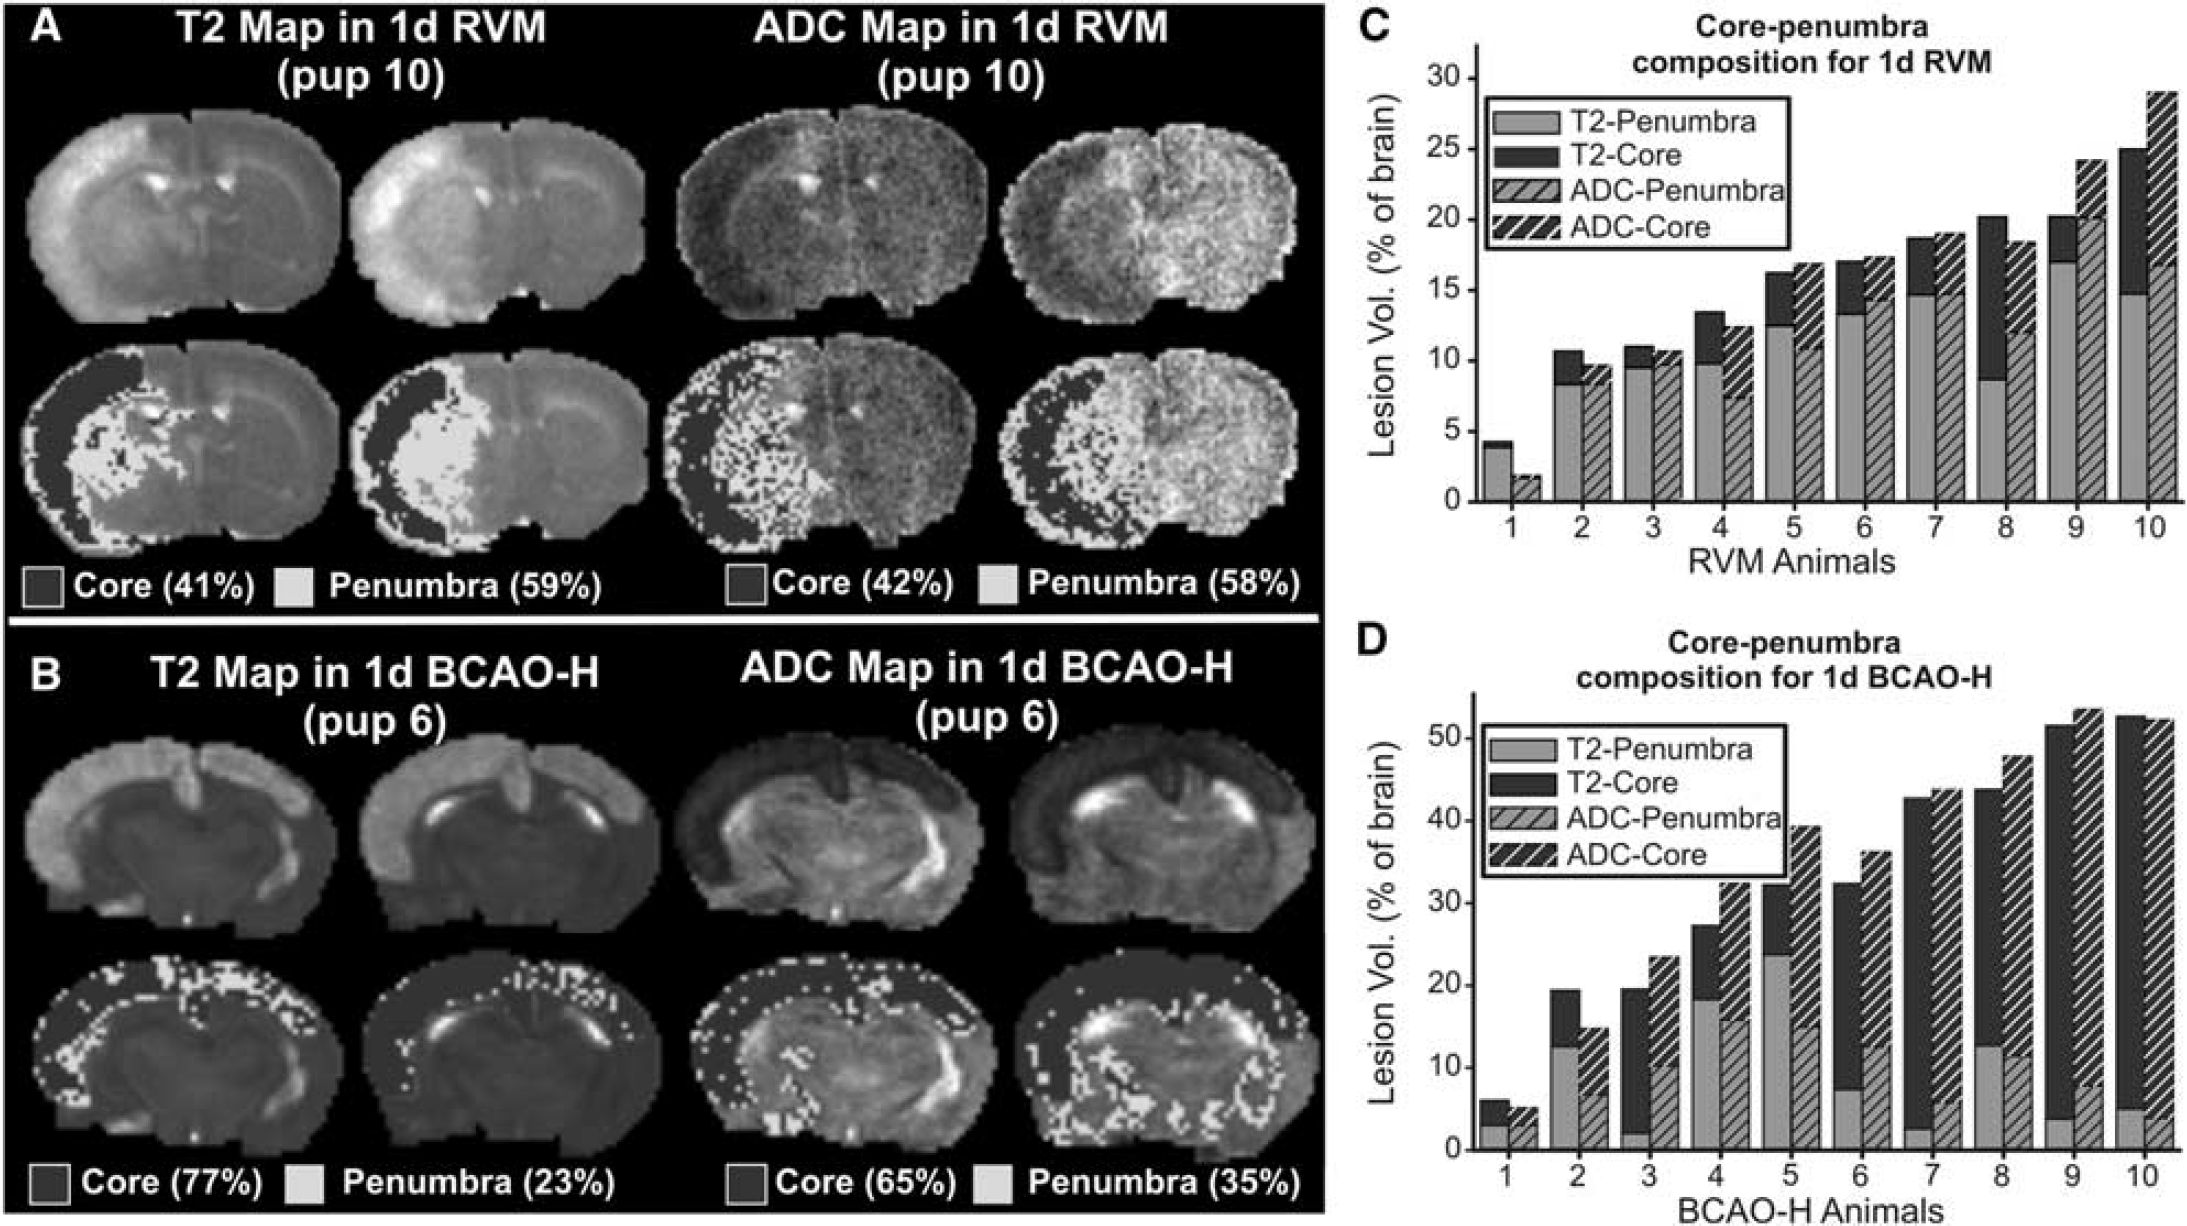
Hierarchical Region Splitting (HRS) detection of core–penumbra at 1 day after injury in the Rice Vannucci model (RVM) and the bilateral common carotid artery occlusion (BCAO-H) model. The HRS detected core–penumbra from T2 and apparent diffusion coefficient (ADC) maps in two representative RVM (
RESULTS
Hierarchical Region Splitting Determined T2 and ADC Core–Penumbra Volumes in Rat-Pup Models
Hierarchical Region Splitting detected core–penumbra using different imaging modalities (T2 and ADC) and injury models (RVM, BCAO-H; Figures 1A and 1B). At 1 day after unilateral HII (via RVM) (Figure 1A), the volume of the ischemic core was comparable between T2 (41%) and ADC (42%) maps as was the penumbra (T2: 59%; ADC: 58%). In the BCAO-H global ischemia model (Figure 1B), HRS also detected comparable core–penumbra regions from T2 and ADC maps (core: 77% (T2), 65% (ADC); penumbra: 23% (T2), 35% (ADC)). A summary of HRS detected core–penumbra compositions for both T2 maps and ADC maps (Figures 1C and 1D) for different animals with different injury severities (Materials and Methods, Experiment 1) shows that animals with similar total injury volumes (e.g., RVM animal # 6, 8; BCAO-H animal # 3, 5) might have different salvageable penumbra. The core–penumbra distributions inside the total ischemic lesion are continuous in 3D (see Supplementary Figure 2 for the complete brain). In some animals, we observed two or more ischemic cores that appeared ‘disconnected’, that is they were separated or surrounded by penumbral regions or the cores appeared to be interdigitated into areas of relatively homogeneous penumbral tissue (Figure 1B; Supplementary Figure 2).
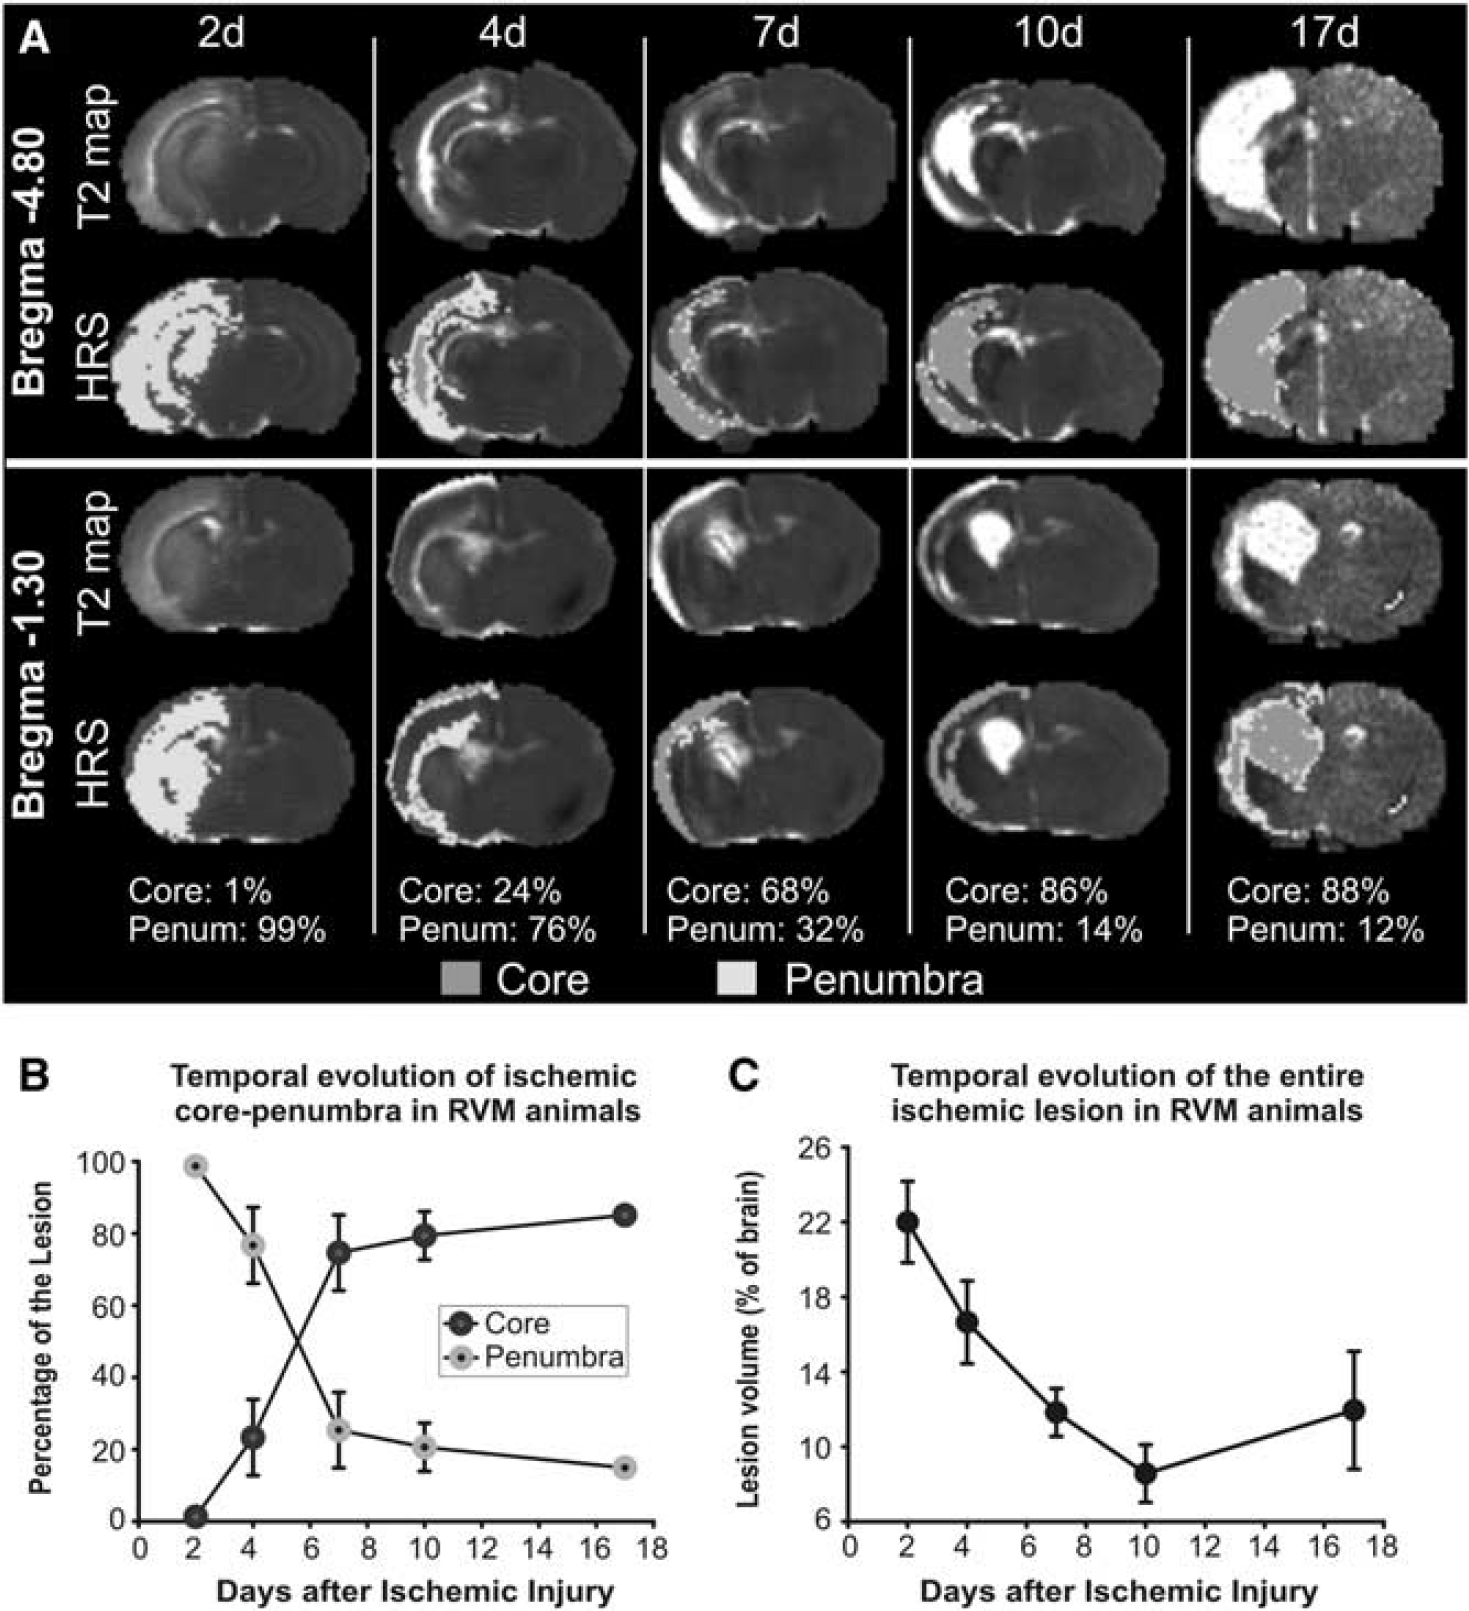
Spatiotemporal evolution of the core–penumbra in Rice Vannucci model (RVM) rat pups. (
Spatiotemporal Evolution of Core–Penumbra
The HRS-determined spatiotemporal evolution of the entire lesion as well as the core–penumbra from serial T2-map studies in one RVM rat pup is depicted in Figure 2A, while those for all animals (
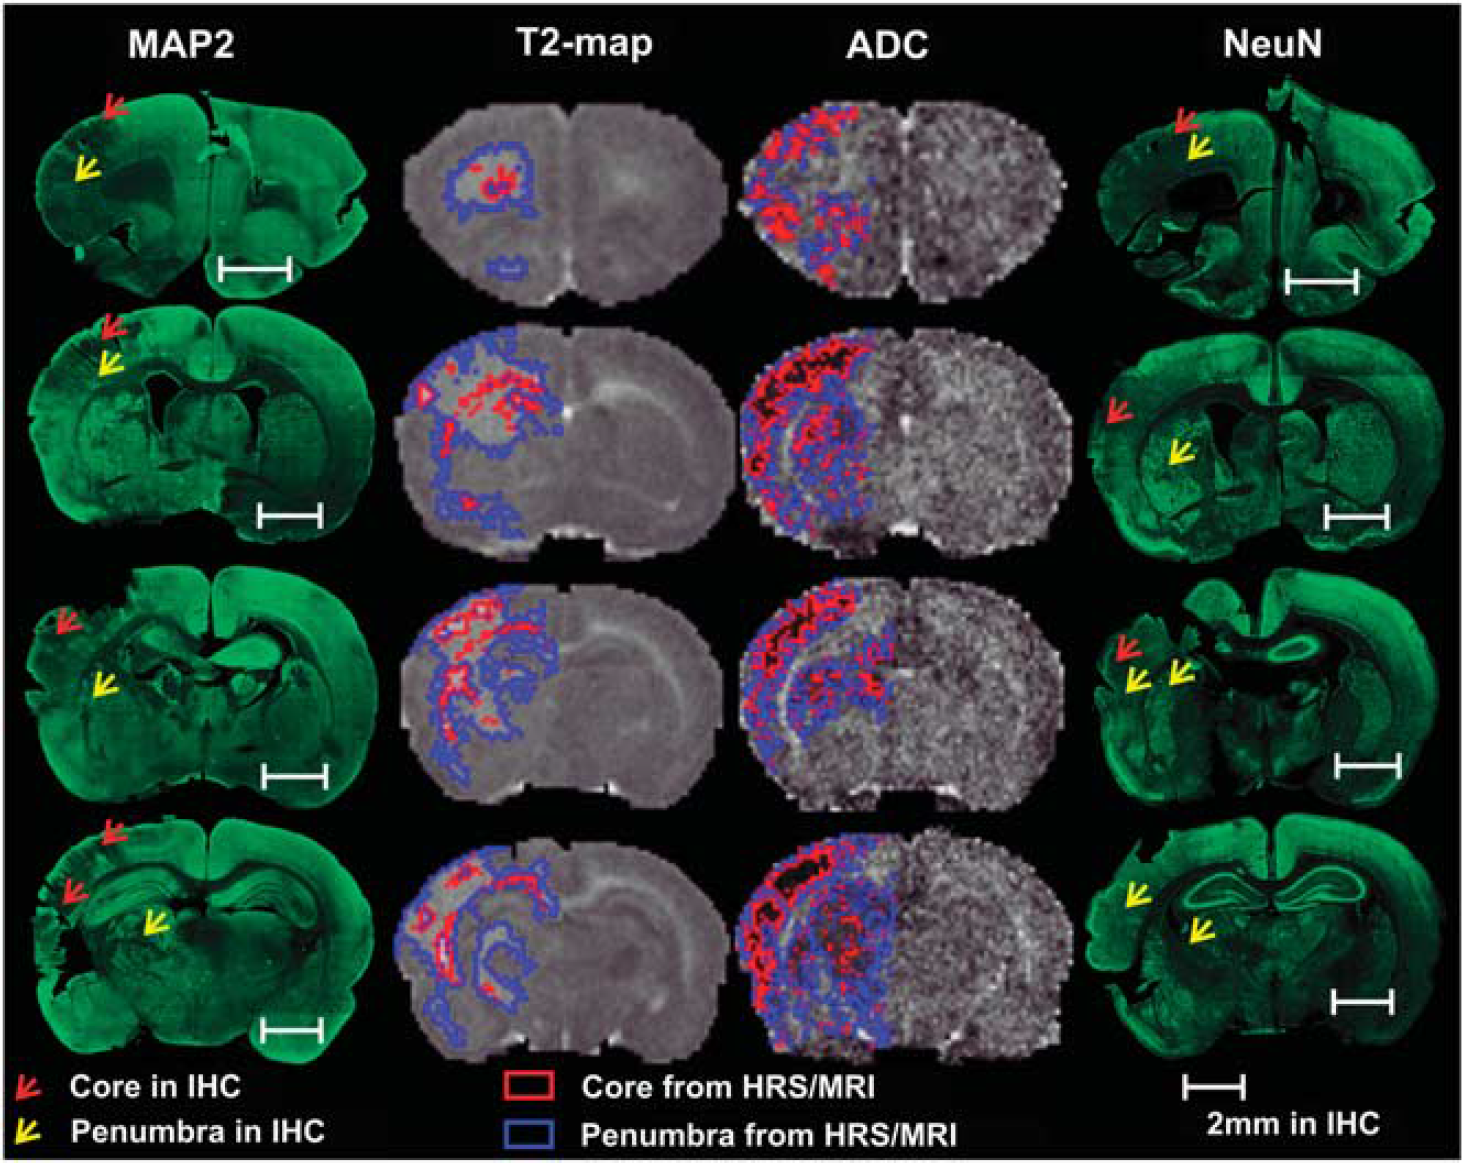
Validation of magnetic resonance imaging (MRI)/Hierarchical Region Splitting (HRS) determined core–penumbra with immunohistochemistry (IHC) at 1 day after injury. Core (red) and penumbra (blue) regions detected by HRS in 0.5 mm thick T2 and apparent diffusion coefficient (ADC) maps excellently correlate with the reduced microtubule-associated protein 2 (MAP2) and neuronal nuclei (NeuN) staining in the injury regions. MAP2 and NeuN are markers of live neurons and severely reduced expression (red arrows) signifies nonsalvageable necrotic core while intermediate staining (yellow arrows) shows the salvageable penumbral region with significantly less viable neurons than healthy tissue in the contralateral side. Minor differences in T2/HRS and ADC/HRS results (see Supplementary Figure 6 for the entire brain) are due to newly occurring restricted diffusion in ADC not yet reflected in early (1 day after injury) T2 relaxation increase and white-matter hypertrophy (see text).
Validation of the Core–Penumbra by Immunohistochemistry
Reduced neuronal MAP2 and NeuN staining (with occasional tissue loss) at different (bregma) levels (Figure 3) coincided with regions of irreversible ischemic necrosis in core regions determined by MRI and HRS. An intermediate MAP2 and NeuN staining level characterized the penumbra. HSP27 and HSP70 are among the markers of activated astrocytes; the penumbra showed regions of high HSP27 staining (Figure 4A), while the core was characterized by decreased HSP staining. The GFAP staining (Figure 4B) was markedly reduced in the core due to severe necrotic injury, while the penumbra showed increased staining.
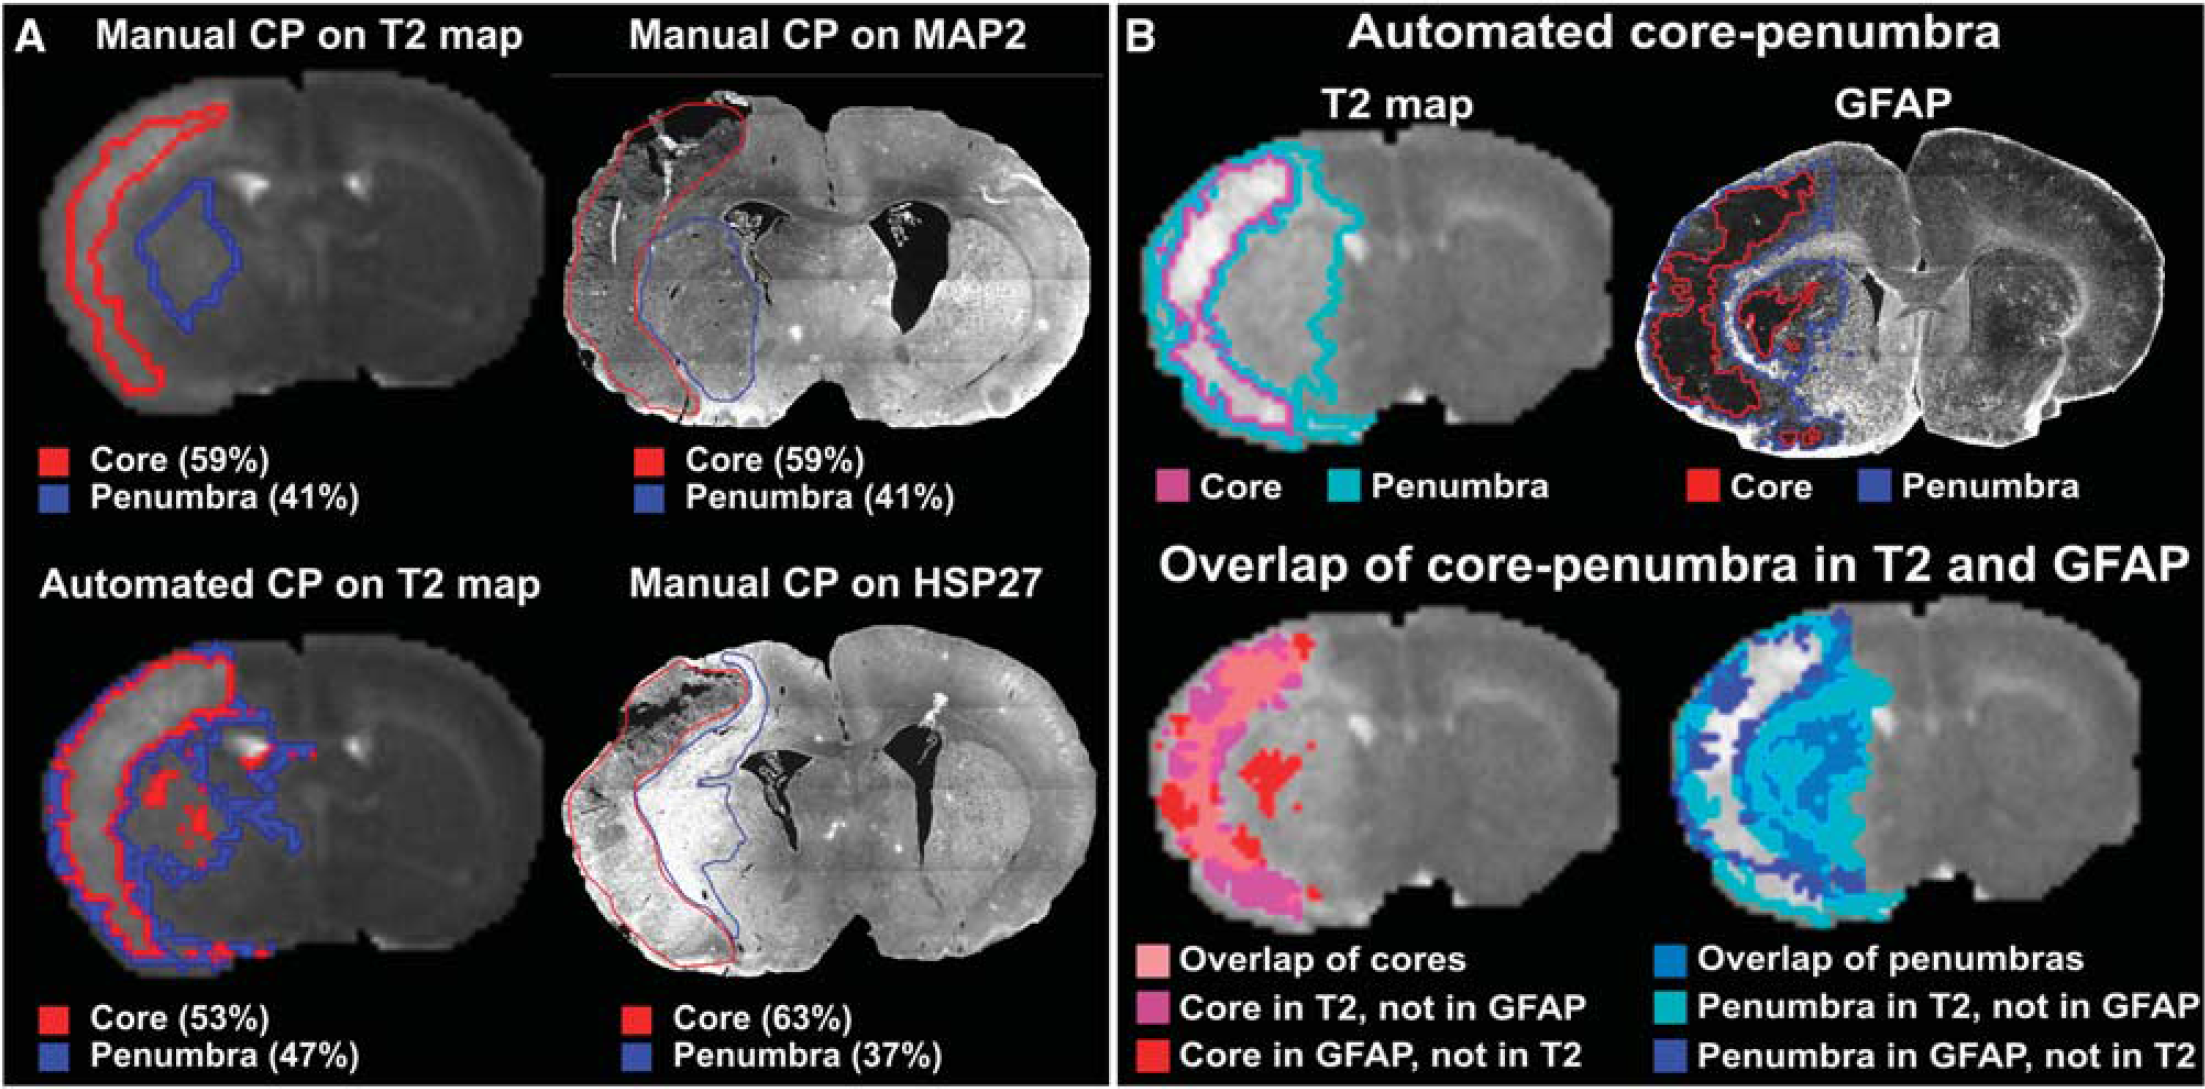
Comparison of magnetic resonance imaging (MRI)/Hierarchical Region Splitting (HRS) determined core–penumbra with immunohistochemistry (IHC) at 1 day after injury. (A) Manual detection versus automated detection: The extracted core–penumbra from the T2 maps from manual detection and using HRS are shown as the IHC-stained sections (MAP2, HSP27) with manual detection of the core–penumbra. The corresponding apparent diffusion coefficient (ADC) map-based HRS results are shown in Figure 1A. The MAP2 stains viable neurons with virtually no staining in the ischemic core while the penumbra has MAP2 staining. HSP27 staining reflects activated astrocytes and is primarily a penumbral marker. HSP27 activity appears greatest in the same penumbral regions as observed on MRI. (
We compared manual versus HRS detected core–penumbral regions from MR and IHC images to validate HRS from MRI using HRS/IHC detection as the gold standard. Manual core–penumbra identification shows intraobserver and interobserver variations in both IHC and MRI (Supplementary Figure 4). In contrast, automated HRS-detected core–penumbral regions from IHC digital images were objective, reproducible, and statistically comparable. Correspondence between IHC tissue and MRI (after coregistration) could be established (Figure 4B). Computed performance indices (Supplementary Table 2) were sensitivity: 0.37 to 0.76 (core), 0.37 to 0.55 (penumbra), 0.56 to 0.96 (total lesion); specificity: 0.88 to 0.99 (core), 0.86 to 0.95 (penumbra), 0.82 to 0.96 (lesion); and similarity: 0.44 to 0.79 (core), 0.56 to 0.68 (penumbra), 0.89 to 1.25 (lesion).
Comparison of Hierarchical Region Splitting versus Diffusion-Perfusion Mismatch
Core, penumbral, and normal appearing brain matter regions in DWI and PWI regions show considerable variations (Figure 5). After coregistration of DWI-PWI, ischemic core and penumbra from DPM was 5% and 14% of the total brain, respectively. Coregistering corresponding ADC and T2 maps and measuring the spatial overlaps between DPM and HRS/T2 map-based core–penumbra (Figure 5) ensured an excellent match for core (sensitivity = 0.88, specificity = 0.95, similarity = 0.62) while penumbra shows slightly lower values (sensitivity = 0.68, specificity = 0.62, similarity = 0.29).
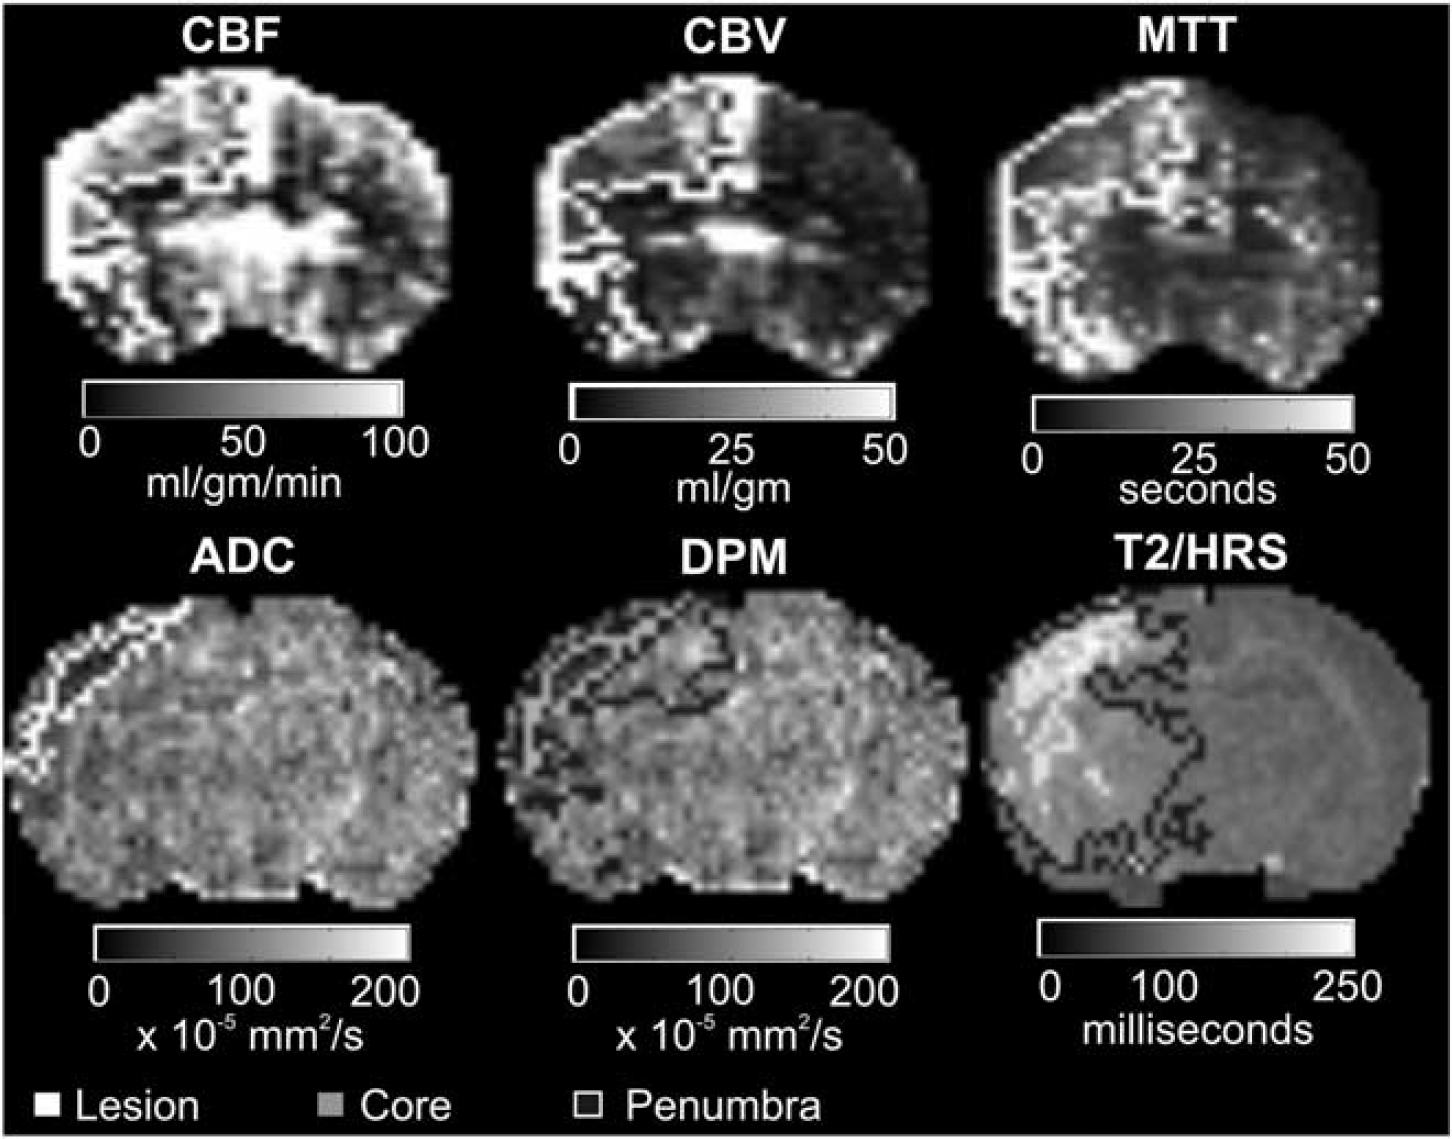
Comparison of diffusion-perfusion mismatch and T2 map/HRS-based core–penumbra quantification at 1 day after ischemic injury in a 10-day Rice Vannucci model (RVM) rat pup. Top row shows the cerebral blood flow (CBF), cerebral blood volume (CBV), and mean transit time (MTT) maps computed from perfusion-weighted imaging (PWI). The bottom row shows the apparent diffusion coefficient (ADC) map computed from diffusion-weighted imaging (DWI); Diffusion-perfusion mismatch (DPM) superimposed on the ADC map; and HRS detected core–penumbra from T2 relaxation times superimposed on the T2 map. Grayscale intensity bars are shown below each image. We have used the criterion (CBV > 10 mL) to detect perfusion lesion (see Materials and Methods). The PWI measures of the lesion (24% of the brain) differ considerably from those of the normal healthy tissue: CBF: 72 ± 52 (lesion), 29 ± 20 (normal); CBV: 21 ± 12 (lesion), 6 ± 3 (normal); MTT: 21 ± 10 (lesion), 14 ± 6 (normal). To compare with currently published DPM methods, we have used simple thresholding (ADC < 40 × 10−5 mm2/s) to find the diffusion lesion (6.5% of the entire brain). The ADC values of the diffusion observed lesion (32 ± 10 × 10−5 mm2/s) also differ considerably from the normal tissue (79 ± 25 × 10−5 mm2/s). After semiautomated coregistration of diffusion and perfusion data (DPM figure in lower panel), overlap of the diffusion-perfusion lesions was designated as core (5% of the brain) and the mismatch was designated as penumbra (14% of the brain) of the ischemic injury. Similar coregistration of the T2 and ADC maps found that T2/HRS-based core had excellent overlap with the DPM core (sensitivity = 0.88, specificity = 0.95, similarity = 0.62). The penumbra that appears smaller on DPM than T2/HRS had lower values (sensitivity = 0.68, specificity = 0.66, similarity = 0.29) primarily due to the low resolution PWI scan. HRS, Hierarchical Region Splitting. The color reproduction of this figure is available at the
Evaluation of Core–Penumbra Regions in Human Neonatal Arterial Ischemic Stroke
The HRS determination of core–penumbra regions was further evaluated on clinical AIS data sets (Figure 6). Representative ADC maps from a 3-day-old AIS neonate show interdigitated core–penumbra detected by HRS (Figure 6A; Supplementary Figure 5). HRS was able to identify putative core–penumbra with varying ranges of tissue involvement (Figure 6B) for six AIS neonates (3 to 5 days after presumed injury) with different injury severities (core: 35 ± 11%, penumbra: 65 ± 11% of the total lesion, while total lesion is 10 ± 5% of the total brain). Like animal models, patients with similar injury volumes (patients 4 and 5; Figure 6B) have different salvageable tissues.
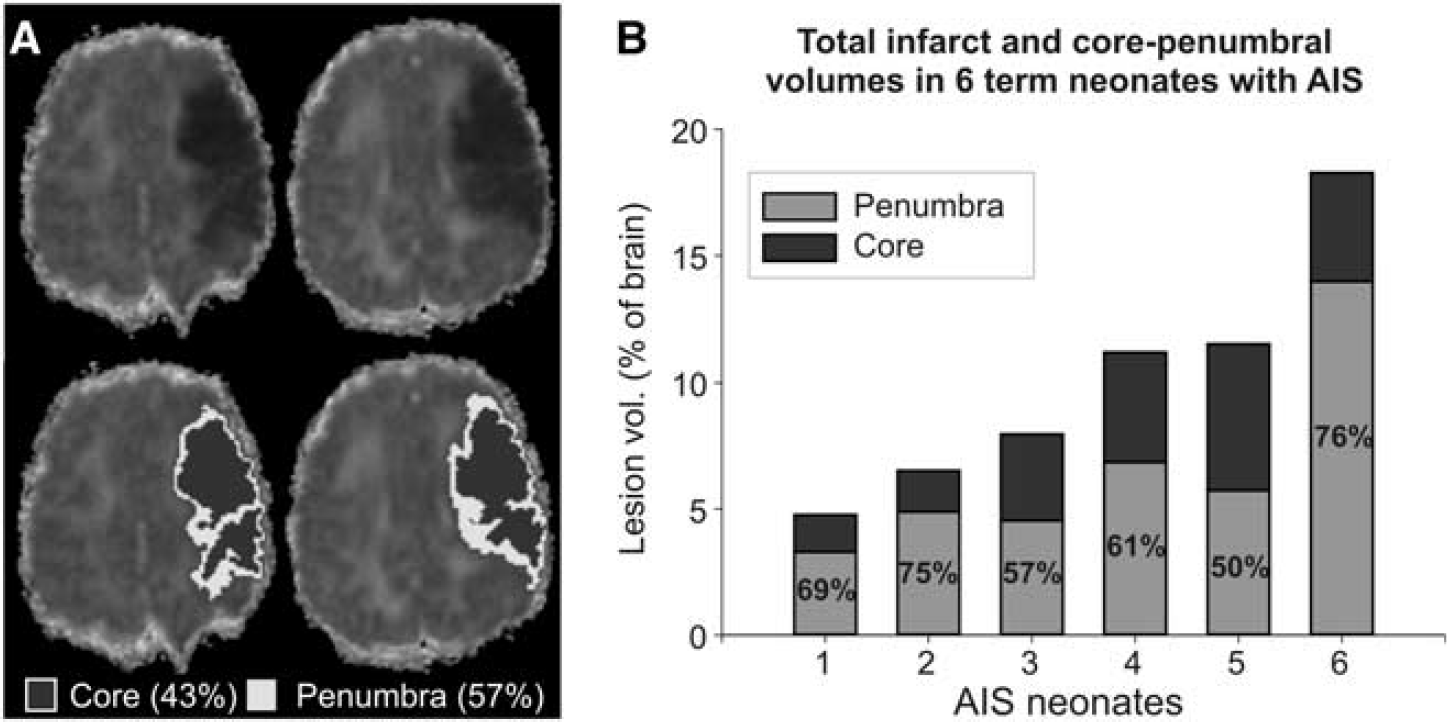
Hierarchical Region Splitting (HRS)-based core–penumbra detection from apparent diffusion coefficient (ADC) maps of term newborns with arterial ischemic stroke (AIS) at 3 to 5 days after injury. Core–penumbra results from a representative 3-day AIS brain is shown in (
DISCUSSION
The necrotic and apoptotic changes that occur after HII are well established and vary with age, severity, location, and type of injury. 26 As such, the biological evolution of ischemic tissue results in heterogeneous changes 2 that result in subtle core–penumbral MR signal variations that are difficult to detect by visual image inspection. We have previously reported that HRS can rapidly and precisely define T2-map volumes of ischemic injury in a rat-pup model of global ischemia. 15 Refinement of our computational approach now provides strong evidence that: (1) HRS can detect and quantify the core–penumbra in focal and global models of ischemia using ADC/T2-map data that match IHC measures; (2) HRS from a single MR modality (T2WI) is as good as DPM in detecting core–penumbra; and (3) HRS works equally well in term newborns with AIS. We have purposefully varied injury severity (from mild to severe) to show successful applicability of HRS to a broad range of data. As compared with DPM, HRS has an additional advantage: it relies solely on already acquired T2/ADC map data thus obviating the need to do a second type of scanning procedure such as PWI that would require contrast infusion.
A consequence of postischemic injury is the development of cytotoxic/vasogenic edema. 27 Reduced water diffusivity, in part because of cellular swelling, 2 is reflected in early MRI changes of restricted diffusion (DWI hyperintensity; ADC hypointensity). 13 With progressive cell swelling and death, water content increases and is detectable as increased tissue T2 relaxation (Supplementary Figure 3). The ischemic core has higher T2 relaxation and lower diffusivity coefficients than the penumbra. These subtle MR signal differences (~10 ms in T2 maps and 10 × 10−5 mm2/s in ADC maps) are extremely difficult to detect visually but are detectable using automated methods such as HRS (Supplementary Figure 3).
Previous adult stroke studies have shown that ADC values do not change substantially until CBF decreases < 20 mL/100 g per minute and thus the most severe ADC reductions are found in the center of the perfusion deficit, indicating that specific ADC values are able to discriminate core from penumbra.16,28 Other studies have shown different ADC values in the core (56 ± 11 × 10−5 mm2/s); penumbra (71 ± 11) and final infarct (63 ± 11) 17 and that severe ADC reductions correlated with very low oxygen cerebral metabolic rates (CMRO2) consistent with irreversible tissue damage whereas penumbral regions had higher CMRO2 levels and more variable ADC values. 18 Such studies provide biological plausibility for attempting to use ADC or T2 relaxation values as markers that might be sufficiently sensitive/specific in detecting ischemic core–penumbral evolution. HRS could detect comparable volumes of ischemic injury from both T2 and ADC data (Figures 1C and 1D) in both ischemic rat models. The HRS-derived ischemic injury from ADC maps, while more challenging, could potentially be more accurate in defining core–penumbra, specifically at early time points (<1 day after injury for animal models; <7 days for clinical data). Minor variations between T2 and ADC results partially are due to one/both of the following reasons (see Supplementary Figure 6): (1) Some hyperintense regions (mainly from white-matter or enlarged ventricles) on the T2 maps remain hyperintense on the ADC maps, unlike the regions with restricted diffusion that are hypointense in the 1-day ADC maps. Hence, our current HRS method detects these regions as an ischemic lesion on the T2 but not the ADC maps. (2) ADC data are more sensitive than T2 data in detecting ischemic injury in the ventral-cortex, hippocampus, and striatum. This is partially due to healthy tissues surrounding the injury that have delayed diffusion restriction (as they evolve into penumbral tissue) while T2 relaxation increases have yet to develop. This also illustrates the dynamic nature of the core–penumbra. Because several studies have reported that ischemic lesions were undetected with DWI29,30 or that severe reductions in ADC normalized over time depending on the duration and severity of ischemia, 31 it is likely that serial measurements may be needed to improve MRI sensitivity to better estimate tissue injury. Recent reviews report existence of ‘mini-core’ and ‘mini-penumbra’ (interdigitation) and their spatiotemporal dynamics in IHC, 2 which HRS could detect noninvasively from MRI (Figure 2). The HRS temporal results in Figure 2C recapitulate that ischemic lesion volume decreases during the first 7 to 10 days after injury and then gradually increases to its final infract volume—an observation that we previously obtained from manually derived results. 25 The temporal trends of HRS-derived core–penumbra in Figure 2B also coincide with the concept of the penumbra transitions to core as ultimately manifested by this necrotic tissue forming areas of cavitation late after injury. Some investigators have attempted to improve predictability using automated postprocessing methods. 32 Although DWI determinations of lesion size have been correlated with outcome, 33 other investigators have found no such correlation. 34 Our results for RVM (Figure 1C) and BCAO-H (Figure 1D) models as well as AIS neonates (Figure 6B) raise the possibility that assessment of core–penumbra composition rather than total lesion volume has the potential to more accurately correlate with long-term outcomes as it estimates the degree of irreversibly injured tissue compared with that which is salvageable. Additional studies will be required to examine this possibility.
One advantage of HRS is that it does not use predefined exact thresholds which have limitations because of their ad-hoc nature and unreliability.12,14,35,36 HRS performs recursive splitting in a normalized image intensity space and converts the subregions from the HRS tree back to MR signal values, and then uses approximate normative ranges of MR values of healthy tissue, total lesion, and core–penumbra (Table 1) for classification. This ‘soft-threshold’ technique works for any MR data set and a range of values using ‘a priori’ knowledge (Supplementary Figure 3; Table 1). The approximate mean ADC threshold (mean ADC < 70 × 10−5 mm2/s) used in our HRS method to detect the ischemic core after neonatal AIS is very similar to the absolute ADC threshold values used by Rosso
Since data from postmortem histology2,9 are still the most reliable translational research method in identifying core–penumbra, we compared our MRI-based HRS with IHC results (Figure 3). Previous reports have shown that markers associated with cellular stress or structural demise (apoptosis-related) can estimate penumbral locations.
9
However, the core is often a region with continuing cell death and evolves into a cystic space (MAP2, HSP27; Figure 4A) or tissue regions exhibiting negligible staining (GFAP; Figure 4B). Manual and computational comparisons of these regions between corresponding histological and MRI sections (Figure 4; corresponding ADC results are in Figure 1A) show excellent concordance (Supplementary Table 2). The HRS detected core–penumbra from thinner (0.5 mm) MR slices illustrates striking resemblance with the core–penumbra regions observed in 50
Although DPM has been used for over a decade,35,37 it has several drawbacks.
13
Capturing MR-based PWI data requires contrast agent injection which, unlike in adults,11,12,35 is technically much more difficult to perform and also may be less safe in neonates who are at greater risk for renal injury.
1
As a result, there has been little research using PWI in neonates with HII.24,38 While arterial spin labeling is an option, it also is more difficult to acquire and results in less accurate perfusion values.38–40 In contrast to
Hierarchical Region Splitting can quantify a spectrum of ischemic injuries and their spatiotemporal evolution and has numerous applications including: (1) providing timely/sensitive indices to assist clinical decision making to determine which patients have potentially salvageable lesions warranting intervention;(2) determining which treatments (e.g., restoration of perfusion versus neuroprotection) might be more successful; (3) determining how and where the lesion is evolving 2 and whether intra- or perilesional treatments (e.g., drugs, 26 stem cells 25 ) might be more effective;and (4) using serial monitoring of the response to treatment to assess whether signal characteristics of salvageable tissues normalize to indicate recovery.
DISCLOSURE/CONFLICT OF INTEREST
The authors declare no conflict of interest.
Footnotes
ACKNOWLEDGEMENTS
The authors would like to acknowledge Dr Hui Rou Tian (Pediatrics, LLU) for RVM and BCAO-H surgical procedures; Sonny Kim (Research Imaging Center, School of Medicine, LLU) for neuroimaging; and Dr Jerome Badaut (Pediatrics, LLU) for use of histochemical equipment. The authors thank Dr Sean M Wilson and Ms Monica Rubalcava (Advanced Imaging and Microscopy Core that is supported by NSF Grant No. MRI-DBI 0923559 (SMW) and the LLU School of Medicine) for their kind assistance in obtaining IHC images.
References
Supplementary Material
Please find the following supplemental material available below.
For Open Access articles published under a Creative Commons License, all supplemental material carries the same license as the article it is associated with.
For non-Open Access articles published, all supplemental material carries a non-exclusive license, and permission requests for re-use of supplemental material or any part of supplemental material shall be sent directly to the copyright owner as specified in the copyright notice associated with the article.