
Abstract
The authors investigated the influence of variations in global cerebral blood flow (gCBF) on regional flow changes during visual stimulation. Global flow was varied using different end-expiratory CO2 values (Petco2) between 20 and 70 mm Hg. Visual stimulation was performed with a red LED-array flashing at 8 Hz. Blood flow was measured with O-15-butanol, continuous arterial blood sampling, and positron emission tomography (PET). Global flow changes surpassed the published values of O-15-H2O studies, better fitting the results of the inert gas technique (gCBF at 20, 40, and 70 mm Hg Petco2 ± SD was 31 ± 4, 48 ± 13, and 160 ± 50 mL 100 g−1 min−1, respectively). The relation between Petco2 and CBF in the current study was best described by an exponential rather than a linear function. At low Petco2, the activation-induced flow changes are moderately damped, whereas at high Petco2, they are nearly lost (ΔCBF (±SD): 52% ± 25%, 68% ± 22%, 16% ± 25% at Petco2 = 20, 40, 70 mm Hg, respectively).
Carbon dioxide is a metabolic end product of cerebral metabolism and a potent vasodilator that has been used since the third decade of the last century (Loevenhart et al., 1929). Although the exact mechanism is still debated, CO2 probably exerts its influence on global cerebral blood flow (gCBF) by decreasing extracellular pH, thus stimulating the production of nitric oxide in the brain tissue or inhibiting its decay (Iadecola, 1992). Evidence suggests that calcium-dependent constitutive nitric oxide synthase is responsible for CO2-induced NO (Moncada et al., 1991), but the exact anatomic source of CO2-induced NO is controversial. Although a direct influence of CO2 on cerebral vessels is unlikely, mediators, in addition to NO, cannot be excluded (Estevez and Phillis, 1997). Because values for arterial partial pressure of carbon dioxide (Paco2) largely depend on variable respiratory influences, it is a major cause of intra-and interindividual variation of gCBF in functional neuroimaging with positron emission tomography (PET) and baseline shifts in functional magnetic resonance imaging (fMRI). Although frequency changes in the EEG can be observed pointing to changed neuronal firing patterns (Pfurtscheller et al., 1978), it is generally believed that CO2 has no significant effect on metabolic rates within the Petco2 range between 20 and 70 mm Hg, which was investigated in this study (Siesjö, 1980).
Typical analysis procedures in functional neuroimaging for O-15-water and O-15-butanol PET, and to some extent those for fMRI, assume that the determination of absolute blood flow is not necessary after normalization for global flow because the relative flow changes due to the activating stimulus are representative of absolute changes. This normalization is either done by proportional scaling or covariation analysis (ANCOVA) (Friston et al., 1990). Since the work of Ramsay et al. (1993) and Shimosegawa et al. (1995) it is assumed that relative activation-induced regional blood flow (rCBF) changes are independent of gCBF. Whereas the proportional method better fits the assumed changes because of differences in Paco2, the ANCOVA seems to be better suited for an activation signal that is simply added to global flow. Both methods require linear additive or proportional influences (Friston et al., 1990).
In the current study, the assumption that changes in gCBF do not significantly influence visual activation-induced fractional rCBF changes relative to baseline was reevaluated. Similar to previous studies, global blood flow was altered by changing end-expiratory CO2 levels. In contrast with them, O-15-butanol rather than O-15-water was used as a blood flow tracer. The greater diffusibility of this tracer (Berridge et al., 1991) makes it ideally suited to cover a wider range of Petco2 levels with greater accuracy than O-15-water and without the need to compensate for limited diffusion. The authors investigated the influence of CO2 in gCBF and rCBF over a much wider range of Petco2 than previous authors did.
MATERIALS AND METHODS
Ten normal healthy male volunteers with a mean age of 25.9 ± 3.3 years (range 21 to 30 years) participated in the current study. They provided their informed written consent for the experimental procedure that had been approved by the ethics committee of the University of Duesseldorf and by legal authorities. Each subject received an anatomic MRI (MPRAGE, T1-weighted) on a Siemens Vision 1.5 T MR scanner (Siemens, Erlangen, Germany) at a resolution of 0.9 × 0.9 × 1.25 mm (x,y,z).
The authors immobilized the subjects' heads to the PET headrest with a resin cast and adhesive band. A catheter was placed in one radial artery to draw blood samples for pH, Paco2, HCO3, Pao2, and base excess (BE) measurements (AVL Compact 2 blood gas analyzer; Bad Homburg, Germany) and to determine mean arterial blood pressure (RR) and heart rate (HR) immediately before and after scanning. During the scan, the arterial input curve of O-15-butanol was determined by the Scanditronix continuous blood sampling system (ABSS) (Eriksson et al., 1988) at a pump speed of 5 mL/min crosscalibrated to the PET camera. Arterial radioactivity was measured each second by coincidence detection, beginning shortly before tracer injection and continuing for 3 minutes. O-15-butanol was administered intravenously. Each subject received 12 scans at 6 different Petco2: 20, 30, 40, 50, 60, and 70 mm Hg. Volunteers inhaled the gas mixture through a mouthpiece and expired through their nose. End-expiratory Pco2 levels were produced by hyperventilation of room air or adding CO2 to it and were determined with a Datex capnograph. The output was sent to a microcomputer and displayed, so that respiratory irregularities like shallow breathing could be detected easily and instantly. Otherwise these irregularities could have influenced the relation between Paco2 and Petco2 (Ibler et al., 1992). Because the average Petco2 was actually used to reach the predefined CO2 levels, it was used in most instances instead of Paco2. Petco2 is temporally better related to the actual values during PET scanning, because Paco2 was only measured before and after scanning. The related study of Ramsay et al. (1993) and many recent studies used this procedure, so it is also better suited for comparisons. The Petco2 level was reached at least 2 minutes before the measurement began. These conditions were repeated once for the closed-eye control and for the flicker-light condition at 8 Hz red light using a home-built LED-array. This frequency has previously been shown to elicit maximal regional blood flow changes in visual cortex (Fox and Raichle, 1984). The sequence was changed in a counterbalanced way so that half of the subjects had the activation first and the other half the rest condition. Within these groups one half started at 20 mm Hg Petco2 with increasing and the other half at 70 mm Hg with decreasing CO2 concentrations. The HR+ Siemens PET scanner (Siemens) was operated in three-dimensional mode. The optimum spatial resolution in all dimensions was 4.1 mm in the center of the field of view (Brix et al., 1997). The resulting matrix consisted of 63 slices with 128 × 128 points in plane at a nominal resolution of 2.1 × 2.1 × 2.45 mm (x, y, z). Radiation coming from outside of the scanner's field of view was minimized with the help of a lead ring (Neuroinsert) around the subject's neck. Acquisition began with the appearance of radiation in the field of view. The total scan period was 101 seconds, using a multiframe dynamic measurement technique: 2 frames of 3 seconds, 3 frames of 5 seconds, and 8 frames of 10 seconds. The emission data were reconstructed with filtered backprojection using a Hann-filter with a cutoff frequency of 0.33 resulting in a reconstructed image resolution of 6.5 mm.
The activity was varied between 740 MBq at 20, 550 MBq at 30, 40, and 50, and 370 MBq at 60 and 70 mm Hg Petco2. This was necessary to keep image count statistics approximately constant and to reduce dead-time losses during high gCBF conditions.
The scans of each individual were realigned to the scan at 40 mm Hg without visual stimulation using the software package MPItool (Pietrzyk et al., 1994). The anatomic MR data set also was coregistered to this image.
Volumes of interest (VOI) in visual cortex (V1) were determined semiautomatically from the PET scans by subtracting all of the control from the activation conditions at a threshold that left a contiguous region in V1/V2 with only small contributions of the surrounding cortical regions. Gray and white matter regions were defined using a thresholding procedure in the 40-mm Hg Petco2 rest condition under visual control. The gray matter VOI was determined at the level of the lateral ventricles by raising the threshold in the normocapnic rest state image until an interruption in the cortical outline appeared. Thus, the contamination from white matter was minimized and the overall size of the VOI was similar between subjects. For determining the white matter VOI, an interval of intensities was chosen that left a rim of 0.5 cm between this VOI and that of the gray matter in the same slice. For the whole brain VOI, the threshold was set to a value in which the ventricles were just excluded. Anatomic images were used for verifying the position of the VOI.
To determine gCBF and rCBF in dependency of the different Pco2 levels, the kinetics of O-15-butanol, which is freely diffusible across the blood–brain barrier, was mathematically described by the well-known one-tissue compartment model (Kety and Schmidt, 1948; Herscovitch et al., 1983; Gjedde et al., 1980). This model procedure has already been applied in the authors' previous work on quantitation of rCBF, using O-15-butanol and PET (Herzog et al., 1996) as a reference for the current article. As a first step, all time-activity curves were fitted to the solution of the one-tissue compartment model by nonlinear regression. Here the fitted parameters were blood flow, dispersion correction factor, partition coefficient, and time shift between radial and carotid arterial radioactivity. As described in Herzog et al. (1996), the dispersion correction parameter was systematically varied and the value leading to the least mean square root error was assessed. Although the individual fits showed a good adaptation to the measured data, there still was some intraindividual variation of the correction factor for dispersion and partition coefficient. Therefore, the following constraints were introduced in a second step: the dispersion correction parameter was fixed to the average of all fits for the 12 different Petco2, furthermore the partition coefficient was set to 0.77, which is equal to the value found by Gjedde et al. (1980) in rats and by Herzog et al. (1996) in humans.
The statistical comparison between control and activation was performed by means of a two-tailed t-test and a statistical threshold of P = 0.05, Bonferroni-corrected in case of multiple comparisons.
RESULTS
Table 1 summarizes the results of blood gas and RR measurements at the different Petco2 and activation conditions. Figure 1 shows the results of dynamically measured arterial and end-expiratory Pco2 values covering the first 80 seconds after abruptly raising the inspiratory Pco2 from 0% to 12%. This was done in one subject to study the dynamic changes of the two parameters during initiation of a new Petco2 level (Fig. 1). Arterial blood gases were taken every 6 seconds, Petco2 was determined from breath to breath. There was no task apart from breathing 25 L gas mixture per minute. The two curves showed an identical temporal behavior. Although there was a good correlation between arterial and end-expiratory CO2 values, the authors found, like Ramsay et al. (1993), an increasing difference between the two and a higher variance at higher Pco2. The dependence of CBF on Petco2 and Paco2 is depicted in Figs. 2 and 3.
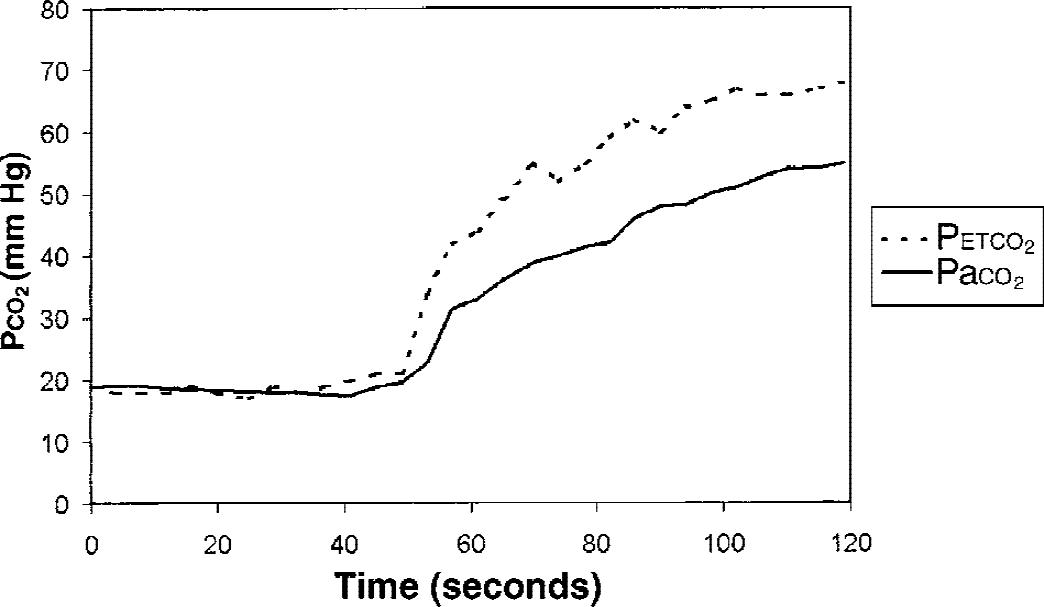
Time course of Paco2 and Petco2 in a single subject.
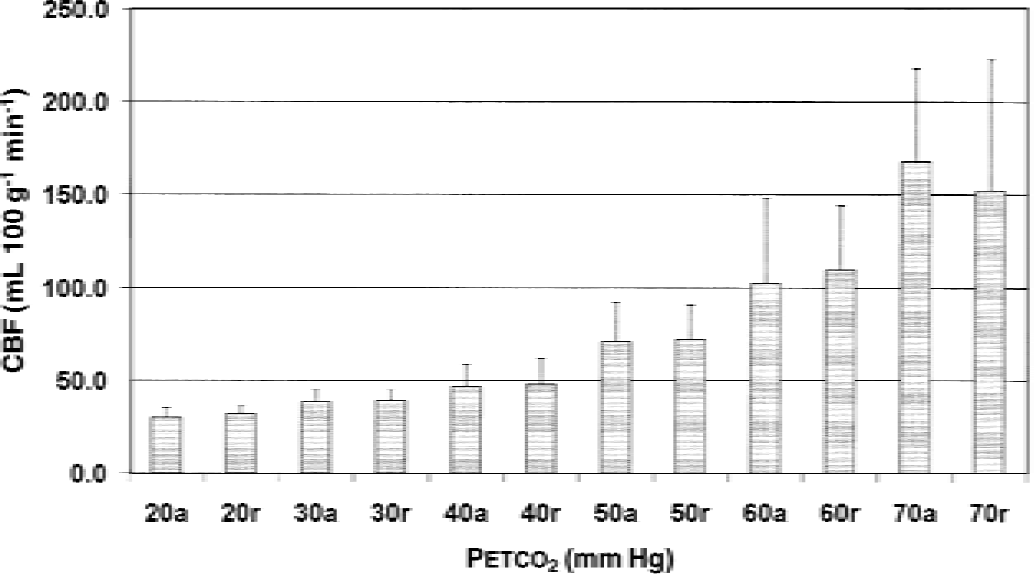
Mean group global cerebral blood flow (CBF) values at different Petco2.
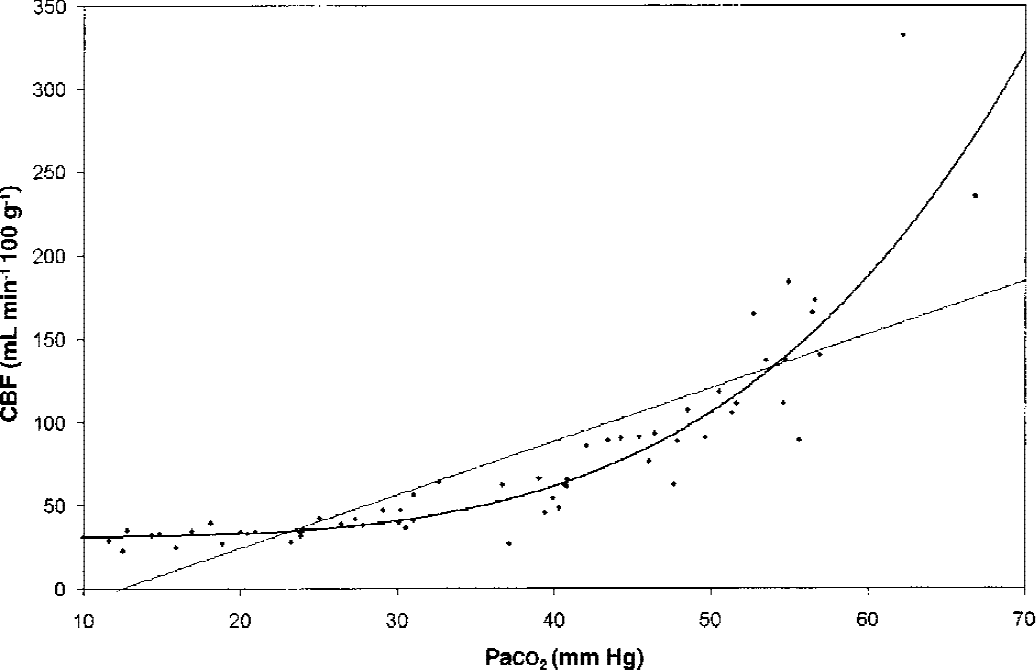
Group averaged values for global cerebral blood flow (gCBF) in relation to Paco2 and fitted linear and polynomial curves.
Comparison between flicker light activation and rest
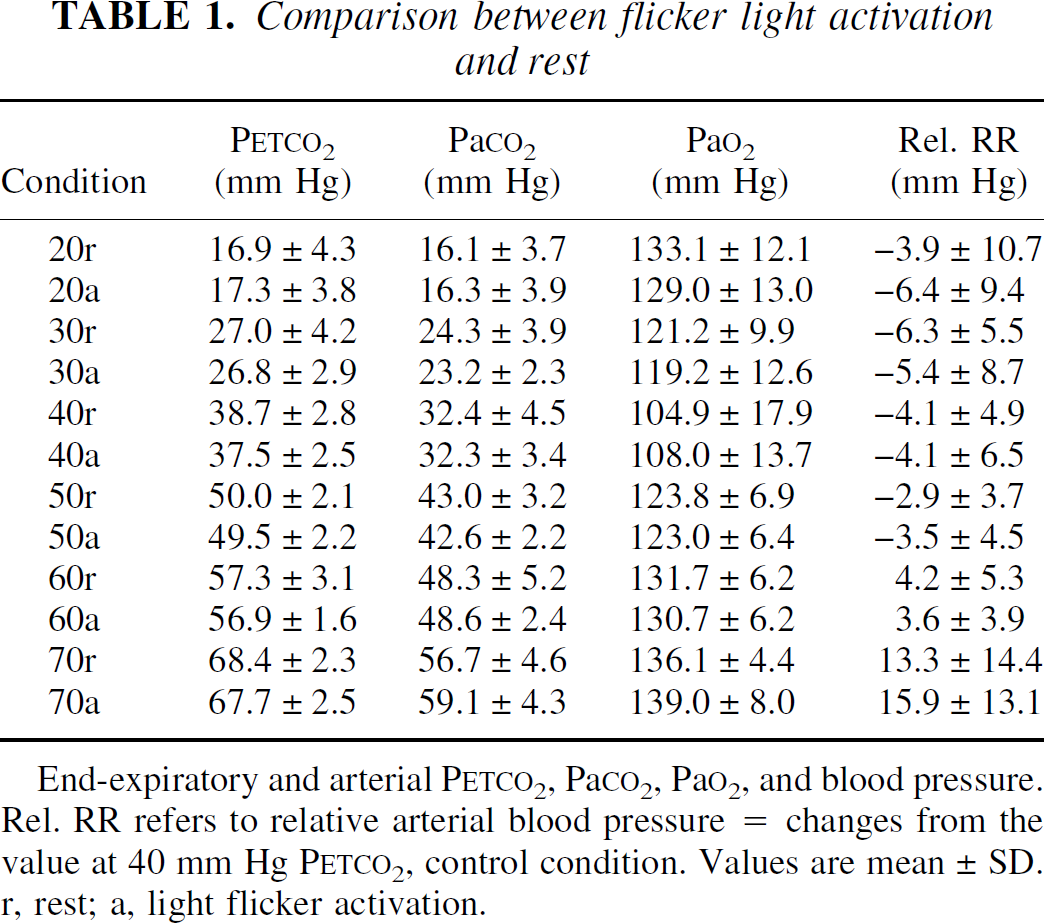
End-expiratory and arterial PETCO2, PaCO2, PaO2, and blood pressure. Rel. RR refers to relative arterial blood pressure = changes from the value at 40 mm Hg PETCO2, control condition. Values are mean ± SD. r, rest; a, light flicker activation.
RR increased during hypercapnia and decreased during hypocapnia, whereas HR was lowest during normocapnia and increased during hypo-and hypercapnia, albeit much stronger in the latter condition (Table 1). There was a rise in Pao2 at increased respiratory rates during hypo-and hypercapnia, the saturation always being greater than 95%. No significant differences in HR, RR, Pao2, Paco2, or Petco2 levels between activation and rest were present (two-tailed t-test, P > 0.1). Only minor discomfort because of these respiratory challenges was noted. Some volunteers complained of restlessness and a feeling of cold during hyperventilation and dyspnea and a sensation of warmth in high-CO2 conditions. One subject showed a mild cramp in both hands during hyperventilation that resolved spontaneously with normal breathing after the PET scan.
Dependence of CBF on Petco2 in the different VOIs is reported in Table 2 and Fig. 2. At normocapnia, the global blood flow amounts to 48 ± 13 mL 100 g−1 min−1. This value decreases to 31 ± 4 at the lowest Petco2 and increases to 160 ± 50 mL 100 g−1 min−1 at the highest Petco2 level.
Group average gCBF values at rest for whole brain, gray and white matter
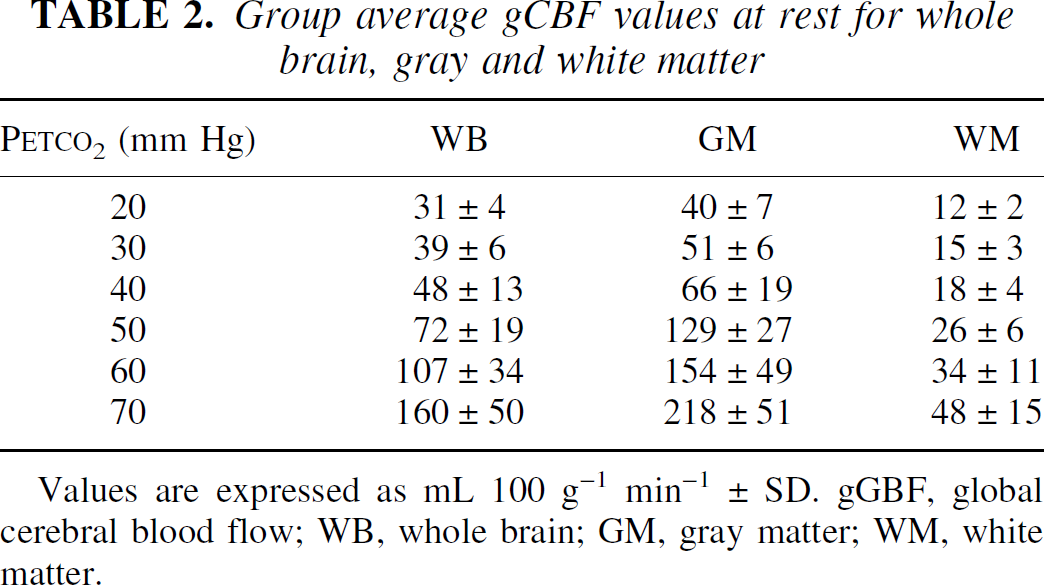
Values are expressed as mL 100 g−1 min−1 ± SD. gGBF, global cerebral blood flow; WB, whole brain; GM, gray matter; WM, white matter.
Figure 3 demonstrates that an expression of the general form CBF = A + B × Paco2C with the parameters (A = 31, B = 0.000011, and C = 4.025) explained the relation between arterial Pco2 and gCBF significantly better than a straight line (with the parameters A = −40.1 and B = 3.21) as the confidence interval for parameter C lies between 3.25 and 4. The sum of squared residual errors for CBF was 28723 for the polynomial and 64989 for the linear function.
The activation-induced rCBF increases in V1 were highly significant at all Petco2 levels apart from 70 mm Hg (Table 3). At this level the authors only found a trend to activation-induced rCBF increases when Bonferroni-correction was not applied (Fig. 3).
Comparison between flicker light activation and control condition at different PETCO2
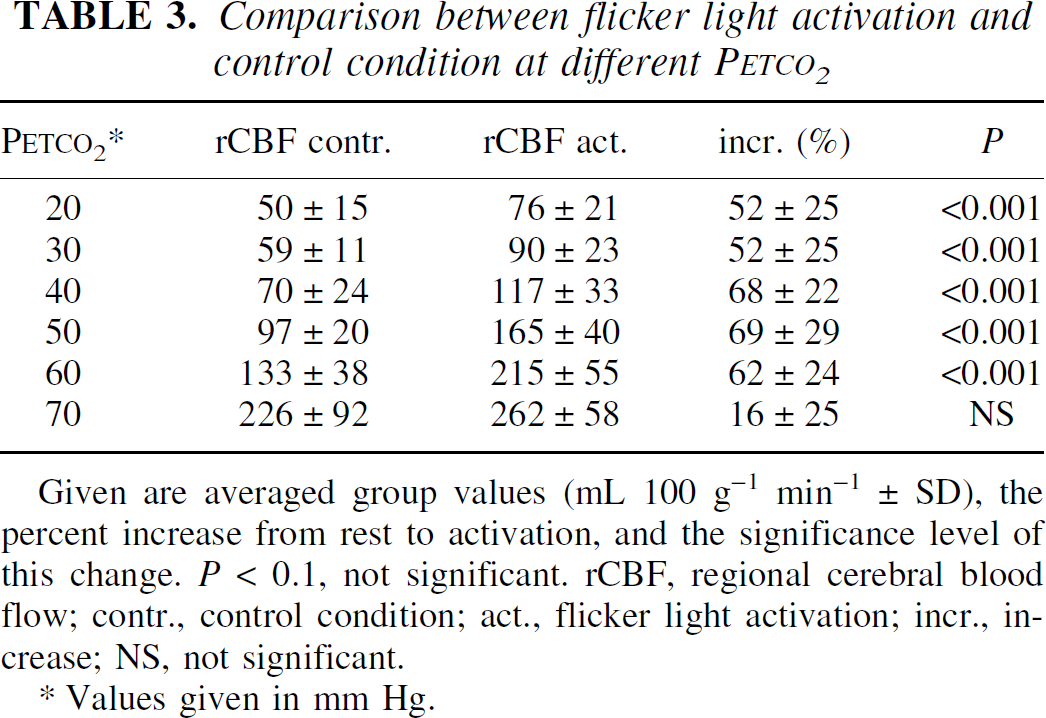
Given are averaged group values (mL 100 g−1 min−1 ± SD), the percent increase from rest to activation, and the significance level of this change. P < 0.1, not significant. rCBF, regional cerebral blood flow; contr., control condition; act., flicker light activation; incr., increase; NS, not significant.
Values given in mm Hg.
The comparison of differences between percent rCBF increases of the different Petco2 levels revealed a significantly greater activation-induced rCBF increase at 40 versus 20 and 70 mm Hg after Bonferroni correction for 15 comparisons (P < 0.05). All other comparisons were not significant. Without this correction significantly lower flow increases were present at 70 mm Hg compared with all other conditions and at 20 and 30 mm Hg compared with 40 and 50 mm Hg.
DISCUSSION
The mean gCBF for whole brain of 48 ± 12 mL 100 g−1 min−1 measured at normocapnia is close to the generally expected value of 50 mL 100 g−1 min−1, based on different methods (Lassen, 1985), and is nearly identical to the value of 48.6 ± 8 mL 100 g−1 min−1 that was reported by the authors' group and for which a different PET scanner operating in two-dimensional mode was used (GE/Scanditronix PC4096+; Scanditronix, Uppsala, Sweden) (Herzog et al., 1996). The normocapnic values of Ramsay et al. (1993) with 37.2 ± 3.9 are less than the authors, those of Shimosegawa et al. (1995) with 53.7 ± 6.3 mL 100 g−1 min−1 are in the same range but comprise only the visual cortex. Presumably the gray matter portion in these ROIs was larger than in the authors' whole brain VOI. Compared with the current value of 70 ± 24 mL 100 g−1 min−1 in the VOIs of V1, this result is again lower. The discrepancy between previous studies and the current study may be a result of the tracer chosen:Berridge et al. (1991) has shown that using butanol as a flow tracer a much wider range of blood flow values is detected compared with water, even in the resting state. Greater CBF values are underestimated by the water method. In gray matter, CBF values up to 218 mL 100 g−1 min−1, in V1 even 260 mL 100 g−1 min−1, were measured during hypercapnia. Previous studies have shown that butanol gives reliable results at least up to 170 mL 100 g−1 min−1 and no deviations are expected for flows up to 400 mL 100 g−1 min−1 (Berridge et al., 1991; Herscovitch et al., 1987). Because a validation of this technique for high flow values is lacking, the authors' corresponding results should be considered with the appropriate caution. The higher standard deviations in the current values may be in part due to the greater range of flow values detected by butanol (Berridge et al., 1991) and to the somewhat smaller number of measurements in each Petco2 group compared with the experimental groups of Ramsay (1993) and Shimosegawa (1995). Decreasing Petco2 to 20 mm Hg decreased gCBF to 31 ± 4 mL 100 g−1 min−1, increasing it to 70 mm Hg increased gCBF to 160 ± 50 mL 100 g−1 min−1. The fractional increases because of CO2 were similar in white matter, gray matter, and whole brain regions, with absolute CBF values being much lower in white matter than in gray matter.
The blood flow decreased to 65% during maximal hyperventilation compared with normocapnia in the current study lies within the range of values published by other groups for similar Petco2:Kety and Schmidt (1946) reported a reduction to 67%, Ramsay et al. (1993) to 65%, Shimosegawa et al. (1995) to 68%. Again the absolute values of the latter two studies are lower than in the current study, which are close to those of Bednarczyk et al. (1990). As the CBF curve seems to reach a lower limit at 50% to 60% of the value at normocapnia, the hypothesis has been put forward that at this Paco2 value an emergency mechanism triggered by hypoxia takes over to increase CBF to a value that saves the healthy brain from deleterious undernourishment (Wasserman and Patterson, 1961). This corresponds well to the threshold of 50% to 60% oxygen saturation at normocapnia when the same mechanism becomes effective (Kassissia et al., 1995; LaManna et al., 1984).
The blood flow increase to 160 mL 100 g−1 min−1 is unparalleled in PET as the highest investigated Petco2 had been 54.8 mm Hg (Ramsay et al., 1993). Here a gCBF increase of 79.6% was found. Shimosegawa et al. (1995) observed a 35.6% increase at 46 mm Hg. Both results correspond well to the current results, although, as stated before, the absolute gCBF values in these experiments were substantially lower than in the current study.
Compared with investigations that used the Kety Schmidt technique, the authors also found a reasonable congruence:Kety and Schmidt (1948) reported a 123% increase at a Paco2 of 59 mm Hg, which fits best the current Petco2 group of 60 mm Hg. Notably, the corresponding Paco2 in the current results are lower, whereas the amount of CO2 in the inspired air and arterial pH was the same as in Kety's study.
Compared with CO2 investigations in anesthetized animals (Grubb et al., 1974; Reivich, 1964), the current results show important differences; the gCBF increases because of CO2 observed in the current study are much greater and show a clear supralinear relation. The authors believe that species differences and the use of narcotics are responsible for the biggest part of this difference. Pentobarbital, for instance, has been shown to flatten the response to CO2 in man (Schieve and Wilson, 1953). Similar nonlinear relations have been found by Ramsay et al. (1993) and Kety and Schmidt (1948), a fact that underlines the differences in blood flow behavior due to CO2 changes between anesthetized animals and awake man.
Contrary to previous studies, not only the absolute but also the fractional changes of activation-induced rCBF depends on global CBF values; the relative flow changes are greater during eucapnic and moderately hypercapnic values than during hypocapnia and nearly disappear at the authors' highest Petco2. Similar to Ramsay et al. (1993) and Shimosegawa et al. (1995), the authors observed no significant difference between 40, 50, and 60 mm Hg Petco2, but unlike their results the authors found significant differences in the fractional rCBF changes between this group of Petco2 and 20/30 mm Hg, whereas rCBF increases nearly vanished at 70 mm Hg.
The fact that no statistically significant difference was observed between activation and control at 70 mm Hg Petco2 may in part result from the increased variance of flow values, but nevertheless the mean fractional change itself is much less than at lower Petco2. Obviously the hemodynamic response to activation becomes damped at these high gCBF values. This is supported by the observation that subtracting flow-normalized data sets at Petco2 of 70 mm Hg hardly showed any activation (Fig. 4). It seems possible that this is attributable to beginning narcotic influences of CO2, but the volunteers in the current study reported no disturbance of consciousness and 70 mm Hg was still less than the known threshold of a narcotic effect in normal adults (Woodbury and Karler, 1960). A more realistic explanation is that at this CO2 level the pial arteries are near a limit of vasodilatation, which cannot be further influenced by neuronal activation. Although experiments in the rat model show that gCBF increases up to a Petco2 level of 160 mm Hg (Berntman et al., 1979), again species differences and the influence of narcotics used in the animal model have to be considered. Experimental data reviewed by Iadecola and Zhang (1994) demonstrated that NO synthase blockers lose their influence on CO2-induced gCBF increases between 80 and 100 mm Hg. In addition, the gCBF curve reported by Berntman et al. (1979) showed a bend at 80 mm Hg Paco2. This may indicate that a different mechanism of flow increase sets in at these extreme Petco2.
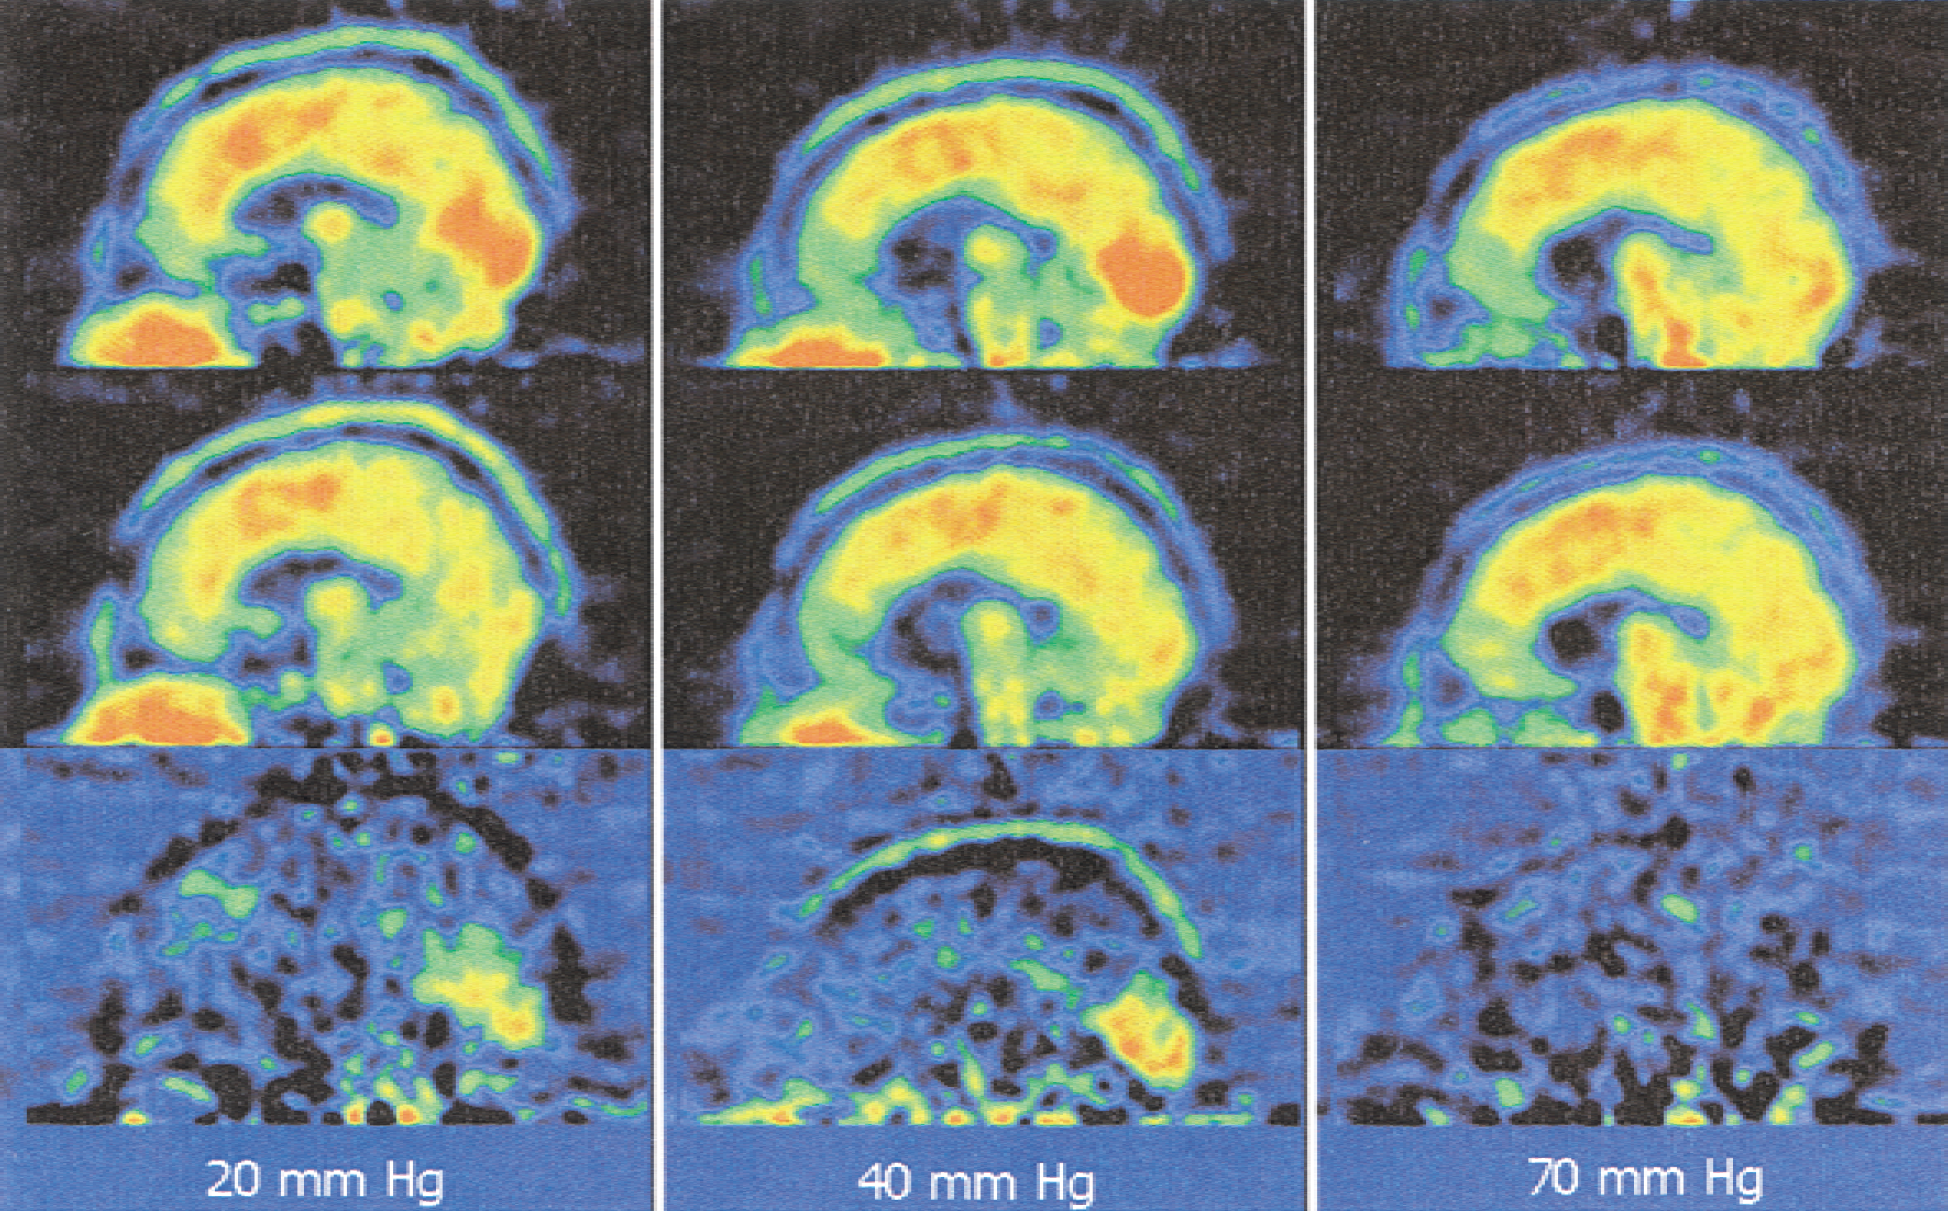
Subtraction (bottom) of an individual data set with activation (top) and rest (middle) at different Petco2.
In congruence with preceding studies on the influence of gCBF changes on activation-induced rCBF, the absolute rCBF differences increased between 20 and 60 mm Hg. Assuming that Pco2 does not change the metabolic rates in the brain at these levels, this is evidence against a tight coupling between metabolic needs and blood flow. Neuronal activation produces greater rCBF increases at higher gCBF. Substrate shortage is not the regulating factor in cerebral CBF regulation, although, as stated above, there is an emergency mechanism that sets a lower limit to blood flow during hypoxia (Lassen, 1959). Although other mechanisms like NO have become the focus of interest during the last years, the authors emphasize the old hypothesis that claims that CBF is controlled by periarteriolar Pco2 (even if indirectly, for example, through NO). Stable venous Pco2 values during changing CBF support this view (Kogure et al., 1970). The attractive point of this mechanism would be that consumption not shortage of oxygen is the regulating factor, which is eventually the same under normal conditions. Oxygen is the most critical substrate in brain metabolism as its tissue partial pressures drop to less than 3 mm Hg (LaManna et al., 1984) and its diffusion is reported to be barrier-limited (Kassissia et al., 1995). Limited diffusion over the blood–brain barrier means that CBF has to increase supralinearly compared with CO2 production (Buxton and Frank, 1997), as is the case for the relation between Petco2 values and CBF in the current study.
In conclusion, the current investigation showed that an exponential relation between CBF and Petco2 is observed if O-15-butanol with its superiority in tracing high flows is applied in awake human subjects. The additional percent CBF change because neuronal activation is constant between 40 and 60 mm Hg Petco2 but less during hyperventilation and nearly absent at high Petco2 values. Therefore, the authors propose to control Petco2 in studies that are likely to change respiration, that is, experiments with strong muscular activation, emotional or painful stimuli. This necessity becomes even more evident considering the different influence of Pco2 on cerebral and muscular flow, that already led to erroneous activations in previous experiments (Reiman et al., 1989; Drevets et al. 1992). In such studies, Petco2 should be measured to stabilize or at least document this parameter between conditions. Although differences in the Petco2 range between 40 and 60 mm Hg should be correctable using either proportional or ANCOVA, the authors believe that neither of these methods is able to fully correct for the nonlinear differences in relative rCBF changes during hyperventilation and high Petco2. Issues concerning the CO2 influences on summed flow-normalized count data sets, the typical technique for activation studies, and the period for which count data have to be summed lie beyond the scope of the current article.
Footnotes
Acknowledgments:
The authors are indebted to Mr. M. Lang and his colleagues of the Institute for Nuclear Chemistry for the production of O-15-Butanol, and to Elisabeth Theelen and Suzanne Schaden for their technical assistance.