
Abstract
Localized 1H nuclear magnetic resonance spectroscopy has been applied to determine human brain gray matter and white matter glucose transport kinetics by measuring the steady-state glucose concentration under normoglycemia and two levels of hyperglycemia. Nuclear magnetic resonance spectroscopic measurements were simultaneously performed on three 12-mL volumes, containing predominantly gray or white matter. The exact volume compositions were determined from quantitative T1 relaxation magnetic resonance images. The absolute brain glucose concentration as a function of the plasma glucose level was fitted with two kinetic transport models, based on standard (irreversible) or reversible Michaelis-Menten kinetics. The steady-state brain glucose levels were similar for cerebral gray and white matter, although the white matter levels were consistently 15% to 20% higher. The ratio of the maximum glucose transport rate, Vmax, to the cerebral metabolic utilization rate of glucose, CMRGlc, was 3.2 ± 0.10 and 3.9 ± 0.15 for gray matter and white matter using the standard transport model and 1.8 ± 0.10 and 2.2 ± 0.12 for gray matter and white matter using the reversible transport model. The Michaelis-Menten constant Km was 6.2 ± 0.85 and 7.3 ± 1.1 mmol/L for gray matter and white matter in the standard model and 1.1 ± 0.66 and 1.7 ± 0.88 mmol/L in the reversible model. Taking into account the threefold lower rate of CMRGlc in white matter, this finding suggests that blood–brain barrier glucose transport activity is lower by a similar amount in white matter. The regulation of glucose transport activity at the blood–brain barrier may be an important mechanism for maintaining glucose homeostasis throughout the cerebral cortex.
Human brain function depends critically on a continuous supply of glucose from the blood. Glucose is transported across the blood–brain barrier by facilitated diffusion mediated by specific transporter (GLUT) proteins. The GLUT-1 isoform is particularly abundant in the capillary endothelial cells of the blood–brain barrier (Pardridge et al., 1990). Because glucose transport is the first step in a cascade of energy-producing steps, such as glycolysis and oxidative phosphorylation, knowledge of the underlying transport mechanism is important for understanding cerebral glucose metabolism and energy production. Further, glucose transport may become rate controlling for metabolism in several clinical situations, such as hypoglycemia, seizures, diabetes, and Alzheimer's disease (Siesjö, 1978; Vannucci et al., 1997).
Nuclear magnetic resonance (NMR) spectroscopy has previously been used to detect cerebral glucose and to establish Michaelis-Menten parameters for glucose transport in vivo in humans (Gruetter et al., 1992, 1996, 1998) and in animal models (Gruetter and Choi, 2000; Mason et al., 1992; Van Zijl et al., 1997). The detection of glucose by NMR spectroscopy in human studies has been limited to relatively large volumes of 27 to 36 mL containing a mixture of gray and white matter and cerebrospinal fluid. It has been well established that there is a large difference in the cerebral metabolic rate of glucose (CMRGlc) between gray and white matter (Mason et al., 1999; Pan et al., 2000; Phelps et al., 1979; Reivich et al., 1979). This suggests that the glucose transport kinetics and/or the absolute glucose concentrations between gray and white matter may substantially differ.
The aim of this study was to measure the absolute steady-state glucose concentrations in human cerebral gray and white matter by localized 1H NMR spectroscopy as a function of the plasma glucose concentration. To accomplish this, we developed a multivoxel pulse sequence that allowed simultaneous and rapid measurement of gray and white matter glucose concentrations at 4 T. Despite the relatively small volumes of 12 mL used in this study, each magnetic resonance spectroscopy voxel was composed of a mixture of gray and white matter. The exact gray and white matter composition of each voxel was established by quantitative T1 relaxation imaging. The results were fitted with both the conventional Michaelis-Menten model (Lund-Andersen, 1979) and the reversible kinetic model of glucose transport (Cunningham et al., 1986; Mahler and Cordes, 1971) to obtain parameters for human cerebral gray and white matter. The reversible Michaelis-Menten transport model has recently been used to describe glucose transport across the human blood–brain barrier (Gruetter et al., 1998). The results were compared with previous magnetic resonance spectroscopy measurements in a similar brain region at 4 T of the rate of glucose oxidation in gray and white matter. The comparison suggests that brain glucose transport may be regulated with glucose consumption to maintain relatively uniform concentrations of glucose throughout the brain.
MATERIALS AND METHODS
Human subjects
Four normal human subjects (three men, one woman) were studied in accordance with Institutional Review Board guidelines for research in human subjects. The subjects were 41 ± 4 years of age and weighed 64 ± 11 kg. All subjects fasted overnight. A catheter was placed in each antecubital vein for infusion of glucose and collection of venous blood samples. Glucose was infused according to a previously described glucose clamp protocol (Shulman et al., 1990) with the following modifications. d-glucose (50% w/v) was infused at a variable rate to maintain target glycemia, which was approximately 10 mmol/L and approximately 15 mmol/L after the first and second ramp, respectively. For all subjects the target glycemia level was reached within 10 minutes after the start of the ramp. Somatostatin was infused in conjunction with glucose (0.1 μg/kg per minute) to suppress endogenous insulin secretion. The target glycemia levels were maintained for 30 to 40 minutes with a maximum plasma glucose variation of approximately 5% to 10%. During the ramp and steady-state periods, blood was sampled every 5 and 10 minutes, respectively. Plasma glucose levels were obtained immediately on an Analox GM7 glucose analyzer (Analox Instruments, London, U.K.) and used to adjust the infusion rate.
Magnetic resonance imaging and spectroscopy
All experiments were performed on a 4.1-T whole-body NMR system interfaced to a Varian INOVA console (Varian, Palo Alto, CA, U.S.A.). The gradient system was capable of switching 20 mT/m in 1.3 milliseconds. Subjects were placed supine on the magnet bed and the head was immobilized with foam in a specially designed head holder. Radiofrequency transmission and signal reception were performed with a radiofrequency coil consisting of two orthogonal surface coils (13 cm in diameter), driven in quadrature. The exact spatial positions of the brain and the localized volume used for spectroscopy were determined from coronal and sagittal multislice T1-weighted FLASH images. The homogeneity of the main magnetic field was optimized over a 2-cm-thick slice using an improved version of the FASTMAP routine (Gruetter, 1993; Shen et al., 1999), generally resulting in whole-slice water line widths of 7 to 10 Hz.
Localized 1H NMR spectra were obtained with a 3,2-DRYSTEAM sequence (Moonen and van Zijl, 1990) executed with 1-millisecond optimized excitation pulses (de Graaf, 1998) and TR/TE/TM = 2,500/12/100 milliseconds. Unwanted coherences were eliminated by 3-millisecond and 5-millisecond 15 mT/m sinusoidal magnetic field gradients during echo time and mixing time, respectively. The basic sequence selected a 6 × 2 × 4 (48 cm3) voxel, after which a longitudinal Hadamard localization sequence during mixing time divided this in three 12-mL voxels (1.5 × 2 × 4 cm3), containing predominantly gray or white matter. The Hadamard encoding was executed with 4-millisecond hyperbolic secant inversion pulses (bandwidth 2.5 kHz). The contamination of extracranial lipids was minimized by nulling the signal with two slice-selective inversion pulses in the x direction followed by a 240-millisecond recovery time. Water suppression was achieved with three 25-millisecond chemical shift-selective pulses (truncated at 10%) preceding the sequence and two chemical shift-selective pulses during the mixing time.
The large baseline originating from macromolecular compounds (Behar et al., 1994) was measured on each subject for all voxels. Based on the large T1 difference between metabolites (1,000 to 1,500 milliseconds;Hetherington et al., 1994) and macromolecules (250 to 350 milliseconds), the metabolite resonances can be nulled by extending the sequence with 2 nonselective 4-millisecond adiabatic inversion pulses with intrapulse delays of 1,950 and 550 milliseconds and a repetition time of 6,000 milliseconds.
The exact tissue composition of each voxel was determined from T1-based image segmentation maps according to a previously described protocol (Hetherington et al., 1996). In short, quantitative T1 relaxation maps were generated for 15 consecutive slices (1.5-mm slice thickness) by nonselectively inverting the longitudinal magnetization and sampling the recovery to thermal equilibrium by slice-selective, low-angle (∼20°) excitation at seven recovery times given by (30 + n.282) millisecond, with 0 ≤ n ≤ 6. T1 relaxation time constants were obtained by fitting each pixel as a function of the recovery time to a single exponential, taking into account perturbations resulting from the low-angle excitation pulses. Image segmentation into noncerebral tissue (T1 < 600 milliseconds), white matter (600 milliseconds ≤ T1 < 1,100 milliseconds), gray matter (1,100 milliseconds ≤ T1 < 2,200 milliseconds), and cerebrospinal fluid (2,200 milliseconds ≤ T1) was based on previously determined T1 ranges for these tissue types (Hetherington et al., 1996).
1H NMR spectra were obtained with a time resolution of approximately 1.5 minutes. Processing was performed by initial frequency shifting of spectra to account for drifts in the main magnetic field (with a maximum of ±0.25 Hz between subsequent spectra), after which spectra during periods of constant glycemia were summed. Next, the residual water resonance in the summed spectra was removed by a user-independent HSVD algorithm (Barkhuysen et al., 1987). The individual resonances were quantified with an LC model algorithm (Provencher, 1993), using a l inear c ombination of model solutions of aspartate, choline, creatine, glucose, glutamate, glutamine, myo- inositol, N-acetyl aspartate (NAA), lactate, and taurine. The measured macromolecular baseline was also treated as a model solution spectrum. All resonances were quantified at the highest glycemia level. Next, the glucose resonances in the difference spectra were quantified, after which the glucose at the lower glycemia levels was determined by extrapolating from the 1H NMR spectrum at the highest glycemia level. The absolute glucose concentration in each voxel was calculated from the NAA (or tCr) concentrations in gray and white matter according to
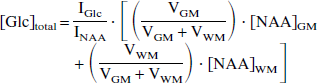
where [Glc]total is the glucose concentration within the entire 12-mL voxel and IGlc and INAA are the relative intensities of the glucose and NAA resonances obtained with LC model, respectively. These include differences in the number of protons but ignore any differences in T1 and T2 relaxation. VGM and VWM are the volumes of gray and white matter within 1 voxel, respectively, and are determined from the segmentation maps. [NAA]GM and [NAA]WM represent the NAA concentrations in gray (9.9 mmol/L) and white matter (10.5 mmol/L), respectively (Hetherington et al., 1996; Pan et al., 1998; Pouwels and Frahm, 1998).
The glucose concentration in gray and white matter is obtained according to
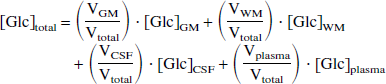
where [Glc]total is the glucose concentration in the entire 12-mL voxel as determined by Eq. 1 and [Glc]GM, [Glc]WM, [Glc]CSF, and [Glc]plasma are the glucose concentrations in gray and white matter, cerebrospinal fluid, and plasma, respectively. In all the following, it is assumed that [Glc]CSF is approximately 0.65 [Glc]plasma (Kusmierz et al., 1989). The cerebral blood volume fraction was assumed to be approximately 3.5% (Sabatini et al., 1991). However, the actual contribution from the blood compartment will be smaller because of partial signal suppression ∼30%) by diffusion gradients (∼10 s/mm2;Gruetter et al., 1998). Because three separate voxels are acquired on each subject for each glycemia level, Eq. 2 can be solved for [Glc]GM and [Glc]WM.
Kinetic modeling
The steady-state brain and plasma glucose concentrations were analyzed to determine transport kinetics using two previously described models. Only transport of glucose across the blood–brain barrier is considered; the contributions of the endothelial compartment and the double-membrane kinetics are ignored because they represent only a small percentage of the total volume in which the measurement is made.
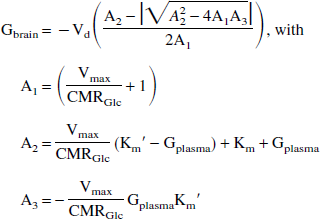
The first model describes the transport process by irreversible, symmetric Michaelis-Menten kinetics (Gruetter et al., 1996; Lund-Andersen, 1979). This model assumes identical Michaelis-Menten kinetics for the forward and reverse fluxes through GLUT-1. Including the irreversible conversion of intracerebral glucose to glucose-6-phosphate by hexokinase, the model can be described as
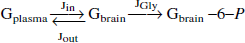
Under steady-state conditions (that is, d(Gbrain)/dt = 0), the forward flux Jin equals the sum of the reversed flux Jout and the glycolytic flux JGly. As a result, the steady-state brain glucose concentration during irreversible, symmetric Michaelis-Menten transport is given by
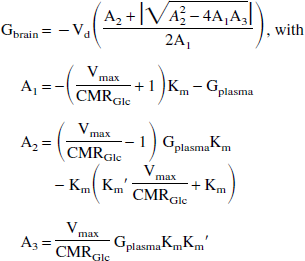
where Km is the Michaelis-Menten (or half-saturation) constant for GLUT-1, Vmax is the maximum glucose transport rate, Km′ is the Michaelis-Menten constant for hexokinase (Km′ = 67 μmol/L;Kapoor et al., 1989) and CMRGlc is the cerebral metabolic rate of glucose consumption. Vd is the volume fraction of glucose (Vd = 0.77 mL/g;Lund-Andersen, 1979), under the assumption that glucose distributes uniformly throughout the brain water space. When the effects of hexokinase are ignored (Km′ = 0), Eq. 4 reduces to the well-known, asymptotic relationship previously described (Gruetter et al. 1996, 1998; Lund-Andersen, 1979).
Recently, Gruetter et al. (1998) proposed describing glucose transport kinetics across the human blood–brain barrier by a reversible Michaelis-Menten model (Cunningham et al., 1986; Mahler and Cordes, 1971). Although the model can also be visualized by Eq. 3, the essential difference is that the individual fluxes Jin and Jout are reversible. It has been shown (Cunningham et al., 1986; Gruetter et al., 1998; Mahler and Cordes, 1971) that this change amounts to replacing the Michaelis-Menten constant Km with a product dependent term Km + [Glc]. This can be interpreted as a product-inhibited Michaelis-Menten model, in which, for instance, the forward reaction (uptake of glucose) is inhibited when brain glucose is present. The brain glucose concentration at steady-state can be calculated according to
When the effect of hexokinase is ignored, Eq. 5 reduces to a linear relationship between the brain and plasma glucose concentration, as previously described (Gruetter et al., 1998).
Fitting of the experimental data to Eqs. 4 and 5 was performed using a Levenberg-Marquardt algorithm. The fit was weighted by the relative accuracy of the data points. Error analysis of the fitted parameters, Km and (Vmax/CMRGlc), was based on Monte Carlo simulations (2,000 points) in which the gaussian noise standard deviation was set to the standard deviation of the in vivo glucose concentration residuals after a best fit to the data.
RESULTS
Figure 1 illustrates the process of obtaining the volume fractions of gray matter, white matter, and cerebrospinal fluid in each of the three localized voxels. The T1 segmentation process provided excellent separation of the different tissue types. The exact tissue contribution within the individual voxels was obtained by multiplying the segmentation map by the localization profile of the three voxels, as measured on a solution in vitro. The calculated tissue compositions over all four volunteers were 31% to 49% gray matter, 46% to 61% white matter, and 3% to 8% cerebrospinal fluid for the middle volumes; the corresponding figures for the outer volumes were 59% to 70%, 20% to 31%, and 8% to 10%.
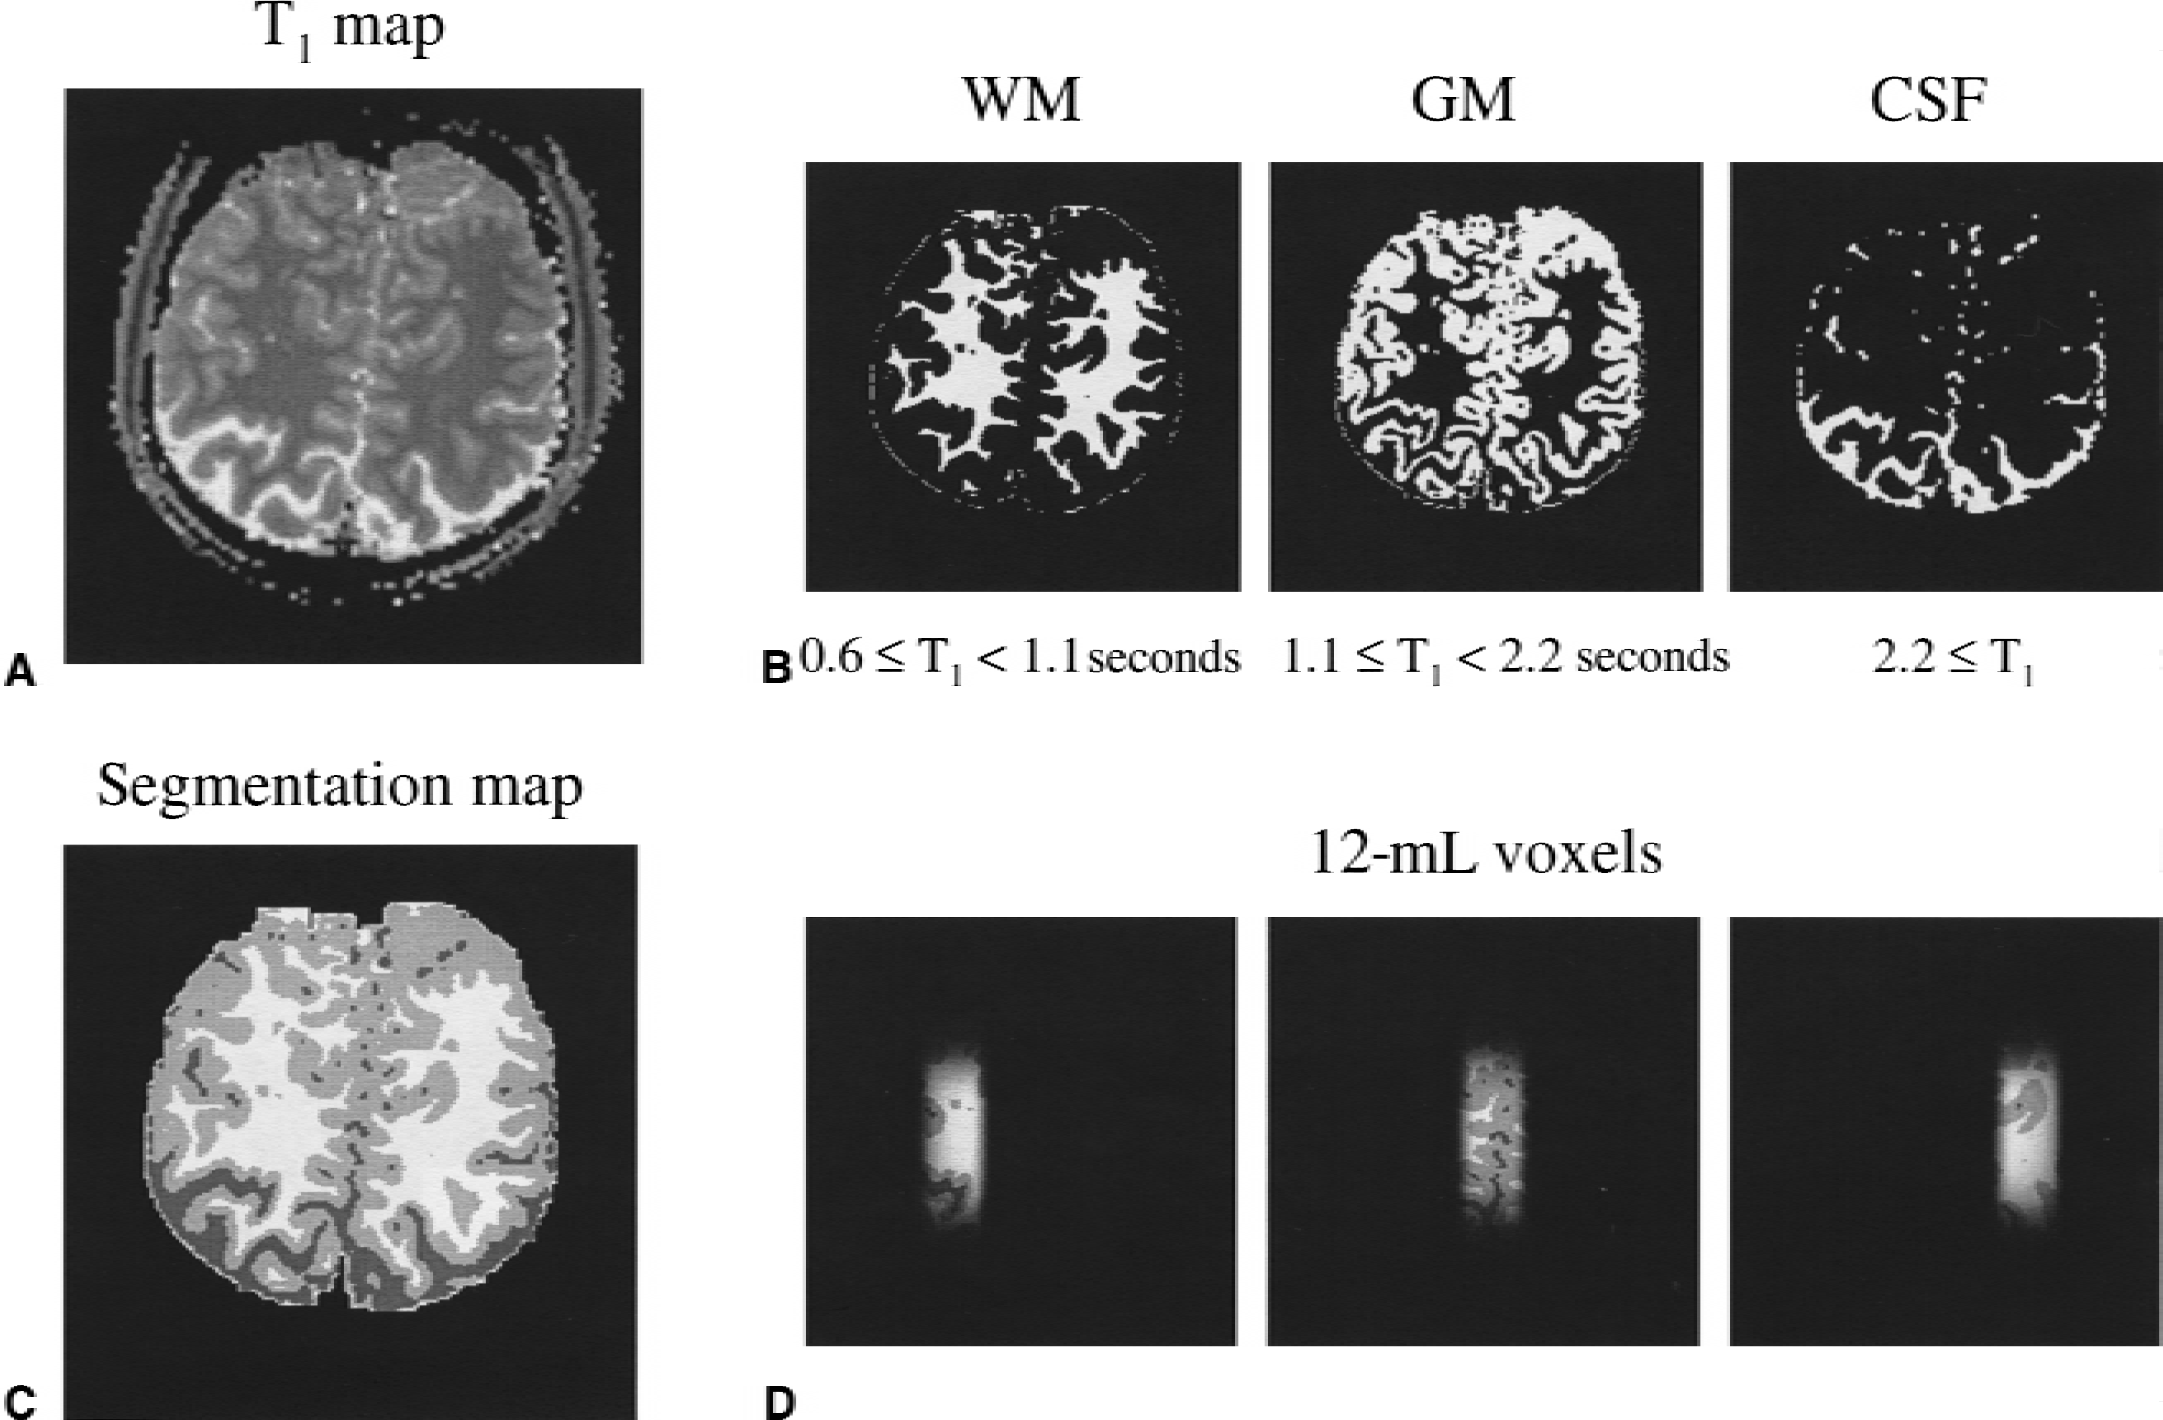
Procedure for the generation of T1-relaxation-based segmentation maps of human brain.
The plasma glucose generally reached a new steady-state level within 5 to 10 minutes after the onset of the glucose level increment. During the periods of steady-state measurements, the plasma glucose level was maintained to within approximately 5% to 10% by adjusting the glucose infusion rate. The brain glucose concentration generally reached a new steady-state level approximately 30 to 40 minutes after the onset of the plasma glucose level increment. The increase in white matter glucose concentration was generally slower than for gray matter. The steady-state measurements, as used in the experiments described here, were made 30 to 40 minutes after the plasma glucose increment during a period of 20 to 40 minutes.
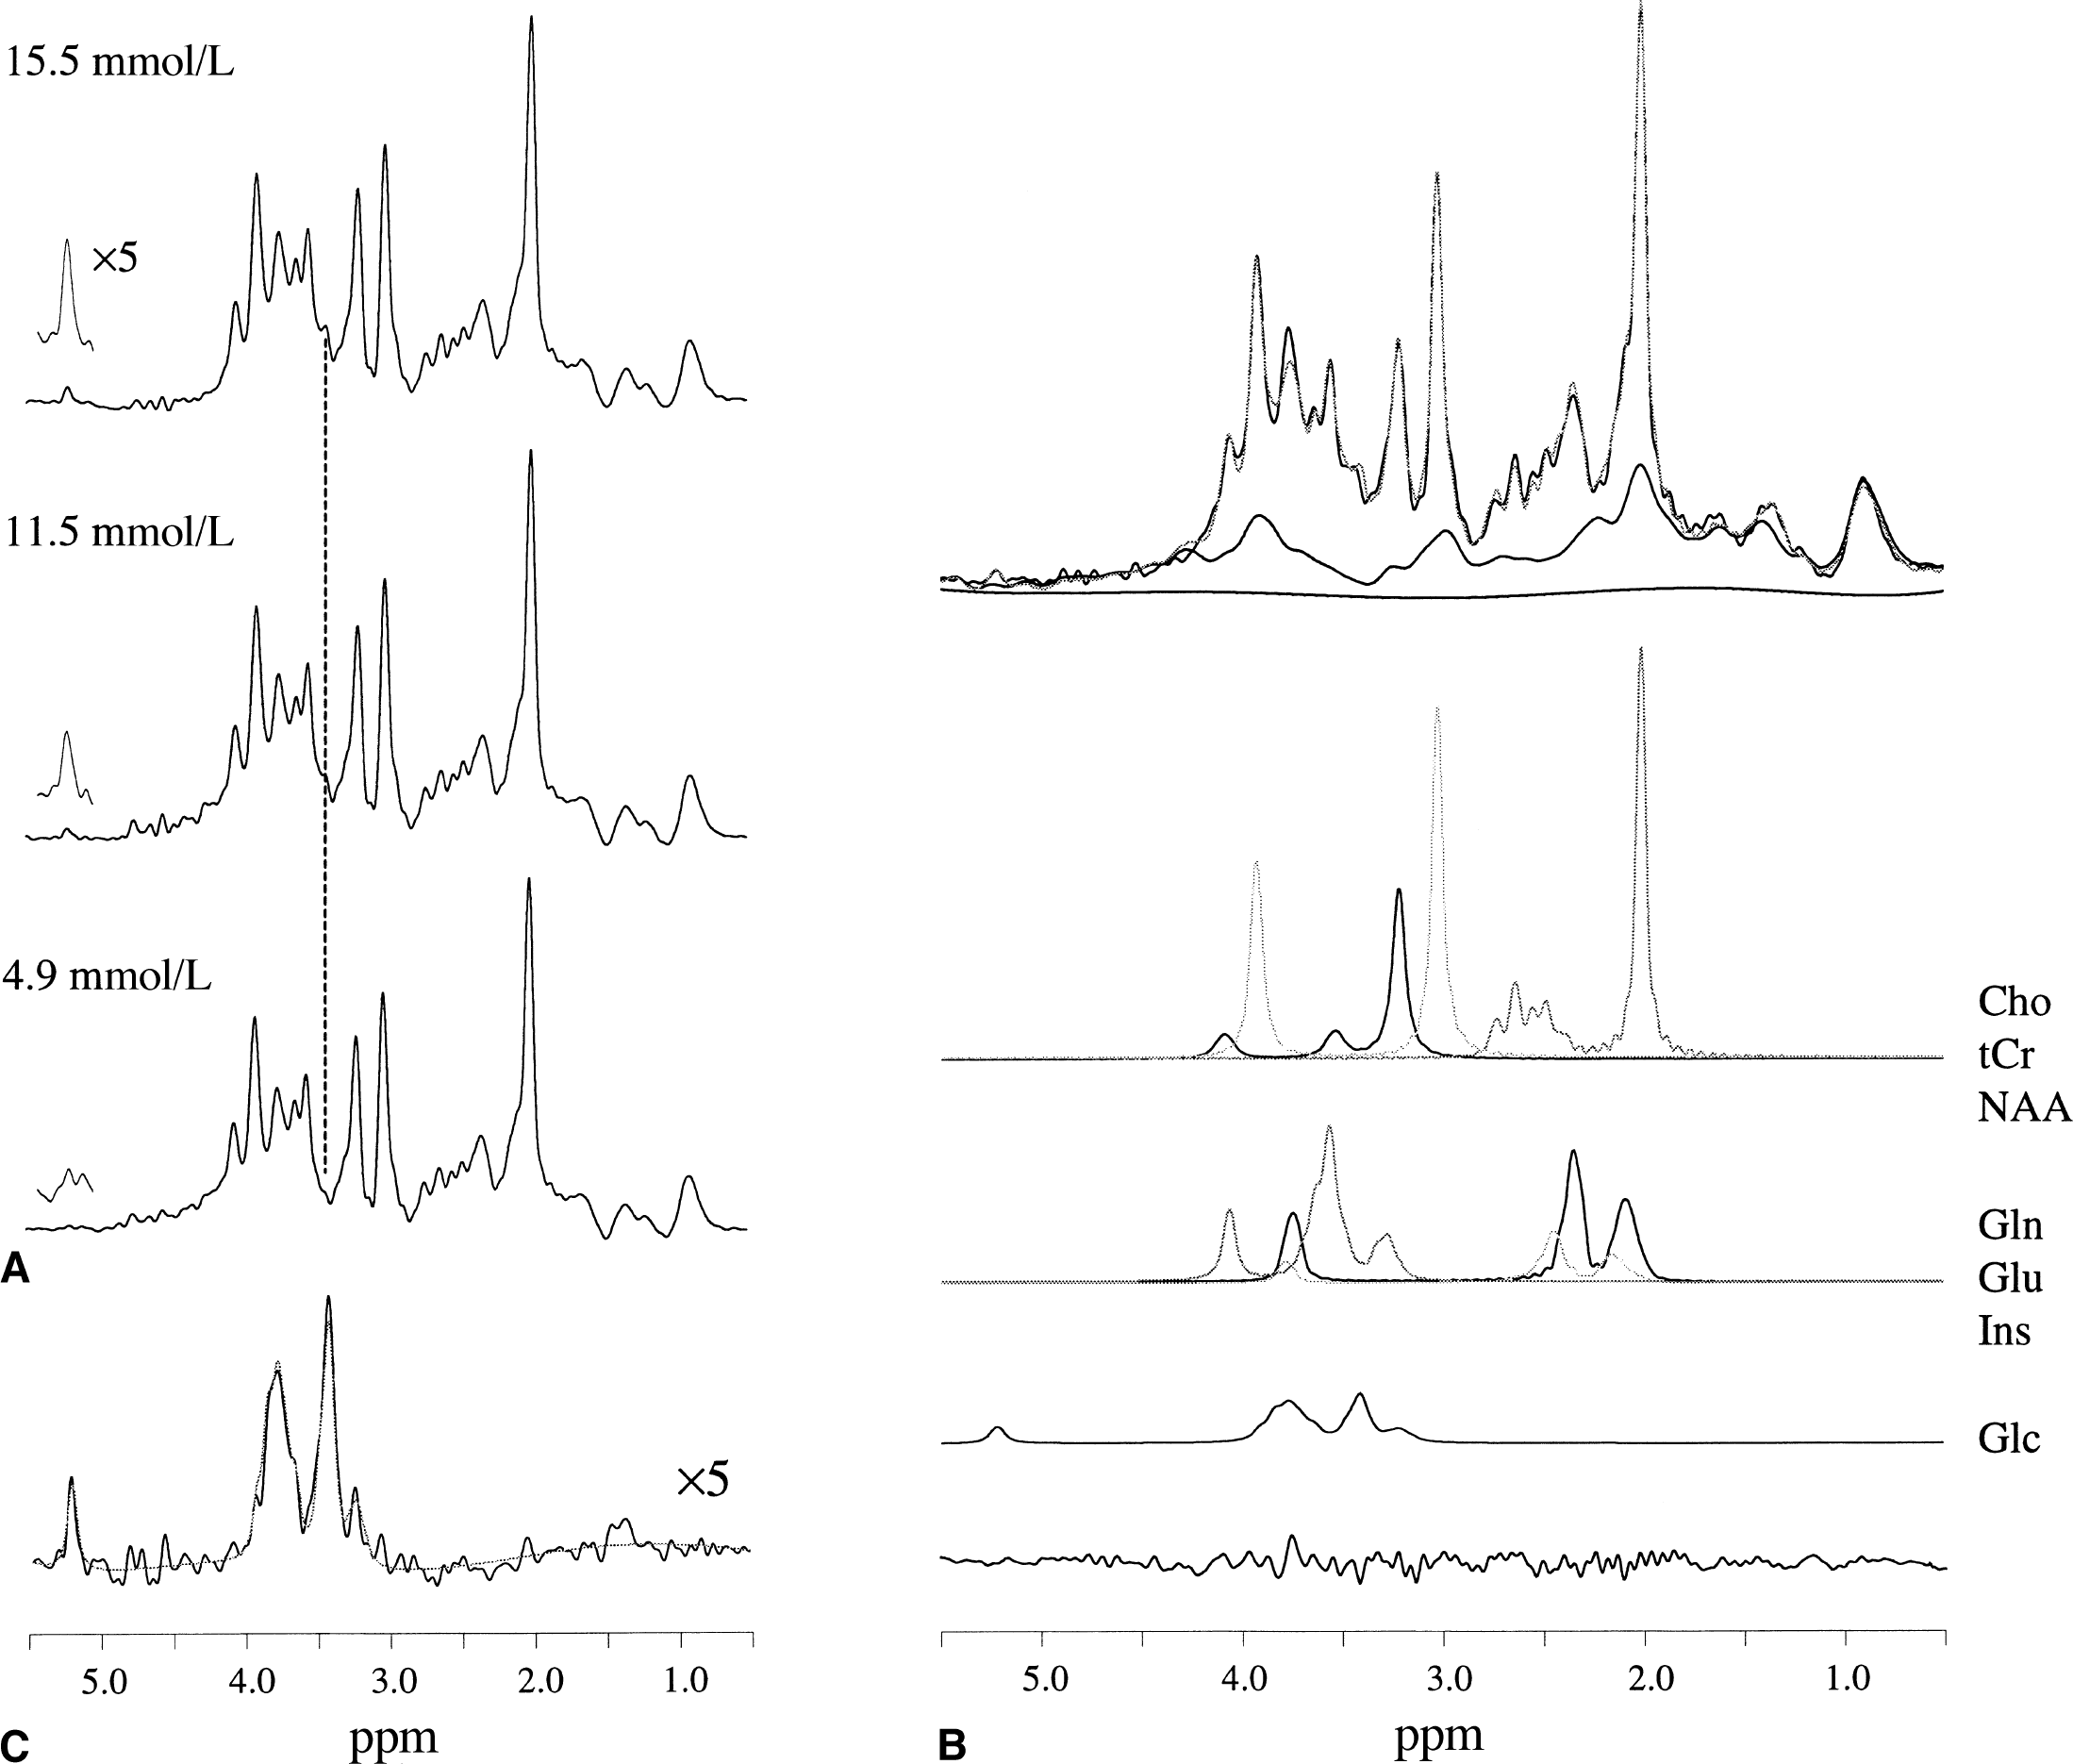
Figure 2 shows the quantification process of the glucose resonances during the periods of constant glycemia. Figure 2A shows NMR spectra from a predominantly white-matter voxel (31.1% gray matter, 60.5% white matter, 8.4% cerebrospinal fluid) at different plasma glucose concentrations. The spectra were averaged over approximately 20 minutes. The residual water resonance, which is approximately twice the amplitude of the highest metabolite resonances, was removed by an HSVD algorithm. The αH1-glucose resonance at 5.23 ppm clearly reveals that the brain glucose content increased with plasma glucose concentrations. This relation can also be deduced from the inner (H2–H5) glucose resonances at 3.44 ppm and from the difference spectrum (Fig. 2C). The glucose resonances at the highest glycemia level were quantified directly by LC model fitting (Fig. 2B). The absolute metabolite concentrations in gray and white matter are calculated using NAA as an internal concentration standard. The NAA concentrations in gray and white matter were assumed to be 9.9 and 10.5 mmol/L, respectively, and represent averaged values from Hetherington et al. (1996), Pan et al. (1998), and Pouwels and Frahm (1998). The absolute metabolite concentrations (average ± standard deviation) were calculated for total creatine (gray matter, 8.4 ± 1.1 mmol/L; white matter, 6.6 ± 1.1 mmol/L), choline-containing compounds (gray matter, 1.5 ± 0.21 mmol/L; white matter, 1.7 ± 0.43 mmol/L), glutamate (gray matter, 9.5 ± 1.3 mmol/L; white matter, 6.0 ± 1.2 mmol/L), glutamine (gray matter, 4.1 ± 1.0 mmol/L; white matter, 2.3 ± 0.82 mmol/L), inositol (gray matter, 5.2 ± 1.3 mmol/L; white matter, 2.3 ± 0.82 mmol/L), and aspartate (gray matter, 2.0 ± 0.70 mmol/L; white matter, 1.3 ± 0.64 mmol/L). The spectrum shown originates from a predominantly gray matter volume (68.6% gray matter, 20.5% white matter, 10.9% cerebrospinal fluid). The measured macromolecules almost completely account for the spectral baseline, leaving only a low-order, low-amplitude cubic-spline baseline to be included in the LC model fit. The glucose content at the lower glycemia levels was obtained by fitting the difference spectra and extrapolating down from the glucose level obtained at the highest glycemia level.
The brain glucose concentration measured as a function of the plasma glucose is shown in Fig. 3A. Because the NMR spectra were obtained with one-dimensional Hadamard encoding, three voxels could be measured simultaneously for each subject at each plasma glucose level. Therefore, with a two-step glucose infusion protocol (leading to three steady-state glucose levels) a total of 4 × 3 × 3 = 36 independent data points could be measured on four subjects. The solid lines gives the best fit to the data according to the standard (curved line) and reversible (straight line for Gplasma > 2 mmol/L) Michaelis-Menten transport models. Both models included hexokinase activity (Km′ = 67 μmol/L), and as a result the fitted curves smoothly run to zero brain glucose when the plasma glucose concentration falls in the range of the hexokinase Km. Qualitatively, both models fit the data well over the entire plasma glucose range. Table 1 shows the quantitative information on the fitted kinetic parameters (Vmax/CMRGlc) and Km and the standard deviation of the residuals. Figure 3B gives the gray and white matter glucose concentrations as a function of the plasma glucose concentration. The cerebral gray and white matter glucose concentrations are of similar magnitude, although the white matter glucose concentrations are consistently 15% to 20% greater than the gray matter values. The solid lines represent the best fit to the data according to the reversible Michaelis–Menten transport model. The quality of fit using the standard Michaelis-Menten model is similar. Table 1 shows quantitative information on both models. For both models, Vmax is reduced several fold in white matter relative to gray matter. The largest relative difference in the derived kinetic constants between the two models is in Km, which was much lower in the reversible (1.2 ± 0.62 mmol/L) than in the irreversible Michaelis-Menten model (6.8 ± 0.78 mmol/L).
Michaelis–Menten constants for glucose transport and cerebral metabolic rates of glucose utilization (mean ± SD) for human brain and cerebral gray and white matter
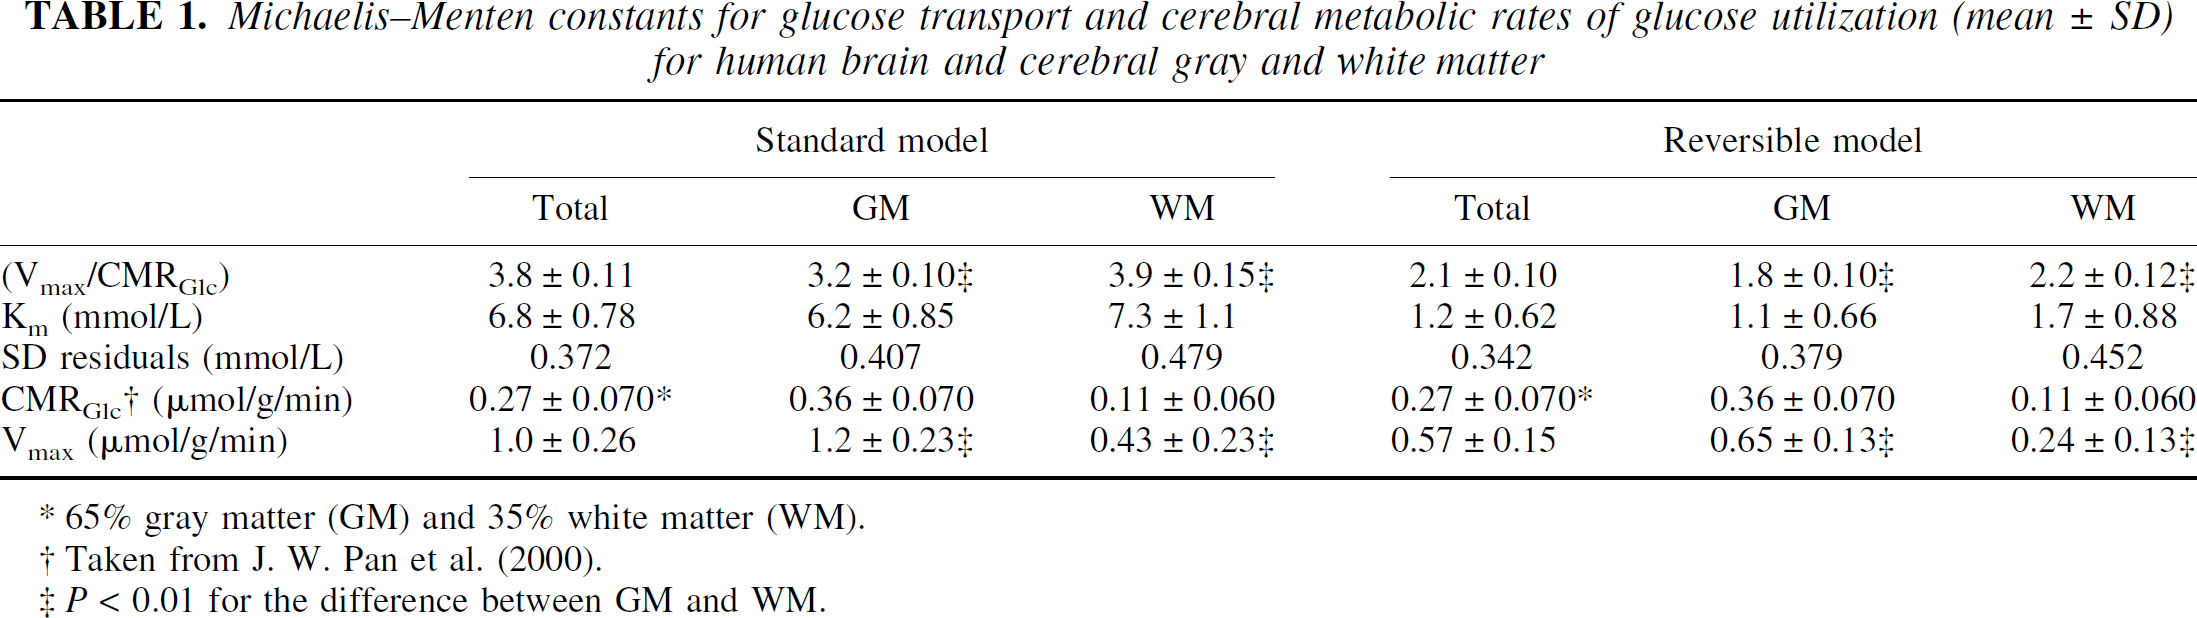
65% gray matter (GM) and 35% white matter (WM).
Taken from J. W. Pan et al. (2000).
P < 0.01 for the difference between GM and WM.
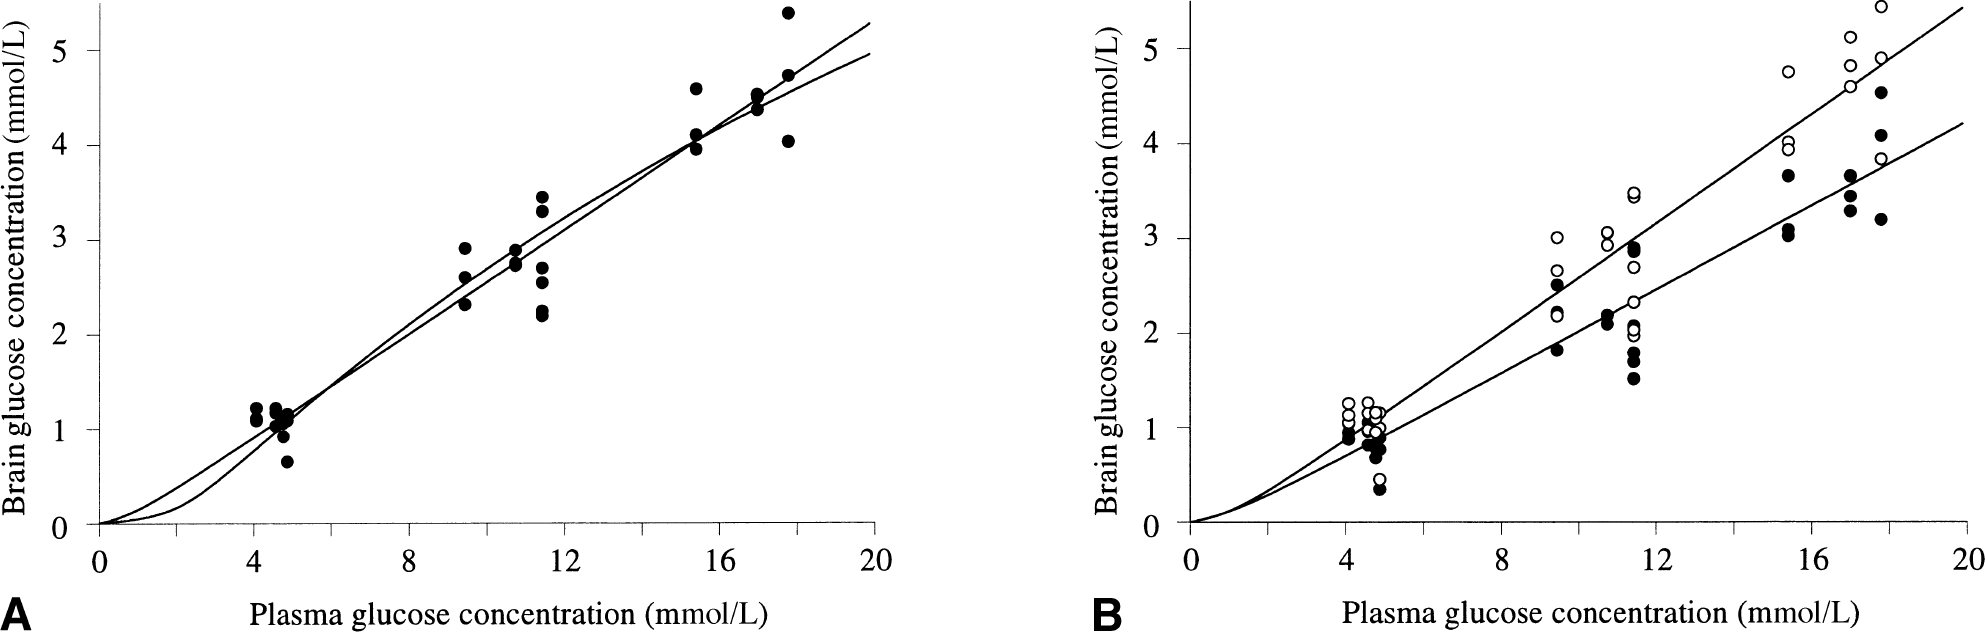
Relation between plasma and brain glucose concentration.
DISCUSSION
Magnetic resonance spectroscopy
We used multivoxel 1H NMR spectroscopy in combination with glucose infusions to determine the brain gray and white matter glucose concentrations at three different plasma levels. The simultaneous detection of metabolites from multiple volumes (12 mL) by Hadamard encoding ensured optimal sensitivity while simultaneously achieving adequate discrimination of different cerebral tissue types. The obtained cerebral metabolite concentrations are in good agreement with literature values. The LC model algorithm gave consistent fitting results, provided that the measured macromolecular baseline was included as a basis function. Approximating the baseline by a cubic-spline function generally gave less satisfactorily results. The inclusion of 10 metabolite basis functions was sufficient to reduce the fitting residual to less than 5% of the resonance amplitudes. Only at approximately 3.75 ppm was there a significant and consistent discrepancy between the fitted and original 1H NMR spectra. This difference may be attributed to glutathione and to a lesser degree alanine. Glutathione has a singlet resonance at 3.77 ppm and a concentration range of 1 to 3 mmol/L (Govindaraju et al., 2000). Inclusion of glutathione (and possibly alanine, γ-amino-butyric acid [GABA], and other choline and ethanolamine-containing compounds) as a metabolite basis set will improve the overall fitting quality and stability. The values obtained for white matter are generally accompanied with higher standard deviations, because the highest percentage of white matter in any of the volumes was limited to approximately 60%. The αH1-glucose resonance at normoglycemic levels (4 to 5 mmol/L plasma glucose) was generally too low to be quantified reliably. However, at hyperglycemic levels, the αH1-resonance was readily observable and could be quantified by the LC model. Because the subject and NMR system stability was excellent throughout the study, the differences in spectra between the various glycemia levels consisted almost purely of glucose resonances, which could also be quantified with high accuracy. Therefore, even though the glucose could not be quantified directly at normoglycemia, the absolute glucose concentration was obtained with high accuracy by extrapolating down from the highest glycemia level.
Glucose transport kinetics
Despite the large reported differences in cerebral metabolic rate between gray and white matter, our results show that the absolute steady-state glucose concentrations are similar (see Mason et al., 1999 for a review). This circumstance can arise only when the glucose transport kinetics are commensurate with glucose utilization, as demonstrated by the kinetic modeling which found similar ratios of Vmax/CMRGlc in white and gray matter for both models used. This result is in excellent agreement with that obtained by Hawkins et al. (1983), who found a significant regional correlation between glucose influx and glucose utilization. Pan et al. (2000) measured gray and white matter neuronal glucose oxidation in a similar volume of the visual cortex as in the present study using magnetic resonance spectroscopy. Three of the four subjects used in this study were also measured in the study of Pan et al. (2000), and their rates of CMRGlc have been used to calculate the maximum rate of glucose transport, Vmax (Table 1). From these calculations, it follows that Vmax for gray matter is approximately three times greater than for white matter. The difference in transport parameters (Vmax/CMRGlc) and Vmax between gray and white matter is highly significant (P < 0.01). The standard deviations in Km were too high to reach a statistically significant difference between the tissue types. The values in white matter are accompanied by a larger relative error. This can be explained by the relatively small volume fraction of white matter (maximal 60%) in any of the measured spectroscopic volumes. Future white matter measurements can be improved by acquiring NMR spectra from smaller volumes (with a higher white matter volume fraction) or by acquiring more spectroscopic volumes with varying white matter volume fractions. The large difference in GLUT-1 transport kinetics between gray and white matter may be explained by the lower capillary density of white matter. Zeller et al. (1997) have shown a strong correlation between GLUT-1 transporter density and the capillary density to the local cerebral glucose utilization rate in adult rats. The decreased metabolic activity in white matter most likely reflects the differences in mitochondrial density, cellular composition, and organization of these regions (Shepherd, 1990) relative to gray matter.
The obtained kinetic parameters for glucose transport across the blood–brain barrier are in excellent agreement with previously published values for human brain (Gruetter et al., 1996, 1998) for mixed gray and white matter volumes. Qualitatively, the relationship between the plasma and brain glucose concentrations appears linear over the plasma glucose range studied (4.1 to 17.9 mmol/L). The ratio of brain-to-plasma glucose was approximately 0.25 over the entire plasma glucose range. The ratio is similar to that found by Gruetter et al. (1998) for human brain, but also similar to values found for animal brain (Mason et al., 1992) and by 13C magnetic resonance spectroscopy in humans (Gruetter et al., 1992). It was assumed in the modeling of glucose transport of the blood–brain barrier that the level of glucose in neurons, glia, and the extracellular fluid is similar. This assumption is supported by isolated cell studies that have shown high glucose transport activity on neurons and glia (Lund-Andersen 1979; Vannucci et al., 1997). The in vivo magnetic resonance spectroscopy study of Gruetter et al. (1996) found a significantly slower time course in the increase of brain glucose relative to plasma glucose during a rapid glucose infusion, which agreed with the kinetics predicted for uniform glucose distribution between brain compartments. We found a similar lag in brain glucose concentration. Recently, Gruetter and coworkers (Pfeuffer et al., 2000) have assessed the glucose distribution in rat cortex using diffusion magnetic resonance spectroscopy. Their findings were interpreted as indicating that the largest concentration gradient of glucose is at the blood–brain barrier and that glucose is evenly distributed between compartments.
Both the standard and reversible Michaelis-Menten transport models fitted data adequately, whereby the standard deviation over the residual was approximately 10% less for the reversible than for the standard Michaelis-Menten model. Because both models fitted the data well, it is difficult to distinguish the models based on the steady-state measurements. Combining steady-state measurement with time-dependent experiments may provide clearer discrimination between the models. The inclusion of Michaelis-Menten kinetics for the phosphorylation of glucose by hexokinase generally improved the overall fit to the experimental data. Specifically, the modification significantly changed the plasma glucose level at which the predicted brain glucose level approached the Km for hexokinase (∼67 μmol/L). Reflecting this alteration in the shape of the curve, the Km was increased by 10% to 50% (depending on the model and tissue type) after the inclusion of hexokinase activity, with a larger percentage effect for the reversible model. The ratio of Vmax/CMRGlc did not significantly change with hexokinase activity.
Glucose transport has been proposed to be limiting for metabolism in insulin-induced hypoglycemia and in various neurologic disorders (Vannucci et al., 1997). In Alzheimer's disease, a reduction of glucose transport activity on the blood–brain barrier in specific areas of the brain (parietal lobes, caudate nucleus) of more than 50% has been reported based on analysis of autopsy tissue (Simpson et al., 1994). The sensitivity of brain glucose metabolism to changes in glucose transporter activity may be estimated from the present values of Vmax and Km. In a similar manner, the present values of Vmax and Km obtained under resting conditions may be used to obtain an estimate of the maximum increase in the cerebral metabolic rate of glucose on functional activation. The following calculations assume that the kinetic parameters are independent of activation, a feature that remains to be proven. The rate of glucose utilization is maximal when the brain glucose concentration approaches zero and then equals the unidirectional flux from plasma to brain over the blood–brain barrier. For both Michaelis-Menten models, the maximum sustainable unidirectional flux (Gbrain = 0) is given by
At normoglycemia (Gplasma = 5.0 mmol/L), the maximum sustainable unidirectional flux for both tissue types and for both Michaelis-Menten models is approximately 1.5 times the basal CMRGlc. The unidirectional flux in white matter is higher than for gray matter (1.5 and 1.6 times CMRGlc). Therefore, at normoglycemia, the predicted maximum sustainable increase in CMRGlc is approximately 50%. This range accommodates the larger CMRGlc values and increments (ΔCMRGlc = 23% to 51%) measured by positron emission tomography, quantitative functional magnetic resonance imaging, and magnetic resonance spectroscopy in the human brain under visual stimulation (reviewed by Shulman and Rothman, 1998). Under conditions of seizure, higher increases have been measured in cortical CMRGlc, but the period of the seizure was brief and could have been sustained by brain glucose and glycogen levels present before the seizure (Siesjö, 1978). The close correspondence between the maximum glucose transport capacity and the maximum physiologic rate of CMRGlc indicates that even relatively small decreases in glucose transport activity may impair glucose metabolism and function under conditions of extreme physiologic demand. Reduction in glucose transport activity may derive from alterations in GLUT-1 density on the capillary membrane or from decreases in capillary density, both of which have been associated with neurologic disorders (Vannucci et al., 1997). Recent studies have identified acute changes in the number of transporters with seizures to compensate for the increase in glucose metabolism (Cornford et al., 2000).
The dynamic measurement of the response of brain glucose to a rapid plasma glucose increment holds a significant amount of information to discriminate more stringently the transport kinetics between gray and white matter. Although the final glucose concentration in both tissue types reaches similar values during steady state, the rise to the steady-state concentration is significantly faster in gray matter than in white matter (data not shown). When performing dynamic transport kinetic studies, it is therefore crucial to achieve a sufficient discrimination of gray and white matter. A small amount of contamination from either tissue type will lead to significant deviations of the fitted transport parameters. It is therefore necessary to combine localized NMR spectroscopy of (human) brain with segmentation techniques, even when studying primarily gray matter voxels (which can still contain up to 20% to 30% white matter).
Conclusions
Our results show that multivoxel 1H NMR spectroscopy at 4 T in combination with glucose infusion allows the simultaneous determination of the brain gray and white matter glucose concentrations in the visual cortex as a function of plasma levels. Although transport kinetic constants were calculated only from the steady-state data, there was sufficient sensitivity and time resolution to measure the dynamic glucose response to the increase in plasma glucose, which in the future may allow the total activity of glucose transport to be measured regionally. Similar levels of gray and white matter glucose were found at all concentrations of plasma glucose, although the white matter levels were on average roughly 15% to 20% greater. When the threefold lower rate of CMRGlc in white matter is taken into account, the similarity in glucose transport parameters suggests that blood–brain barrier glucose transport activity is lower by a similar amount in white matter. The regulation of blood–brain barrier glucose transport activity may be an important mechanism for maintaining glucose homeostasis throughout the cerebral cortex. Using either the irreversible or the recently proposed reversible Michaelis-Menten model of brain glucose transport and the kinetic parameters calculated from the data fits, we calculated that brain glucose transport activity is sufficient, but only by a small margin, to support the maximum reported physiologic increments in CMRGlc in the visual cortex. Therefore, even 20% to 30% decreases in glucose transport activity may significantly impair cerebral glucose metabolism and function.
Footnotes
Acknowledgments:
The authors thank Drs. Kevin Behar, Graeme Mason, and Robert Shulman for valuable discussions.