
Abstract
Perfusion-weighted imaging (PWI) measures can predict tissue outcome in acute ischemic stroke. Accuracy might be improved if differential tissue susceptibility to ischemia is considered. We present a novel voxel-by-voxel analysis to characterize cerebral blood flow (CBF) separately in gray (GM) and white matter (WM). Ten patients were scanned with inversion-recovery spin-echo EPI (IRSEPI), diffusion-weighted imaging (DWI), PWI<6 h from onset and fluid attenuated inversion-recovery (FLAIR) at 30 days. Image processing included coregistration to PWI, automatic segmentation of IRSEPI into GM, WM and CSF and semiautomatic segmentation of DWI/FLAIR to derive the acute and 30-day lesions. Five tissue compartments were defined: (1) ‘Core’ (abnormal acutely and at 30 days), (2) ‘Growth’ (or ‘infarcted penumbra', abnormal only at 30 days), (3) ‘Reversed’ (abnormal acutely but normal at 30 days), (4) ‘MTT-Delayed ‘ (tissue with delayed mean transit time but not part of the acute or 30-day lesion), and (5) ‘Normal’ brain. Cerebral blood flow in GM and WM of each compartment was obtained from quantitative maps. Gray matter and WM mean CBF in the growth region differed by 5.5 mL/100 g min (P = 0.015). Mean CBF also differed significantly within normal and MTT-Delayed compartments. The difference in the reversed region approached statistical significance. In core, GM and WM CBF did not differ. The results suggest separate ischemic thresholds for GM and WM in stroke penumbra.
Introduction
A number of magnetic resonance (MR) imaging studies have shown that perfusion-weighted imaging (PWI) acquired within the first few hours of acute ischemic stroke can be useful in predicting tissue outcome at a later time point (Grandin et al, 2001; Shih et al, 2003; Butcher et al, 2003). To aid clinical decision-making, perfusion thresholds are being sought that can distinguish between irreversible ischemic damage, reversible tissue ischemia, and benign oligemia (Baron, 2001a, b ). Human MR stroke studies to date have not attempted to differentiate between gray matter (GM) and white matter (WM) and instead have assumed that all brain tissues have the same perfusion thresholds. Evidence from both human and animal studies, however, suggest that GM has higher blood flow requirements than WM in both normal (Helenius et al, 2003; Leenders et al, 1990) and ischemic brain (Marcoux et al, 1982). Both the depth and the duration of ischemia at which damage occurs likely differ between GM and WM. Thus, if a single threshold of a perfusion parameter such as the cerebral blood flow (CBF) is used, one is likely to overestimate the total volume of WM and underestimate the amount of GM at risk of infarction.
As a step towards potentially more accurate tissue outcome prediction, we have developed a method for rapid automatic segmentation of GM and WM in acute stroke patients. This uses an inversion recovery spin-echo, echo-planar imaging sequence (IRSEPI). It provides GM and WM contrast within the time limitations of acute stroke imaging (the acquisition time is less than one minute). The novelty and objective of this MR study was to characterize CBF separately in GM and WM, in human acute ischemic stroke. We sought to determine whether these GM and WM CBF values differ significantly from each other within different pathophysiologic compartments (i.e. irreversibly damaged tissue, penumbral tissue, oligemic tissue not at risk of infarction, and normally perfused tissue). To identify these compartments, one could compare homogeneous subjects with permanent and transient occlusions. Lacking such ideal patients, our small and heterogeneous sample nonetheless provides a ‘proof of principle’ for the differentiation of GM and WM CBF in acute stroke.
Methods
Subjects
This was a prospective study of patients presenting with speech and/or motor deficits lasting more than 10 mins that were consistent with a stroke (or transient ischemic attack) as diagnosed by a stroke neurologist. All patients provided informed consent for participation in the study and scanning using a 3 T MR scanner. The study had ethical approval of the local institutional ethics review board. Ten patients, presenting consecutively who met the following inclusion criteria were analyzed: (1) baseline MR imaging within 6 h of symptom onset with IRSEPI, diffusion-weighted imaging (DWI), and PWI sequences, (2) an acute diffusion lesion (defined as hyperintense on DWI and hypointense on apparent diffusion coefficient (ADC) map) and a perfusion deficit (defined as a visibly abnormal region on the mean transit time (MTT) map), (3) follow-up imaging acquired at 1 month including fluid attenuated inversion recovery (FLAIR) and DWI and (4) all imaging of good quality with minimal motion or other artefacts. Patients with brainstem or cerebellar infarcts were excluded because susceptibility artefact evident in echo-planar imaging (particularly at 3 T), limits the use of PWI around the skull base (Frayne et al, 2003).
Demographic data collected included age, gender, and time of symptom onset or time since last seen well. A National Institute of Health Stroke Scale (NIHSS) and modified Rankin Scale (mRS) assessment were performed by a trained physician or nurse investigator at presentation and at the follow-up scan. Stroke etiology (Adams et al, 1993) was determined by a physician at a 3-month follow-up clinic.
Imaging
All imaging was performed on a 3 T MR scanner (Signa, General Electric Medical Systems, Waukesha, WI, USA). The sequences included: DWI, IRSEPI, PWI, and pre- and post-contrast MR-angiography (MRA). The DWI was single shot, spin echo EPI, b-value = 0 and 1,000 secs/mm2, TR = 7,000 ms, TE = 96.5 ms. Isotropic DWI, b = 0 sec/mm2, (b0) and ADC images were obtained from these data (Functool GE). The IRSEPI had TR = 12,000 ms, TE = 17.4 ms and TI = 400 ms. The PWI was acquired using dynamic susceptibility contrast imaging with 20 mL contrast (Magnevist; Berlex, Wayne NJ, USA), injected at 5 mL/sec. The PWI acquisition parameters ranged from 26 to 51 time points, TR = 1,750 to 2,250 ms, TE = 40 to 45 ms, flip angle = 45°. The change in PWI acquisition was because of sequence optimization to maximize sampling frequency and brain coverage that occurred over the course of the study. The first four patients had 19 PWI slices, the fifth patient had 10 slices and the remaining five patients had 12 slices. The PWI covered at least from the upper midbrain to the vertex. Although the total PWI slice number varied, for all patients the slice dimensions and orientation were identical to the DWI and IRSEPI (which each had 19 slices). All of the sequences had reconstructed matrix dimensions of 256 × 256, the field of view was 320 mm and the slices were 5.0 mm thick with a gap of 2.0 mm. Pre- and post-contrast time-of-flight MRA of the circle of Willis were also obtained (Yang et al, 2002).
The follow-up imaging at 30 days included DWI (same parameters as the initial scan) and FLAIR (TR = 9002 ms, TE = 161 ms, TI = 2250 ms, NEX = 0.5). The resulting FLAIR image volume had the same dimensions as the DWI with the only difference being a 240 mm field of view. At follow-up, a noncontrast MRA was also obtained. Total scan table time was approximately 20 mins initially and 10 mins at follow-up.
Postprocessing and Image Analysis
Off-line postprocessing was performed on Power Macintosh (G4 and G5 computers, Apple Computer Inc., Cupertino, CA, USA). The analysis involved automatic, computer-assisted, and manual steps. Every brain tissue voxel was classified into one of five compartments, representing different pathophysiologic states. Voxels in the five compartments were also subclassified as primarily GM or WM. Figure 1 illustrates the image processing which is further detailed below.
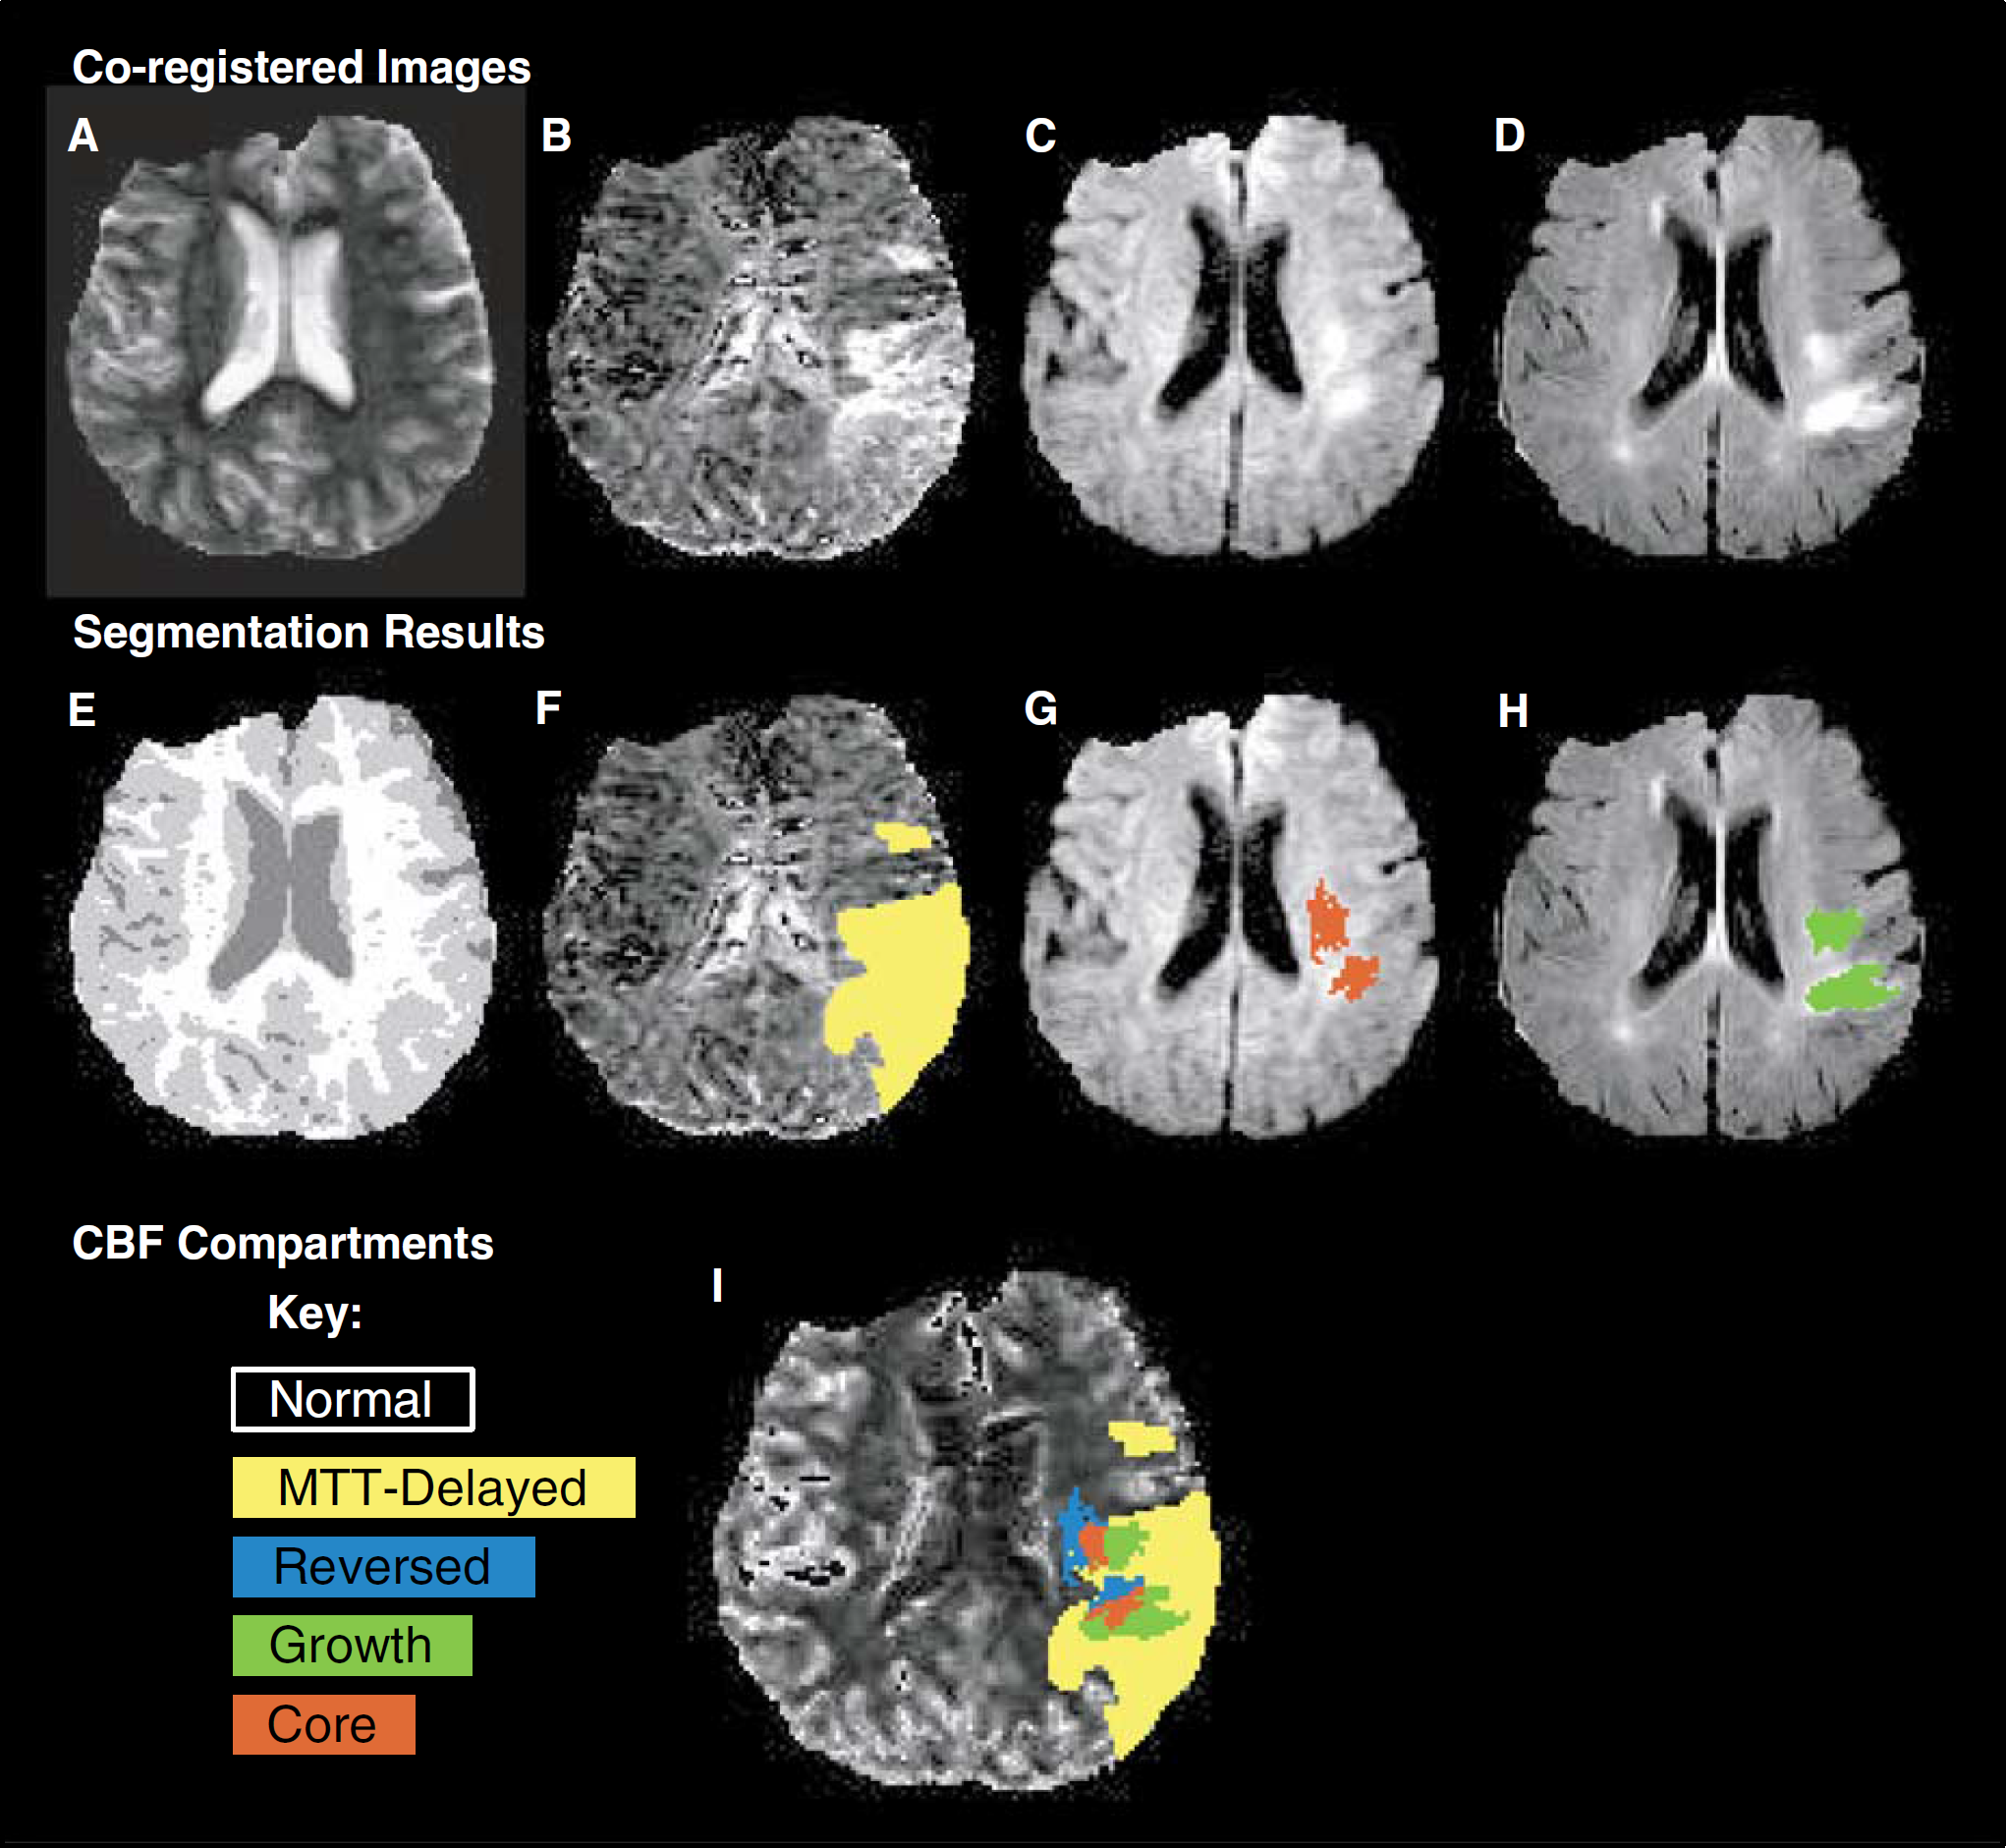
Image processing. Illustrated for patient 9. (
Image coregistration: Critical to the voxel-by-voxel analysis was accurate coregistration of both the EPI and non-EPI sequences. All images were coregistered to the first set of images from the baseline PWI. For all baseline sequences, a brain extraction tool and rigid body coregistration was used (BET and FLIRT, FSL, Oxford, UK) (Jenkinson and Smith, 2001). The follow-up FLAIR scans, which had less distortion and a smaller field of view than the EPI sequences, required different processing. A mask of intracranial tissue was obtained by manual outlining on the FLAIR. The masked FLAIR images were registered to the follow-up b0 image using nonrigid, mutual information registration (CISG, King's College, London (Hartkens et al, 2002). The follow-up b0 image was then registered to the baseline b0 image using two registration programs (FLIRT, FSL, Oxford and CISG, King's College, London, UK). The best result on visual inspection was selected and the same transformation was applied to the FLAIR.
Stroke lesion segmentation: Segmentation of stroke lesions on the initial and follow-up scans was performed using Segtool (Mitchell et al, 1994). This program was developed to help a user identify and measure objects in MR data sets. It uses multispectral analysis and cluster classification techniques to differentiate ‘normal’ and ‘abnormal’ tissues, under the supervision and guidance of an experienced operator. This approach has been validated for stroke lesion measurement in MR imaging (Mitchell et al, 2002) and has been shown to improve the reliability of volume measurement in comparison to handdrawn segmentation (Mitchell et al, 1994). For identifying the ‘acute lesion’ the initial DWI, ADC and b0 images were analyzed together. The acute stroke lesion was defined as tissue that was hyperintense on DWI and hypointense on ADC image but no signal thresholds are assumed a priori to represent abnormal tissue. The b0 (which is T2-weighted) allowed the operator to exclude remote infarcts from the acute lesion volume. The operator was masked to clinical and follow-up information during acute lesion segmentation. For the ‘final infarct’ the 30-day follow-up coregistered FLAIR, DWI, and b0 images were used and the final lesion was defined as bright on the FLAIR and b0. Residual hyperintensity on the DWI helped identify the target stroke lesion and exclude any remote infarcts.
GM and WM segmentation: Anisotropic diffusion filtering (Black et al, 1998) of the registered IRSEPI image was performed to reduce noise and enhance edges. Segmentation of the GM, WM, and CSF was performed on the IRSEPI images using a fully automatic 3-class k-means algorithm (Hartigan and Wong, 1979). Both cortical and subcortical gray matter were grouped together as GM.
Quantified perfusion map calculation: Quantified CBF and MTT maps were derived using semiautomatic determination of the arterial input function (AIF) (Lu et al, 2003) from the contralateral MCA and deconvolution using the singular value decomposition method described by Østergaard et al (1996). The maps were masked using the IRSEPI CSF segmentation to exclude both the sulcal CSF and the ventricles. Excluding CSF in this way was particularly important as it prevented contamination of GM CBF values because of a partial volume of arteries within adjacent sulci. The PWI and IRSEPI were manually outlined to exclude any areas that suffered from distortion because of susceptibility artefacts. Using the quantified MTT maps, a region with MTT delay was manually outlined by a single rater. The rater varied the window-level settings to maximize the observed region; no set threshold was applied, as the aim was to identify the region that was inclusive of all abnormally perfused tissue.
Compartment definitions: Five tissue compartments were defined using the results of acute lesion segmentation (from the acute DWI, ADC, and b0 images), the final stroke lesion segmentation (from the 30-day FLAIR, b0, and DWI), and the acute quantified MTT map (Figure 1). These described the five possible states of tissue on the initial CBF map. (1) Core, or irreversibly damaged tissue, was that located in both the acute and final stroke lesion. (2) Growth, or infarcted penumbra, was tissue which was not in the acute lesion (i.e., appeared normal on the acute DWI, ADC, and b0 images) but was within the final lesion. (3) Reversed, or salvaged penumbra, was tissue that was within the acute lesion but was not within the final lesion. This region was not present in all subjects and may have occurred for a number of reasons, of which one is true diffusion reversibility (Kidwell et al, 2000). (4) MTT-Delayed, or oligemic tissue with benign hypoperfusion, was tissue with a visibly prolonged MTT compared with surrounding brain but was not within the acute or final lesion. (5) Normal was all the brain tissue (both ipsilateral and contralateral to the stroke) that was not included in the other regions.
The MTT images were not used in the definition of the Core, Growth, or Reversed compartments. In this way, no assumptions were made about perfusion in these compartments and it allowed for the theoretical possibility that voxels without MTT delay on the initial scan could potentially be recruited into the final infarct.
Statistical Analysis
The postprocessing allowed for study of CBF separately in GM and WM within five compartments (Core, Growth, Reversed, MTT-Delayed, and Normal) for all 10 patients. The unit of analysis was the median value for GM and WM CBF in each compartment. Medians represented the best estimate of CBF because the values had a positive skew distribution. The results were summarized using the mean CBF among the patients and the corresponding standard deviation (s.d.) and 95% confidence interval (CI).
Within each compartment, a paired t-test was used to compare the mean difference between GM and WM CBF. The mean CBFs of GM were compared across compartments using one-way analysis of variance. Post hoc pairwise testing of means among compartments was performed using Tukey's test to preserve the overall significance level at 0.05. The same comparison of compartments was performed for WM CBF.
Results
Patient Demographics
Ten patients met all inclusion/exclusion criteria, between December 2002 and August 2003. Their mean age was 66 years (+s.d. 11 years) and 4 patients were women. The mean time to the acute MR was 4 h and 23 mins (+s.d. 74 mins) and time to follow-up was 30 days (+s.d. 7 days). Three patients had dominant hemisphere events. The median NIHSS score at the initial MR was 5 (range 0 to 8) and at 1 month was 1 (range 0 to 10). Median mRS was zero prestroke (range 0 to 1) and zero at follow-up (range 0 to 4). Clinically, the patients meeting the inclusion criteria had mild strokes, but they were similar to those excluded (n = 101, median NIHSS = 3, range 0 to 28). This probably reflects difficulties in recruiting and scanning sicker stroke patients. One patient had asymptomatic hemorrhagic transformation on the follow-up MR (grade 1 parenchymal hematoma, NIHSS and mRS = 0) but none had significant hemorrhage or mass effect that could have increased the total infarct volume. Table 1 summarizes the site of vessel occlusion on the initial MR, tissue plasminogen activator (tPA) use (which was administered after a CT scan and before MR scanning as per our local standard of care), and whether recanalization was observed on the 30-day follow-up scan (defined by a neuroradiologist from the MRA).
Patient demographics
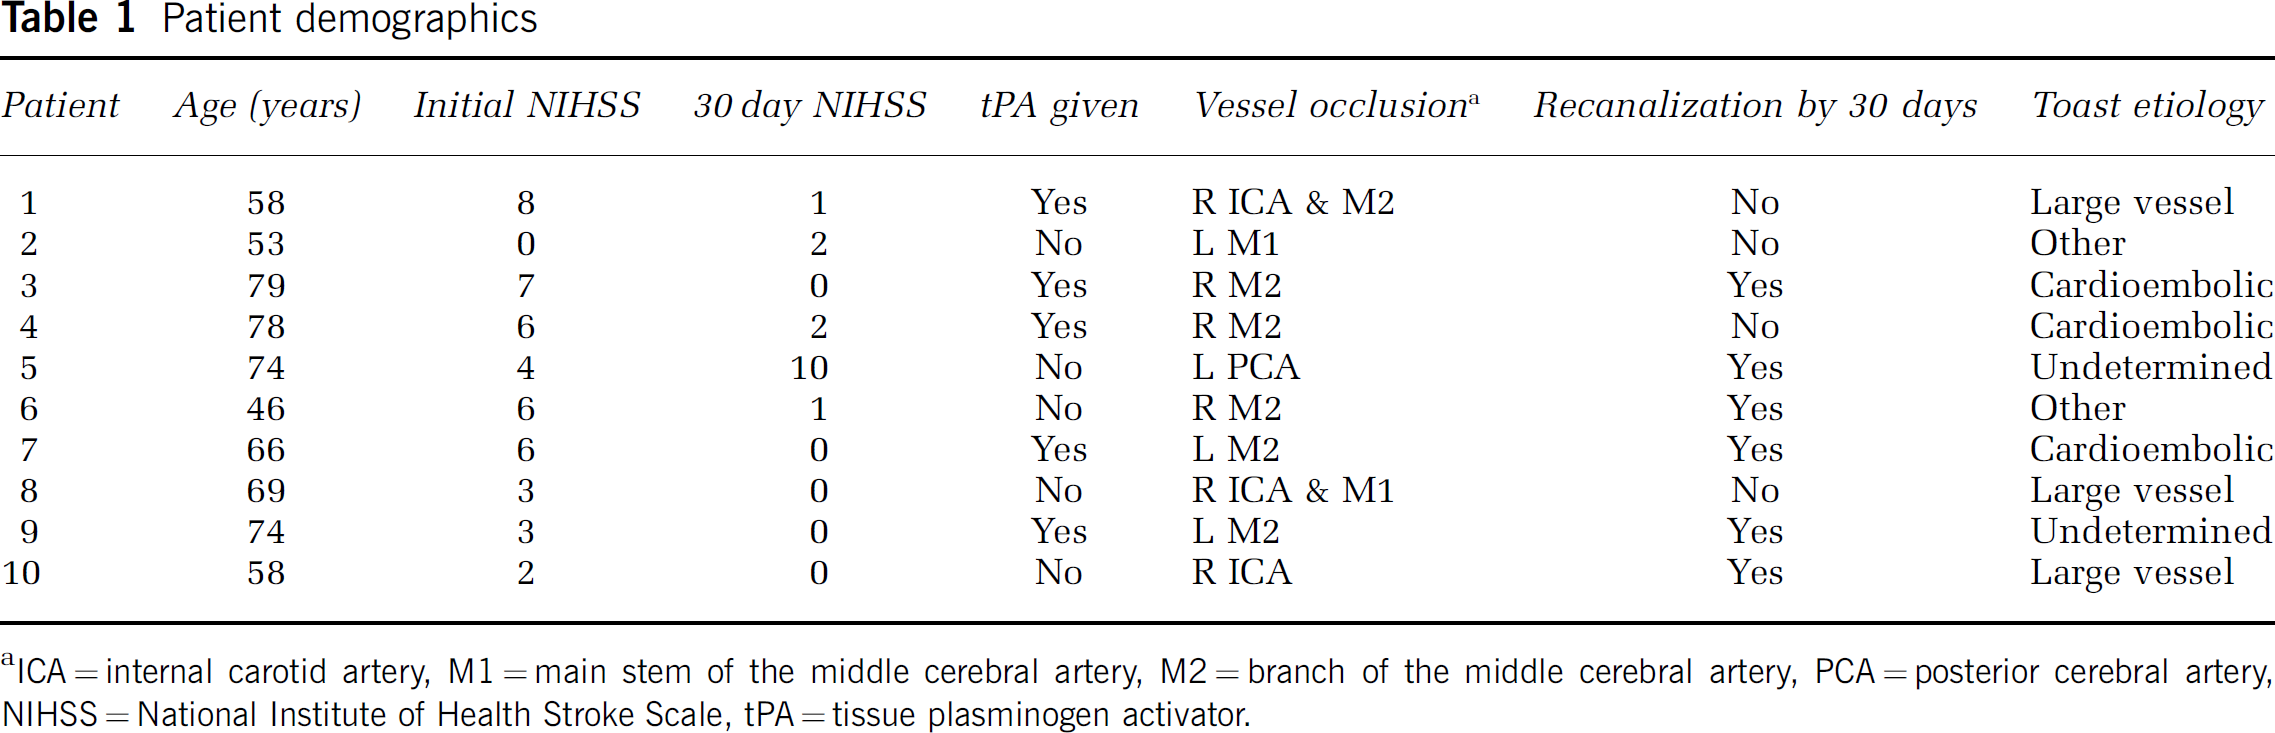
ICA = internal carotid artery, M1 = main stem of the middle cerebral artery, M2 = branch of the middle cerebral artery, PCA = posterior cerebral artery, NIHSS = National Institute of Health Stroke Scale, tPA = tissue plasminogen activator.
Comparing Gray and White Matter
The mean and s.d. of the CBF in GM and WM and of the volume for each region are shown in Table 2. The mean difference between GM and WM and the 95% CI of this mean difference is shown for each compartment in Figure 2. This figure illustrates that GM and WM differ widely and significantly in the normal brain tissue (P<0.001) and also in the MTT-Delayed region (P = 0.001). In the Growth region, the GM had a CBF 5.5 mL/100 g min higher than the CBF of WM (95% CI 0.8 to 9.4 mL/100 g min, P = 0.015). Nine subjects had tissue in both GM and WM in the Reversed region and the mean difference was similar to the Growth region but did not reach statistical significance (mean difference 4.3 mL/100 g min, 95% CI −0.5 to 9.0 mL/100 g min, P = 0.069). In the Core region, there was no difference between CBF in GM and WM (P = 0.708).
Mean (s.d.) of the CBF and volume for gray and white matter in each compartment
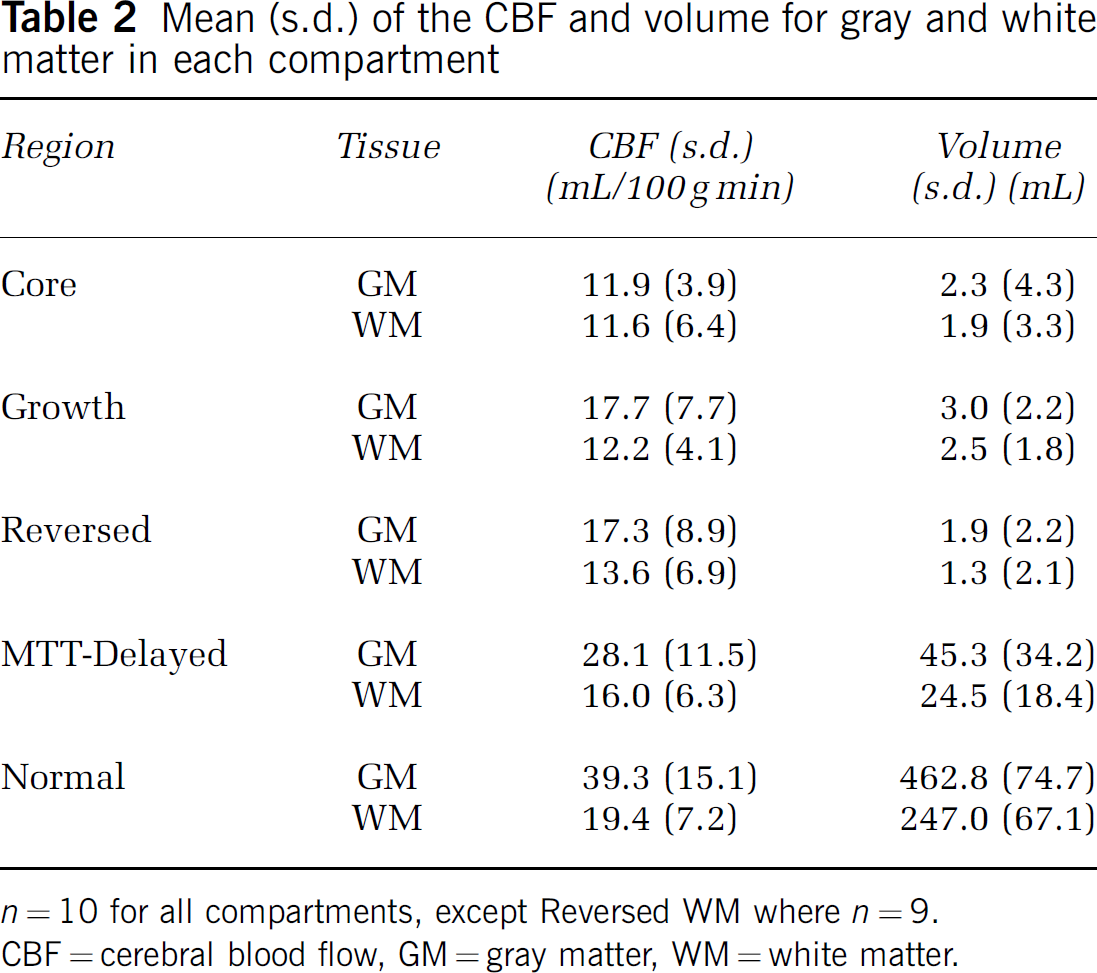
n = 10 for all compartments, except Reversed WM where n = 9.
CBF = cerebral blood flow, GM = gray matter, WM = white matter.
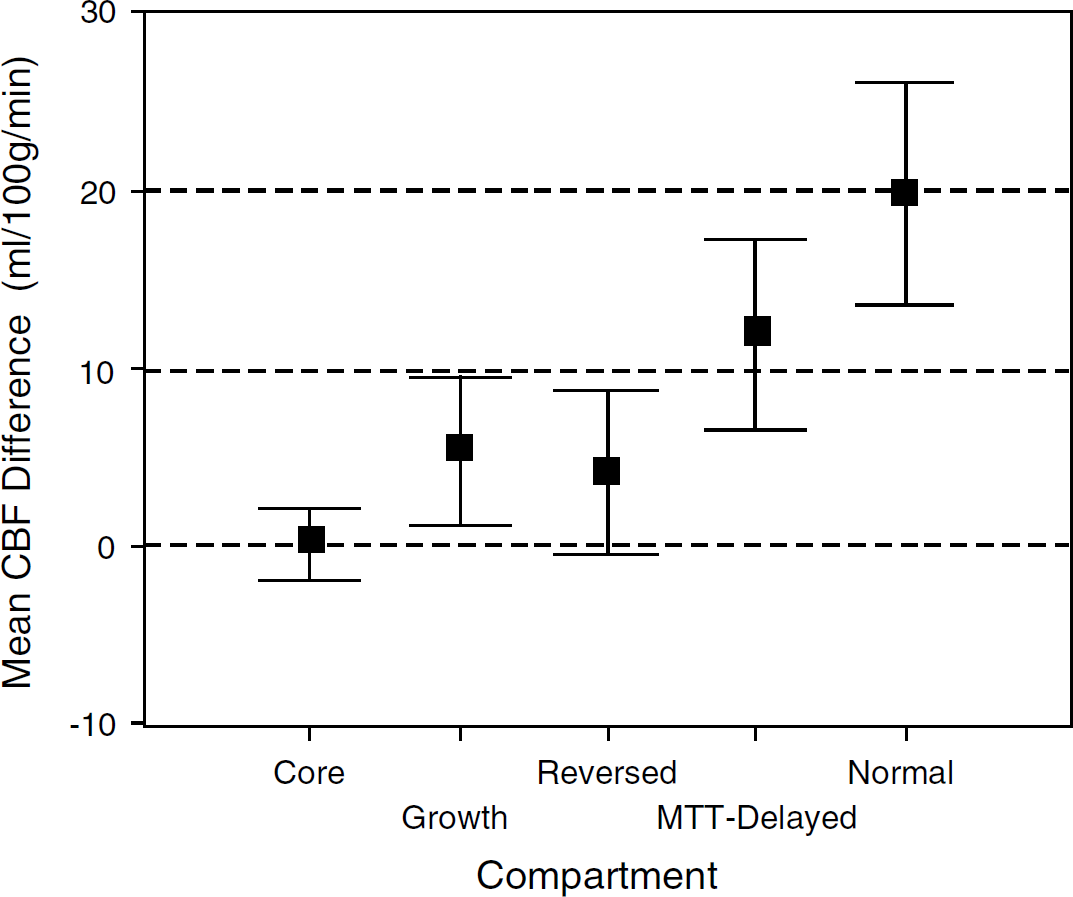
Mean difference between paired gray matter (GM) and white matter (WM) cerebral blood flow (CBF) for each region. The 95% CI are displayed. Where the CI does not cross zero, there is a statistically significant CBF difference between GM and WM in that compartment (n = 10 for all compartments, except Reversed where n = 9).
Comparing Compartments
Figure 3 shows the mean of the GM and WM CBF values within each compartment. The compartments are ordered along the horizontal axis to reflect the theoretical depth of ischemia, with core infarct at one extreme and normal tissue at the other. One can observe that CBF in GM is indeed lower in the core than in normal tissue. Normal GM CBF was significantly different from all other tissues except the MTT-delayed region (P<0.05). The Core region GM CBF was significantly different from both the MTT-delayed and Normal CBF (P<0.05). The differences between GM CBF in Core, Growth, and Reversed regions were not statistically different. Neither were there statistically significant differences in WM CBF between any of the compartments.
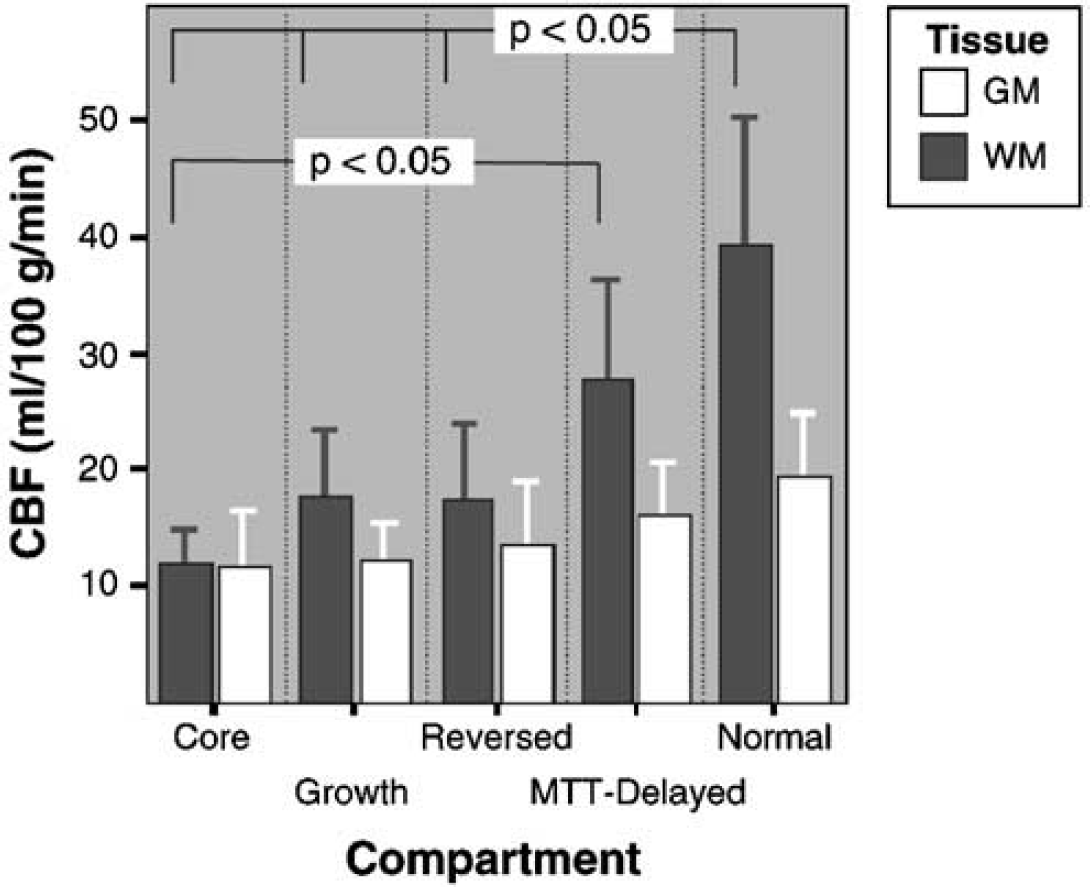
Mean cerebral blood flow (CBF) of gray matter (GM) and white matter (WM) for each compartment. The error bars show the upper 95% CIs of the means. There is a significant difference between Normal GM CBF and the Reversed, Growth, and Core compartments and between the Core and MTT-Delayed compartment. The other compartments and WM CBF do not differ significantly (n = 10 for all compartments, except Reversed WM where n = 9).
Discussion
This MR imaging study has shown that the blood flow in cerebral GM and WM can be separately characterized in acute stroke with the addition of an IRSEPI sequence and appropriate postprocessing. We found differences between GM and WM CBF within normal and ischemic compartments but not core infarct.
Gray and White Matter Differences within the Compartments
The compartments we defined were based on a model of stroke, which has been well described in reviews by Baron (2001a, b ) and by Kidwell et al (2003). We were limited by our small, heterogeneous sample and only a late follow-up scan to assess recanalization, so that it was not appropriate to compare the patients with and without recanalization directly. Our study focused, therefore, on examining GM and WM CBF differences using the pooled data. Gray matter had significantly higher CBF than WM in normal and oligemic brain—metabolic demand is coupled to CBF in functioning brain, with GM having a greater requirement than WM (Sokoloff, 1978). Similarly, in the Growth region, GM had significantly higher blood flow than WM, supporting the hypothesis that tissue damage occurs at a higher CBF in GM. The Reversed compartment potentially represented salvaged penumbra (tissue which was abnormal on acute diffusion but that did not go on to be part of the final infarct) and was expected to show the same GM/WM differences; however, this did not reach statistical significance. The small sample size and stroke volumes and any errors in coregistration or the semiautomatic segmentation could account for some of the variability of CBF and the lack of statistical difference. We further analyzed the combined data from the growth and reversed regions, to consider the penumbral compartment as a whole, and found a significant difference between GM and WM CBF (paired t-test, P<0.02). In Core tissue, we found no difference between GM and WM CBF. We hypothesize that in this profoundly ischemic region all compensatory mechanisms had failed, so that differential flow of blood to match the separate metabolic demands of GM and WM could not be maintained. This observation agrees with data from animal models, in which GM and WM had a similar absolute CBF associated with total necrosis on histology (Marcoux et al, 1982). At this critically low CBF (5 mL/100 g min in Macaque monkeys), it was only the duration of ischemia at which total necrosis occurred that varied—GM damage occurred earlier than WM damage. Our current data does not allow for exploration of the time dependency of infarction but this will be the subject of future studies.
Methodological Advantages and Limitations
A major advantage of using the IRSEPI sequence to obtain GM and WM contrast was the high speed of its acquisition and segmentation (each taking under one minute). Speed is important for future clinical application because in acute stroke, ‘time is brain'. To our knowledge, this was the first MR imaging, stroke study to measure CBF in all GM and WM, as opposed to in operator-selected, sample regions-of-interest. The voxel-by-voxel approach has advantages over relative measures comparing affected hemisphere against ‘mirror’ normal regions-of-interest (Grandin et al, 2001; Butcher et al, 2003), because the latter suffers from errors because of brain asymmetry. The automatic IRSEPI segmentation, however, is problematic because many voxels are likely to have contained a partial volume of GM, WM, or CSF. Further studies are necessary to examine the accuracy of the segmentation, although there is no in vivo ‘gold standard’ against which to test the resulting tissue volumes. Because it is an EPI sequence, IRSEPI has the same type of susceptibility artefact as the PWI and DWI. This makes coregistration by linear methods straightforward. The IRSEPI was relatively insensitive to acute ischemic change in the images obtained within 6 h of symptom onset. A disadvantage of the sequence, however, is that subacute ischemic regions or remote infarcts appear hyperintense on IRSEPI and would be classified as GM using the current segmentation method. We also simplified tissue segmentation, combining all GM into a single category. Studies have suggested, however, that cortical and subcortical GM have different perfusion characteristics and that regional cortical CBF variations exist (Leenders et al, 1990; Helenius et al, 2003). Ultimately a brain atlas registered to images such as IRSEPI could provide detailed comparisons of GM and WM thresholds in different anatomic or even functional regions (Menezes et al, 2003).
We considered that the entire region of MTT delay revealed the extent of tissue normally directly supplied by the occluded vessel, and that this region contained both ‘at risk’ penumbra and ‘benignly’ oligemic tissues. This differs from some studies that have considered the whole MTT region or areas over an estimated critical threshold to be penumbra (Butcher et al, 2003). A disadvantage of manually outlining the MTT-delayed region is intrarater variability (Coutts et al, 2003) but applying a set threshold is subject to other errors, such as including voxels with noise and variability between patients. One of our patients (subject 8), with a chronic, proximal ICA stenosis and no recanalization of an acute, ipsilateral MCA occlusion, had a greatly prolonged MTT throughout the affected hemisphere, but only a small final infarct. This suggests a large area of compensated benign hypoperfusion, which would have been incorrectly labeled as penumbra by the application of a set MTT threshold.
Obtaining absolute CBF from MR is problematic. Our quantitation was dependent on a variety of assumptions and the accuracy of AIF determination (Calamante et al, 2002). There is no easy way to validate or compare these CBF values with other MR studies. What is important is that our CBF values were comparable across the patients (even despite changes in PWI acquisition parameters during the study) and that, in general, CBF measures have some predictive value. The ability to define the outcome of an individual voxel, based on a single measure of CBF, remains limited, however, by the substantial overlap in CBF between the ischemic compartments (Figure 3). It is probable that increased predictive accuracy will come from combinations of multiple MR contrasts, such as ADC, T2-weighting, CBF, and other perfusion parameters (Kidwell et al, 2003). Our method can be used to measure such contrasts separately in GM and WM (Simon et al, 2004). The ‘added value’ of this GM and WM analysis will depend on the anatomical location of a stroke and relative amount of each tissue in the ischemic region.
Conclusions
We have described a new method for separate GM and WM analysis in acute ischemic stroke. Accounting for the different susceptibilities of GM and WM to low perfusion has the potential to increase accuracy of tissue outcome prediction, compared with current techniques.
Footnotes
Acknowledgements
The authors acknowledge Dr Shelagh Coutts and all the staff of the VISION study, the Calgary Stroke Program, the Seaman Family MR Centre, and the patients who participated in this project. In addition, the authors are grateful to Brian O'Brien for technical support, Desirae Stepien for assistance with data processing, and Dr Chul-Ho Sohn for neuroradiological input.