
Abstract
The authors investigated ionic mechanisms underlying aglycemic axon injury in adult rat optic nerve, a central white matter tract. Axon function was assessed using evoked compound action potentials (CAPs). Glucose withdrawal led to delayed CAP failure, an alkaline extracellular pH shift, and an increase in extracellular [K+]. Sixty minutes of glucose withdrawal led to irreversible axon injury. Aglycemic axon injury required extracellular calcium; the extent of injury progressively declined as bath [Ca2+] was decreased. To evaluate Ca2+ movements during aglycemia, the authors recorded extracellular [Ca2+] ([Ca2+]o) using Ca2+-sensitive microelectrodes. Under control conditions, [Ca2+]o fell with a similar time course to CAP failure, indicating extracellular Ca2+ moved to an intracellular position during aglycemia. The authors quantified the magnitude of [Ca2+]o decrease as the area below baseline [Ca2+]o during aglycemia and used this as a qualitative measure of Ca2+ influx. The authors studied the mechanisms of Ca2+ influx. Blockade of Na+ influx reduced Ca2+ influx and improved CAP recovery, suggesting Na+-Ca2+ exchanger involvement. Consistent with this hypothesis, bepridil reduced axon injury. In addition, diltiazem or nifedipine decreased Ca2+ influx and increased CAP recovery. The authors conclude aglycemic central white matter injury is caused by Ca2+ influx into intracellular compartments through reverse Na+-Ca2+ exchange and L-type Ca2+ channels.
The high metabolic rate of the mammalian central nervous system (CNS) demands a continuous supply of glucose and oxygen (Clarke and Sokoloff, 1999). Consequently, catastrophic damage occurs when this supply is interrupted. Glucose deprivation, or aglycemia, also can occur independently of oxygen deprivation and is a common occurrence in diabetic patients (Siesjö, 1988). The study of this condition can provide insights into how energy failure disrupts brain function and leads to irreversible injury. One important difference between aglycemia-induced brain injury and that with ischemia or anoxia is that aglycemia injures in the absence of acidosis (Auer et al., 1984).
The effects of aglycemia on gray matter areas of the brain have been extensively studied (Cheng et al., 1994; Choi, 1988; Nijjar, 1993) and reviewed (Choi, 1992; Siesjö et al., 1989). Aglycemia in hippocampus and cortex leads to a rapid reduction in intracellular adenosine triphosphate (ATP) levels (Harris et al., 1984). Because approximately 50% of ATP in the brain is used to maintain ionic gradients, mainly through Na+-K+-ATPase, loss of ATP leads to a breakdown in ionic gradients and a subsequent increase in extracellular glutamate and aspartate (Takata and Okada, 1995; Takata et al., 1995). The protective effects of reducing [Ca2+]o (Cheng and Mattson, 1992; Goldberg et al., 1986) and NMDA receptor antagonists (Goldberg and Choi, 1993) strongly suggest that neuronal death occurs by activation of Ca2+ permeable glutamate receptors, which leads to increased [Ca2+]i (Choi, 1992; Siesjö et al., 1989).
In white matter (WM), those areas of the CNS containing only axons and glial cells, the mechanism of aglycemic injury is not known. The authors analyzed the ionic mechanisms of aglycemic injury in the adult RON, a representative central WM tract, and recorded both CAPs and [Ca2+]o to monitor nerve function and Ca2+ fluxes, respectively. The current results indicated the following: extracellular Ca2+ was required for aglycemic WM injury; during aglycemia, Ca2+ entered an intracellular compartment(s) in close temporal relation to CAP failure; and Ca2+ entry was mediated by reverse Na+-Ca2+ exchange and L-type Ca2+ channels.
MATERIALS AND METHODS
Preparation
Long Evans rats were deeply anesthetized with CO2 and then decapitated. The optic nerves were exposed by lifting the cerebral hemispheres, and the nerves (5 to 10 mm long) were cut at the optic chiasm and behind the orbit. The optic nerves were gently freed from their dural sheaths and placed in an interface perfusion chamber (Medical Systems, Greenvale, NY, U.S.A.) (Stys et al., 1990b). RONs were maintained at 37°C and perfused with artificial cerebrospinal fluid (aCSF) that contained (in mmol/L): 153 Na+, 3 K+, 2 Mg2+, 2 Ca2+, 143 Cl−, 26 HCO3−, 1.25 HPO42-, and 10 glucose. The aCSF was bubbled with an O2-free gas mixture (95% N2: 5% CO2) to maintain pH at 7.45. Tissue was oxygenated by a humidified gas mixture (95% O2: 5% CO2) that flowed over its surface. Anoxia was induced by switching from the control gas mixture of 95% O2: 5% CO2 to a mixture containing 95% N2: 5% CO2. The chamber was modified (Ransom and Philbin, 1992) to ensure rapid exchange of the ambient air mixture in the chamber. A suction electrode back-filled with aCSF was attached to the distal end of the nerve and stimulated every 30 seconds (WPI, Sarasota, FL, U.S.A; Isostim 130). A recording electrode filled with aCSF was attached to the proximal end of the nerve to record the CAP, which was evoked by a 125% supramaximal stimulus (50 microseconds in duration). Compound action potentials were recorded from a suction electrode connected to an Axoclamp 2A amplifier (Axon Instruments, Foster City, CA, U.S.A.); the signal was amplified 500x, filtered at 30 kHz, and acquired at 20 kHz.
Nerves were allowed to equilibrate for 60 minutes before recording commenced. During glucose deprivation, the solution in the stimulating and recording electrodes was switched to glucose-free aCSF. No osmotic compensation was made, but the change in osmolarity was only approximately 3%. Ca2+ free aCSF was made by omitting CaCl2 and adding 5 mmol/L ethylene glycol-bis(β-aminoethylether)-N,N,N′,N′-tetraacetic acid (EGTA). Introduction of test aCSF containing 1 mmol/L, 0.5 mmol/L, or 0 Ca2+ occurred 20 minutes before the 1-hour period of aglycemia to allow the extracellular space (ECS) and bath solution to equilibrate. Zero Na+ aCSF was made by substituting equimolar choline chloride for NaCl and was introduced 20 minutes before and until 15 minutes after the 60-minute period of aglycemia. Drugs were applied for 60 minutes before until 15 minutes after 1 hour of aglycemia.
Electrodes
Ca2+-sensitive microelectrodes were made with double-barreled piggyback glass (WPI, PB150F-6) according to the method of Borrelli et al. (1985) with slight modifications. Electrodes were beveled to a tip diameter of 2 to 5 μm (BV-10; Sutter, Novato, CA, U.S.A.). The tip of the ion-sensitive barrel was filled with hexamethyldisilazine (52619; Fluka, Ronkonkoma, NY, U.S.A.) and baked at 160°C for 1 hour. The indifferent barrel was filled with 150 mmol/L NaCl and the ion-sensitive barrel was back-filled with 120 mmol/L NaCl, 3 mmol/L KCl, 20 mmol/L HEPES, 1 mmol/L CaCl2 adjusted to pH 7.2 with 1 mol/L HCl. The ion-sensitive barrel was filled at the tip by back injection with a short (100- to 400-μm) column of Ca2+ sensitive liquid ion sensor (Cocktail A 21098, Fluka). Electrodes were calibrated in a solution containing 120 mmol/L NaCl, 3 mmol/L KCl, 20 mmol/L HEPES, and Ca2+ concentrations of 20 μmol/L, 200 μmol/L, and 2 mmol/L. All electrodes were individually calibrated and only those showing stable, near Nernstian responses (that is, 25 to 30 mV) to decade changes in [Ca2+] were used for experimental measurements. Electrodes were recalibrated after each experiment and data from electrodes with greater than a 5 mV deviation in response to decade changes in [Ca2+] were discarded. The average between the initial and final calibrations was used to evaluate experimental data. The signal from the indifferent barrel was subtracted from the ion-sensitive signal using a differential amplifier. The signal was amplified 100x, filtered at 1 Hz, and acquired at 1 Hz.
For pH-sensitive microelectrodes, the indifferent barrel was back-filled with 1 mol/L sodium acetate + 30 mmol/L NaCl, and the ion-sensitive barrel was back-filled with 140 mmol/L NaCl + 20 mmol/L HEPES adjusted to pH 7.0 with 1 mol/L NaOH. The ion-sensitive barrel was filled with a short column of H+-sensitive liquid ion sensor (Fluka ionophore I, cocktail A, 95291). Electrodes were calibrated in solutions of pH 7.0 and 8.0 containing 140 mmol/L NaCl + 20 mmol/L HEPES, and only those showing stable, near-Nernstian responses (that is, 50 to 60 mV) to decade changes in pH were used for experimental measurements.
ECS measurements
Changes in ECS were measured using K+-sensitive microelectrodes as previously described (Dietzel et al., 1980; Hansen and Olsen, 1980; Ransom et al., 1985). The ion-sensitive electrode was manufactured as described above. The ion-sensitive barrel was filled with K+ sensitive resin (477317; Corning, San Francisco, CA, U.S.A.) and the filling solution in the ion-sensitive barrel was 100 mmol/L tetramethylammonium chloride (TMA+Cl−). The perfusion solution was control aCSF containing 1.5 mmol/L TMA+. Because of its size and charge (Hansen and Olsen, 1980; Nicholson and Phillips, 1981), TMA is restricted to the ECS (Nicholson and Phillips, 1981), although it may be initially taken up by glial cells to a stable intracellular level (Ballanyi et al., 1990). Corning 477317 resin is much more sensitive to TMA+ than to K+, thus voltage deflections of the ion-sensitive electrode reflect changes in [TMA+]o exclusively (Phillips and Nicholson, 1979; Hansen and Olsen, 1980; Ransom et al., 1985). Variations in ECS volume were calculated using the following expression (Dietzel et al., 1980):
Data analysis
Data were acquired online (Digidata 1200A; Axon Instruments) using proprietary software (Axon Instruments, Axotape). CAP area was calculated using pClamp (Axon instruments) and the ion-sensitive signal was converted to [Ca2+]o using a template created in Excel (Microsoft, Redmond, WA, U.S.A.) based on the Nernst equation. Data are presented as means and standard deviation. Significance was determined by analysis of variance using Tukey's post hoc test.
RESULTS
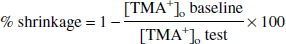
The effect of 1 hour of aglycemia on RON function is shown in Fig. 1 (Fern et al., 1998; Wender et al., 2000). Compound action potentials were recorded every 30 seconds. The CAP was maintained for 30.5 ± 1.3 minutes during aglycemia before it began to fail (Fig. 1A). It fell rapidly from that point to zero. After aglycemia, the CAP only recovered to 48.8% ± 11.0% (n = 8, Fig. 1) of its control level indicating that irreversible injury had occurred and that about half of the RON axons were affected. Representative CAPs before and after aglycemia are shown in Fig. 1B.
Aglycemic injury in control artificial cerebrospinal fluid (aCSF).
Effects of aglycemia on extracellular ion concentrations
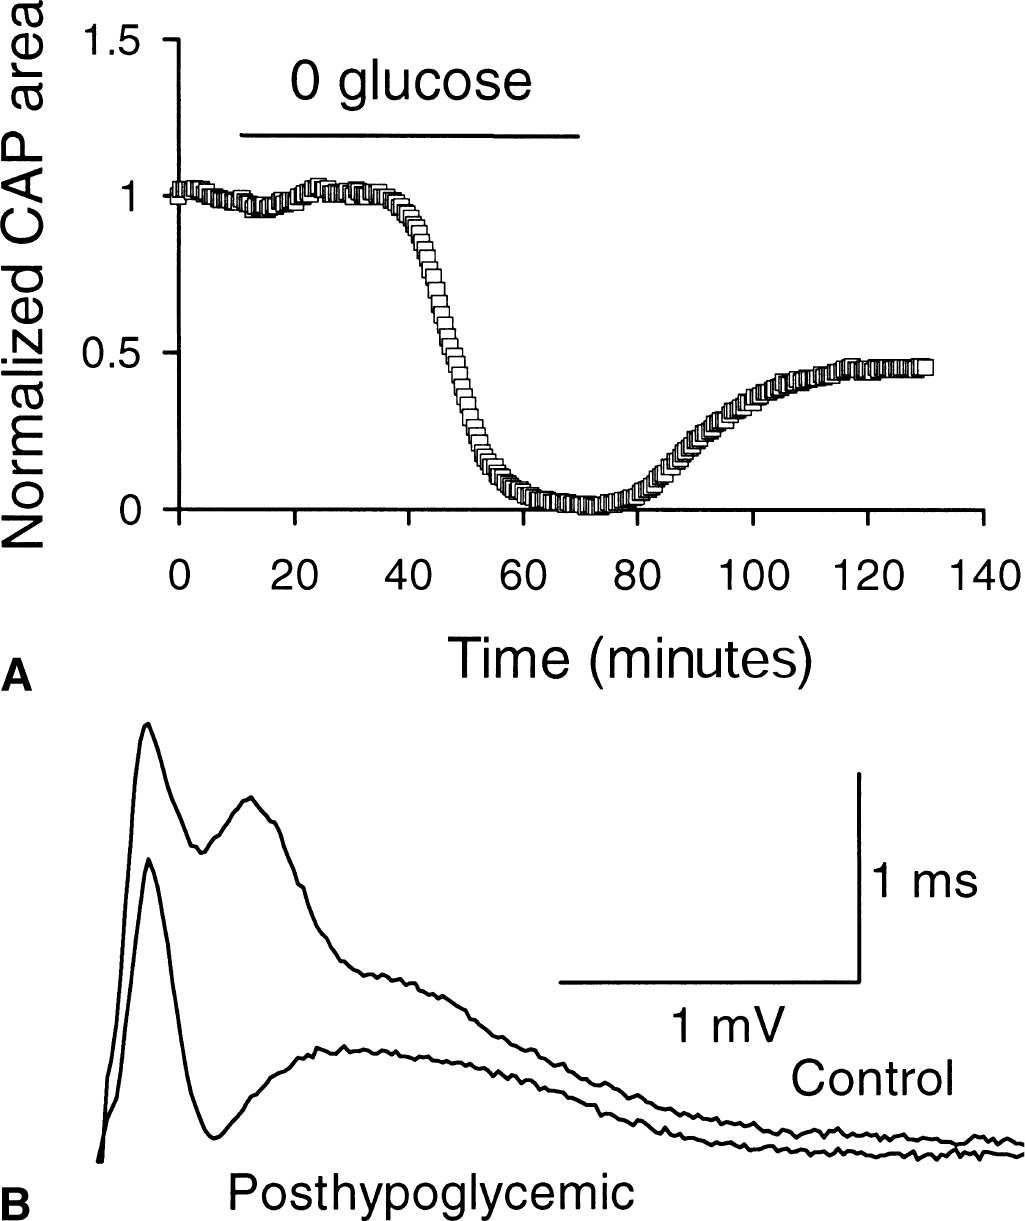
Brain energy deprivation causes changes in extracellular ion concentrations, as transmembrane ion gradients collapse (Hansen, 1985). [K+]o increased steeply as CAP amplitude fell during aglycemia (Fig. 2A). On average, [K+]o increased to 6.02 ± 1.07 mmol/L (n = 5). [K+]o began to decline toward baseline after approximately 50 minutes of aglycemia and gradually normalized after the insult.
Aglycemia induced changes in extracellular K+ and H+.
Baseline extracellular pH (pHo) in the RON under control conditions was approximately 0.2 pH units more acid than the bath solution (that is, pH 7.45). Aglycemia produced an alkalization that appeared to plateau at ∼pH 7.35 after approximately 20 minutes, followed by a subsequent further alkalization that reached pH 7.45 after 60 minutes (n = 7). During identical recording conditions, anoxia produced a rapid acidification to pH 6.95 that gradually declined during the insult and transiently dipped further in the acid direction upon return of O2 (n = 4, Fig. 2B).
Aglycemic injury requires [Ca2+]o
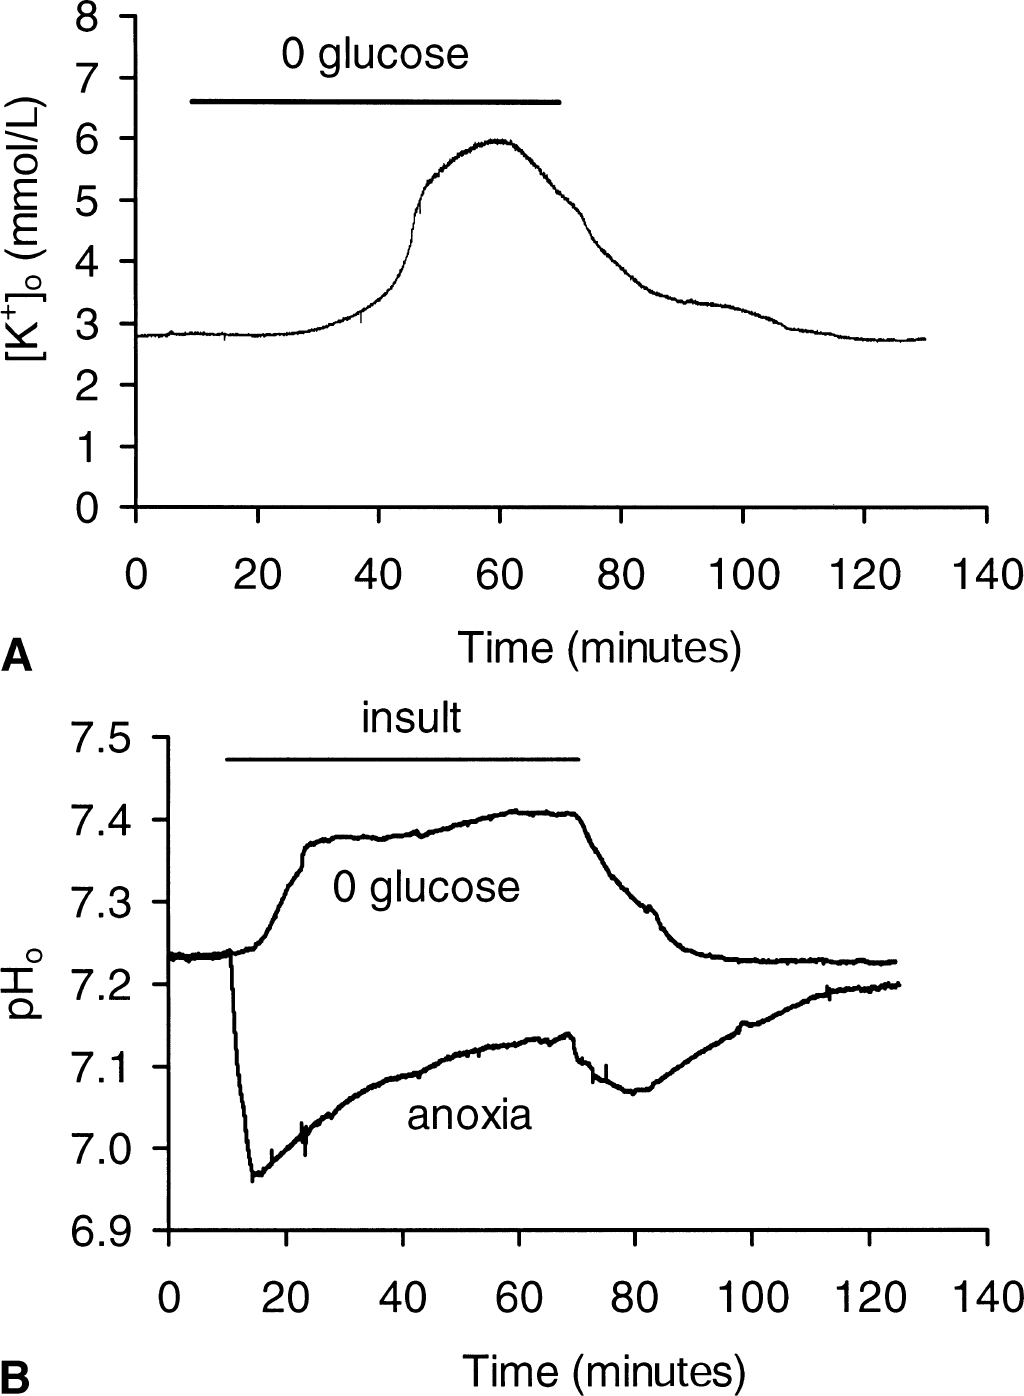
To test if aglycemic injury depended on [Ca2+]o, RONs were perfused with Ca2+-free aCSF (5 mmol/L EGTA, no Ca2+ added) for 20 minutes before and during 60 minutes of aglycemia. Ca2+-free aCSF itself resulted in a fully reversible decrease in CAP amplitude to 79.1% ± 4.1% of control (n = 6) (see small decline in CAP shown in Fig. 3A). The CAP recovered to 99.1% ± 8.3% of control after aglycemia in the absence of Ca2+ (n = 6, P < 0.0001 compared with recovery in 2 mmol/L Ca +, Fig. 3A and B). These results indicated that aglycemic injury in the RON was dependent upon the presence of extracellular Ca2+.
Aglycemic injury required bath [Ca2+].
The authors quantified the effects of baseline [Ca2+] on aglycemia-induced RON injury by imposing the insult in the presence of variable bath Ca2+ concentrations (Fig. 2C). Solutions containing the test concentration of Ca2+ were introduced 20 minutes before the 1-hour period of aglycemia and were maintained during the insult. The total divalent cation concentration in solutions was maintained at 4 mmol/L by adding Mg2+ in exchange for Ca2+; this prevented nonspecific charge screening effects from interfering with CAP amplitudes (Brown and Ransom, unpublished data). After the period of aglycemia, nerves recovered for 1 hour in control aCSF containing 2 mmol/L Ca2+ (Fig. 3C; only CAP recovery is shown for clarity). Compound action potential areas fell to zero during aglycemia for all [Ca2+]s tested (not illustrated). The degree of CAP recovery, however, depended upon the Ca2+ concentration the nerve was exposed to during aglycemia; greater recovery (that is, less injury) was seen with [Ca2+]s less than 2 mmol/L (Fig. 3C and 3D).
Aglycemia-induced changes in [Ca2+]o
Ca2+-sensitive microelectrodes were inserted into the nerve to record extracellular Ca2+ concentration ([Ca2+]o) during and after aglycemia. Baseline [Ca2+]o in the optic nerve perfused with control aCSF containing 2 mmol/L Ca2+ was 1.55 ± 0.05 mmol/L (n = 6), a concentration that remained stable for several hours in control conditions (Fig. 4A). This [Ca2+]o is less than the total bath concentration of 2 mmol/L, a phenomenon reported previously (Brown et al., 1998; Heinemann et al., 1990). The [HCO3−] of stock and physiologic solutions reduces ionized [Ca2+] by approximately 25% (Schaer, 1974; Brown et al., 1998). Aglycemia caused a final alkaline shift of extracellular pH to 7.43 ± 0.05 (n = 7, Fig. 2B). However, the authors found that pH shifts in this range had no effect on [Ca +]o. This is consistent with the fact that pH changes between 7.2 and 7.5 would produce only small changes in [HCO3−] that are unlikely to significantly alter [Ca2+]o.
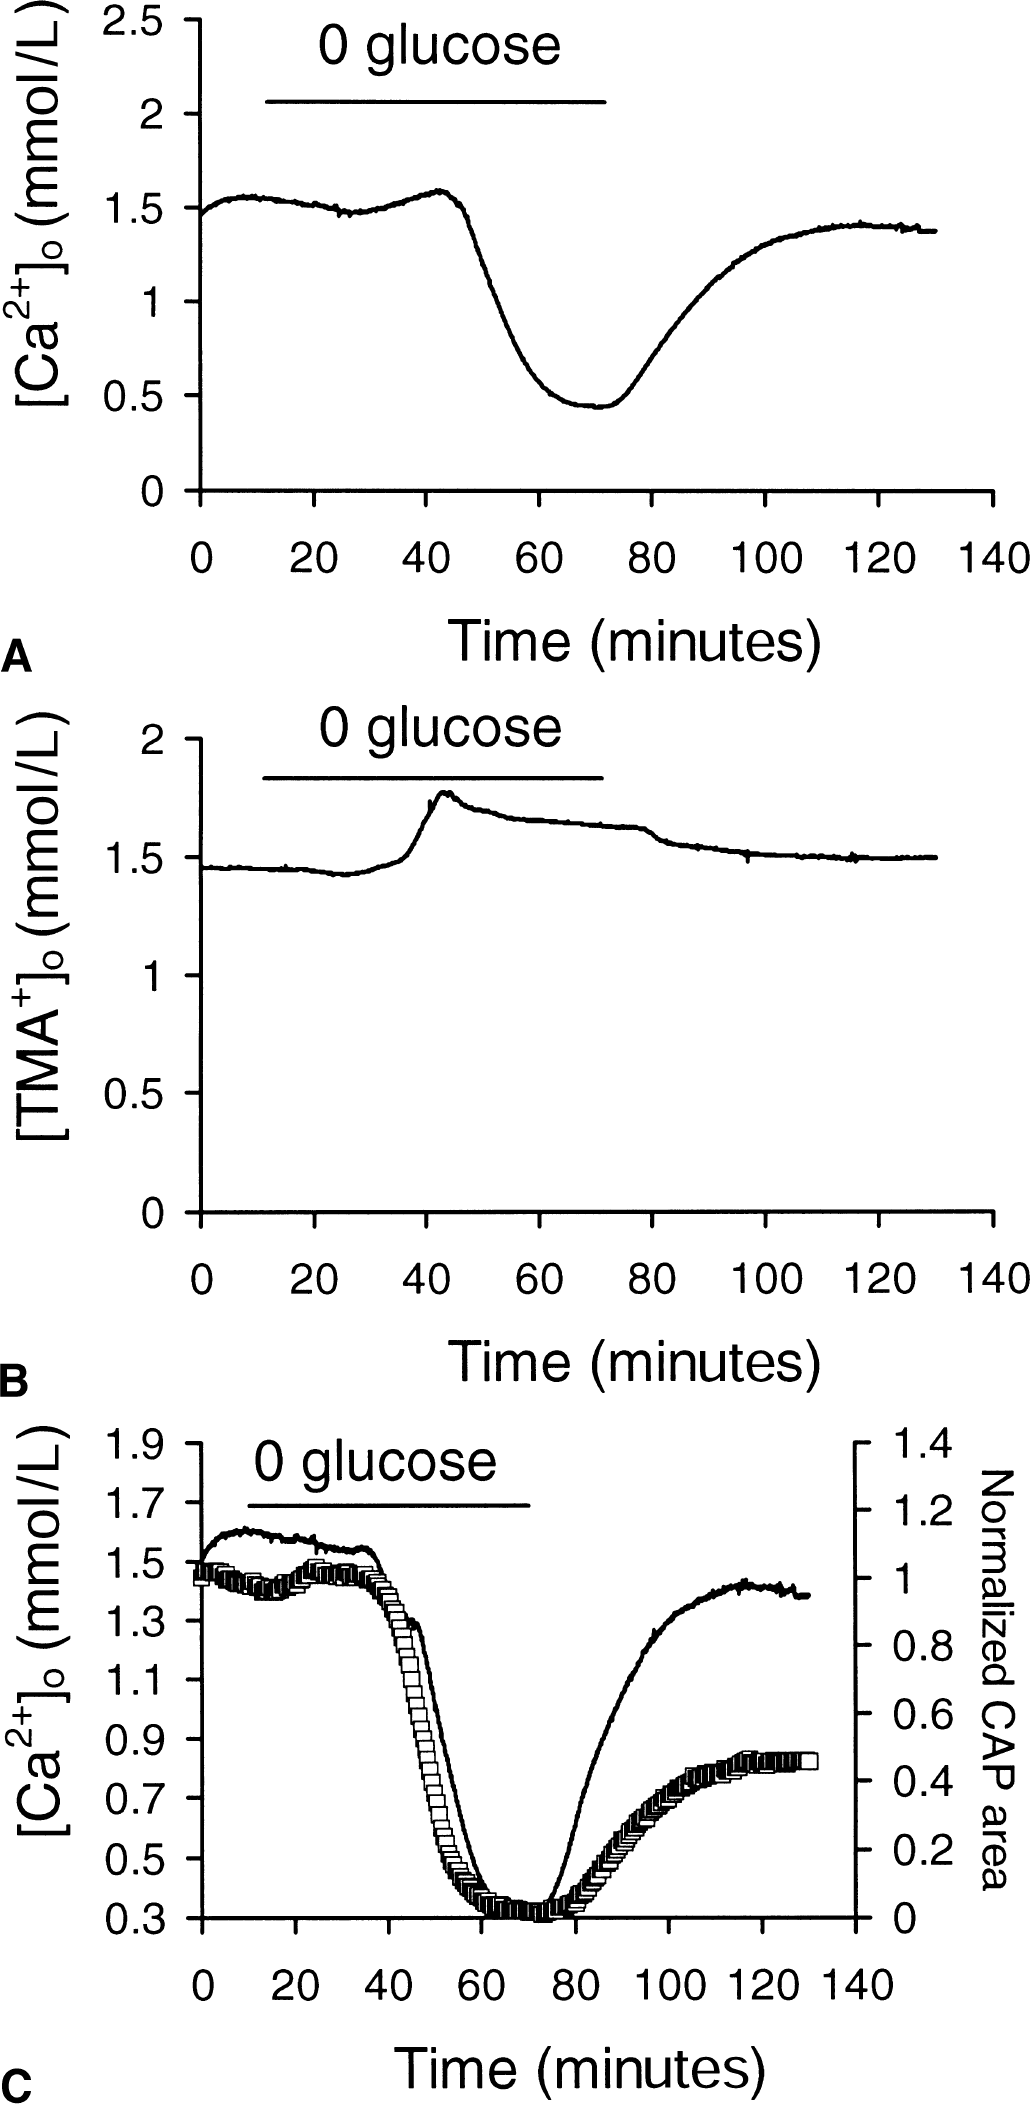
[Ca2+]o decreased during aglycemia at the time of compound action potential (CAP) failure.
Aglycemia produced a biphasic disturbance in [Ca2+]o, an initial small increase to 1.66 ± 0.13 mmol/L, followed by a significant decrease to 0.45 ± 0.10 mmol/L (n = 6; P < 0.001 compared with baseline [Ca2+]o). Return to control aCSF resulted in a gradual increase in [Ca +]o to 1.44 ± 0.12 mmol/L 60 minutes later, which was not significantly different from the original baseline (P > 0.05; Fig. 4A).
Aglycemia-induced changes in extracellular space volume
Information about changes in ECS volume during aglycemia was sought to explain the initial increase in [Ca2+]o. Nerves were perfused with aCSF containing 1.5 mmol/L TMA+ and ion-sensitive microelectrodes were used to measure [TMA+]o. Changes in [TMA+]o reflect transient changes in ECS volume (see Materials and Methods). Baseline [TMA+]o was 1.45 ± 0.08 (n = 4) in aCSF containing 1.5 mmol/L TMA+ (Fig. 4B). Aglycemia resulted in a significant increase in [TMA+]o to 1.80 ± 0.22 mmol/L (P < 0.02), which corresponded to shrinkage of ECS volume by 25%. The time course of ECS shrinkage coincided with the rise in [Ca +]o, suggesting that the initial increase in [Ca +]o during aglycemia was because of a decrease in ECS volume, not a “primary” increase in [Ca2+]o. In fact, it was likely that Ca2+ actually entered intracellular compartments during this period. The average increase in [Ca2+]o during aglycemia was 0.11 mmol/L, amounting to a 7% increase over the average baseline concentration of 1.55 mmol/L. If this is corrected for an ECS shrinkage of 25%, [Ca2+]o actually decreased by 0.28 mmol/L.
The average time course of ECS shrinkage during aglycemia was used to modify the average time course of [Ca2+]o change during aglycemia (Fig. 4C). The average CAP area illustrated in Fig. 1A has been superimposed to illustrate that changes in the CAP and [Ca2+]o were temporally related during aglycemia (Fig. 4C).
Amount of Ca2+ influx predicts the amount of injury
The results above indicated that aglycemic injury depended on the presence of extracellular Ca + and that [Ca2+]o decreased during aglycemia with a time course similar to the decrease in CAP area. Furthermore, the degree of CAP injury from aglycemia was proportional to bath [Ca2+]. The authors recorded [Ca2+]o during aglycemia at different bath Ca2+ concentrations to estimate the amount of Ca2+ entering intracellular compartments (Fig. 5)
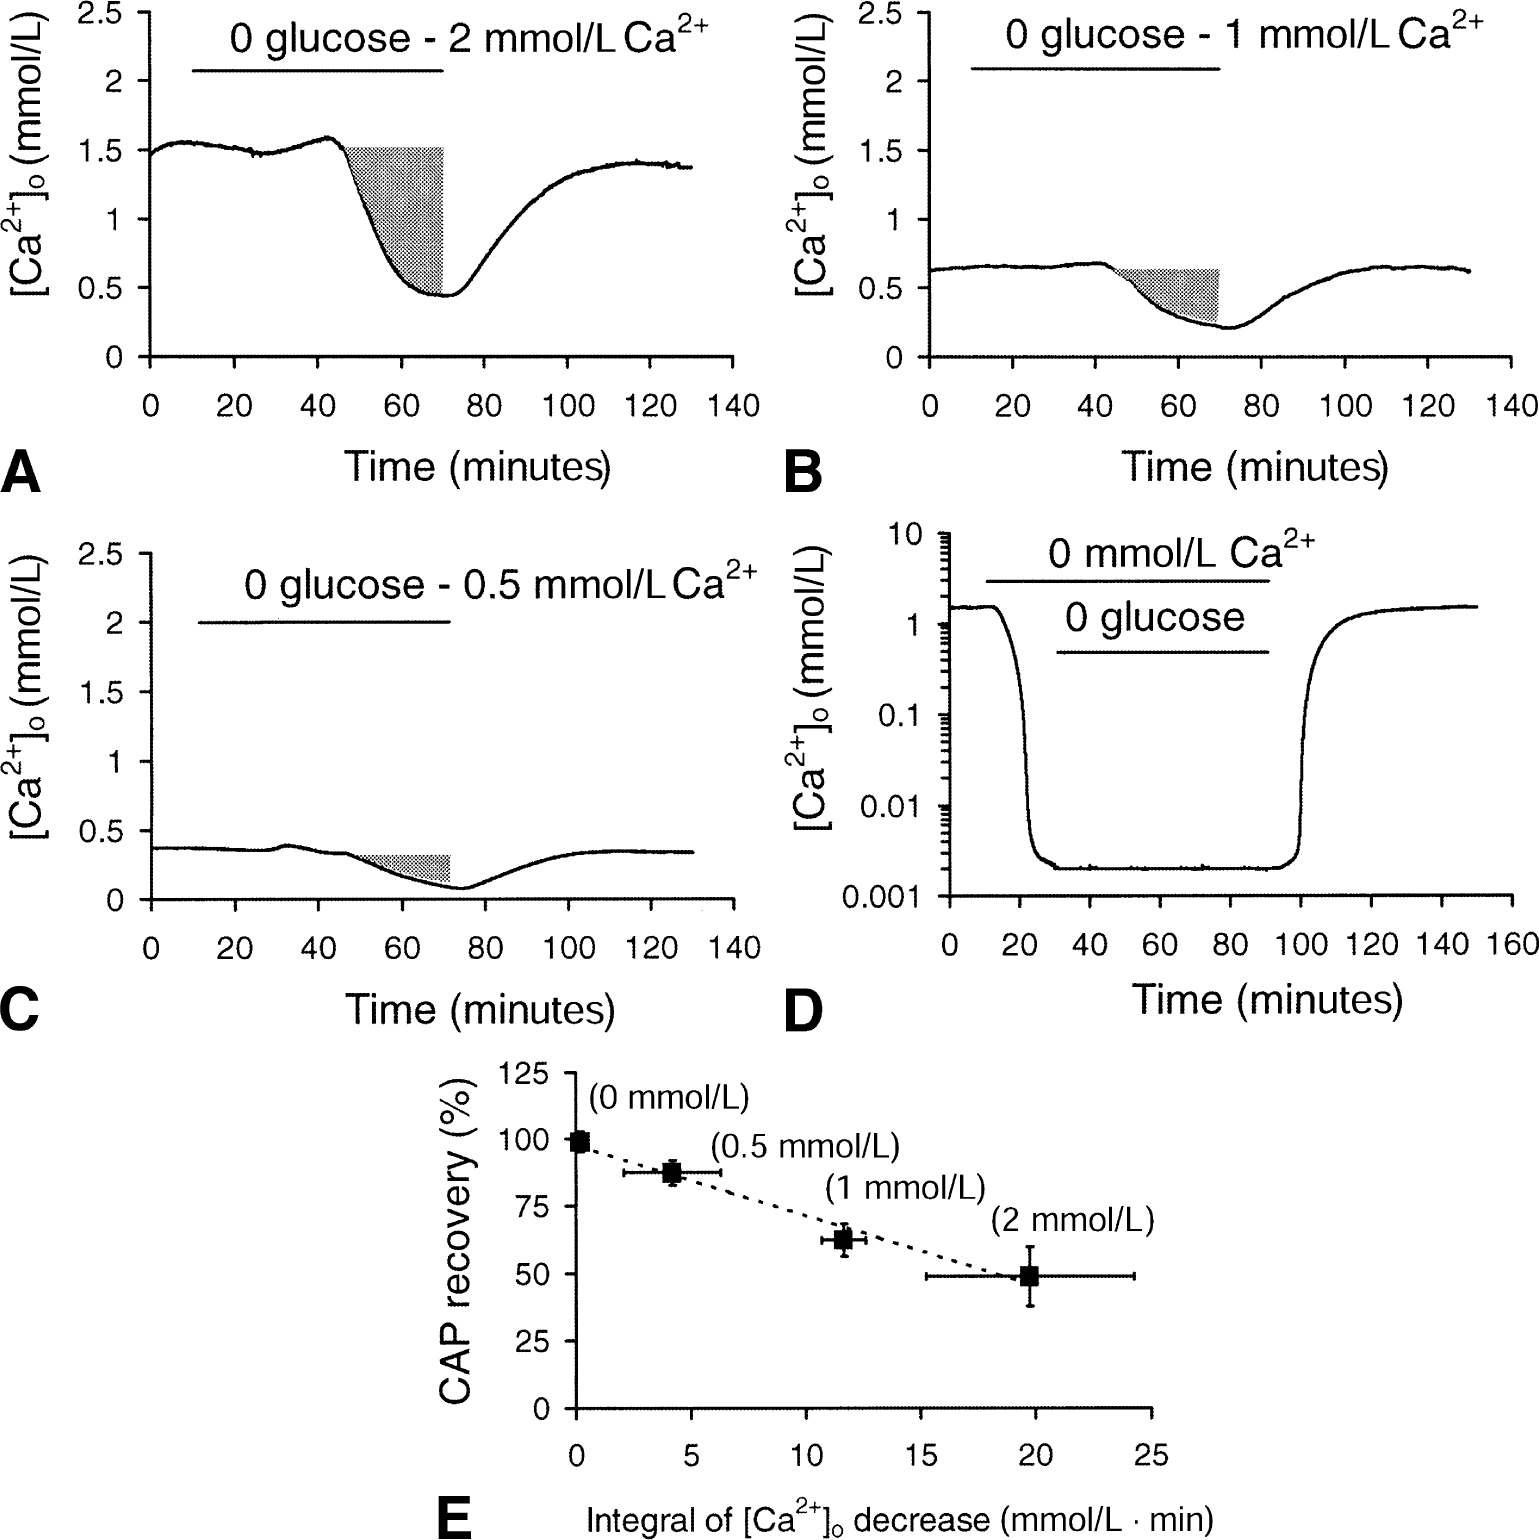
The amplitude of [Ca2+]o decrease depended on bath [Ca2+] and correlated with degree of compound action potential (CAP) loss. Record of [Ca2+]o during 1 hour of aglycemia in nerves bathed in 2
The integral of [Ca +]o decrease during aglycemia was used as a qualitative measure of the net amount of Ca + influx (see shaded areas in Fig. 5A, 5B, and 5C; too subtle to see in Fig. 5D). The integral of [Ca2+]o decrease was 19.76 ± 4.50, 11.66 ± 0.96, 4.18 ± 2.10, or 0.18 ± 0.27 mmol/L • min in 2 mmol/L, 1 mmol/L, 0.5 mmol/L, or 0 mmol/L bath [Ca2+], respectively. The relation between the integral of Ca2+ decrease during aglycemia and the magnitude of CAP recovery for different bath [Ca2+]s is illustrated in Fig. 5E. The extent of CAP recovery after 1 hour of aglycemia was linearly related to the integral of [Ca2+]o decrease (regression coefficient = 0.997).
Na+-Ca2+ exchanger and aglycemic injury in RON
Ca2+ appeared to enter an intracellular compartment(s) during aglycemia. The authors investigated the Na+-Ca2+ exchanger as a route of Ca2+ entry (Stys et al., 1992).
If Ca2+ were to enter cells through reverse Na+-Ca2+ exchange, a necessary precondition is Na+ influx leading to a reduction in the transmembrane Na+ gradient (Stys et al., 1992). The authors prevented intracellular Na+ accumulation by bathing the nerve in Na+ free aCSF. Twenty minutes before aglycemia, 0 Na+ aCSF (choline substituted) was perfused and continued until 20 minutes after the insult. Under these conditions, CAP recovery was significantly increased to 99.2% ± 7.9% compared with control (n = 5, P < 0.0001, Fig. 6A). In aCSF containing 0 Na+ during the entire experiment, aglycemia produced a minimal change in [Ca2+]o (Fig. 6B).
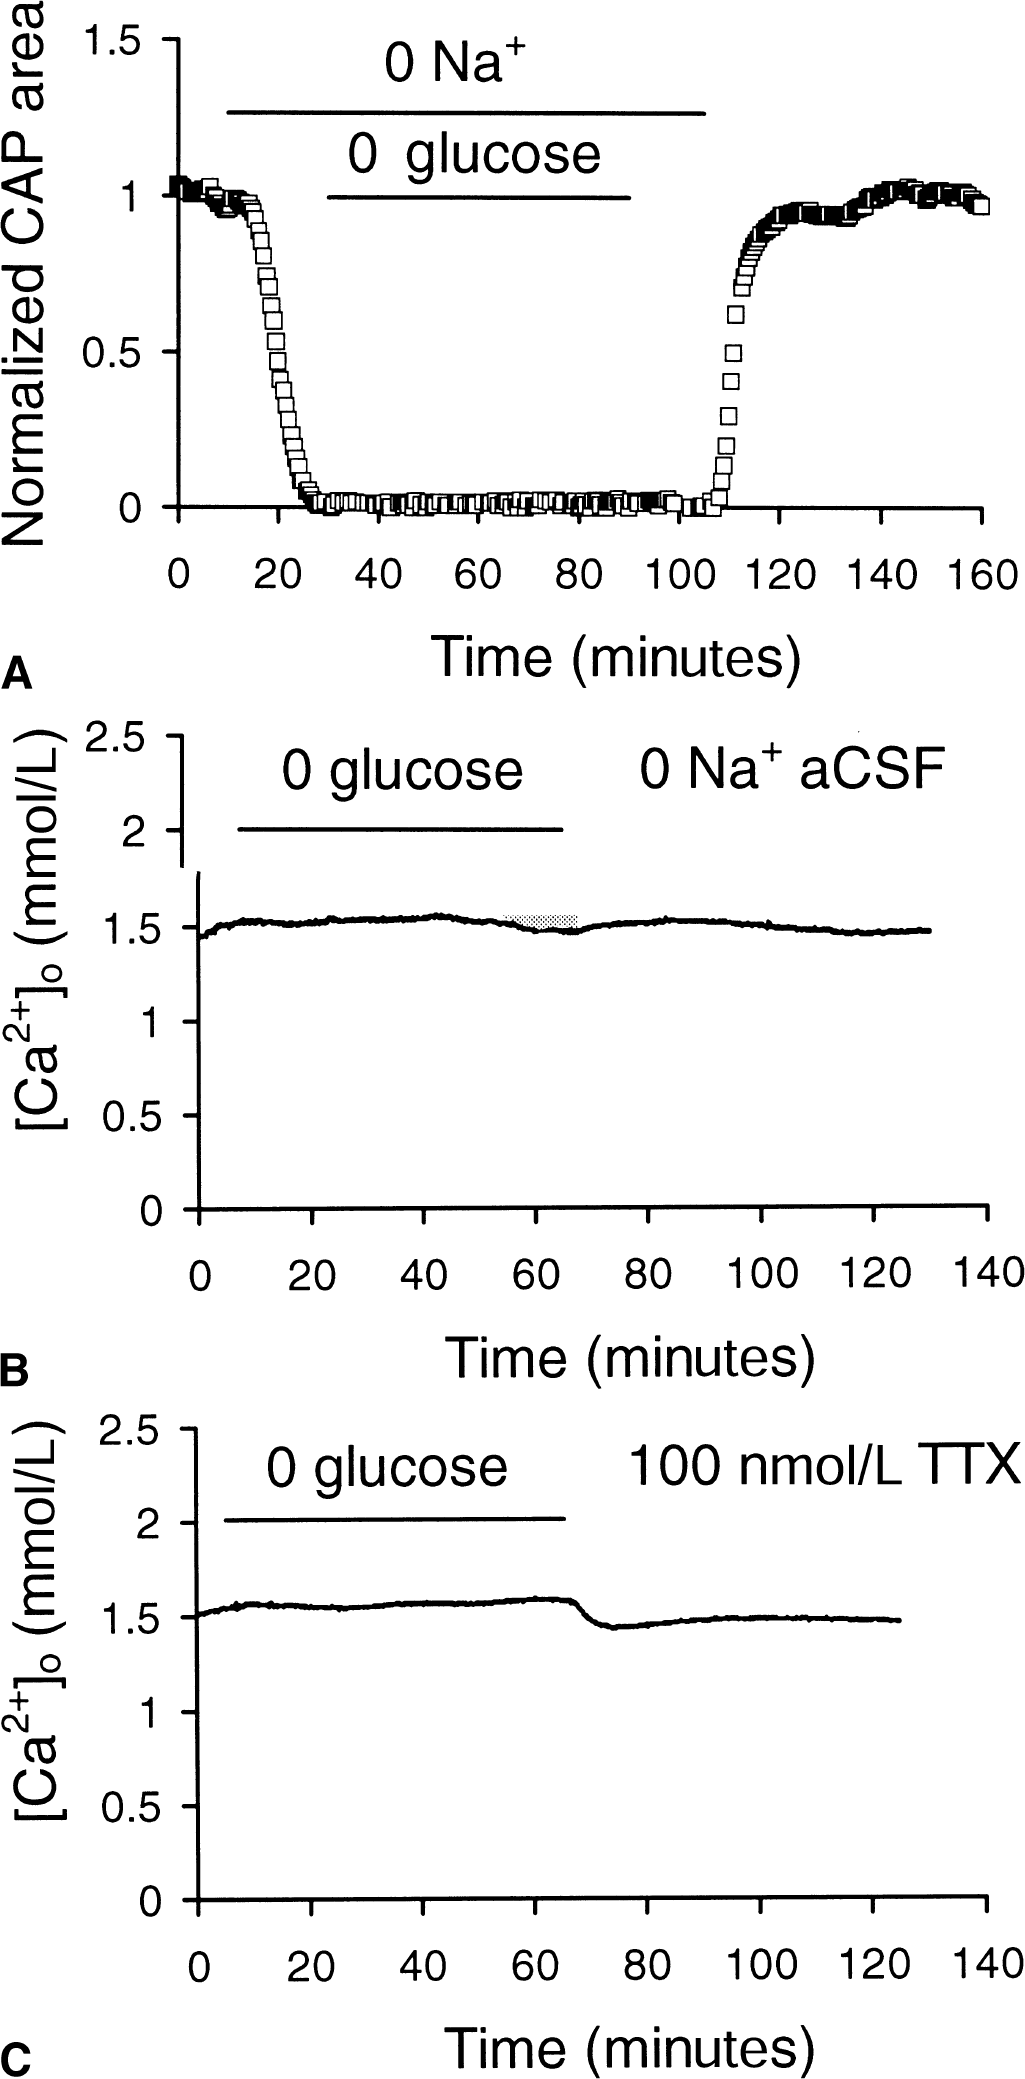
Na+ flux and aglycemia effects on compound action potential (CAP) recovery and [Ca2+]o.
To further study the role of Na+ influx in aglycemia-induced Ca2+ influx and RON injury, the authors attempted to prevent Na+ influx by blocking voltage-gated Na+ channels with 100 nmol/L tetrodotoxin (TTX). A 1-hour period of aglycemia did not significantly affect [Ca2+]o (1.55 ± 0.10 mmol/L, n = 4, compared with 1.59 ± 0.04 mmol/L) in the presence of TTX (Fig. 6C). No CAPs were recorded in this condition because TTX blocks them and the drug washes out of the tissue very slowly (Stys et al., 1992).
Bepridil (50 μmol/L), is a compound known to inhibit forward and reverse Na+-Ca2+ exchange (Stys et al., 1992). Bepridil significantly improved CAP recovery (83.1% ± 6.1% vs. 48.8% ± 11.0%, n = 6: P < 0.01; Fig. 7A and 7B). Bepridil also significantly decreased the maximum [Ca2+]o drop during aglycemia compared with control conditions (0.77 ± 0.32 mmol/L (n = 4, P < 0.05) vs. 0.45 ± 0.09 mmol/L (n = 6)), as well as the integral of [Ca2+]o decrease (4.95 ± 2.14 mmol/L • min compared with 19.76 ± 4.50 mmol/L • min, P < 0.01; Fig. 7C).
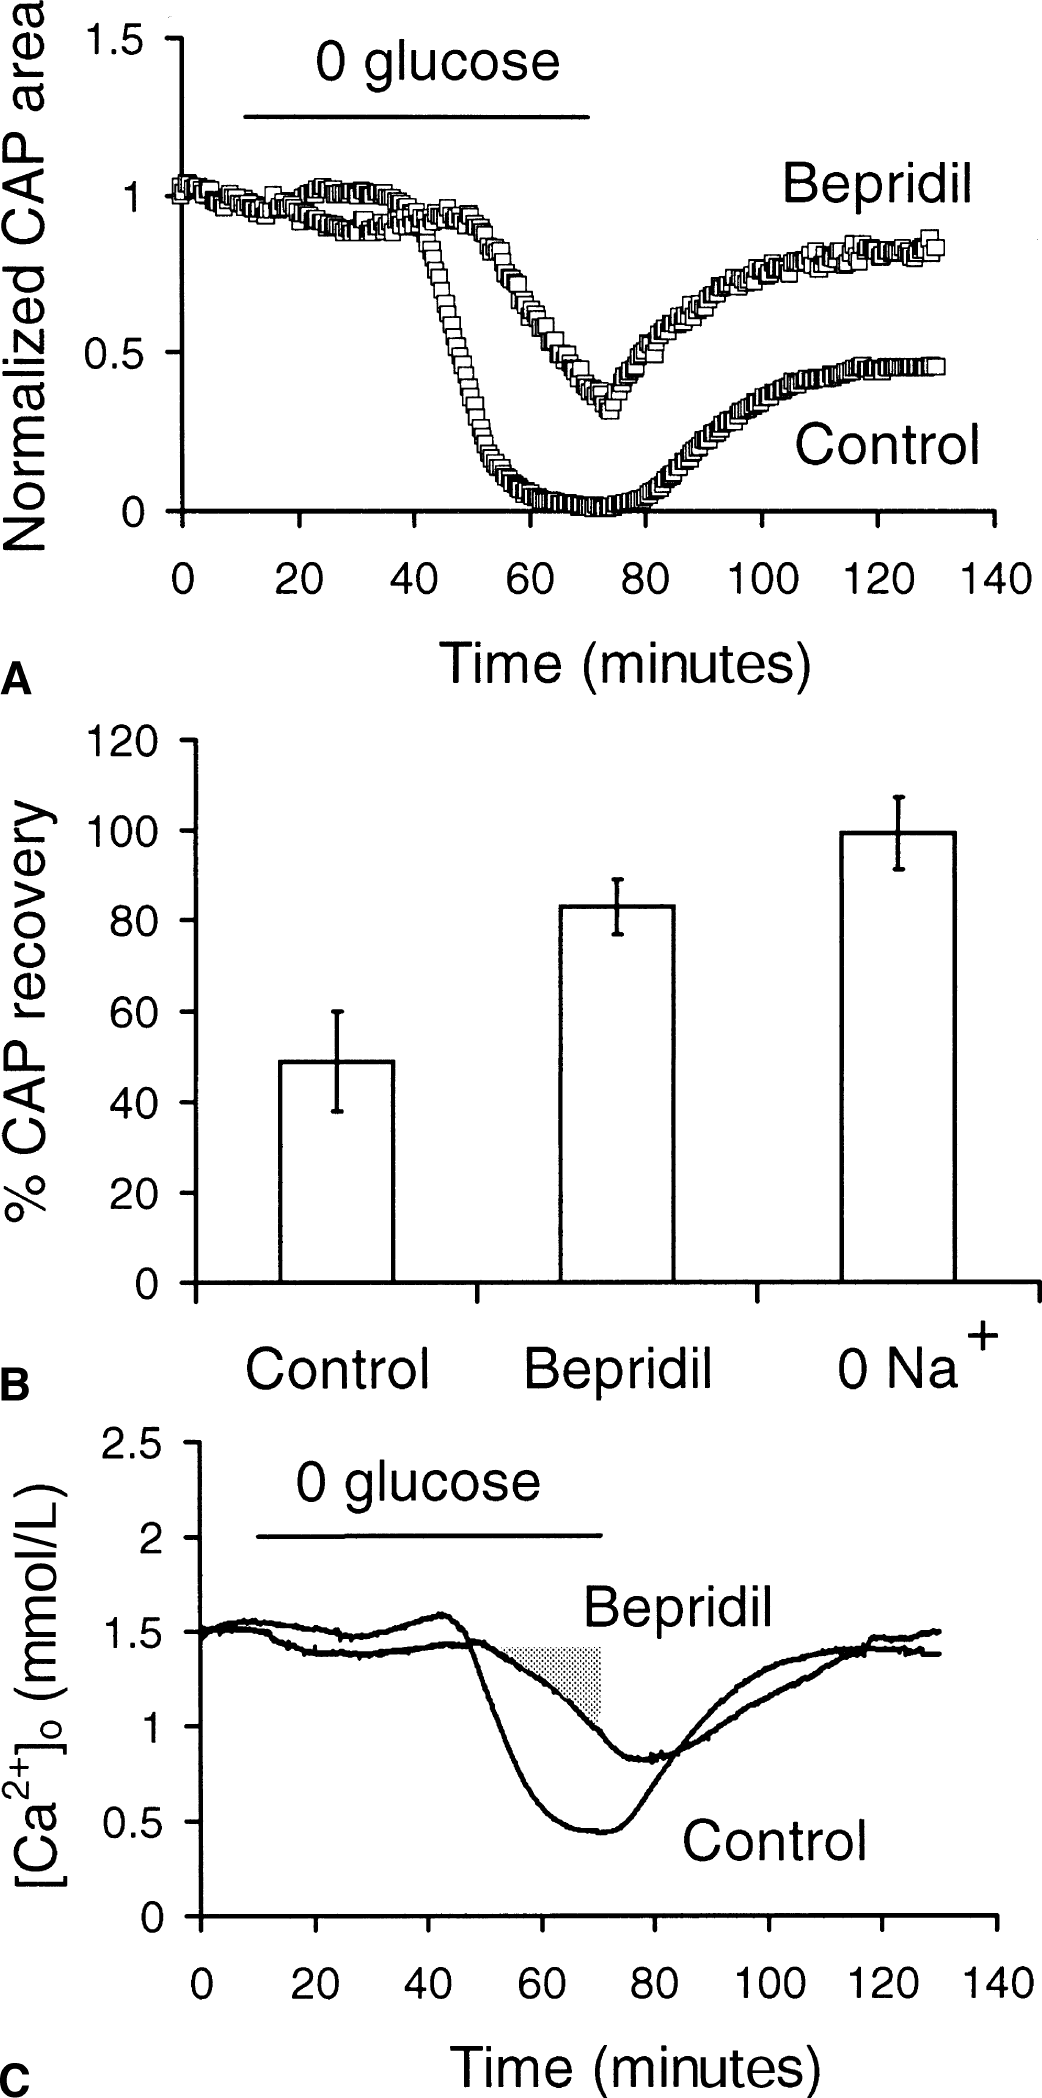
Effect of blocking Na+-Ca2+ exchange on compound action potential (CAP) recovery and [Ca2+]o.
Inhibiting L-type Ca2+ channels was neuroprotective during aglycemia
Another potential route for Ca2+ influx during aglycemia was voltage-gated Ca2+ channels, which have been implicated in anoxia-mediated Ca2+ influx (Brown et al., 2001). The benzothiazepine, diltiazem (50 μmol/L), an L-type Ca + channel blocker, improved CAP recovery from aglycemia over control recovery (76.3% ± 7.9%, n = 8, vs. 48.8% ± 11.0%; P < 0.01; Fig. 8A and 8B). In fact, CAP area never decreased to zero during aglycemia in the presence of diltiazem. In addition, the decrease in [Ca2+]o during aglycemia was significantly attenuated by diltiazem compared with control (0.82 ± 0.24 mmol/L, n = 4, vs. 0.45 ± 0.05 mmol/L in control conditions, P < 0.05; Fig. 8C), as was the integral of [Ca2+]o decrease (8.27 ± 3.02 mmol/L · min vs. 19.76 ± 4.50 mmol/L · min, P < 0.05). The authors also used the dihydropyridine, nifedipine (10 μmol/L), to block L-type Ca2+ channels. Nifedipine improved CAP recovery after 1 hour of aglycemia compared with control (72.6% ± 14.2%, n = 10, vs. 48.8% ± 11.0%, P < 0.01; Fig. 8B). Nifedipine also reduced the sustained decrease in [Ca2+]o to 0.86 ± 0.24 mmol/L (P < 0.05) and the integral of [Ca2+]o decrease to 7.97 ± 2.66 mmol/L · min, (P < 0.05, n = 6).
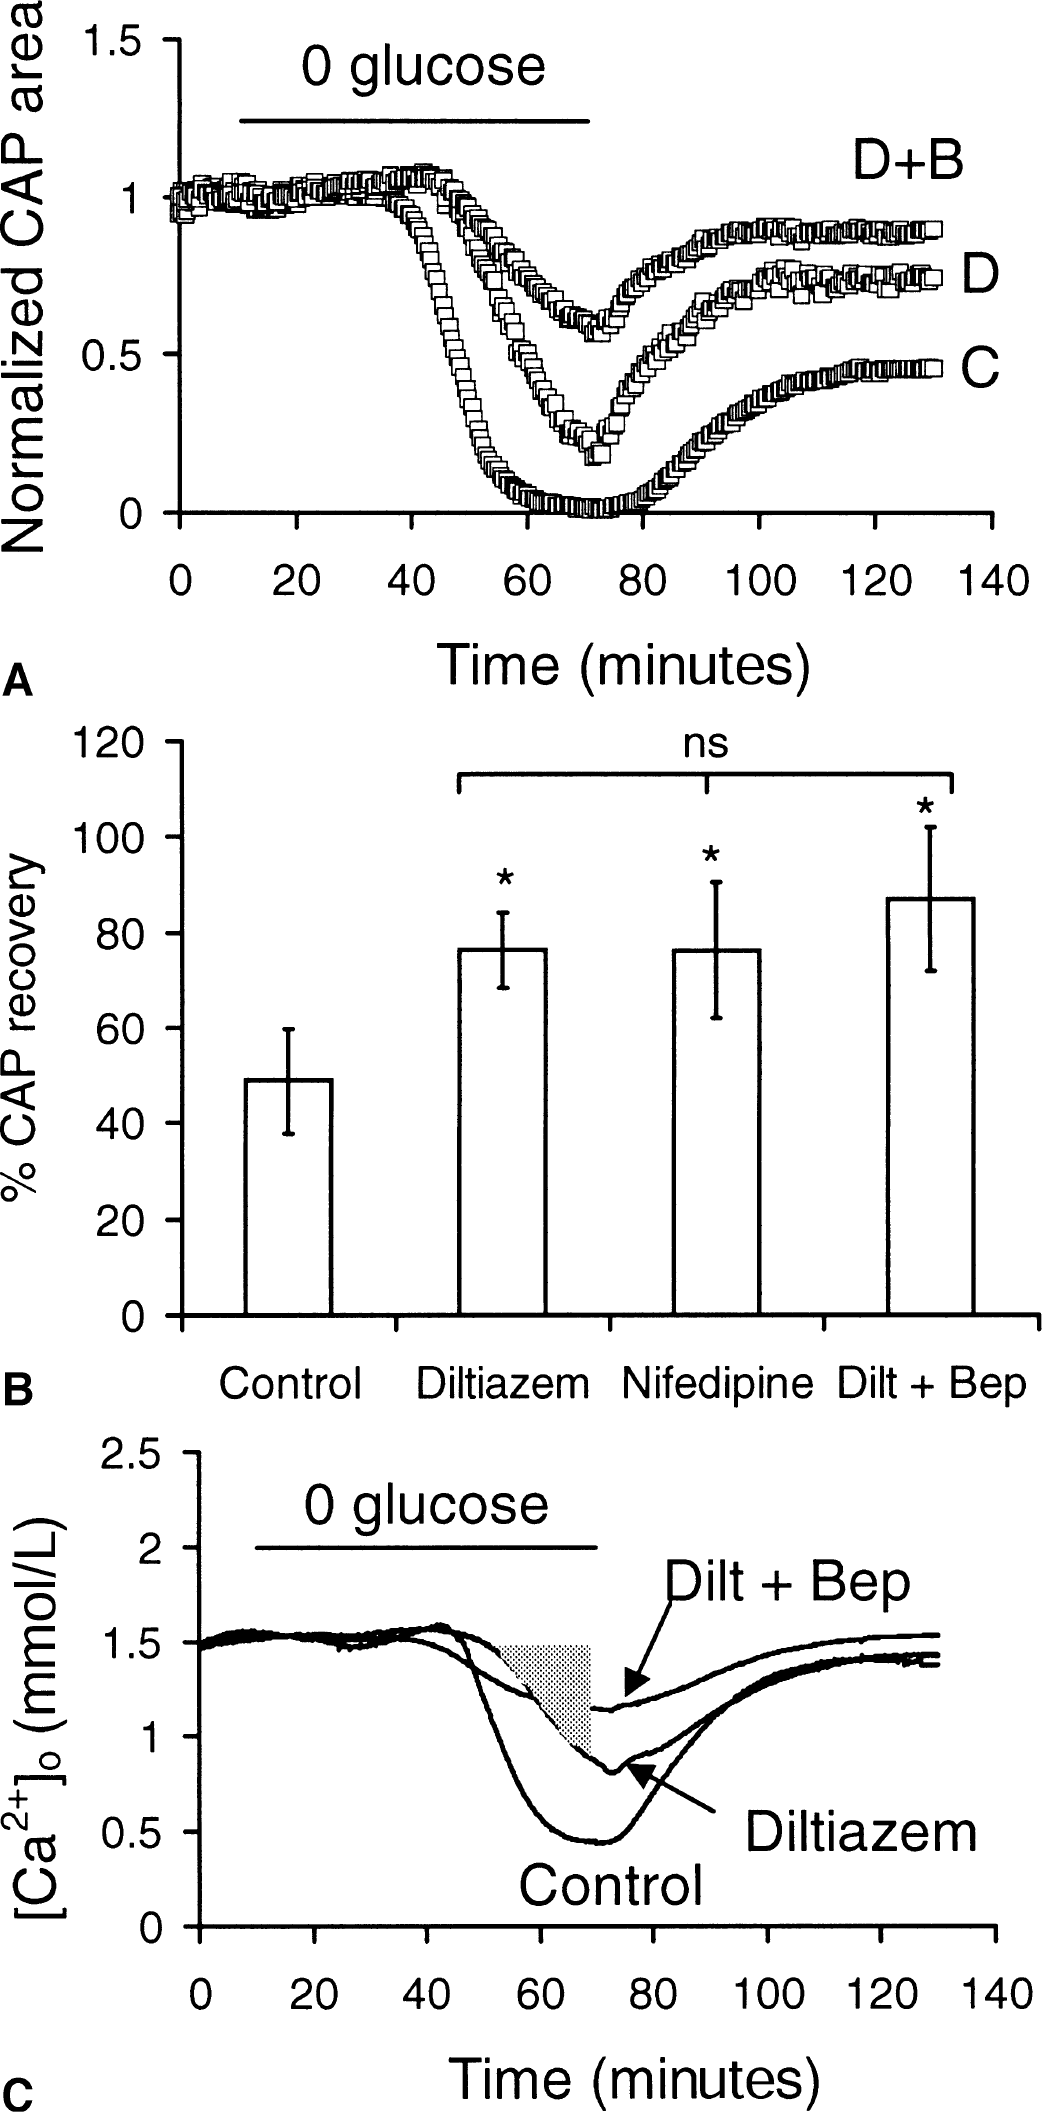
Effect of Ca2+ channel blockers on aglycemia induced changes in [Ca2+]o and compound action potential (CAP) recovery.
As neither diltiazem nor bepridil fully protected the RON from aglycemic injury, the authors applied both diltiazem and bepridil together. Perfusion with aCSF containing 50 μmol/L bepridil and 50 μmol/L diltiazem provided slightly greater protection than seen with either drug alone (n = 5, P > 0.05, Fig. 8A and 8B). In combination, diltiazem and bepridil reduced the sustained decrease in [Ca2+]o to 1.13 ± 0.16 mmol/L (n = 5) from a baseline of 1.52 ± 0.05 mmol/L, a slightly larger, although not statistically significant, attenuation of the decrease in [Ca +]o seen with either drug alone (Fig. 8C). Likewise, the integral of Ca2+ decrease with both drugs was not significantly greater than for either drug alone.
The relation between the integrals of [Ca2+]o decrease and CAP recovery in the presence of blockers of Ca2+ influx during aglycemia was roughly linear and highly significant (regression coefficient = 0.963; Fig. 9). These data reinforced the authors' hypothesis that it was net influx of Ca + into an intracellular compartment(s) that predicted the extent of RON injury as judged by the CAP.
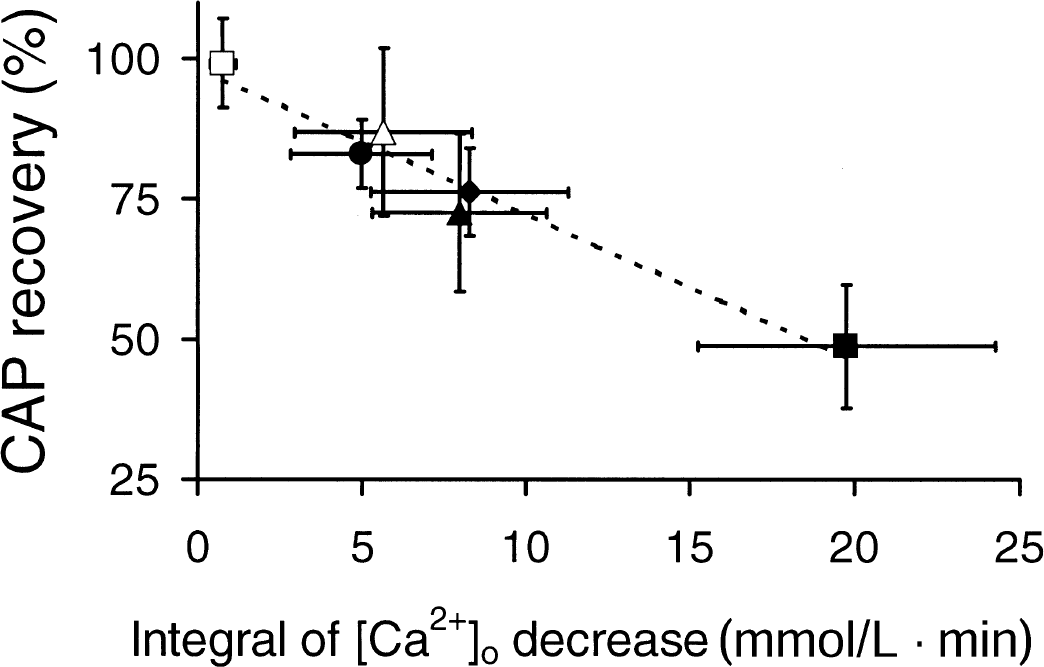
Integral of [Ca2+]o decrease predicts aglycemic injury in the presence of Na+ and Ca2+ influx inhibitors. The integral of [Ca2+]o decrease below baseline is highly correlated with compound action potential (CAP) recovery. Data from experiments in which Ca2+ influx during aglycemia was manipulated pharmacologically: (▪) = control, (♦) = diltiazem, (▴) = nifedipine, (•) = bepridil, (Δ) = diltiazem + bepridil, and (□) = 0 Na+ artificial cerebrospinal fluid (aCSF). The line is the same as shown in Fig. 5E.
Glutamate receptors
Recent reports of neuroprotective effects of glutamate receptor antagonists in WM (Agrawal and Fehlings, 1997; Li et al., 1999) prompted the authors to investigate if glutamate receptors were involved in aglycemic injury. Kynurenic acid, a broad spectrum glutamate receptor antagonist that blocks NMDA receptors, and CNQX, an AMPA/kainate receptor antagonist, were used. These agents were applied 20 minutes before and during aglycemia. In neither case was there any significant effect on the integral of [Ca2+]o decrease (21.53 ± 5.11 mmol/L · min vs. 19.76 ± 4.50 mmol/L · min for kynurenic acid, n = 6, P > 0.05; 18.26 ± 4.22 mmol/L · min vs. 19.76 ± 4.50 mmol/L · min for CNQX, n = 5, P > 0.05), or CAP recovery (44.8% ± 9.4% vs. 48.8% ± 11.0% for kynurenic acid, n = 6, P > 0.05; 47.4% ± 5.3% vs. 48.8% ± 11.0% for CNQX, n = 5, P > 0.05; data not shown).
DISCUSSION
The isolated rat optic nerve, a representative CNS WM tract, was used to analyze the pathophysiology of aglycemia-induced axon injury. The current results indicated that aglycemia-mediated CNS axon injury is Ca2+-dependent and that Ca + entered intracellular compartments) through reverse Na+-Ca + exchange and voltage-gated Ca2+ channels. Moreover, Ca2+ influx occurred at about the same time as failure of axon function. The magnitude of Ca2+ influx during aglycemia was highly correlated with the magnitude of irreversible axon injury.
[Ca2+]o and aglycemia
Using ion-sensitive microelectrodes, [Ca2+]o was monitored during exposure of WM to aglycemia. Before discussing these results, it is important to consider from a theoretical standpoint how changes in [Ca2+]o could occur in the setting of the authors' experiments. The ECS within the optic nerve is in slow equilibrium with the bath solution; if bath [Ca2+] is changed, for example, it takes 30 to 40 minutes for [Ca2+]o to reach a new steady state (Brown et al., 1998). The more rapid equilibration seen when Ca2+ is removed in the presence of EGTA was unique and is assumed to be a consequence of Ca2+ chelation. For short periods of time (that is, ∼5 minutes), however, the ECS of the nerve is effectively isolated from the bath solution. Therefore, if [Ca2+]o decreases, either extracellular volume has increased by water movement from cells into this compartment, lowering [Ca2+]o by dilution, or Ca2+ ions have left the ECS by entering an intracellular compartment.
The authors' experiments with TMA+ indicated that the extracellular space shrinks (at least transiently) during aglycemia by an average of 25% (Fig. 4). For this reason, the increase in [Ca2+]o that occurred at the same time as this ECS shrinkage is not necessarily indicative of a net increase in extracellular Ca2+. In fact, the authors' calculations showed that when the decrease in ECS volume is taken into account, [Ca2+]o does not increase but decreases progressively beginning approximately 30 minutes into the period of aglycemia. It should be emphasized, however, that the TMA+ method as used here only allows inferences about transient changes in ECS volume (see Materials and Methods; Ransom et al., 1992); the behavior of ECS volume after its initial shrinkage remains uncertain. For example, it is not known if the ESC remained “smaller” throughout the period of aglycemia. Other transient changes in ECS volume after the initial decrease were not observed, which at least suggests that no major rapid changes occurred in the size of this compartment.
Aglycemia induced a large decrease in [Ca2+]o whose time course was nearly identical with the time course of loss of WM function as measured by area under the CAP (Fig. 4C). This suggested that movement of Ca2+ from the ECS to an intracellular compartment(s) was intimately involved in the sequence of events leading to WM dysfunction. This position was further supported by the observation that the tight temporal correspondence between CAP decline and the decease in [Ca2+]o during aglycemia was maintained when the bath content of Ca2+ was varied during the period of insult (Fig. 5).
The importance of Ca2+ in aglycemia-induced WM dysfunction also was confirmed by the outcome of experiments in which bath Ca2+ was varied during the period of aglycemia. In the absence of bath Ca2+, the standard 1-hour period of aglycemia failed to produce significant irreversible injury. In a series of experiments in which bath [Ca2+] was systematically varied between 0 and 2 mmol/L during the period of aglycemia, there was a progressive increase in the magnitude of irreversible injury associated with the greater levels of bath Ca2+. These results, in addition to the decline in [Ca2+]o seen during aglycemia, strongly suggested that the greater concentrations of bath Ca2+ were associated with worse outcome because they increased the transmembrane Ca2+ gradient, and therefore the driving force, for Ca2+ entry during aglycemia. A similar phenomenon has been described for RON injury because of anoxia: varying the [Ca2+] of aCSF from 4 to 0 mmol/L progressively decreased the magnitude of injury (Stys et al., 1990b). In an effort to estimate the amount of Ca2+ influx, the integral of [Ca2+]o decrease during aglycemia was calculated. This measurement correlated directly with the degree of injury measured by CAP recovery (Fig. 5E).
Routes of Ca2+ influx during aglycemia
Although these data indicated that Ca2+ entered an intracellular compartment(s) to produce aglycemic injury in WM, there is no direct evidence about the nature of this compartment (that is, axonal vs. glial). It is reasonable to predict, however, that Ca2+ entered axons, as it is axon function that is irreversibly lost. Ca2+ entry into axons has been estimated for another type of insult, anoxia, by electron microscopy and electron microprobe analysis (LoPachin and Stys, 1995; Stys and Lopachin, 1996; Waxman et al., 1993). The latter studies show that elemental Ca2+ accumulates in both axoplasm and mitochondria during and after anoxia and stretch injury (LoPachin and Stys, 1995; Maxwell et al., 1995; Stys and Lopachin, 1996). If, as predicted above, aglycemia induced axon injury through Ca2+ entry, the mechanism of Ca2+ entry must be considered. In the case of anoxia, toxic amounts of Ca2+ appear to enter axons through reverse Na+-Ca2+ exchange or voltage-gated Ca2+ channels, or both (Stys et al., 1992; Fern et al., 1995). The current results indicated that the Na+-Ca2+ exchanger and voltage-gated Ca2+ channels also played a role in toxic Ca2+ influx during aglycemia. Inhibition of the Ca2+ ATPase would prevent extrusion of increasing intracellular Ca2+ (Blaustein and Lederer, 1999).
Aglycemia-induced CAP failure and toxic Ca2+ influx after ∼30 minutes. The prolonged function of the RON in the absence of glucose was probably mediated by the breakdown of astrocytic glycogen to lactate, which could be exported to axons for use as fuel (Wender et al., 2000). When glycogen is finally exhausted, it is presumed that the lack of available energy results in axon depolarization for two reasons. First, grease gap recordings of membrane potential from adult RONs have shown that during aglycemia resting membrane potential is maintained for 30 minutes before rapid depolarization occurs (Leppanen and Stys, 1997). Second, [K+]o increased from baseline levels of 3 to 7 mmol/L after approximately 30 minutes of aglycemia (Fig. 2A). Axon depolarization, in turn, would put into motion Ca2+ loading. Membrane depolarization would activate Na+ channels causing intracellular Na+ accumulation. Noninactivating channels are known to exist in optic nerve axons and would play the greatest role in Na+ loading (Stys et al., 1993). Both membrane depolarization and intracellular Na+ accumulation lead to reversal of the Na+-Ca2+ exchanger causing Ca2+ to be transported into the axons. The presence of the Na+-Ca2+ exchanger at nodal regions (Steffensen et al., 1997) implies that the toxic Ca2+ influx is occurring at the nodes.
The neuroprotective effects of diltiazem and nifedipine imply a role for L-type Ca2+ channels in aglycemic injury. These agents also seem to protect WM from anoxic injury (Imaizumi et al., 1999; Fern et al., 1995) although one study failed to see benefit (Stys et al., 1990a; see also Stys, 1998). Although the presence of Ca2+ channels on central axons has been controversial (Fern et al., 1995; Foster et al., 1982; Stys, 1998), recent data indicate that L-type Ca2+ channels are present on both axons and astrocytes in the RON (Brown et al., 2001). During aglycemia, axons would depolarize and activate Ca2+ influx through their Ca2+ channels. What remains unclear is if Ca2+ channels and reverse Na+-Ca2+ exchange interact during Ca2+ loading. These mechanisms could represent parallel paths of Ca2+ entry or one path might facilitate the other. For example, reverse Na+-Ca2+ exchange may require an initial increase in [Ca2+] to be activated (Blaustein and Lederer, 1999), and this could be Ca2+ channel mediated.
Footnotes
Acknowledgment:
The authors thank Sam Agulian for the gift of the Corning resin 477317.