
Abstract
Axon function in the CNS has been reported to fail rapidly during anoxia, implying that there is no anaerobic capacity. This phenomenon was reassessed in rodent white matter using mouse or rat optic nerve. Axon function was semiquantitatively measured as area under the compound action potential. Mouse optic nerves exposed to anoxia (30–180 minutes) or cyanide (30–60 minutes) at 37°C exhibited significant persistent function that was abolished by removing glucose. Reduction in compound action potential area increased with anoxia duration reaching a maximum of about 70% after 90 min. Rat optic nerves exposed to anoxia, in contrast to mouse optic nerves, showed rapid and complete loss of function. When artificial CSF glucose was increased from 10 to 30 mmol/L, rat optic nerves responded to anoxia in a similar manner to mouse optic nerves in 10-mmol/L glucose. The authors conclude that white matter is resistant to anoxia with a subset of axons able to subsist exclusively on anaerobically derived energy. Because the rat optic nerve is about twice the diameter of the mouse optic nerve, glucose diffusion into the rat optic nerve was inadequate during anoxia when artificial CSF glucose was 10 mmol/L but became adequate when artificial CSF glucose was 30 mmol/L. These observations have implications for white matter energy metabolism and susceptibility to injury during focal ischemia.
Central nervous system tissue has one of the highest metabolic rates in the body and, for this reason, is exquisitely sensitive to disturbances in oxygen and glucose supply (Erenciska and Silver, 1989; Hansen, 1985; Siesjo, 1978). In humans, consciousness is lost in about 8 seconds when cerebral blood flow is interrupted (Rossen et al., 1943). Although it has proved surprisingly difficult to test the effects of anoxia, independent of aglycemia, on neuronal function, available evidence indicates that neurons are very sensitive (Goldberg et al., 1987). The rapid loss of brain function caused by anoxia suggests that mammalian CNS tissue cannot survive on glycolysis alone, which produces only two molecules of ATP per molecule of glucose metabolized (Stryer, 1995). It is probably the neural elements that confer this high degree of anoxic-sensitivity because astrocytes are highly resistant to anoxia (Goldberg and Choi 1993; Rose et al., 1998). Available evidence suggests that gray and white matter both suffer immediate loss of function with anoxia (Stys et al., 1992a). In other words, both neuron cell bodies and axons, which are independent of their cell bodies from the standpoint of energy metabolism, seem to need a constant supply of oxygen to maintain moment-to-moment function.
We have reevaluated the capacity of CNS axons to function in the absence of oxygen. Our prior work using the isolated rat optic nerve (RON) indicated that axon function was lost within a few minutes during anoxia (Stys et al., 1990). We recently began using the mouse optic nerve (MON) to study white matter injury to verify our previous results in another species, and to prepare for future genetic studies which favor mouse models. We were surprised to discover a major difference in the response of the MON to anoxia; namely, anoxia did not entirely block function, measured electrophysiologically as the compound action potential (CAP). We have confirmed in this study that some CNS myelinated axons can function for long periods under completely anaerobic conditions. We also discovered that the RON gave similar responses to the MON during anoxia if we increased the bath glucose concentration threefold. This raised the important technical point that in vitro brain tissue, which relies on glucose diffusion from the bath for energy metabolism, may require variable bath glucose concentration depending on diffusion distance (i.e., tissue diameter or thickness). These data, therefore, challenge the assumption that all mammalian CNS tissue is sensitive to anoxia. A preliminary account of this work has been published elsewhere (Baltan Tekkök et al., 2002).
MATERIALS AND METHODS
Optic nerve preparation
Swiss Webster mice and Long Evans rats (age 4–6 and 6–8 weeks, respectively) were deeply anesthetized with halothane and then decapitated. Optic nerves were dissected free and cut at the optic chiasm and behind the orbit. The optic nerves were gently freed from their dural sheaths and placed in an interface perfusion chamber (Medical Systems Corp, Greenvale, NY, U.S.A.). Optic nerve length and width (at mid length) were respectively: rat −1.03 ± 0.05 cm (n = 8) and 650 ± 60.2 μm (n = 23); mouse −0.56 ± 0.05 cm (n = 13), 281 ± 29.9 μm (n = 19). Nerves were maintained at 37°C and superfused with artificial cerebrospinal fluid (aCSF) containing (in mmol/L): NaCl 126, KCl 3.0, CaCl2 2.0, MgCl2 2.0, NaH2PO4 1.2, NaHCO3 23, and glucose 10. The osmolarity (∼310 mOsm) was monitored with an osmometer (Wescor vapor pressure osmometer, Logan, UT, U.S.A.). The chamber was continuously aerated by a humidified gas mixture of 95% O2 /5% CO2; this was the sole source of oxygen for the nerves.
In some experiments, aCSF was modified to contain 30-mmol/L glucose, with or without adjustment of osmolarity to the control level of 310. When 30-mmol/L glucose aCSF was osmotically adjusted to 310, NaCl was lowered to 115 mmol/L. Likewise, when ACSF contained 10 mmol/L glucose and 115 mmol/L NaCl, the osmolarity was adjusted by addition of 20-mmol/L sucrose.
To induce anoxia, the gas passing over the tissue was switched to 95% N2/5% CO2. To ensure that no oxygen was inadvertently delivered by the superfusate, aCSF was continuously bubbled with 95% N2/5% CO2, as in previous experiments (Ransom and Philbin, 1992). In addition, all tubing involved in delivery of gas to the bath was impermeable Tygon tubing and P
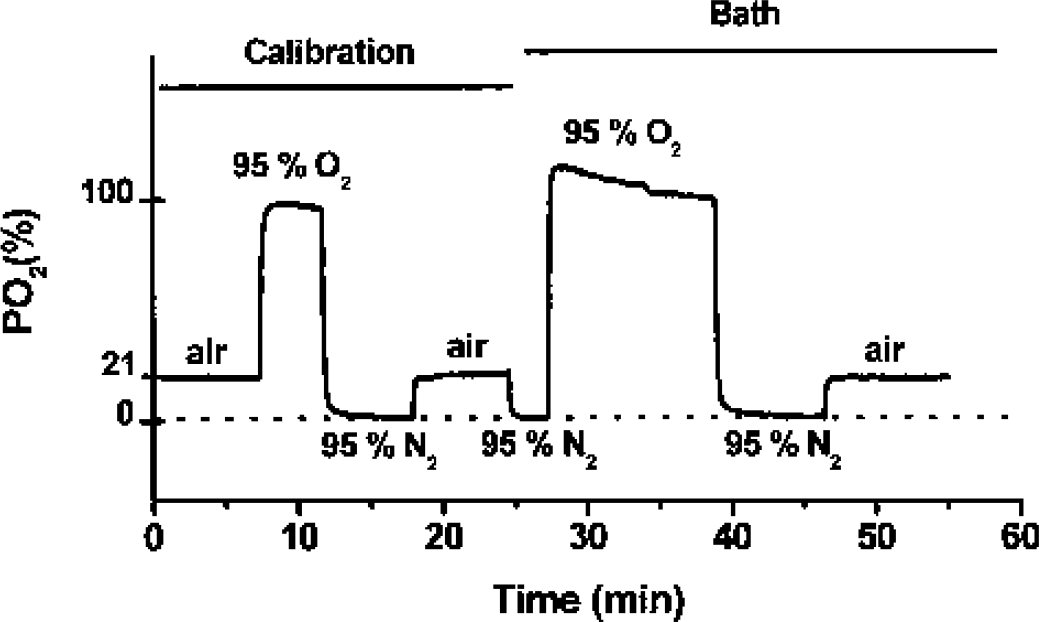
Measurement of oxygen tension in tissue chamber using a P
Suction electrodes back-filled with aCSF were used for stimulation and recording. One electrode was attached to the rostral end of the nerve for stimulation. Stimulus pulse (30-microsecond duration) strength (Isostim 520; WPI, Sarasota, FL, U.S.A.) was adjusted to evoke the maximum CAP possible and then increased another 25% (i.e., supramaximal stimulation). During an experiment, the supramaximal CAP was elicited every 30 seconds. The second suction electrode was attached to the proximal end of the nerve to record the CAP. The recording electrode was connected to an Axoclamp 2A amplifier, and the signal was amplified 500 times, filtered at 30 kHz, and acquired at 20 kHz. After dissection, optic nerves were allowed to equilibrate in standard aCSF for about 15 minutes before beginning an experiment. Sodium cyanide (Sigma, St Louis, MO, U.S.A.) was dissolved in distilled water as a 20-mmol/L stock solution then was diluted in aCSF before experiments.
PO 2 measurements
Tissue chamber P
Data analysis
Optic nerve axon function was monitored quantitatively as the area under the supramaximal CAP. The area under the CAP represents the best measure of the number of active axons because currents generated by individual axons within a fiber tract are considered to sum linearly (Cummins et al., 1979; Stys et al., 1991). CAP data from optic nerves in the same group were pooled and normalized to the baseline control value. Data were acquired online (Axon Instruments, Digidata 1200A) using proprietary software (Axon Instruments, Axotape) and presented as mean and standard deviation. In time course graphs, standard deviations are not shown for every CAP for the sake of clarity; these values are given at 3-minute intervals. Significance was determined by Student's t-test (Sigma Stat, Chicago, IL, U.S.A.).
RESULTS
Under control conditions, axon function (measured as the area under the CAP) remained stable for more than 10 hours in both RON and MON at 37°C (data not shown). The CAPs of MON and RON were qualitatively similar (Brown et al., 2003; Stys et al., 1991). Each had three discreet peaks although the duration of the CAP was less in the mouse than in the rat (2.5–3 milliseconds versus 4–5 milliseconds, respectively) (Fig. 2, insets); presumably a consequence of less temporal dispersion in the shorter MON.
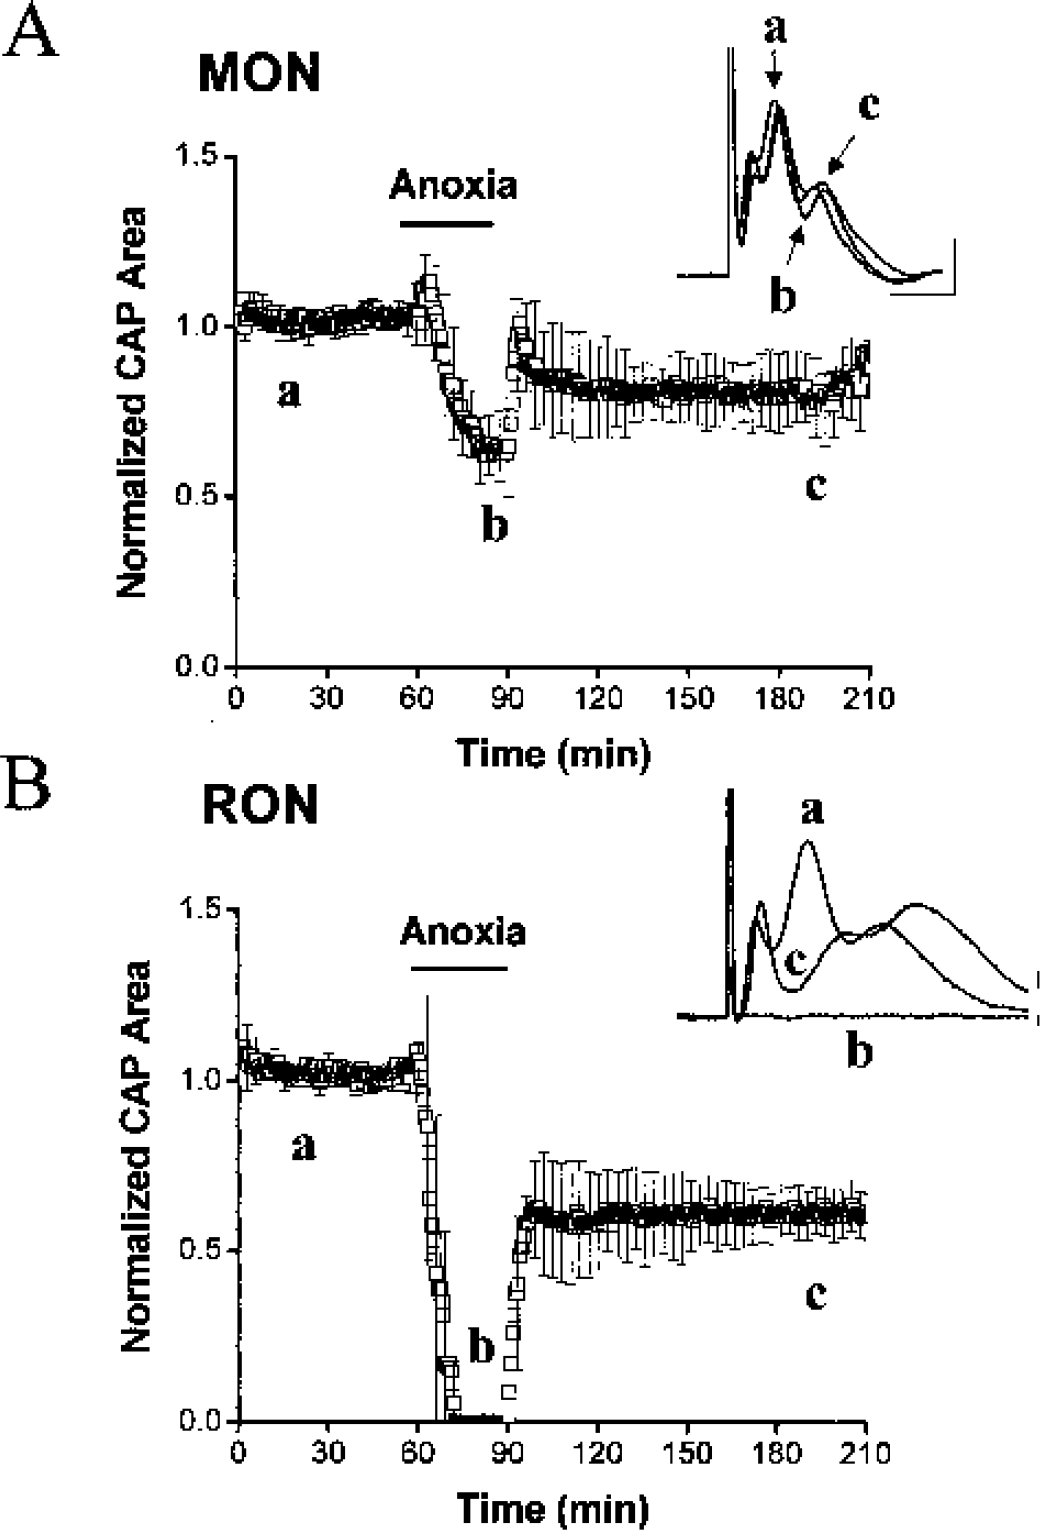
The mouse optic nerve (MON) but not the rat optic nerve (RON) exhibited persistent electrical activity during anoxia. (
The effects of different periods of anoxia on MON function and degree of recovery were determined. After 1 hour of baseline incubation, anoxia was induced (see Materials and Methods). Anoxia caused a transient initial increase in CAP area (15.8 ± 7.2% in CAP area after 4.2 ± 2.3 minutes; n = 26), primarily due to an increase in the second peak amplitude (not illustrated). Following this initial increase, CAP area gradually fell to 61.5 ± 7.5% (n = 6) of control CAP area after 30 minutes of anoxia (Fig. 2A). This result was in marked contrast to the outcome of 30 minutes of anoxia in the RON under identical conditions; CAP area rapidly decreased after 3.8 ± 1.2 minutes, without an initial increase in CAP area, and was abolished in 8.2 ± 2.6 minutes (n = 6; Fig. 2B) (Brown et al., 2001; Fern et al., 1995; Stys et al., 1990). To verify our findings in Long-Evans rats, optic nerves from Louise (n = 5) or Sprague-Dawley (n = 8) rats were also exposed to 30 minutes of anoxia. The response to anoxia was the same in all three rat strains (data not shown).
Mouse optic nerve function appeared to be substantially resistant to 30 minutes of anoxia while, as noted in prior studies, RON function was quickly lost. To further assess this apparent species difference, MONs were exposed to anoxia of increasing durations while monitoring CAP area (Fig. 3A). Anoxia of 60, 90, 120, 150 or 180-minute duration depressed CAP area by 51.1 ± 20.4% (n = 5), 71.1 ± 8.3% (n = 6), 68.2 ± 13.3% (n = 3), 70.3 ± 7.1% (n = 3), or 74.3 ± 9.9% (n = 2). Anoxia-induced CAP depression increased with anoxia duration but reached an asymptotic maximum of about 70% for anoxic periods of 90 minutes or longer (Fig. 3B). In no instance did these durations of anoxia cause complete loss of the CAP. On switching to oxygenated aCSF after anoxia, CAP area in MON recovered to 83.7 ± 15.8%, 66.3 ± 20.0%, 47.4 ± 9.1%, 42.2 ± 16.7%, 42.2 ± 10.6%, or 39.0 ± 11.4% after 30, 60, 90, 120, 150 or 180 minutes of anoxia, respectively (Fig. 3A and Fig. 3C). Anoxia-induced CAP injury, judged in this fashion, increased with anoxia duration but reached an asymptotic maximum of recovery of about 40% of control CAP for anoxic periods 120 minutes or longer. In the RON, by comparison, anoxia-induced injury appeared linearly related to anoxia duration and reached ∼100% for anoxia durations exceeding 90 minutes (Fern et al., 1998).
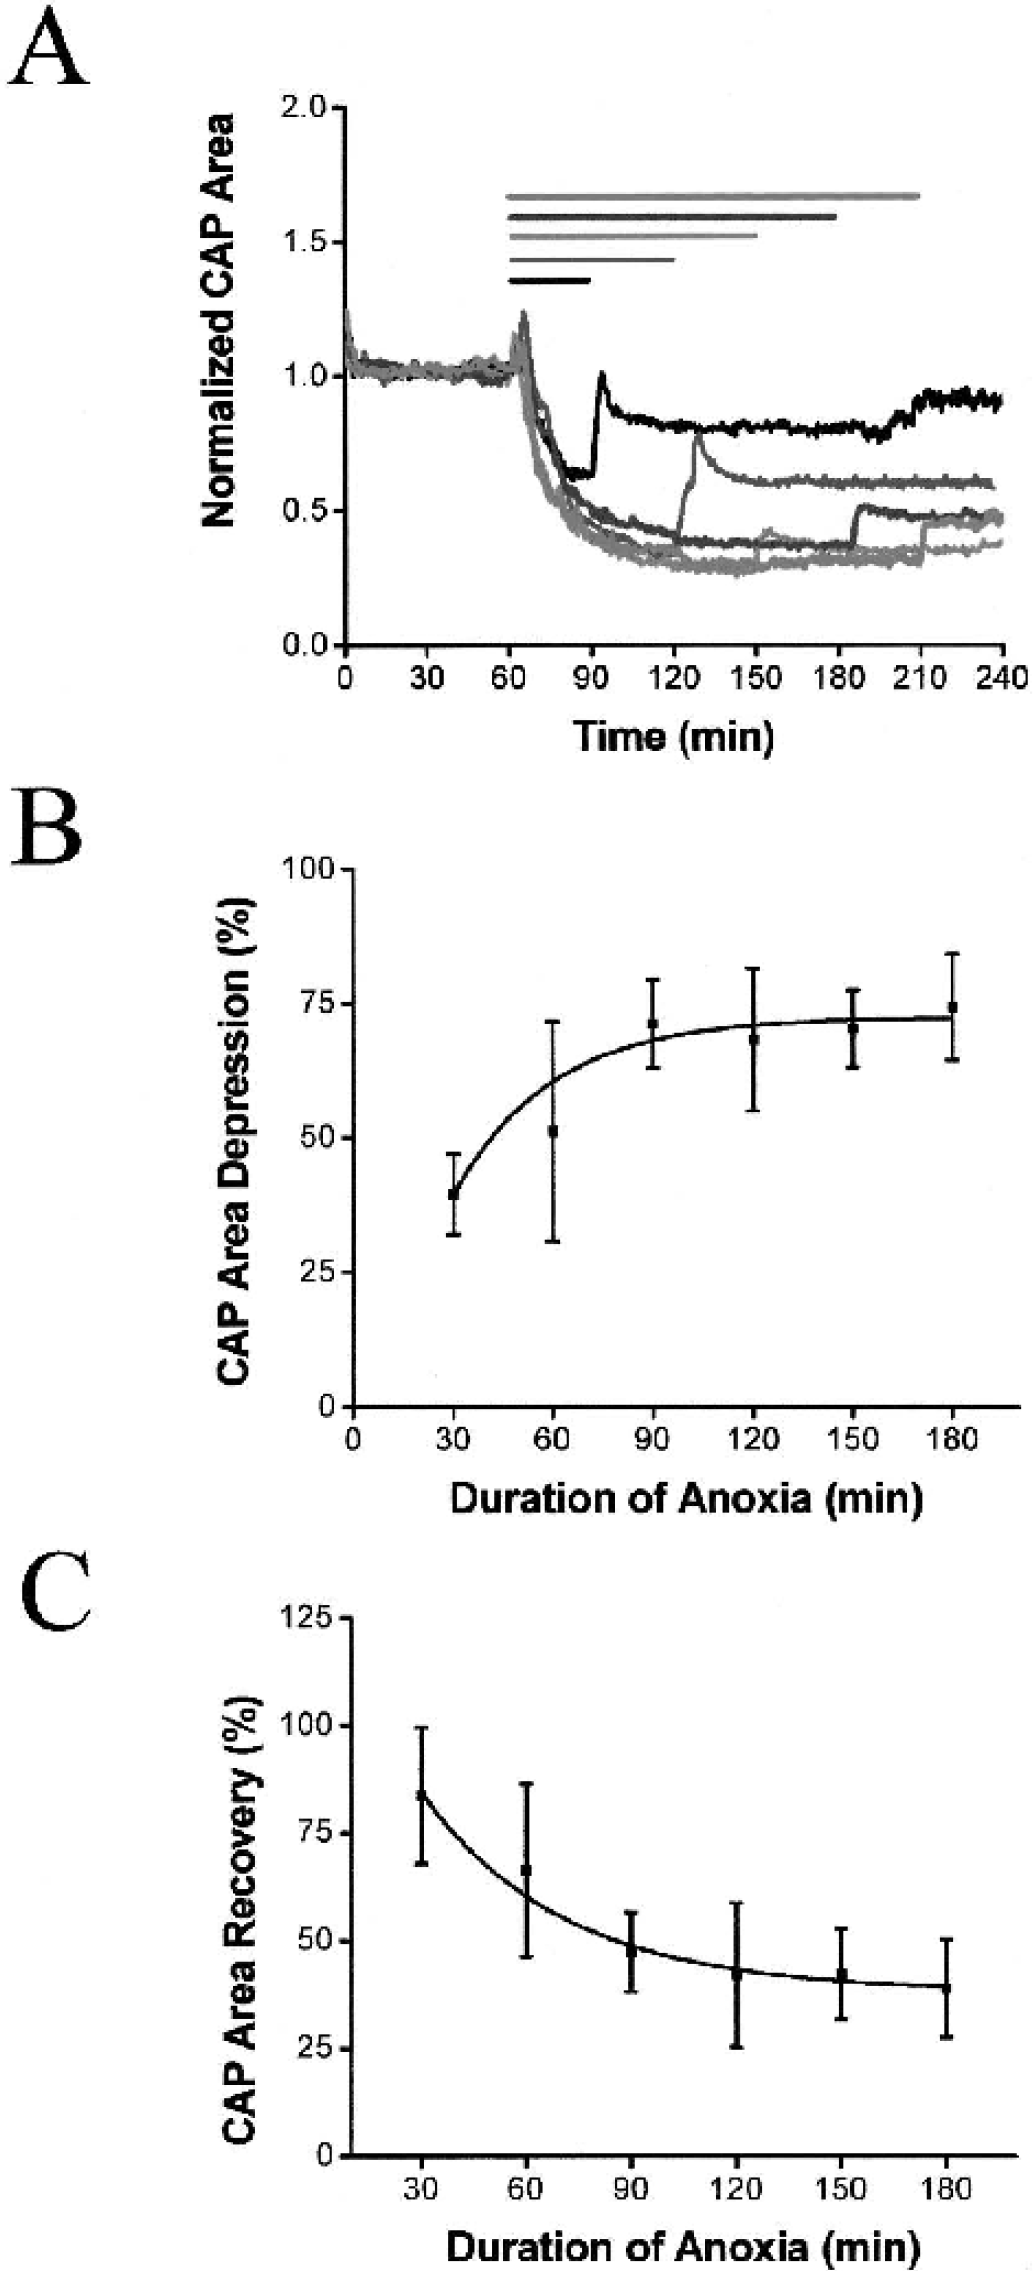
Loss of function and degree of recovery were dependent on the duration of anoxia in the MON. (
Control experiments confirmed that chamber P
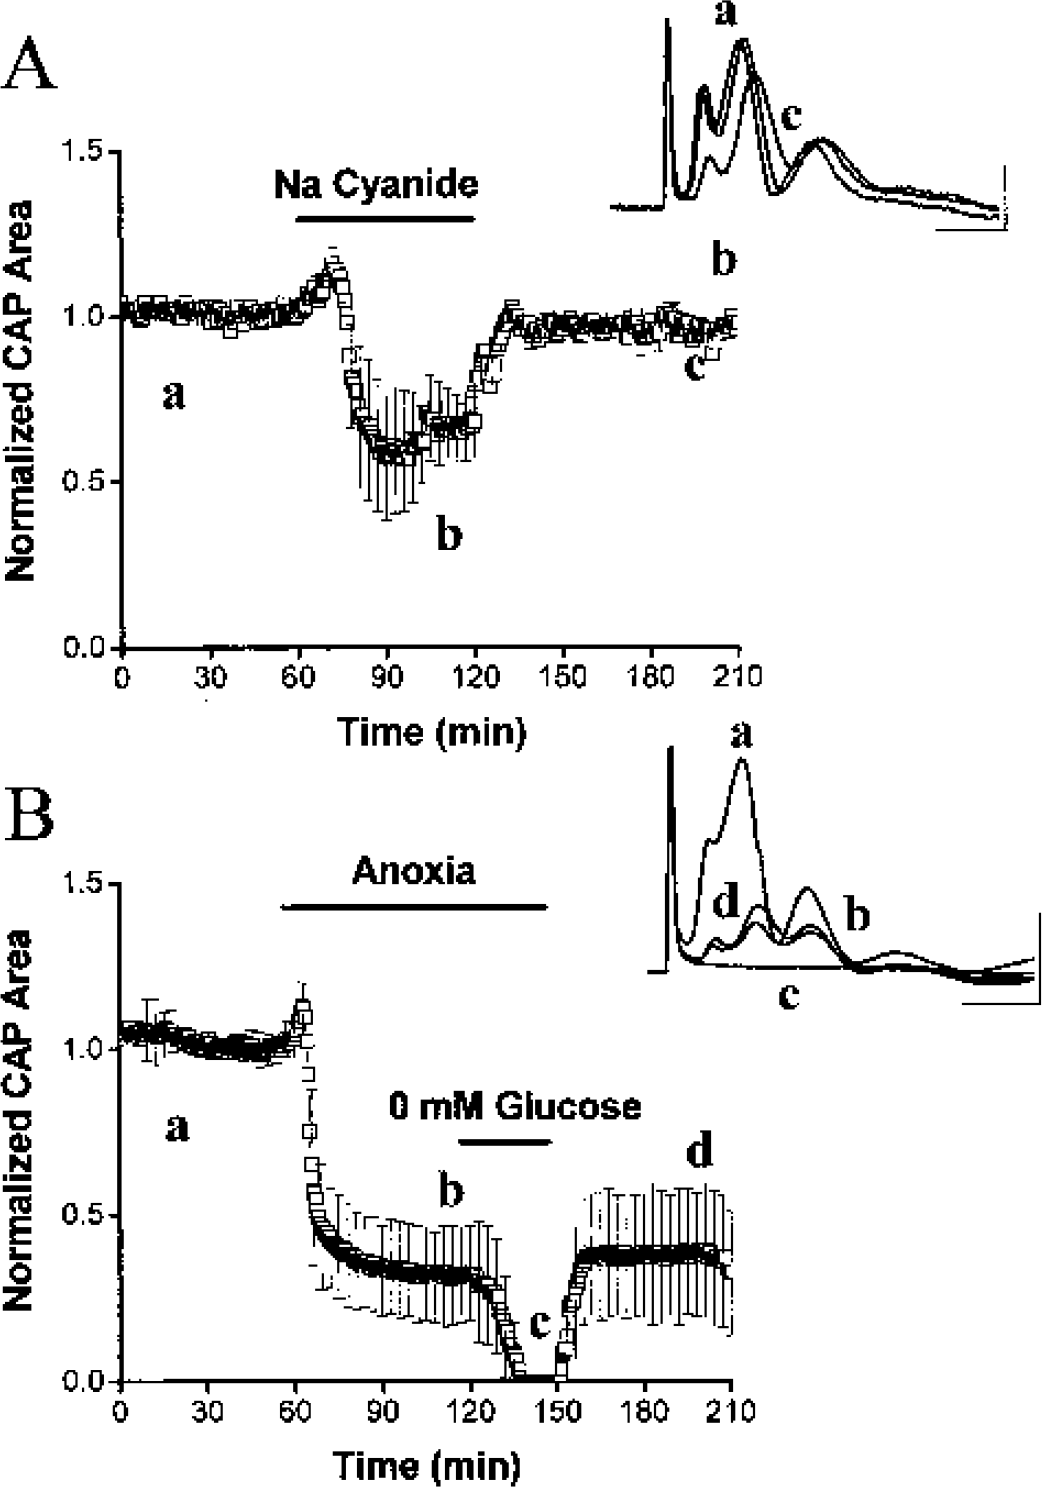
Combined inhibition of glycolysis and oxidative phosphorylation completely inhibited mouse optic nerve function. (
Experiments were performed to verify that anaerobic metabolism was sustaining MON function during anoxia. In the presence of anoxia, MON was briefly bathed in glucose-free medium (10-mmol/L sucrose added to keep osmolarity constant, Fig. 4B). In this group of nerves, CAP area decreased to 32.2 ± 14.3% (n = 6) of baseline during anoxia and then to zero in glucose-free aCSF after 14.8 ± 5.3 minutes, indicating that the sustainable component of the CAP during anoxia is a result of glycolytic metabolism. Restoration of oxygen and glucose led to prompt CAP recovery to 37.8 ± 19.0% of control, not significantly different from recovery observed after 90-minute anoxia alone (47.4 ± 9.1%, n = 6, P = 0.290).
These results indicated that MON, but not RON, can maintain substantial electrical activity in the absence of oxidative metabolism. It remained perplexing that white matter from such closely related species as the mouse and rat was markedly different with regard to the effect of anoxia. One possible confounding variable was the fact that the MON and RON preparations were different in size; the RON has a diameter that is 2.3 times as large as the MON (see Materials and Methods). With this in mind, we tested the hypothesis that the apparent inability of RON to remain functional during anoxia was a technical artifact related to inadequate glucose diffusion from the bath into the tissue. We exposed RONs to anoxia in the presence of 30-mmol/L, not 10-mmol/L, glucose (keeping the NaCl concentration at 126 mmol/L), reasoning that glucose delivery to tissue would be significantly enhanced in the presence of the higher bath glucose concentration. Indeed, in the presence of 30-mmol/L glucose, anoxia no longer abolished the CAP in RON (Fig. 5A, n = 5). CAP area decreased to 61.9 ± 13.9% of the control CAP area at the end of anoxia. These experiments, however, failed to control for the increased osmolarity associated with adding 20-mmol/L glucose to the aCSF (∼310–330 mOsm). In fact, this increase in osmolarity, by itself (10-mmol/L glucose and 20-mmol/L sucrose), caused some preservation of CAP area during anoxia (peak decrease: 29.0 ± 15.1% of control CAP, n = 3; P < 0.02 compared to the preservation with high glucose; Fig. 5b).
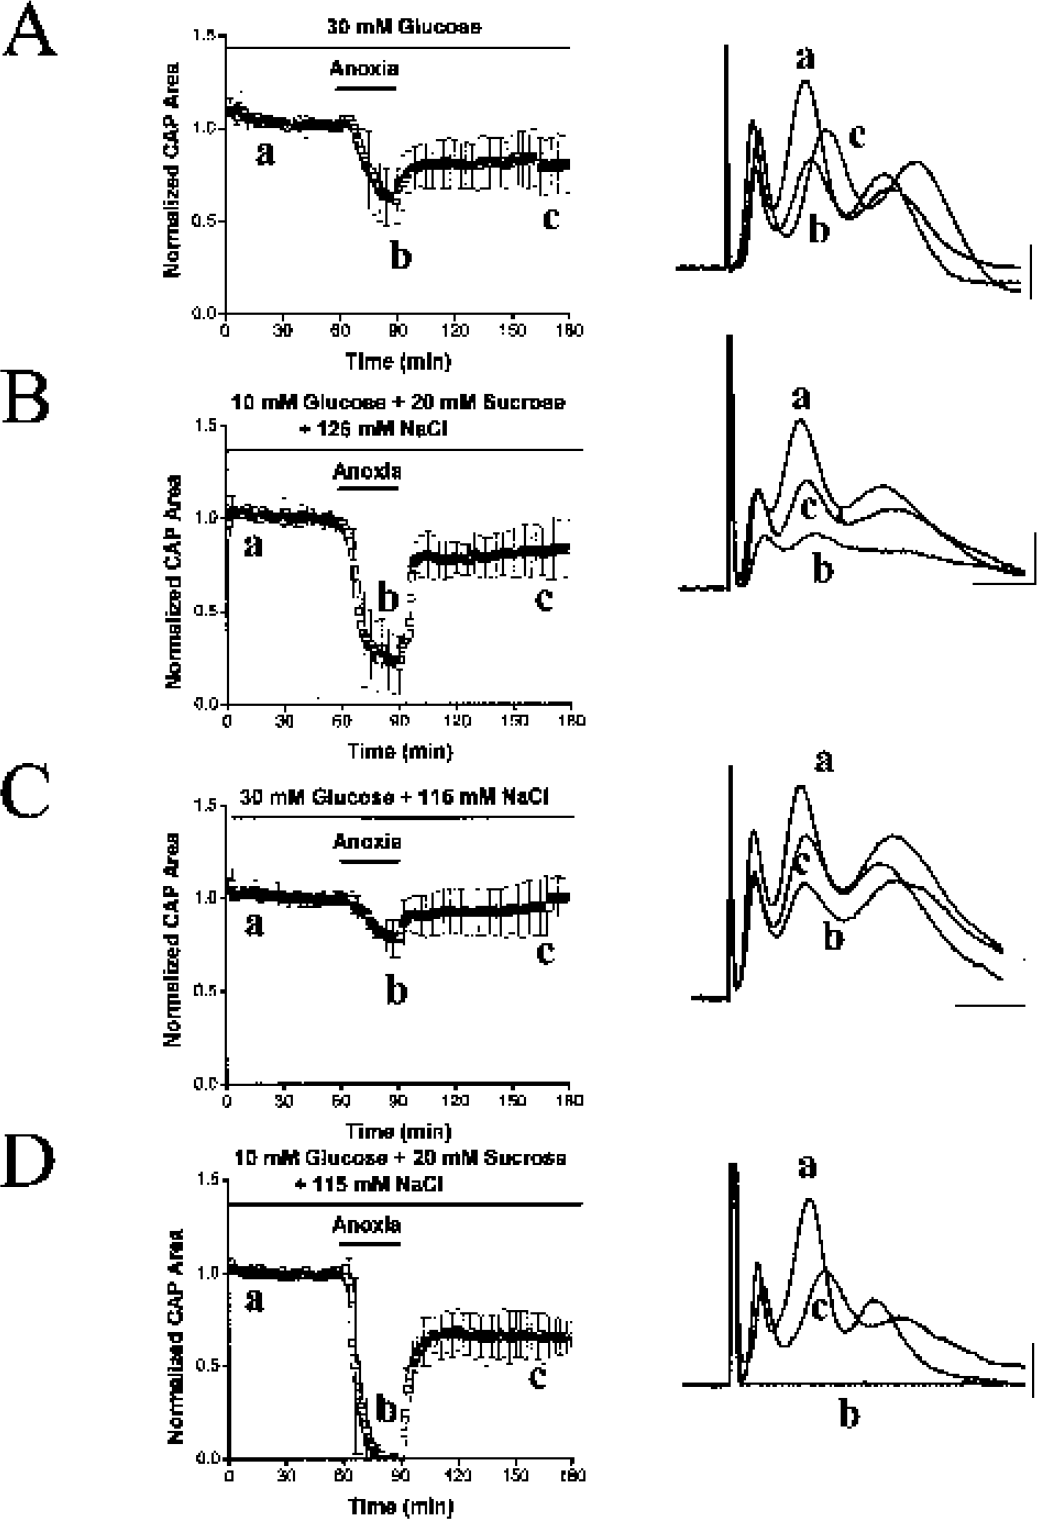
In the rat optic nerve, increasing perfusate glucose concentrations altered the response to anoxia. (
Further experiments isolated the effect of high glucose by adjusting the solutions so that osmolarity remained constant (∼310 mOsm) in the solutions that contained variable glucose concentration. This was done by switching between solutions containing 115-mmol/L NaCl, 20-mmol/L sucrose, and 10-mmol/L glucose or 115-mmol/L NaCl and 30-mmol/L glucose (Fig. 5C and Fig. 5D). The maximum fall during anoxia was to 78.0 ± 11.0% of control in the high-glucose solution (recovery = 96.0 ± 15.4% of control, n = 6; Fig. 5C). In the osmolarity-adjusted control solution, CAP decreased to zero in anoxia in 13.8 ± 3.7 minutes (recovery = 69.0 ± 8.6% control, n = 5; Fig. 5D). In the presence of 30-mmol/L bath glucose, the RON CAP area persisted for up to 180 minutes of anoxia (data not shown).
Given that a higher bath glucose concentration was necessary to reveal resistance to anoxia in the RON, it seemed possible that higher bath glucose concentration might create a greater resistance to anoxia in the MON. MONs were superfused with aCSF containing 30-mmol/L glucose (molarity adjusted) and then exposed to anoxia (Fig. 6). Anoxia in high glucose concentrations caused a delayed and longer initial increase in CAP area compared to anoxia in 10-mmol/L glucose (32.2 ± 12.4% at 10.9 ± 1.8 minutes, n = 7, versus 27.2 ± 9.0% (P = 0.465) and 5.2 ± 1.1 minutes, (P < 0.001), n = 5). The CAP area, however, decreased to about the same level during anoxia regardless of bath glucose concentration (30-mmol/L glucose: 51 ± 14.8% versus 10-mmol/L glucose: 42 ± 19.7%, P = 0.385). CAP recovery was also about the same under both conditions (30-mmol/L glucose: 71 ± 15.8% of control versus 10-mmol/L glucose: 70 ± 24.9%).
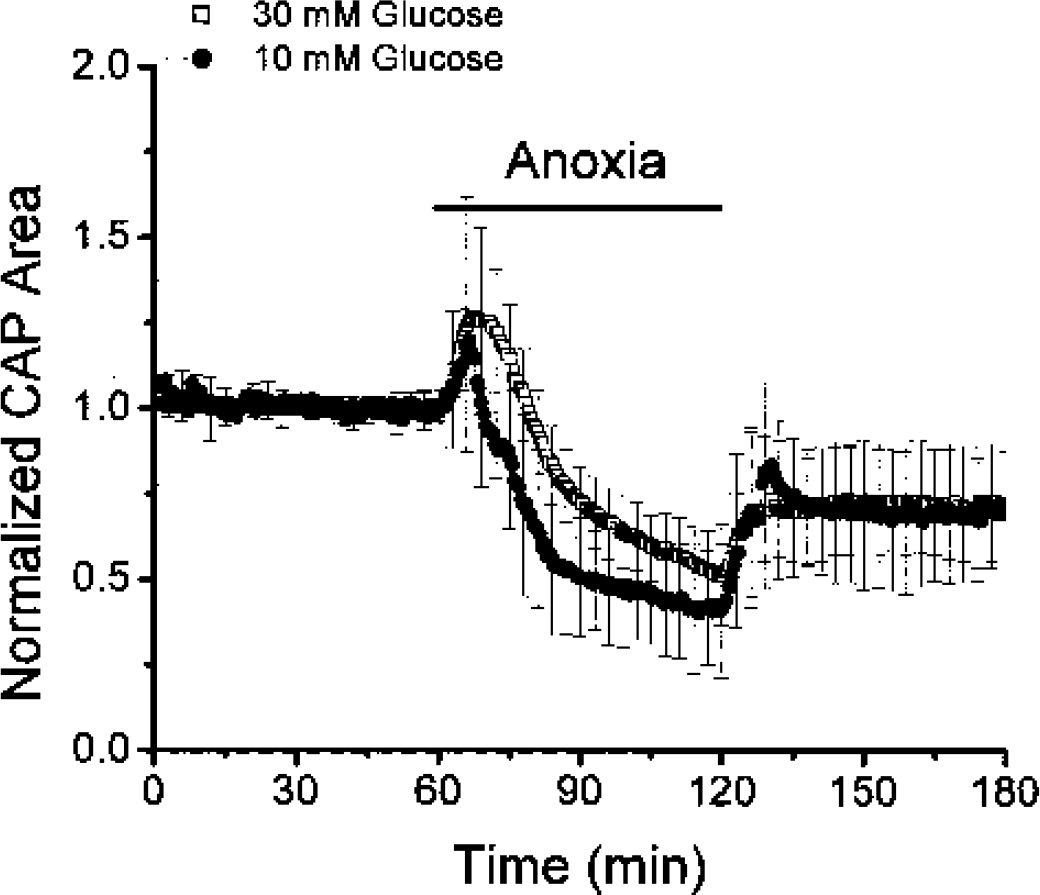
Neither raising glucose from 10 mmol/L (closed circles) to 30 mmol/L (open squares) nor controlling osmolarity prevented anoxia-induced suppression of compound action potential (CAP) area or offered better recovery. Mouse optic nerves were kept in 30-mmol/L glucose starting 30 minutes before anoxia. Anoxia in 30-mmol/L glucose caused a slightly higher (32.2 ± 12.4%, n = 7, versus 27.2 ± 9.0%, n = 5, closed circles, P = 0.465) and slower increase (10.9 ± 1.8 min versus 5.2 ± 1.1 min, P < 0.001). The CAP area decreased to 51.0 ± 14.8% by the end of anoxia and recovered to 71.0 ± 15.8% of control after oxygenation, which was not different than anoxia in 10-mmol/L glucose (42.0 ± 19.7% maximum drop, P = 0.385 and 70.0 ± 24.9% recovery, P = 0.933, n = 5).
DISCUSSION
The primary, and somewhat surprising, conclusion of this study is that CNS white matter is partially resistant to the complete removal of oxygen. Optic nerves from adult mice exposed to anoxia (or cyanide to induce “chemical anoxia”) for as long as 3 hours at 37°C experienced only partial CAP depression, implying persistent function in some axons. Based on the residual CAP area during prolonged anoxia (i.e., 90 minutes or longer), about 30% of axons remained functional. As expected, these axons immediately lost function when glucose was removed, indicating that glycolysis, the anaerobic phase of axon energy metabolism, was providing sufficient ATP to sustain ion gradients necessary for excitability. To our knowledge, this is the first demonstration that mammalian CNS axon function can be maintained under anoxic conditions.
Not all axons remained functional during prolonged anoxia. In fact, about 60% of the CAP was irreversibly lost after switching back to normal oxygen following at least 90 minutes of anoxia (Fig. 3A and Fig. 3B). The loss of axons in the MON was not a consequence of insufficient glucose delivery; the same amount of CAP failure was seen in the presence of 10 or 30-mmol/L bath glucose. Although it cannot be proven from these data, it seems probable that the same axons that failed during anoxia also suffered irreversible damage. This begs the question of which axons in the MON were capable of pure anaerobic survival. All of the axons in the rodent optic nerve are myelinated (Foster et al., 1982), so it is not a matter of whether the fibers have myelin. Although the shape of the mouse CAP during anoxia was somewhat variable, most often the first two components of the triphasic CAP were reduced more than the last component (i.e., Fig. 3, a and b insets). This indicated that the more slowly conducting fibers, perhaps smaller in diameter or with thinner myelin, were best able to survive anoxia. Ultrastructural analysis will be necessary to answer this question.
Although it is probable that white matter tracts elsewhere in the brain will exhibit tolerance to anoxia, extrapolation of our data should be done with caution. Evidence is beginning to accumulate that different white matter areas vary in terms of how they are injured by ischemia or anoxia (Li et al., 1999; Li and Stys, 2000). In addition, myelinated axons appear to fail more rapidly during anoxia than unmyelinated axons (Imaizumi et al., 1998; Waxman et al., 1990), and CNS white matter tracts vary considerably in their percentage of unmyelinated axons, ranging from zero in the optic nerve to about 72% to 44% of total axons in the corpus callosum (Nunez et al., 2000; Sturrock, 1980). This important question warrants direct testing.
Rat optic nerves and anoxia
Rat optic nerves, in contrast to MONs, quickly failed during anoxia (Ransom et al., 1993; Stys et al., 1992b). This result, however, was shown to be an artifact of insufficient delivery of glucose to the anoxic RON axons, and raises an important technical point regarding the study of brain tissue in vitro (Tekkök et al., 2002). In the absence of a functional vasculature, axons of the isolated RON received glucose solely via diffusion from the bath. (Recall that the RON is more than twice the average diameter of the MON, 650 ± 60.2 μm versus 281 ± 29.9 μm.) Under aerobic conditions, the rate of glucose delivery to axons was adequate to sustain the CAP, presumably because aerobic ATP generation is highly efficient. During anoxia, however, oxidative phosphorylation was abolished and glycolysis generated only about 6% as much ATP per glucose molecule. Theoretically, glycolytic flux could increase to keep the rate of ATP production suitable for maintaining ion gradients and excitability; however, this presupposes adequate access to glucose. In the case of the MON, our results imply that glucose delivery was sufficient to produce adequate ATP levels to support excitability. During anoxia in the RON, glucose availability was diffusion limited, as evidenced by the demonstration that RON also showed anoxia-resistance when bath glucose was increased to 30 mmol/L, a manipulation that increased the amount of glucose that could be delivered by diffusion.
There remains one paradox. Why don't the outermost axons of the RON—the ones closest to the glucose source and thus able to make ATP—continue to function during anoxia, even at a bath glucose concentration of 10 mmol/L? Two factors probably conspired to prevent this. The axons of the optic nerve are thought to have a variable trajectory as they course from the orbit to the chiasm, weaving in and out of the nerve. No axons, therefore, would be in continuous close contact with bath glucose over the course of their journey in the nerve. When the axons were deep within the substance of the nerve, they would not have sufficient glucose to maintain excitability. A second reason that RON axons all fail during anoxia in 10-mmol/L glucose could be that they suffer depolarization block due to elevated extracellular [K] ([K+]o). Marked [K+]o elevation is seen during anoxia and, importantly, the magnitude of anoxia-induced elevation of [K+]o declines when bath glucose concentration is increased (Ransom et al., 1992).
The “correct” concentration of bath glucose for in vitro experiments on isolated brain tissue is disputed. The observation that the anoxia-resistance of RON axons was only appreciated when bath glucose concentration was three times (30 mmol/L) what is conventionally considered as normal for in vitro experiments (i.e., 10mmol/L) serves as a caution that optimal bath glucose concentration may vary from one preparation to the next. The in vitro situation imposes special demands on glucose delivery (Lund-Andersen et al., 1976). In the intact brain, delivery is via a mesh of nutritive capillaries that appear to be about 50 μm apart (Bachelard et al., 1973). In vitro, glucose must diffuse variable distances to reach cells. As a consequence of this very different geometry, the optimal concentration of bath glucose for tissue survival may differ from normal blood glucose levels. For example, if one assumes that the optic nerve in an interface chamber is surrounded by a thin layer of bath solution due to capillary forces, axons at the center of the nerve would be separated from their glucose supply by about 140 μm (281 μm/2) in the mouse and about 325 μm (650 μm/2) in the rat. The only practical way to compensate for longer diffusion distances in vitro is to increase bath glucose concentration.
Increased osmolarity during anoxia enhanced anoxia-resistance of RON axons (i.e., the CAP was preserved during anoxia and showed better recovery; Fig. 5b). Brain extracellular space is very tight and small changes in this space can affect diffusion (Nicholson, 1995). Increased osmolality would draw water from cells into the extracellular space, increasing the volume of the extracellular space. It would also reduce the complexity of the path followed by a diffusing particle, a parameter called tortuosity (Nicholson, 1995). Both of these changes increase the efficiency of diffusion in brain extracellular space and serve as the probable explanation of the osmotic effect reported here. In other words, glucose was probably better able to diffuse into the tissue during anoxia under hypoosmotic conditions. This effect may be especially important because it opposes the natural effect of anoxia to cause extracellular space shrinkage in RON (Ransom and Philbin, 1992), an effect that can reduce extracellular space volume by about 50%. In addition to improving the distribution of glucose, osmotic-induced improvement in diffusion may have led to improved dissipation of accumulating extracellular K+, thereby delaying depolarization and loss of excitability.
White matter is relatively resistant to anoxia
Axons are well equipped to derive energy by using oxygen and glucose, and about 50% of ATP is spent to regulate ionic homeostasis to maintain axon conduction. Under severe energy deprivation, CNS axons can no longer make ATP and the ATP-dependent Na+-K+ exchange fails, leading to excessive Na+ influx through noninactivating voltage-gated sodium channels and resulting in disruption of axon ion homeostasis and loss of excitability (Fern et al., 1998; Ransom et al., 1990; Stys et al., 1992b). We have shown that a substantial population of axons in white matter continue to function during complete anoxia. We confirmed this unexpected observation using “chemical anoxia” induced by sodium cyanide (Leppanen and Stys, 1997) (Fig. 4A, insets a and b).
There is precedent, of course, for anoxia resistance of brain function. Freshwater turtles and certain fish have anoxia-tolerant brains (Lutz et al., 1996; Lutz and Reiners, 1997). The most important compensation in the turtle brain for surviving anoxia is lowering its energy consumption to such a degree (by 70–80%) that brain energy needs can be fully met by anaerobic glycolysis (Doll et al., 1993; Lutz et al., 1984). Some evidence supports the notion that the Na+-K+ pump requires ATP from glycolysis, as opposed to the ATP from oxidative phosphorylation (Lipton and Robacker, 1983). Based on our data, it seems that some, but not all, CNS axons were also able to subsist solely on energy derived from glycolysis. This is supported by the prompt loss of function seen when glucose was removed during anoxia. The specialization that allows some optic nerve axons, but not others, to maintain normal excitability on glycolytically produced ATP alone, remains unclear (Fig. 5 and Fig. 6).
Anoxia caused a transient initial increase in CAP area in MONs (Fig. 2A). It is unlikely that this increase represented recruitment of previously inactive axons because the stimulation parameters were chosen to be supramaximal. However, studies on human peripheral nerves have shown that ischemia initially caused a decrease in threshold, followed by an increase and then conduction block (Kugelberg, 1944). These changes in threshold and accommodation during ischemia occurred as a result of membrane depolarization secondary to an increase in extracellular K+, followed by inactivation of Na+ permeability and leading to block of conduction (Baker and Bostock, 1989; Bergmans and Michaux, 1970). Another explanation would be that the amount of current generated by the axons was transiently increased. Transient hyperpolarization of axons would have this effect and has been reported under certain related conditions (Leppanen and Stys, 1997).
Footnotes
Acknowledgments
The authors thank Dr. Raymond Swanson for his insightful discussions.