
Abstract
Postembedding immunocytochemistry was used to localize aspartate, glutamate, gamma-aminobutyric acid (GABA), and glutamine in hippocampus and striatum during normo- and hypoglycemia in rat. In both brain regions, hypoglycemia caused aspartatelike immunoreactivity to increase. In hippocampus, this increase was evident particularly in the terminals of known excitatory afferents—in GABA-ergic neurons and myelinated axons. Aspartate was enriched along with glutamate in nerve terminals forming asymmetric synapses on spines and with GABA in terminals forming symmetric synapses on granule and pyramidal cell bodies. In both types of terminal, aspartate was associated with clusters of synaptic vesicles. Glutamate and glutamine immunolabeling were markedly reduced in all tissue elements in both brain regions, but less in the terminals than in the dendrosomatic compartments of excitatory neurons. In glial cells, glutamine labeling showed only slight attenuation. The level of GABA immunolabeling did not change significantly during hypoglycemia. The results support the view that glutamate and glutamine are used as energy substrates in hypoglycemia. Under these conditions both excitatory and inhibitory terminals are enriched with aspartate, which may be released from these nerve endings and thus contribute to the pattern of neuronal death characteristic of hypoglycemia.
The amino acids glutamate (Glu), aspartate (Asp), and glutamine (Gln) are ubiquitously distributed in the brain. Glutamate is the most abundant excitatory transmitter (Ottersen and Storm-Mathisen, 1984), but Asp also has excitatory properties (Collingridge and Lester, 1989) and may have a transmitter function (Gundersen et al., 1998). In addition, Asp and Glu, together with Gln, serve as important intermediates in brain energy metabolism. In contrast, gamma-aminobutyric acid (GABA) is the main inhibitory transmitter in the brain (Ottersen and Storm-Mathisen, 1984).
Previous biochemical studies have shown that during insulin-induced hypoglycemia there is an increase in the concentration of Asp and a decrease in the concentrations of Glu and Gln in whole brain and in different brain regions, including hippocampus and striatum (Engelsen et al., 1986). A massive increase in the extracellular level of Asp and a moderate increase in those of Glu and GABA have been demonstrated under hypoglycemic conditions in hippocampus and striatum (Sandberg et al., 1986; Butcher et al., 1987). Aspartate and Glu are reported to possess excitotoxic properties at high extracellular concentrations (Olney, 1990). Therefore, Asp and Glu have been implicated in the neuronal damage that takes place in the brain after a hypoglycemic event. Particularly susceptible are the pyramidal cells of hippocampus CA1, the dentate granule cells, and neurons in the striatum (Auer et al., 1984). In support of the excitotoxic hypothesis, treatment with Glu-receptor antagonists ameliorates hypoglycemia-induced neuronal damage (Wieloch, 1985). However, the pathophysiology of this condition is still insufficiently known. For example, the cell compartments that are the sites of the buildup and release of Asp remain to be identified.
Previous work on amino acid alterations in the brain during hypoglycemia has been performed with biochemical methods with low anatomic resolution. Here, the authors used light and high-resolution electron microscopic immunocytochemistry to reveal the cellular and subcellular redistribution of Asp and other neuroactive amino acids during hypoglycemia. The aim was to provide new insight in brain amino acid metabolism and pathophysiology of hypoglycemic brain damage.
MATERIALS AND METHODS
Five fasted Wistar rats were made hypoglycemic by intraperitoneal injection of insulin as described previously (Engelsen et al., 1986). The rats were given rapidly acting insulin (Novo Nordisk) (100 IU/kg). After approximately 2.5 hours, when the rats had lost their righting reflex, were drowsy, and were approaching a state of coma, they were given an intraperitoneal injection of pentobarbital (100 mg/kg) and fixed by perfusion through the heart with a mixture of 2.5% glutaraldehyde and 1% formaldehyde in 0.1 mol/L sodium phosphate buffer (pH 7.4). The aldehyde solution was preceded by a 15-second flush with 4% dextran 70000 mw in the same buffer. None of the insulin-treated rats experienced convulsions. Blood samples for glucose analysis were taken from the hind limb immediately before the fixation.
Glucose was measured by reflectance spectroscopy using a DT60 Ectachem (Kodak, Rochester, NY, U.S.A.). In the hypoglycemic animals, the blood glucose concentration was 1.3 ± 0.2 mmol/L (mean ± SD in 5 animals) and ranged between 1.0 mmol/L and 1.5 mmol/L. Five normoglycemic rats were given saline instead of insulin and were similarly anesthetized and perfusion-fixed along with the insulin-treated rats. In the normoglycemic animals, blood glucose concentration was 3.6 ± 0.15 mmol/L and ranged between 3.4 mmol/L and 3.7 mmol/L. Brains were dissected out and kept in the fixative overnight at 4°C. Then the hippocampi and striata were dissected free and treated with 2% uranyl acetate in 0.15 mol/L sodium acetate buffer (pH 6.0) on ice. This was used instead of osmium tetroxide, which inhibits the labeling of Asp (Gundersen et al., 1993). The specimens then were dehydrated in ethanol and embedded in Durcupan ACM.
Semithin (1 μm) and ultrathin (gold) sections were cut, mounted on glass slides and nickel grids, respectively, and processed with the 435 Asp, 990 GABA, 607 Glu, 34 Gln, and 286 taurine (Tau) antisera according to a streptavidin-biotinperoxidase and a two layer immunogold procedure (Ottersen, 1987). The antisera were raised in rabbits essentially as first described (Storm-Mathisen et al., 1983) by immunizations with glutaraldehyde/formaldehyde-protein conjugates of the respective amino acids. The 990 GABA antiserum has previously not been extensively characterized. To minimize background staining, it was absorbed on an agarose column carrying bovine serum albumin to which Glu had been coupled by glutaraldehyde. To test the 990 GABA antiserum, test specimens (Ottersen and Storm-Mathisen, 1984) were made by spotting conjugates of approximately fifty different amino acids and peptides endogenous to the brain, previously linked to brain proteins by glutaraldehyde/formaldehyde onto cellulose nitrate and acetate filters. The test filters were processed with the GABA antibodies according to a three layer peroxidase–antiperoxidase method. The tested compounds were as follows: L- and D-homocysteate, D-cysteine, DL-homocysteine, L-citrulline, reduced glutathione, β-alanine, D-Asp, hypotaurine, L-cystine, L-isoleucine, D-arginine, L-methionine, glutamyl-glutamate, D-leucine, L-phenylalanine, L-serine, null (no amino acid), L-leucine, L-proline, GABA, L-glutamate, L-taurine, glycine, L-aspartate, L-glutamine, epinephrine, norepinephrine, phosphoethanolamine, 3-aminopropane sulfonate (homotaurine), L-homocysteine sulfinate, L-α-alanine, L-valine, L-tryptophane, L-threonine, L-cysteine, L-tyrosine, L-asparagine, L-lysine, L-arginine, L-histidine, L-cysteate, glutamyltaurine, cysteine sulfinate, N-acetylaspartate, oxidized glutathione, L-S-sulfo-cysteine, leu-enkephalin, and met-enkephalin. After passing the 990 GABA serum through the agarose column, there was still a very slight reactivity against L-Glu as well as against β-alanine, which disappeared when the serum was preabsorbed with soluble glutaraldehyde/formaldehyde (weight proportion 2.5:1) complexes of these amino acids.
Thus, these complexes were added to the 990 GABA antiserum 3 to 24 hours before each immunocytochemical incubation. The Asp, Glu, Gln, and Tau antisera have been characterized previously (Gundersen et al., 1998) and proven highly specific when used as described (no. 435: Gundersen et al., 1998; no. 607: Broman et al., 1993; no. 34: Laake et al., 1995; no. 286: Amiry-Moghaddam et al., 1994). To ensure that there was no crossreactivity, the L-Asp antiserum was used with soluble glutaraldehyde/formaldehyde complexes of L-Glu, L-asparagine, and GABA (0.2 mmol/L of each amino acid) added to the diluted antibody solution 3 to 24 hours before applying it to the sections. Aldehyde and protein reactivities were previously absorbed from the Asp antiserum on an agarose column bearing glutaraldehyde/formaldehyde-treated bovine serum albumin and the IgG subsequently isolated on a protein A column (dilutions given are with respect to the crude serum). The Glu and Gln antisera were used with the addition of 0.2 mmol/L glutaraldehyde/formaldehyde-treated Asp, Gln, and Glu, respectively.
As an intrinsic specificity control for each incubation, conjugates of different amino acids linked to brain macromolecules by glutaraldehyde/formaldehyde were freeze-dried and embedded in Durcupan ACM (Ottersen, 1987). Ultrathin sections were cut, mounted on nickel grids, and incubated together with the tissue sections. The concentration of the fixed amino acids in the embedded conjugate clumps is approximately 100 mmol/L (Ottersen, 1989). These test systems showed that the immunolabeling obtained in the current study was highly specific. Furthermore, the Asp, Glu, Gln, and GABA immunoreactivities of tissue and test sections were blocked by adding 0.3 mmol/L aldehyde-treated Asp, Glu, Gln, or GABA, respectively, to the antisera.
Using graded test sections with different known concentrations of amino acids (Ottersen, 1989), it has been demonstrated that there is a close to linear relation between the amino acid concentrations in the test sections and the gold particle densities produced by the antisera used here (Gundersen et al., 1995).
The semithin sections were viewed in a light microscope at x100 magnification (x10 objective) and the distributions of GABA- and Asp-labeled cell bodies in the hilus were plotted on transparent sheets in a camera lucida. The drawings then were superimposed using the outline of blood vessels and the granule cell layer as guides. Cell bodies were identified as GABA-positive when the GABA antiserum produced a staining intensity higher than that in the granule cells, and as Asp-positive when the Asp antiserum produced a staining intensity similar to or greater than the Asp intensity in granule cells. The ultrathin sections were viewed in a Philips CM 10 electron microscope. Electron micrographs were taken randomly at x6300 primary magnification in the stratum radiatum and in the alveus of hippocampus CA1, in the inner third of stratum moleculare, in stratum granulare and in the hilus of area dentata, and in fiber bundles and in the neuropil in striatum. The quantifications were performed at x48,000 final magnification.
Aspartatelike immunoreactivity (Asp-LI), glutamatelike immunoreactivity (Glu-LI), glutaminelike immunoreactivity (Gln-LI), and GABA-like immunoreactivity (GABA-LI) were quantified in the following ultrastructural elements in the hippocampus: terminals making asymmetric synapses in the stratum radiatum of CA1 and the inner third of stratum moleculare of fascia dentata and their postsynaptic dendritic spines as well as dendritic shafts in these areas, mossy fiber terminals in the hilus of fascia dentata, terminals contacting granule cell bodies in the fascia dentata, myelinated axons in alveus, and processes of glial cells (identified by the presence of filaments, or by contact with capillaries, or both) in all regions. In addition, the Asp, GABA, Gln, and Tau immunoreactivities were quantified over synaptic vesicle clusters and over cytoplasmic matrix in terminals contacting granule cell bodies. In the striatum, the quantifications were performed in nerve terminals forming asymmetric synapses with dendritic spines (these terminals are thought to make up the vast majority of terminals belonging to the cortico-striatal projection), in the dendritic spines, in terminals making contact with dendritic shafts, as well as in the shafts, neuronal cell bodies, myelinated axons, and processes of glial cells (identified as above).
The areas of the various cellular and subcellular elements, over which numbers of gold particles were recorded, were determined by point-counting using an overlay screen (Gundersen et al., 1998) and the gold particle densities were calculated. The numbers of stained neuronal cell bodies/mm2 of semithin section were determined similarly. The results in normo- and hypoglycemic tissue were statistically evaluated (Statistica) using a nonparametric test (two-tailed Mann–Whitney U test).
Durcupan ACM was purchased from Fluka (Buchs, Switzerland) and glutaraldehyde (25%, EM) from TAAB (Reading, U.K.). Anti-rabbit Ig (biotinylated Ig from goat), streptavidin-biotinylated horseradish peroxidase complex, and Auroprobe GAR 15 were obtained from Amersham (Buckinghamshire, U.K.). These immunoreagents were diluted as recommended by the manufacturer. Insulin Actrapid was from Novo Nordisk (Copenhagen, Denmark).
RESULTS
Redistribution of immmunoreactivities in the hypoglycemic hippocampus
Light microscopy demonstrated that the intensity of Asp-LI was considerably greater, whereas the intensity of Glu-LI was less in the hypoglycemic hippocampus than in control hippocampus (Fig. 1). Particularly striking was that during hypoglycemia, the Asp antiserum produced a laminar staining pattern corresponding to the terminal fields of excitatory afferents in hippocampus as well as staining of a large number of neuronal cell bodies in the hilus of fascia dentata (Fig. 1A and 1B). In the hypoglycemic hippocampus, the Glu lamination also was more evident than in control hippocampus, but staining of granular and pyramidal cell bodies was suppressed and there was no sign of Glu-positive neuronal cell bodies in the hilus (Fig. 1C and 1D). During hypoglycemia the light microscopic intensity of Gln-LI was strongly reduced, whereas that of GABA-LI did not change (results not shown). The number per mm2 of hilar neuronal cell bodies containing Asp-LI increased significantly in hypoglycemic compared with control hippocampus, whereas the number per mm2 of GABA-positive neuronal cell bodies did not change significantly (Fig. 2). Labeling of serial semithin sections from hypoglycemic hippocampi showed that most of the Asp-stained neuronal cell bodies in the hilus were stained by the GABA antiserum (Fig. 3). Comparison of camera lucida drawings (Fig. 4) of such sections demonstrated that 89% ± 16% of Asp-positive neuronal cell bodies were GABA-positive and that 99% ± 2% (mean ± SD in 5 animals) of GABA-positive neuronal cell bodies were Asp-positive.
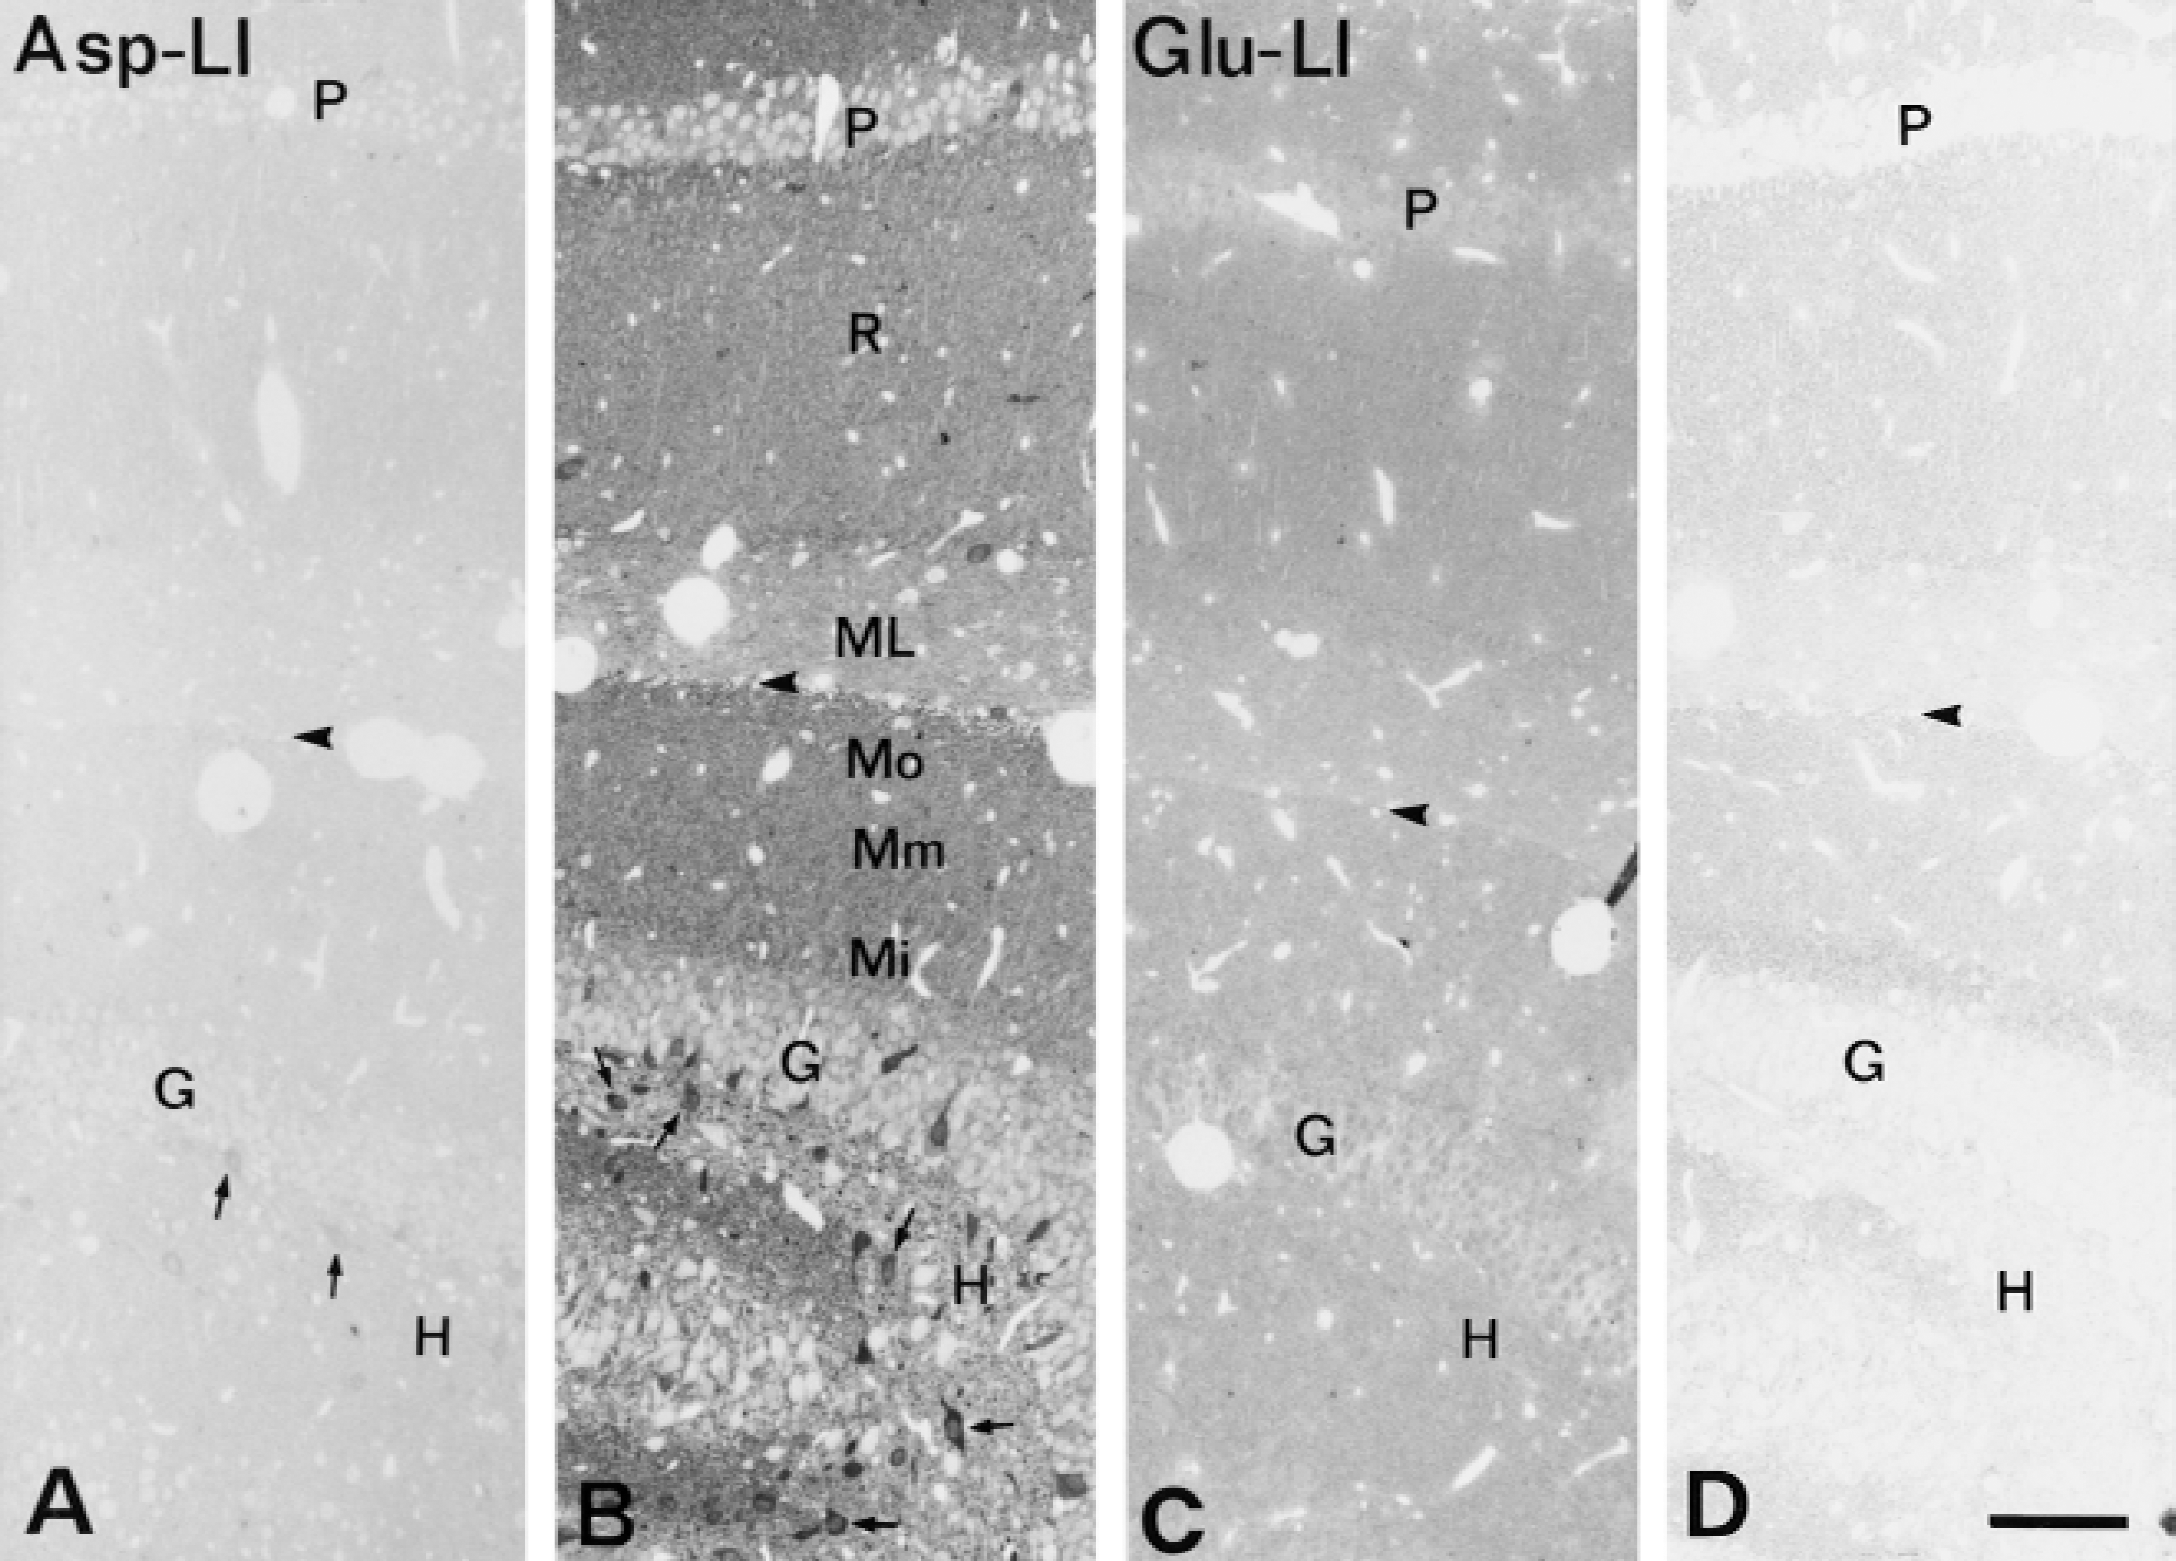
Light micrographs of semithin sections showing aspartatelike immunoreactivity (Asp-LI) (
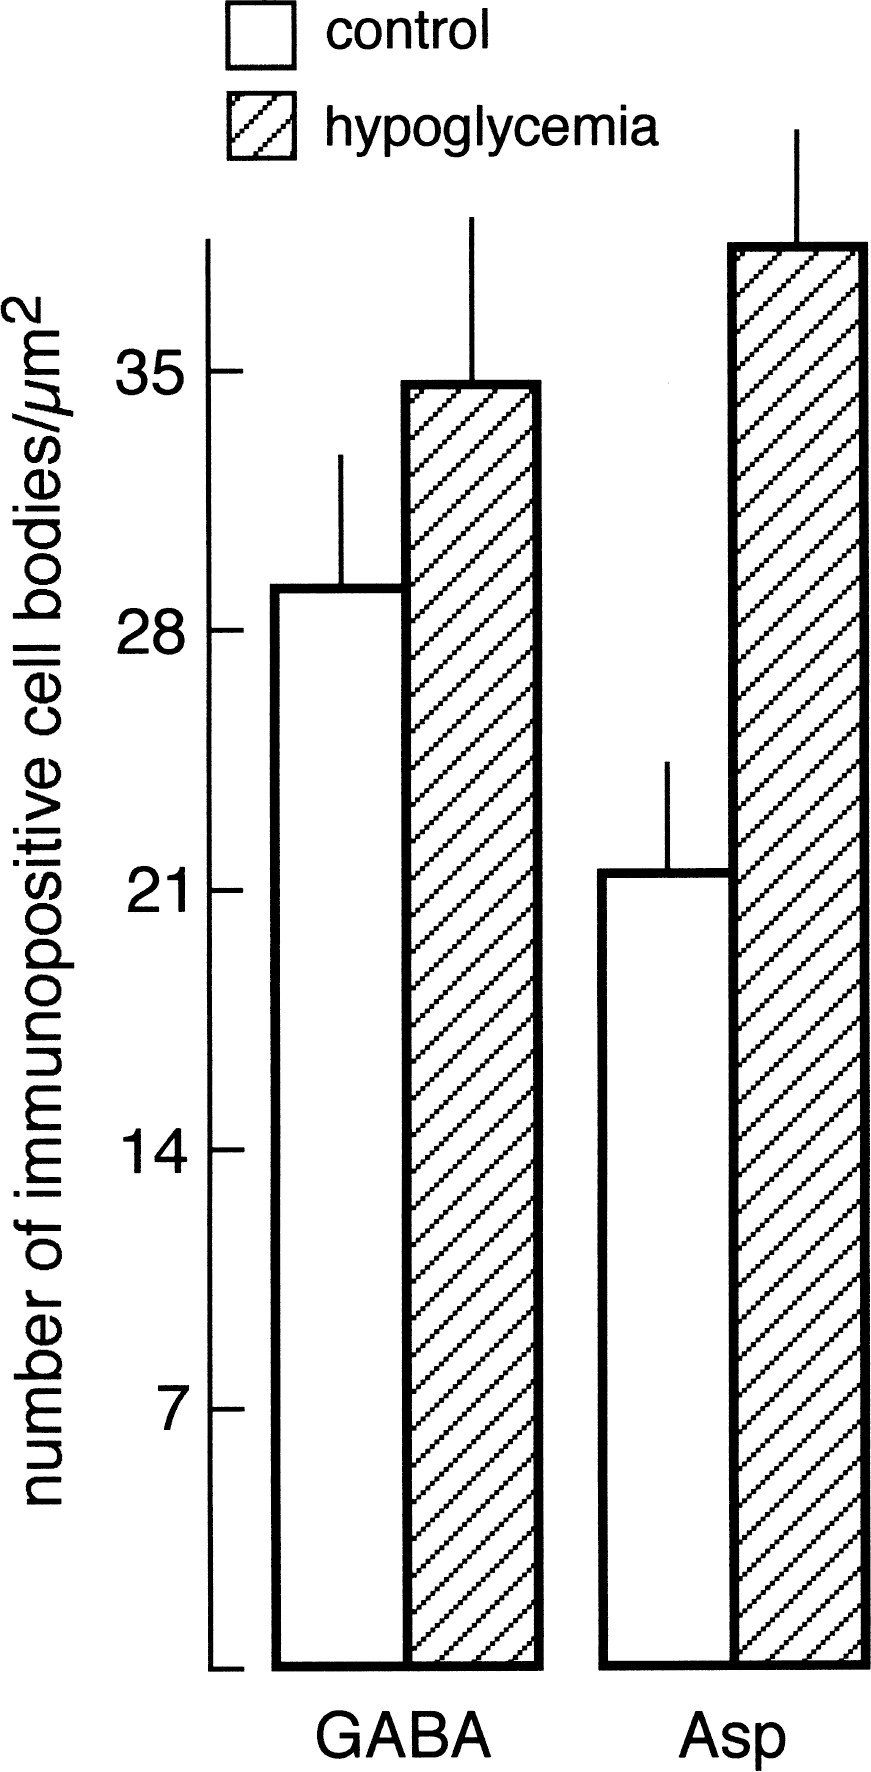
Histogram showing the density of aspartate (Asp) and gamma-aminobutyric acid (GABA) immunoreactive neuronal cell bodies in fascia dentata in normoglycemia (open columns) and hypoglycemia (hatched columns). Mean number of cell bodies/mm2 (±SD, n = 5 animals) was determined. Values for aspartatelike immunoreactivity (Asp-LI) in hypoglycemic animals were significantly greater than those in normoglycemic animals (P < 0.001) (two-tailed Mann–Whitney U test).
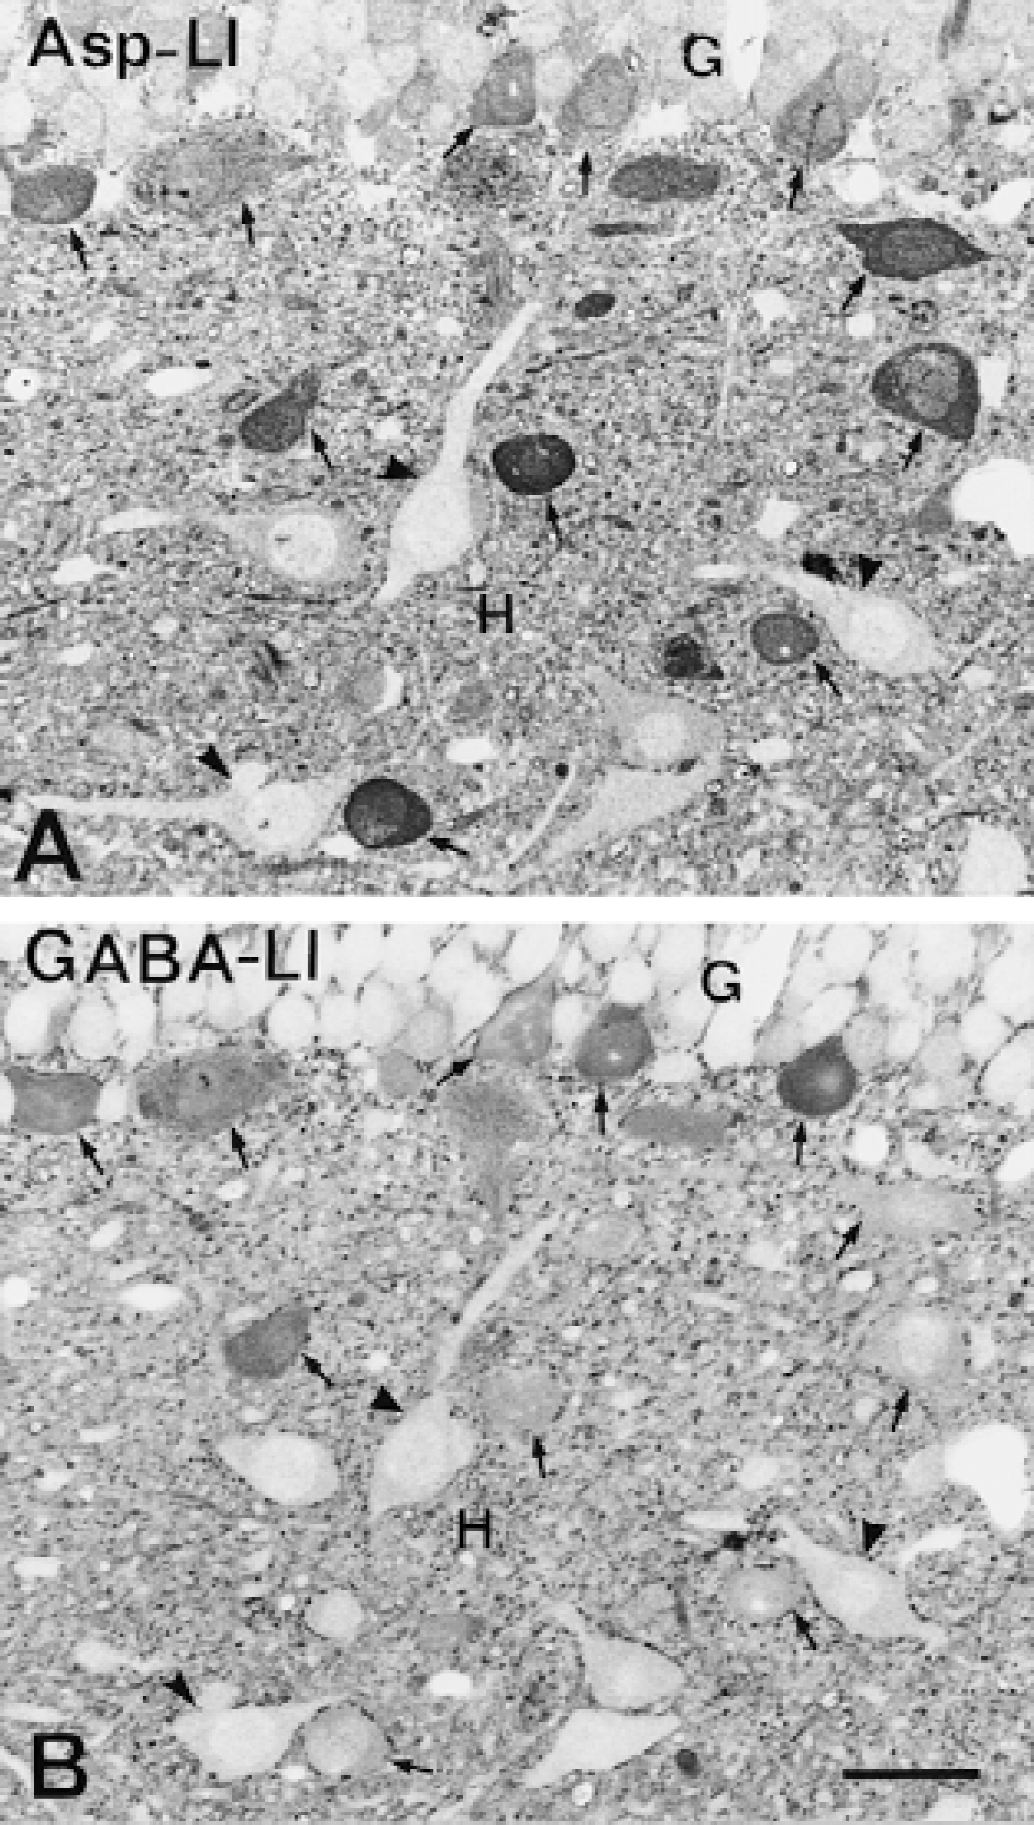
Light micrographs of aspartatelike immunoreactivity (Asp-LI)
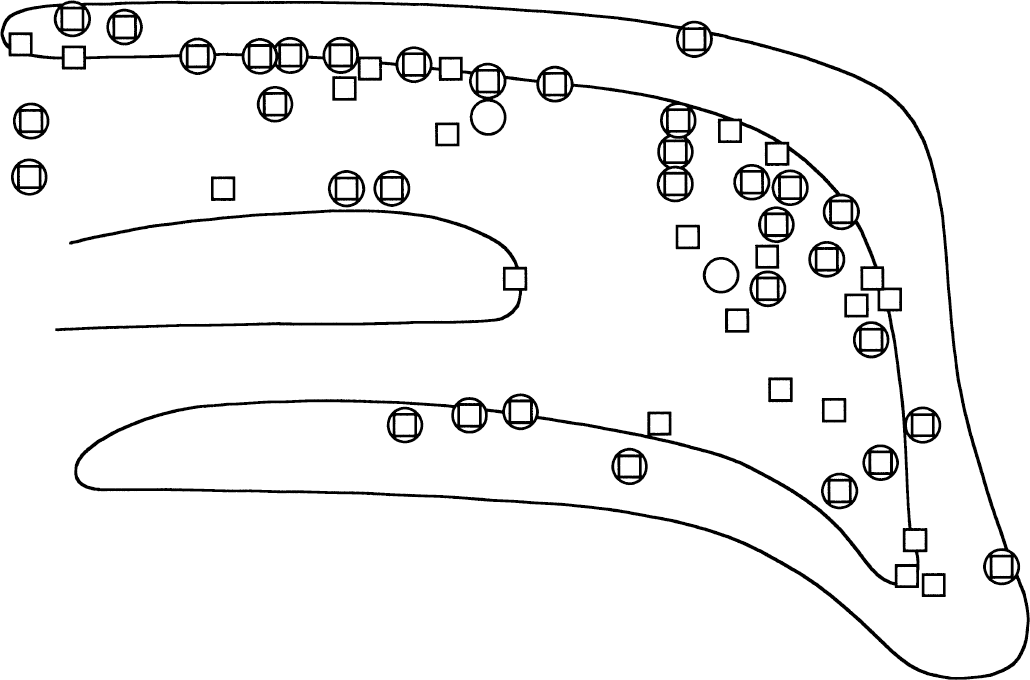
Camera lucida drawing of semithin sections showing aspartatelike immunoreactivity (Asp-LI) (squares) and gamma aminobutyric–like immunoreactivity (GABA-LI) (circles) positive neuronal cell bodies in fascia dentata from a hypoglycemic animal. Note that most Asp-LI positive neurons also stained for GABA and that essentially all GABA-LI positive neurons contained Asp-LI.
Quantitative electron microscopy in CA1 of hippocampus and in fascia dentata revealed that the density of Asp immunogold particles was greater in all tissue compartments in hypoglycemia than in normoglycemia (Fig. 5). The highest increase in Asp-LI appeared in nerve terminals making asymmetric synapses with spines (Fig. 6A and 6B), in those making contact with granule cell bodies (Fig. 7A and 7B), and in myelinated axons (Fig. 5). There was a moderate to low increase in Asp-LI in dendritic spines, dendritic shafts, granule cell bodies, and processes of glial cells (Fig. 5). Inspection of the ultrathin sections showed high Asp immunolabeling during hypoglycemia also in terminals contacting pyramidal cells in CA1. Immunogold labeling of serial ultrathin sections showed that during hypoglycemia Asp-LI and Glu-LI were colocalized in terminals forming asymmetric synapses with spines and that Asp-LI and GABA-LI were colocalized in terminals in contact with granule cell bodies (Figs. 6 and 7). The authors found no terminals that were single labeled for Asp-LI. For Glu-LI and Gln-LI all hippocampal compartments included in this study had lowered densities of gold particles during hypoglycemia (Fig. 5). The attenuation of Glu and Gln immunogold particles was modest in the categories of terminal forming asymmetric synapses (for Glu-LI in asymmetric CA1 synapses see Fig. 6C and 6D), whereas a strong reduction (by more than 60%) was found in nerve terminals making symmetric synapses, in dendritic spines, in dendritic shafts, and in granule cell bodies. In hypoglycemic glial cells, Glu-LI was reduced to a large extent and Gln-LI to a relatively small extent. There was no significant alteration in the density of GABA immunogold particles in any of the ultrastructural compartments examined in hippocampus (Fig. 5). The ratio between Asp-LI and Glu-LI in excitatory terminals and between Asp-LI and GABA-LI in inhibitory terminals increased during hypoglycemia by a factor of about 5 and 2.5, respectively.
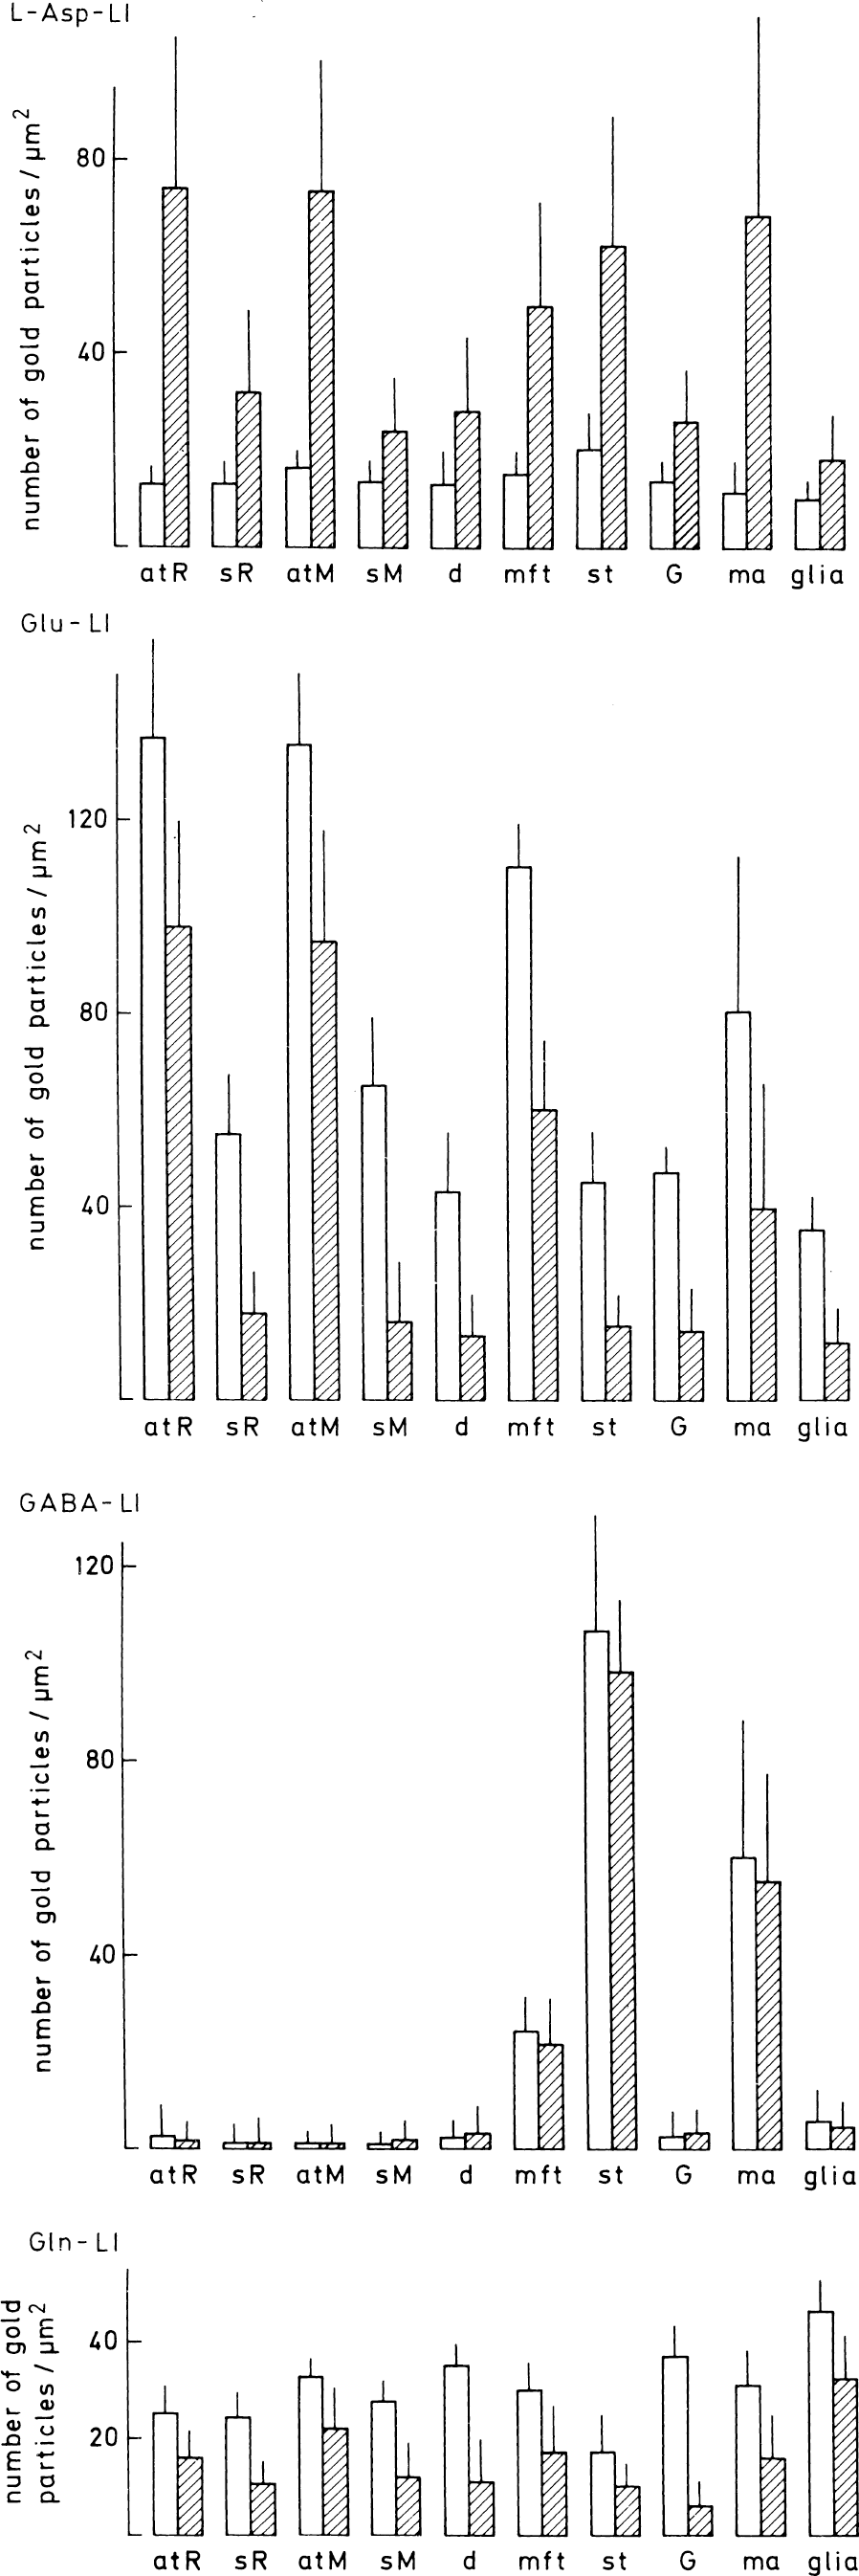
Quantification of amino acids in different tissue compartments in normoglycemic (open columns) and hypoglycemic (hatched columns) hippocampus. The values are mean numbers of gold particles/μm2 ± SD in 5 normoglycemic and 5 hypoglycemic animals (the average of 10 to 28 structural elements being determined in each animal). The particle densities were corrected for background density (particles/μm2) over empty resin (average 1.1, 1.6, 1.2, and 1.8 for the aspartate [Asp], the glutamate [Glu], the glutamine [Gln], and the gamma aminobutyric acid [GABA] antiserum, respectively). The ultrathin sections here and in Fig. 9 were incubated in the same drops of immunoreagents to allow comparison between the figures, as well as between normo- and hypoglycemic specimens. Note that the particle densities are not comparable between the different antisera, as they are not corrected for intersera differences in labeling efficiency. For aspartatelike immunoreactivity (Asp-LI) (upper panel), glutamatelike immunoreactivity (Glu-LI) (second panel), and glutaminelike immunoreactivity (Gln-LI) (bottom panel) all differences in labeling intensities between normo- and hypoglycemia were statistically significant (0.0001 < P < 0.05) (two-tailed Mann–Whitney U test). For GABA-LI (third panel) there was no significant difference between normo- and hypoglycemia. atR, terminals forming asymmetric synapses on spines (sR) in stratum radiatum of CA1 (see Fig. 1 for illustration of strata); atM, terminals forming asymmetric synapses on spines (sM) in the inner third of the molecular layer of fascia dentata; d, dendritic shafts in stratum radiatum of CA1 and the inner third of the molecular layer of fascia dentata; mft, mossy fiber terminals; st, terminals forming symmetric synapses with granule cell bodies (G); ma, myelinated axons; glia, processes of glial cells (in CA1 and fascia dentata) identified by content of filaments or contact with capillaries.
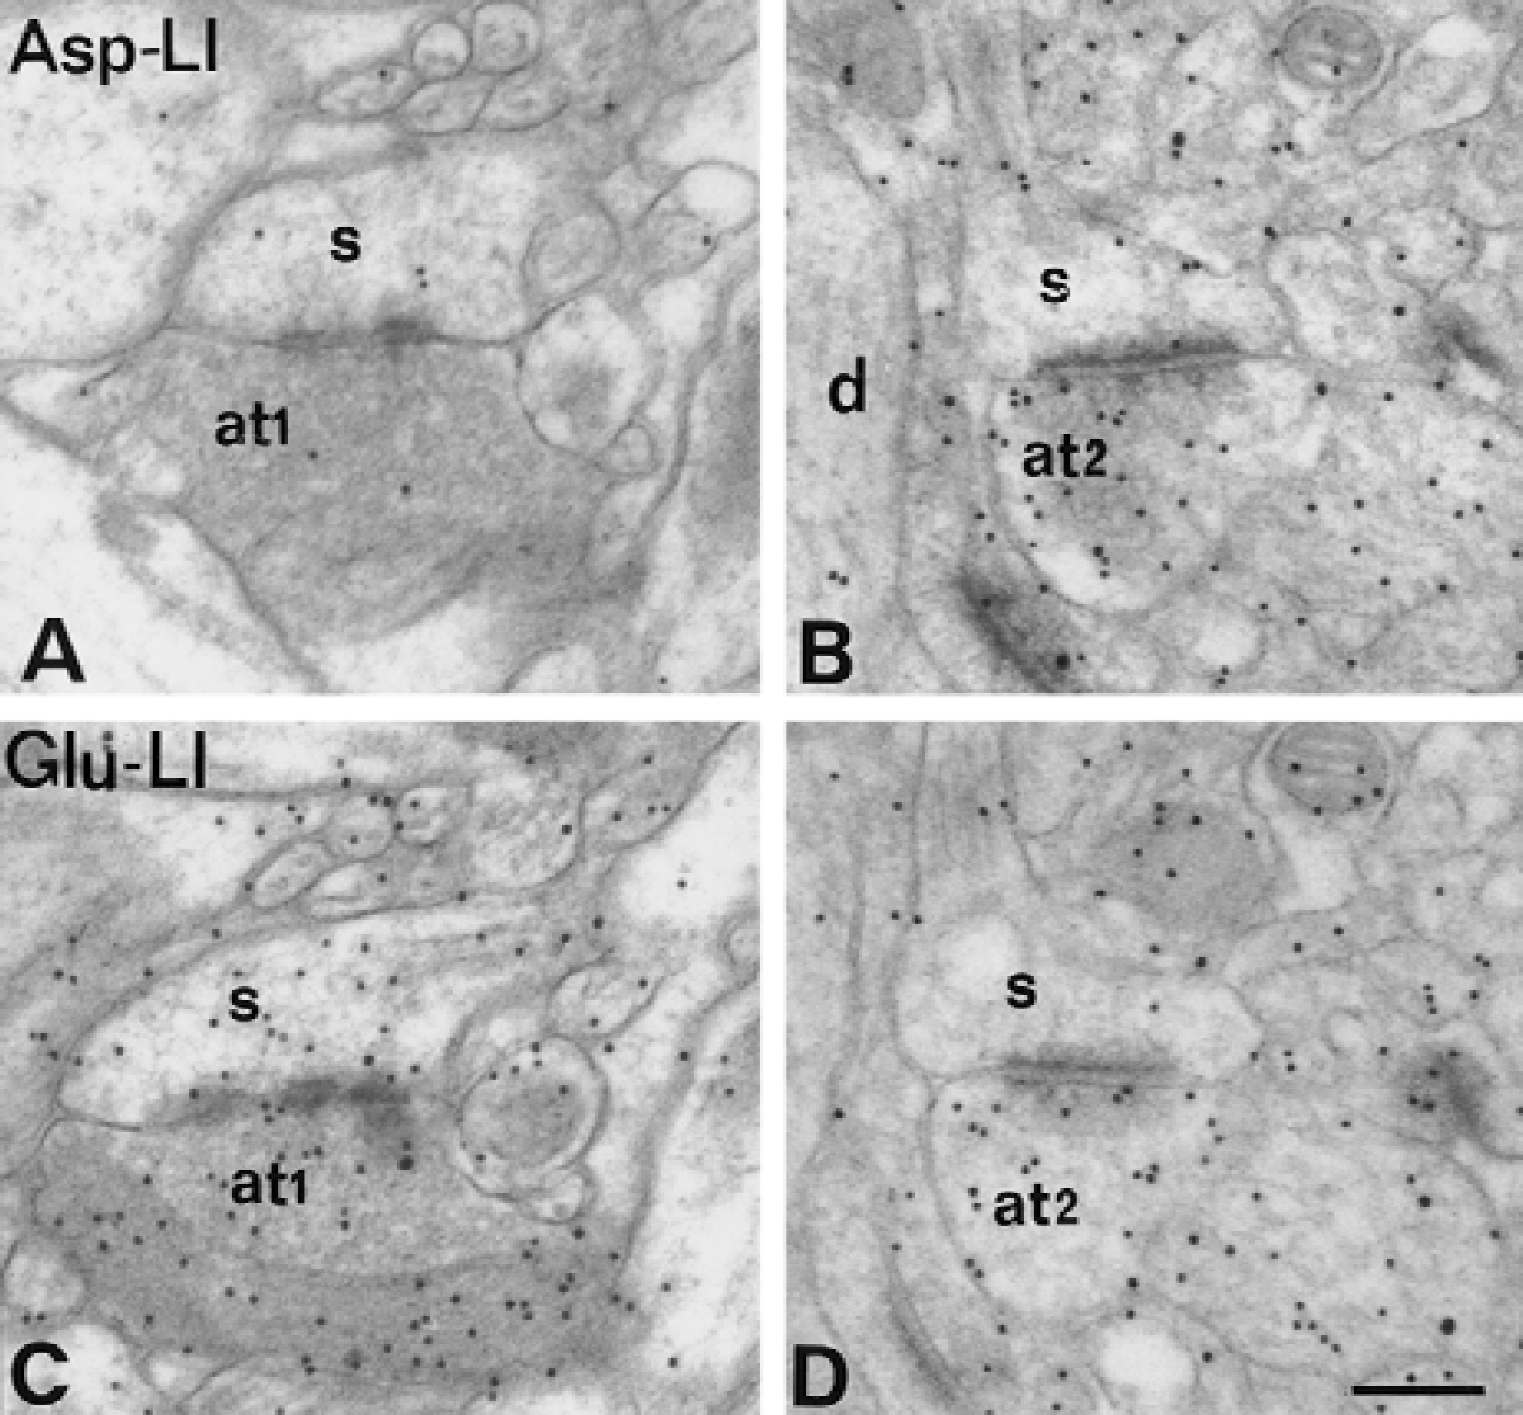
Electron micrographs of aspartatelike immunoreactivity (Asp-LI) (
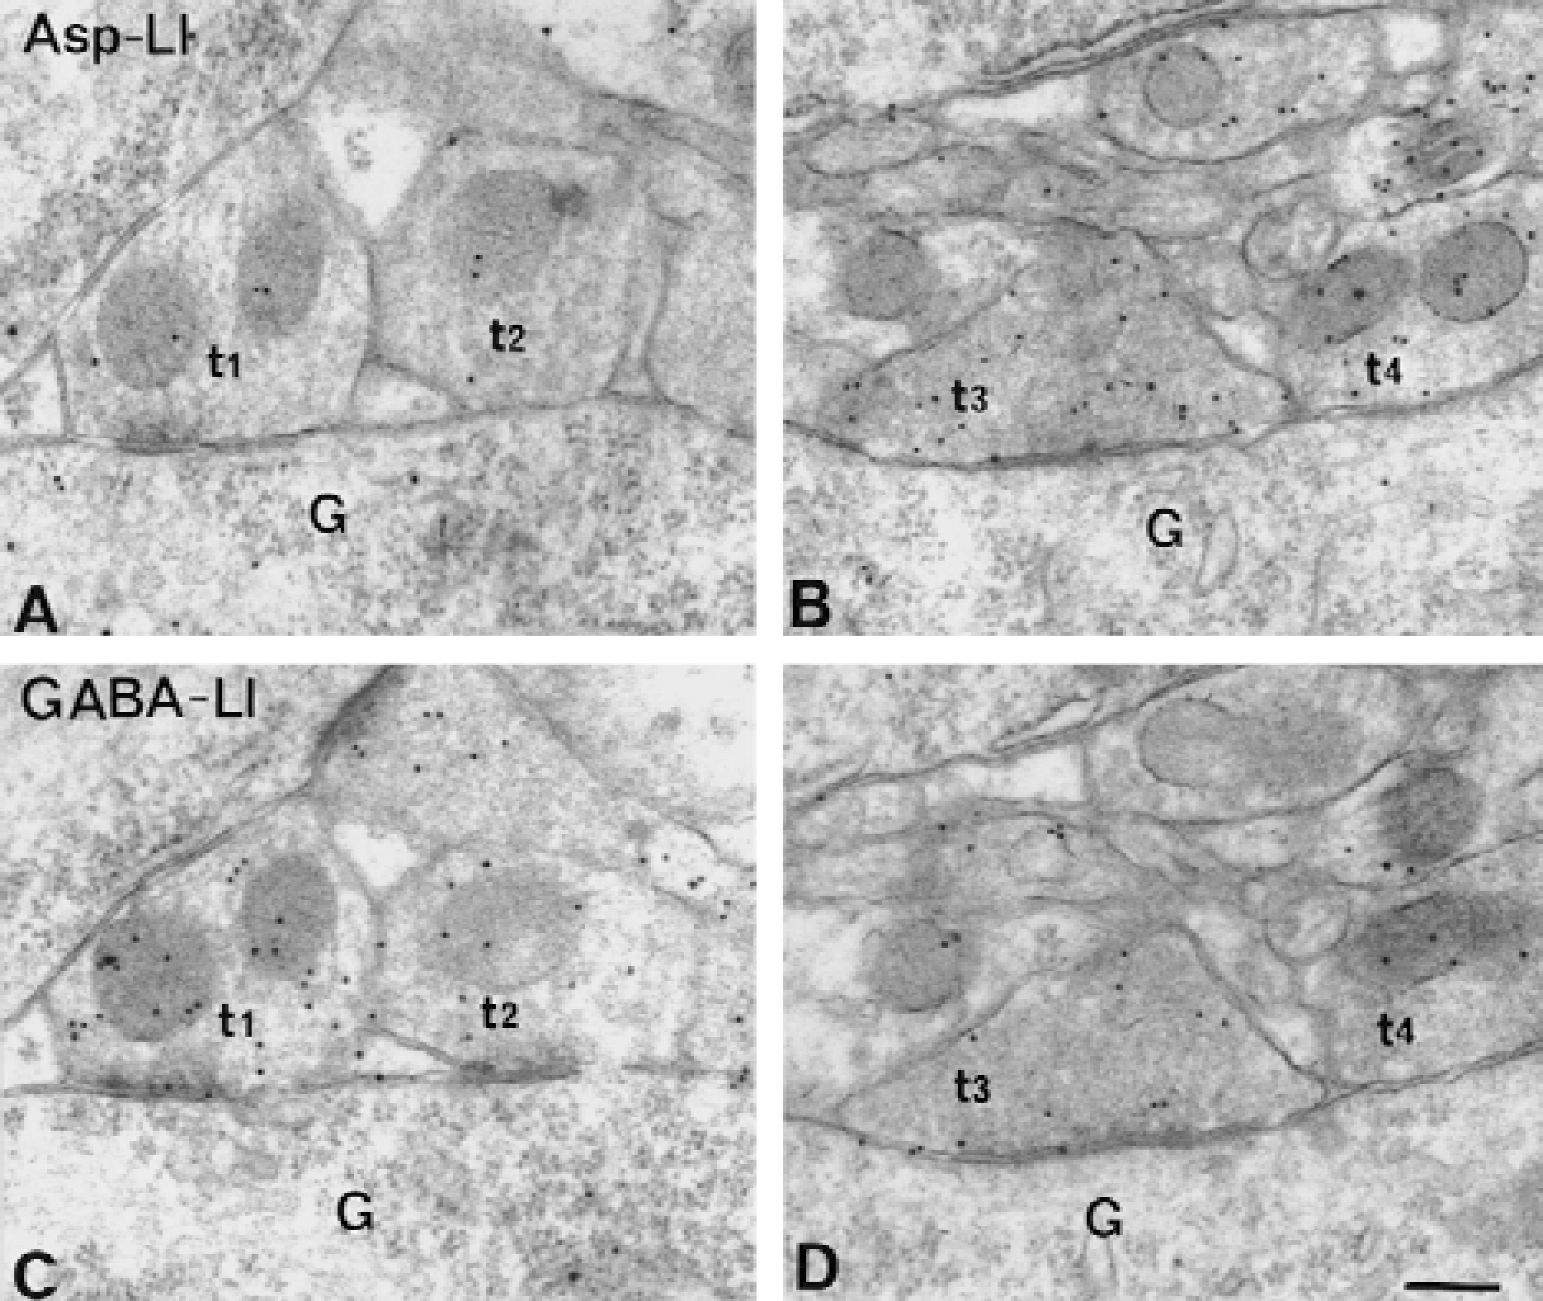
Electron micrographs of aspartate-like immunoreactivity (Asp-LI) (
In a previous study (Gundersen et al., 1998), the authors reported that in hypoglycemic nerve terminals making asymmetric synapses on spines in stratum radiatum of CA1, particle densities of Asp-LI and Glu-LI over synaptic vesicle clusters exceeded those over cytoplasmic matrix by factors of 2.0 and 2.4, respectively, as opposed to Gln-LI and Tau-LI, which did not show such enrichment. Here the authors found similar accumulation of Asp-LI and GABA-LI (1.7 and 2.1, respectively), but not of Gln-LI or Tau-LI (0.9 and 1.1, respectively), over synaptic vesicle clusters versus over cytoplasmic matrix in nerve terminals contacting granule cell bodies in the fascia dentata (Fig. 8).
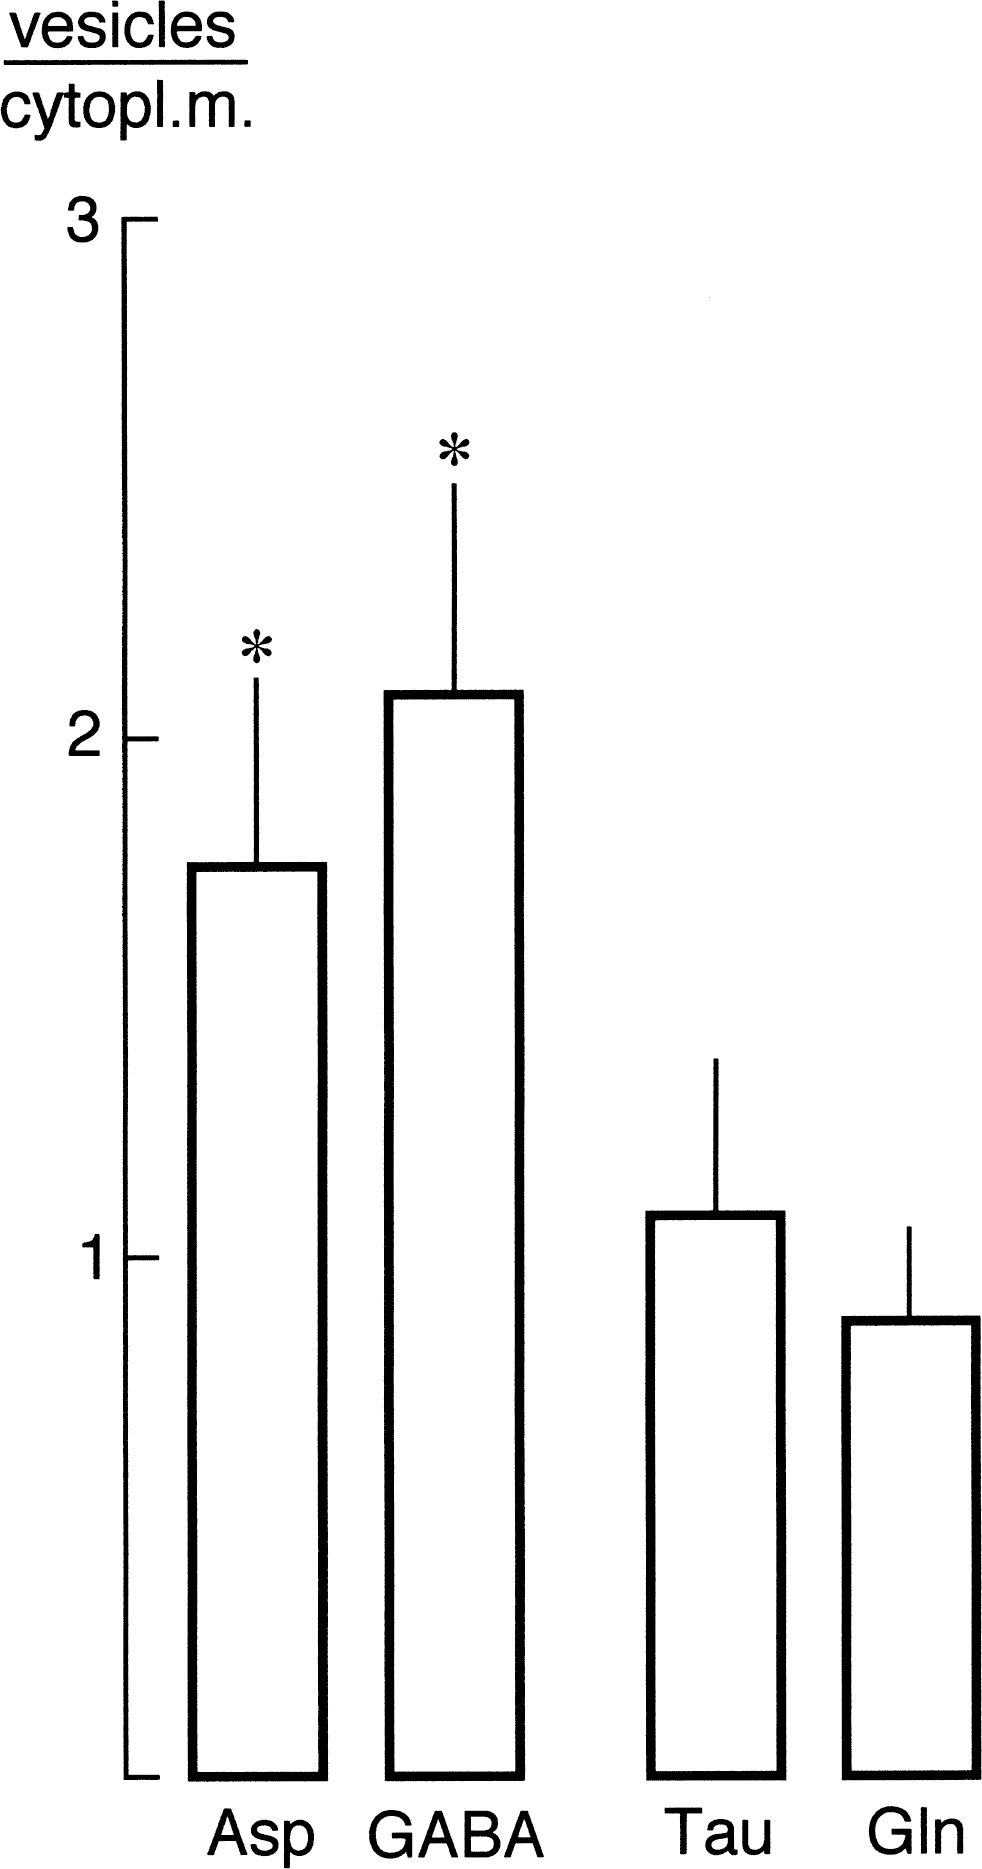
Aspartate (Asp), gamma-aminobutyric acid (GABA), taurine (Tau), and glutamine (Gln) labeling ratios between vesicle clusters (vesicles) and cytoplasmic matrix (cytopl.m.) in terminals contacting granule cell bodies in fascia dentata in a hypoglycemic animal. Ratios were calculated by dividing the densities (particles/μm2 of immunogold particles over the vesicle clusters by the densities over cytoplasmic matrix and are presented as means ± SD of 15 profiles. *Aspartatelike immunoreactivity (Asp-LI) and gamma-aminobutyric acid–like immunoreactivity (GABA-LI) ratios were significantly different (P < 0.05) (two-tailed Mann–Whitney U test) from the ratios produced by the Gln and Tau antisera.
Redistribution of immunoreactivities in the hypoglycemic striatum
In striatum, hypoglycemia induced similar quantitative changes of Asp-LI, Glu-LI, and Gln-LI as those found in hippocampus (Fig. 9). The densities of gold particles signaling Asp increased in terminals making asymmetric synapses on spines (Fig. 10) and in myelinated axons, although less so than in corresponding structures in hippocampus. The increase in Asp-LI in these structures was somewhat higher than in terminals contacting dendritic shafts (that is, mainly GABAergic) and much higher than in dendtritic spines, dendritic shafts, neuronal cell bodies, and glial cells. The densities of Glu and Gln immunogold particles were moderately reduced in the terminals with asymmetric synaptic contacts, and somewhat more reduced in terminals contacting on dendritic shafts and in myelinated axons, whereas the reductions in dendritic spines, dendritic shafts, and neuronal cell bodies were large. Like in hippocampus, glial cells showed a small reduction in Gln-LI during hypoglycemia. The density of GABA immunogold particles did not change in any striatal compartments during hypoglycemia (Fig. 9).
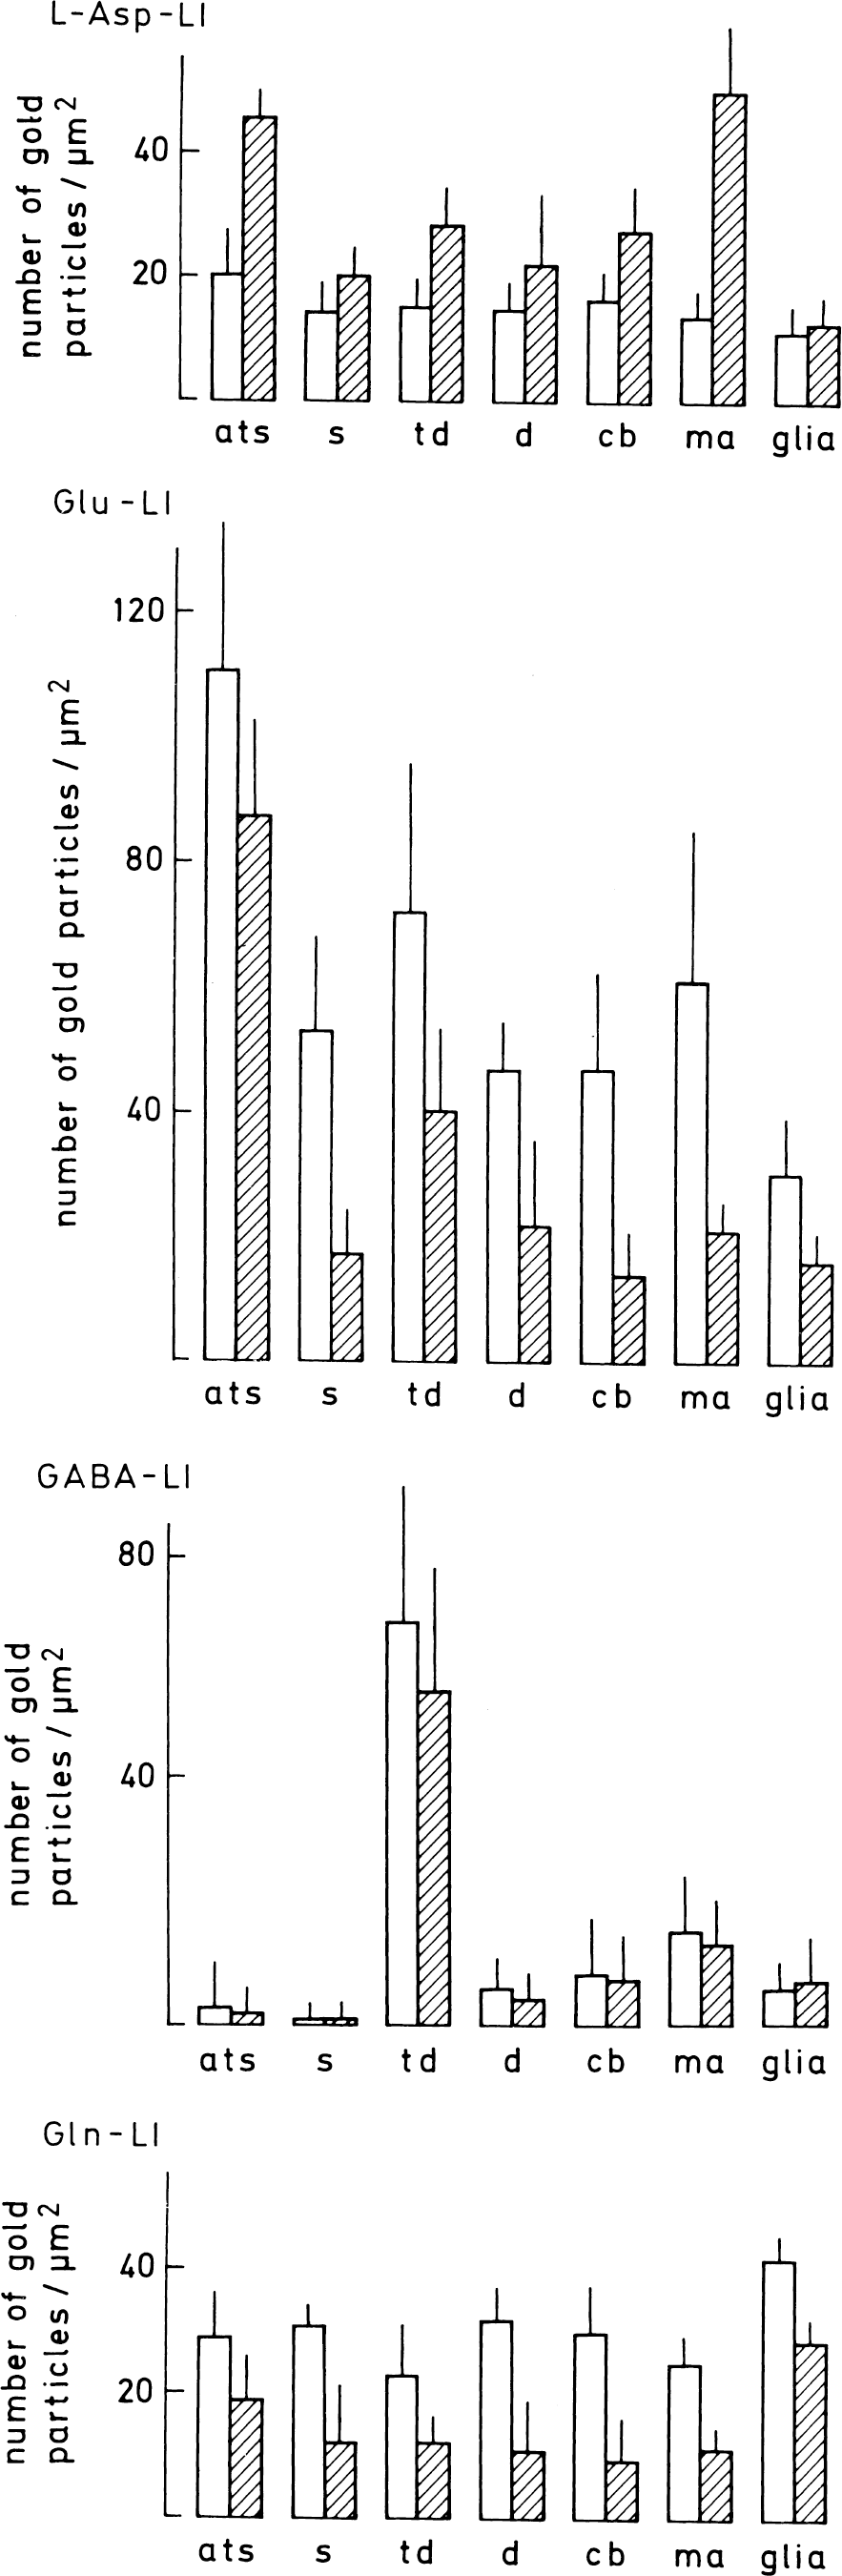
Quantification of amino acids in different tissue compartments in normoglycemic (open columns) and hypoglycemic (hatched columns) striatum. Values are mean numbers of gold particles/μm2 ± SD in 5 normo- and 5 hypoglycemic animals. Particle densities were corrected for background density (particles/μm2) over empty resin (average 1.1, 1.6, 1.2, and 1.8 for the asparate [Asp], the glutamate [Glu], the glutamine [Gln], and the gamma-aminobutyric acid [GABA] antiserum, respectively. For aspartatelike immunoreactivity [Asp-LI; upper panel], gamma-aminobutyric acid–like immunoreactivity [Glu-LI; second panel], and glutaminelike immunoreactivity [Gln-LI; bottom panel] all differences in labeling intensities between normo- and hypoglycemia were significantly different (0.001 < P < 0.05) (two-tailed Mann–Whitney U test). For GABA-LI (third panel) there was no significant difference between normo- and hypoglycemia). ats, terminals forming asymmetric synapses on spines (s); td, terminals making contact with dendritic shafts (d) or neuronal cell bodies (cb); ma, myelinated axons; glia, processes of glial cells identified by content of filaments or contact with capillaries.
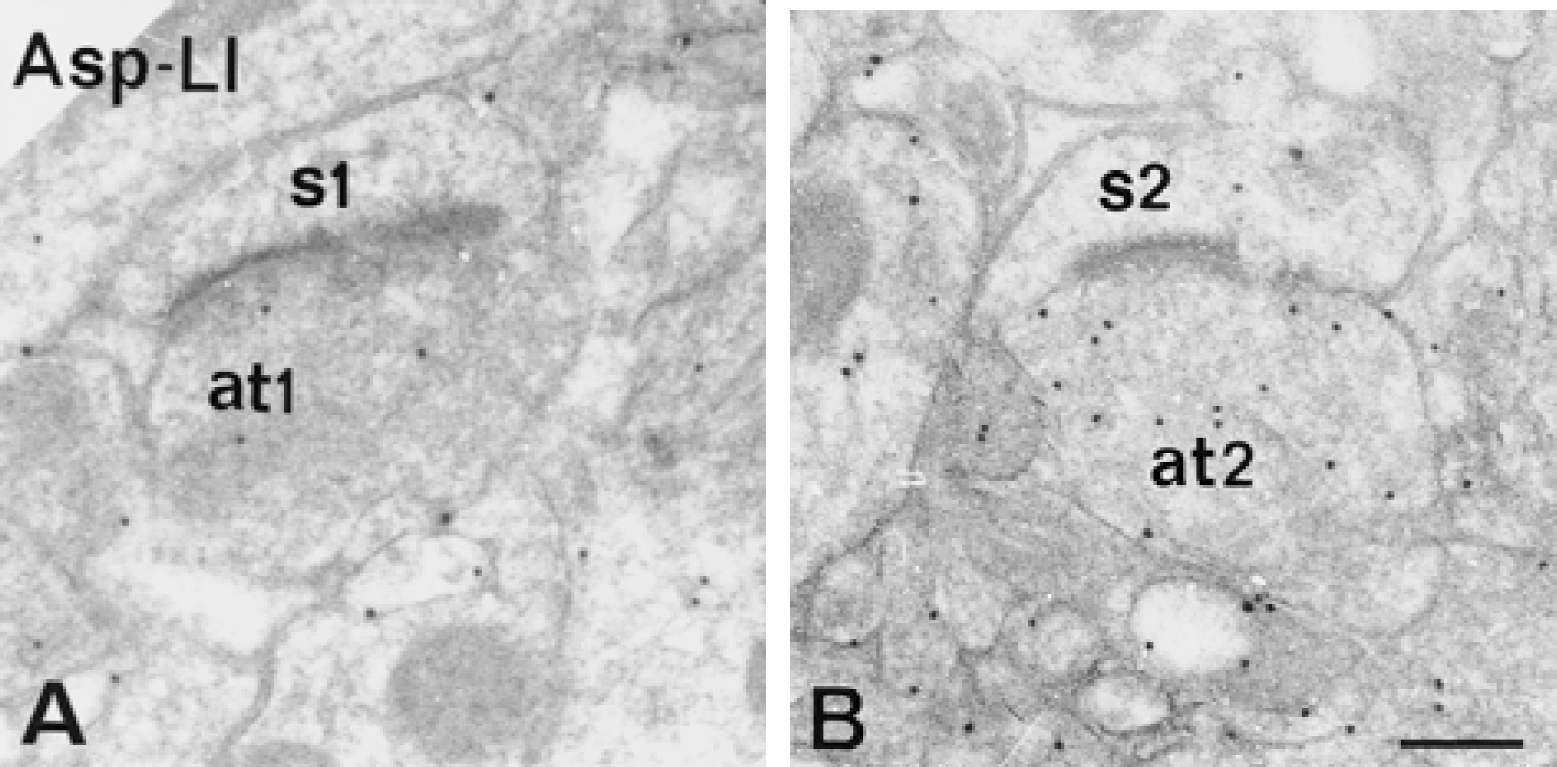
Electron micrographs of aspartatelike immunoreactivity (Asp-LI) in ultrathin sections from striatum under normoglycemic
DISCUSSION
This study showed that hypoglycemia caused a profound increase of Asp in nerve terminals compared with other tissue compartments in hippocampus and striatum. Aspartate accumulated in nerve terminals of the Schaffer collateral/commisural projection, in nerve terminals of the hilar mossy cell associational/commissural projection in the inner third of the molecular layer of fascia dentata, in nerve terminals of the mossy fibers, and in nerve terminals of the cortico-striatal projection. These are nerve terminals known to be excitatory (with asymmetric synaptic specializations) and Glu-ergic (for hippocampus, see Bramham et al., 1990, and Gundersen et al., 1998; for striatum, see Gundersen et al., 1996). In addition, there was a large Asp increase in inhibitory GABA-ergic neurons, including the dentate basket cells and their nerve endings on granule cell bodies, as well as in GABA-ergic nerve terminals on CA1 pyramidal cells. The current results from control striatum demonstrate that the nerve terminals in contact with shafts of dendrites either contained Glu or GABA (Gundersen et al., 1996). In hypoglycemia, this type of nerve terminal showed an elevated level of Asp, suggesting that the Asp augmentation in striatum, like in hippocampus, occurs in both Glu-ergic and GABA-ergic terminals. There was also a large increase of Asp in myelinated axons (in alveus of hippocampus and striatal axon bundles) presumably belonging to the above mentioned projections.
Metabolic aspects
The reason for the increase of Asp in tissue compartments short of glucose for energy production is probably production from oxaloacetate (OAA) plus the amino group of Glu by aspartate aminotransferase (Asp-AT). This enzyme is present in most tissue elements in the brain (Schmidbauer et al., 1990; Erecinska et al., 1993). Oxaloacetate accumulates in hypoglycemia because of the lack of acetyl-coenzyme A from glycolysis, driving the Asp-AT reaction towards production of Asp and 2-oxoglutarate (α-KG) from Glu and OAA. The α-KG feeds into the Krebs' cycle to produce energy and regenerate OAA. Thus, Glu is consumed as an energy substrate during hypoglycemia (Erecinska et al., 1993). This is likely to account for the authors' observation of low levels of Glu and its precursor Gln (see below) in most tissue compartments in hippocampus and striatum in hypoglycemia.
The increase in Asp was greater, whereas the decrease in Glu was less in terminals than in other dendrosomatic excitatory compartments. The reason for these distinct intracellular gradients could be that Asp and Glu are sequestered in synaptic vesicles in the terminals. The hypoglycemia increased production of Asp will drain into the vesicles leading to higher total content of Asp in terminals, whereas the vesicular Glu will be protected from use in energy production. In addition, the Glu turnover is likely to be greatest in the nerve terminals (Engelsen et al., 1986), which are the sites of exocytotic Glu release. This would drive the Asp-AT reaction towards Asp, and more so in the terminals than in the dendrosomatic compartments.
Aspartate was present in GABA-ergic neurons also under normoglycemic conditions. This is probably because Glu, which also is found in GABA containing neurons, although at low levels (the current study; Bramham et al., 1990; Gundersen et al. 1996), is converted to GABA through glutamate decarboxylate. Thus, Glu is fed into the GABA shunt and metabolized to OAA, which is transaminated to Asp through the Asp-AT reaction. During hypoglycemia Glu is further consumed as a metabolic substrate through this transamination, giving even greater Asp levels in GABA-ergic neurons.
Severe insulin-induced hypoglycemia is associated with low glucose levels and depletion of energy stores (Engelsen et al., 1986). However, the blood glucose concentrations at the time of aldehyde fixation in the current study were at a level shown to be sufficient to maintain close to physiologic ATP concentrations in the striatum (Engelsen et al., 1986). In line with this are the observations that even with the absence of glucose the ATP level in isolated nerve terminals was not reduced (Kauppinen and Nicholls, 1986) and that a reduced glucose concentration (0.2 mmol/L) did not attenuate ATP levels in hippocampal slices (Fleck et al., 1993). The current findings support the idea that the activity of processes that are dependent on the energy status of the cell is not dramatically impaired in hypoglycemic animals. Thus, ATP depletion is known to cause an increase in the glial concentration of Glu, and a decrease in that of Gln (because of inhibition of the ATP-dependent enzyme glutamine synthetase) (Torp et al., 1991), and an increase in nerve terminal levels of GABA (because of inhibition of GABA transaminase) (Torp et al., 1993). Instead the authors found low Glu levels and intermediate Gln levels in glial cells, together with unaltered GABA levels in terminals.
Furthermore, the authors demonstration of a partial maintenance of Gln levels in the terminals of excitatory neurons and in glial cells during hypoglycemia suggests that Gln is produced in glial cells and exported to nerve endings (for Glu production) in this condition.
Release of aspartate
The next question is whether Asp may be released from excitatory and inhibitory terminals during hypoglycemia. In the intact brain, the extracellular concentration of Asp, and to a lesser degree that of Glu, is increased in hippocampus (Sandberg et al., 1986) and striatum (Butcher et al., 1987) when blood glucose is low. Also in hippocampal slices there is an increased overflow of Asp and to a lesser extent Glu evoked by K+-induced membrane depolarization during hypoglycemia. This extracellular increase in Asp and Glu is Ca2+-dependent (Szerb and O'Regan, 1987; Fleck et al., 1993), suggesting that during a metabolically compromised condition like hypoglycemia, the overflow of Asp and Glu is because of exocytotic release from the nerve endings. In line with this, the authors have recently presented immunocytochemical evidence for Asp localization in synaptic vesicles in excitatory terminals in the hypoglycemic and normoglycemic hippocampus and for release of Asp by exocytosis from these terminals in normoglycemic hippocampal slices (Gundersen et al., 1998). Here the authors presented data suggesting that Asp is associated with synaptic vesicles in inhibitory terminals as well. This finding is supported by the demonstration that a high concentration of L-Asp (10 mmol/L) significantly, and with the same magnitude as the GABA analogue nipecotate, inhibited GABA uptake in isolated synaptic vesicles from rat cerebral cortex (Christensen et al., 1991). Nipecotate has been shown to inhibit the vesicular GABA transporter VGAT also at high concentrations (greater than 10 mmol/L), even if the inhibition was weaker than that observed for GABA itself (McIntire et al., 1997). Although the localization of Asp in synaptic vesicles is controversial (Nicholls and Attwell, 1990), it is tempting to speculate that during hypoglycemia, in which there are high levels of Asp in the terminals, Asp may be sequestered into synaptic vesicles and released by exocytosis, not only together with Glu from excitatory nerve terminals, but also together with GABA from inhibitory nerve terminals.
However, the current data do not exclude the possibility that, during hypoglycemia, Asp is released from excitatory terminals by reversed action of the Glu transporter shown to be localized on these terminals (Gundersen et al., 1993, 1996). During profound energy depletion the release of Glu is thought to be mediated by reversal of Glu transporters (Rossi et al., 2000). However, Sanchez-Prieto and Gonzalez (1988) showed that Ca2+-independent mechanisms for release of glutamate from isolated nerve terminals start to occur only when the ATP/adenosine diphosphate (ADP) ratio drops to less than 4, and only at a ratio less than 1.7 does the Ca2+-independent release exceed the Ca2+-dependent release. In isolated nerve terminals incubated in the absence of glucose, the ATP/ADP ratio was still greater than 4 (Kaupinnen and Nicholls, 1986). According to Engelsen et al. (1986), the blood glucose concentrations in the current hypoglycemic animals correspond to an ATP/ADP ratio of approximately 10, at which reversal of Glu transporters should not occur.
Role of released aspartate
Because the ratio between energy demand and energy supply is increased in hypoglycemia, it may mimic a condition with high synaptic activity in the normal brain. Regardless of the release mechanism, what could be the role of Asp released from nerve endings during such conditions? Aspartate seems to selectively activate the N-methyl-
Could such an Asp-induced NMDA receptor response be involved in hypoglycemic neuronal death? Neurons susceptible to hypoglycemia comprise dentate granule cells, pyramidal cells in CA1 of hippocampus, and striatal neurons (Auer et al., 1984).
During hypoglycemia, the excitatory and inhibitory nerve terminals contacting these neurons are enriched with Asp, which may be released to activate NMDA receptors on synaptic and extrasynaptic sites. This would cause an excitotoxic insult, leading to neuronal death (Wieloch, 1985). In line with this is the recent demonstration in hippocampal neurons that excitotoxicity was not only caused by activation of NMDA receptors at the postsynaptic density but also by activation of NMDA receptors at extrasynaptic sites (Sattler et al., 2000).
Footnotes
Acknowledgments
The authors thank Dr. Bjørnar Hassel for fruitful discussions of the manuscript and Anne Skotte, Anna Torbjørg Bore, Kari Ruud, Carina Ingebrigtsen, and Gunnar Lothe for technical assistance.