
Abstract
The endothelial surface layer (glycocalyx) of cerebral capillaries may increase resistance to blood flow. This hypothesis was investigated in mice by intravenous administration of heparinase (2500 IU/kg body weight in saline), which cleaves proteoglycan junctions of the glycocalyx. Morphology was investigated by transmission electron microscopy. Cerebral perfusion velocity was recorded before and during heparinase or saline treatment using laser–Doppler flowmetry. In addition, cerebral blood flow (CBF) was measured 10 minutes after heparinase or saline treatment using the iodo[14C]antipyrine method. Laser–Doppler flowmetry and CBF measurements were performed during normocapnia and severe hypercapnia (Pco2: 120 mm Hg). After heparinase, morphology showed a reduced thickness of the glycocalyx in cortical microvessels by 43% (P < 0.05) compared with saline-treated controls. Under normocapnic conditions, a 15% (P < 0.05) transient increase of cerebral flow velocity occurred 2.5 to 5 minutes after heparinase injection. Laser–Doppler flow and CBF returned to control values ten minutes after the injection. However, during severe hypercapnia, heparinase treatment resulted in a persisting increase in laser–Doppler flow (6%, P < 0.05) and CBF (30%, P < 0.05). These observations indicate the existence of a flow resistance in cerebral capillaries exerted by the glycocalyx. The transient nature of the CBF increase during normocapnia may be explained by a vascular compensation that is exhausted during severe hypercapnia.
The glycocalyx is the surface coating of the vascular endothelium. It appears to modify vascular functions such as endothelial permeability to water and solutes (Turner et al., 1983; Michel et al., 1985; Adamson and Clough, 1992) and leukocyte adhesion and emigration (Ley et al., 1991). In addition, the glycocalyx may influence the blood flow in living vessels. The existence of a layer of surface coating of approximately 0.4 to 0.5 μm (Vink and Duling, 1996) in the vessels may result in a higher vascular resistance particularly in capillaries because their effective vessel diameter is considerably reduced by the glycocalyx. However, it has been difficult to determine the effective inner diameter of capillaries. As a translucent layer, the glycocalyx cannot be recognized with conventional intravital microscopy and is also not stained by conventional histologic staining methods. Indirect evidence for the existence of an endothelial layer that increases the resistance to blood flow in capillaries comes from a comparison of in vivo and in vitro measurements. In vivo, the resistance to blood flow in capillaries of microvascular networks of the rat mesentery is about twice that measured in vitro in narrow glass tubes (Pries et al., 1994). In line with this finding are further in vivo studies in mesenterial vessels of rats. Flow resistance decreased by 14% to 21% after local microinfusion of heparinase. This effect was most likely caused by an enzymatic reduction of the thickness of the glycocalyx by heparinase (Pries et al., 1997).
The current study sought to test whether cerebral blood flow (CBF) can be increased by a reduction of the thickness of the glycocalyx. Thus, heparinase, which cleaves proteoheparan sulphate junctions of the proteoglycans of the glycocalyx, was injected intravenously (IV) into mice. Using transmission electron microscopy, the reduction of the glycocalyx because of this procedure was verified. Visualization of the glycocalyx was achieved by adding lanthanum nitrate to the perfusion solution (Bozzola and Russel, 1992). Dynamic (laser–Doppler flowmetry) and steady-state (iodo[14C]antipyrine method) changes of the cerebral perfusion induced by IV treatment with either heparinase or saline were investigated. These experiments were conducted during normocapnia and severe hypercapnia to elucidate the role of potential compensatory vascular adjustments.
MATERIALS AND METHODS
The experiments were performed in Balb-C mice in accordance with institutional guidelines. The animals were anesthetized by a gas mixture containing 70% N2O, and 30% O2 of which 1% to 1.5% had been replaced by halothane. Body temperature was maintained at 37°C using a temperature-controlled heating pad. The mice were equipped with catheters inside the right femoral artery and vein to enable the infusion of iodo[14C]antipyrine (Biotrend, Cologne, Germany) for the measurement of the local CBF, injection of a heparinase I solution (Sigma, Deisenhofen, Germany), measurement of the arterial input function of iodo[14C]antipyrine, and measurement of blood acid base status. After surgery, the anesthesia was changed to IV etomidate (Etomodat Lipuro®) at a dosage of 0.025 mg/kg body weight/min. The animals then were divided into eight experimental groups.
Electron microscopy
In groups 1 and 2, the thickness of the glycocalyx was measured 10 minutes after a 30-second injection of either 0.3 mL saline (group 1) or 0.3 mL saline containing 2500 IU/kg body weight of heparinase (group 2). To this end the animals were perfused through the abdominal aorta with saline containing 25 IU heparin/mL followed by a solution containing 4% glutaraldehyde, 0.5% paraformaldehyde, and 1% lanthanum nitrate. Lanthanum is a trivalent cation and binds to negatively charged glycoprotein moieties (Bozzola and Russel, 1992). After embedding the brain tissue in epon resin and contrast enhancing on 120-nm sections with 5% uranylacetate in distilled water for 20 minutes and a solution containing 80 mmol/L lead-citrate, 120 mmol/L sodium-citrate, and 160 mmol/L sodium for 2 minutes, the glycocalyx was photographed using a transmission electron microscope (EM 90; Zeiss, Oberkochen, Germany). Black and white images of approximately 100 capillaries, chosen from the parietal cortices obtained from 3 brains of group 1 and 2 each, were analyzed using an image analyzing system (MCID; Imaging Research, St. Catherine's, Ontario, Canada). Capillaries were recognized by their single-layered wall structure. Three luminal membrane segments (at least 150 nm distance from each other) of the endothelial cells of each capillary were selected in which the membrane double layer was clearly visible because only such segments could be considered to be cut perpendicular to the cell surface with an error of not more than ±6° (Bozzola and Russel, 1992). Then the optical density was measured along a line perpendicular to the membrane starting at the capillary lumen and continuing through the whole glycocalyx and the membrane double layer. The thickness of the glycocalyx was then defined as the distance between the point at the luminal side at which 50% of the maximal optical density of the glycocalyx was measured and the translucent center of the cytoplasmic membrane (Fig. 1).
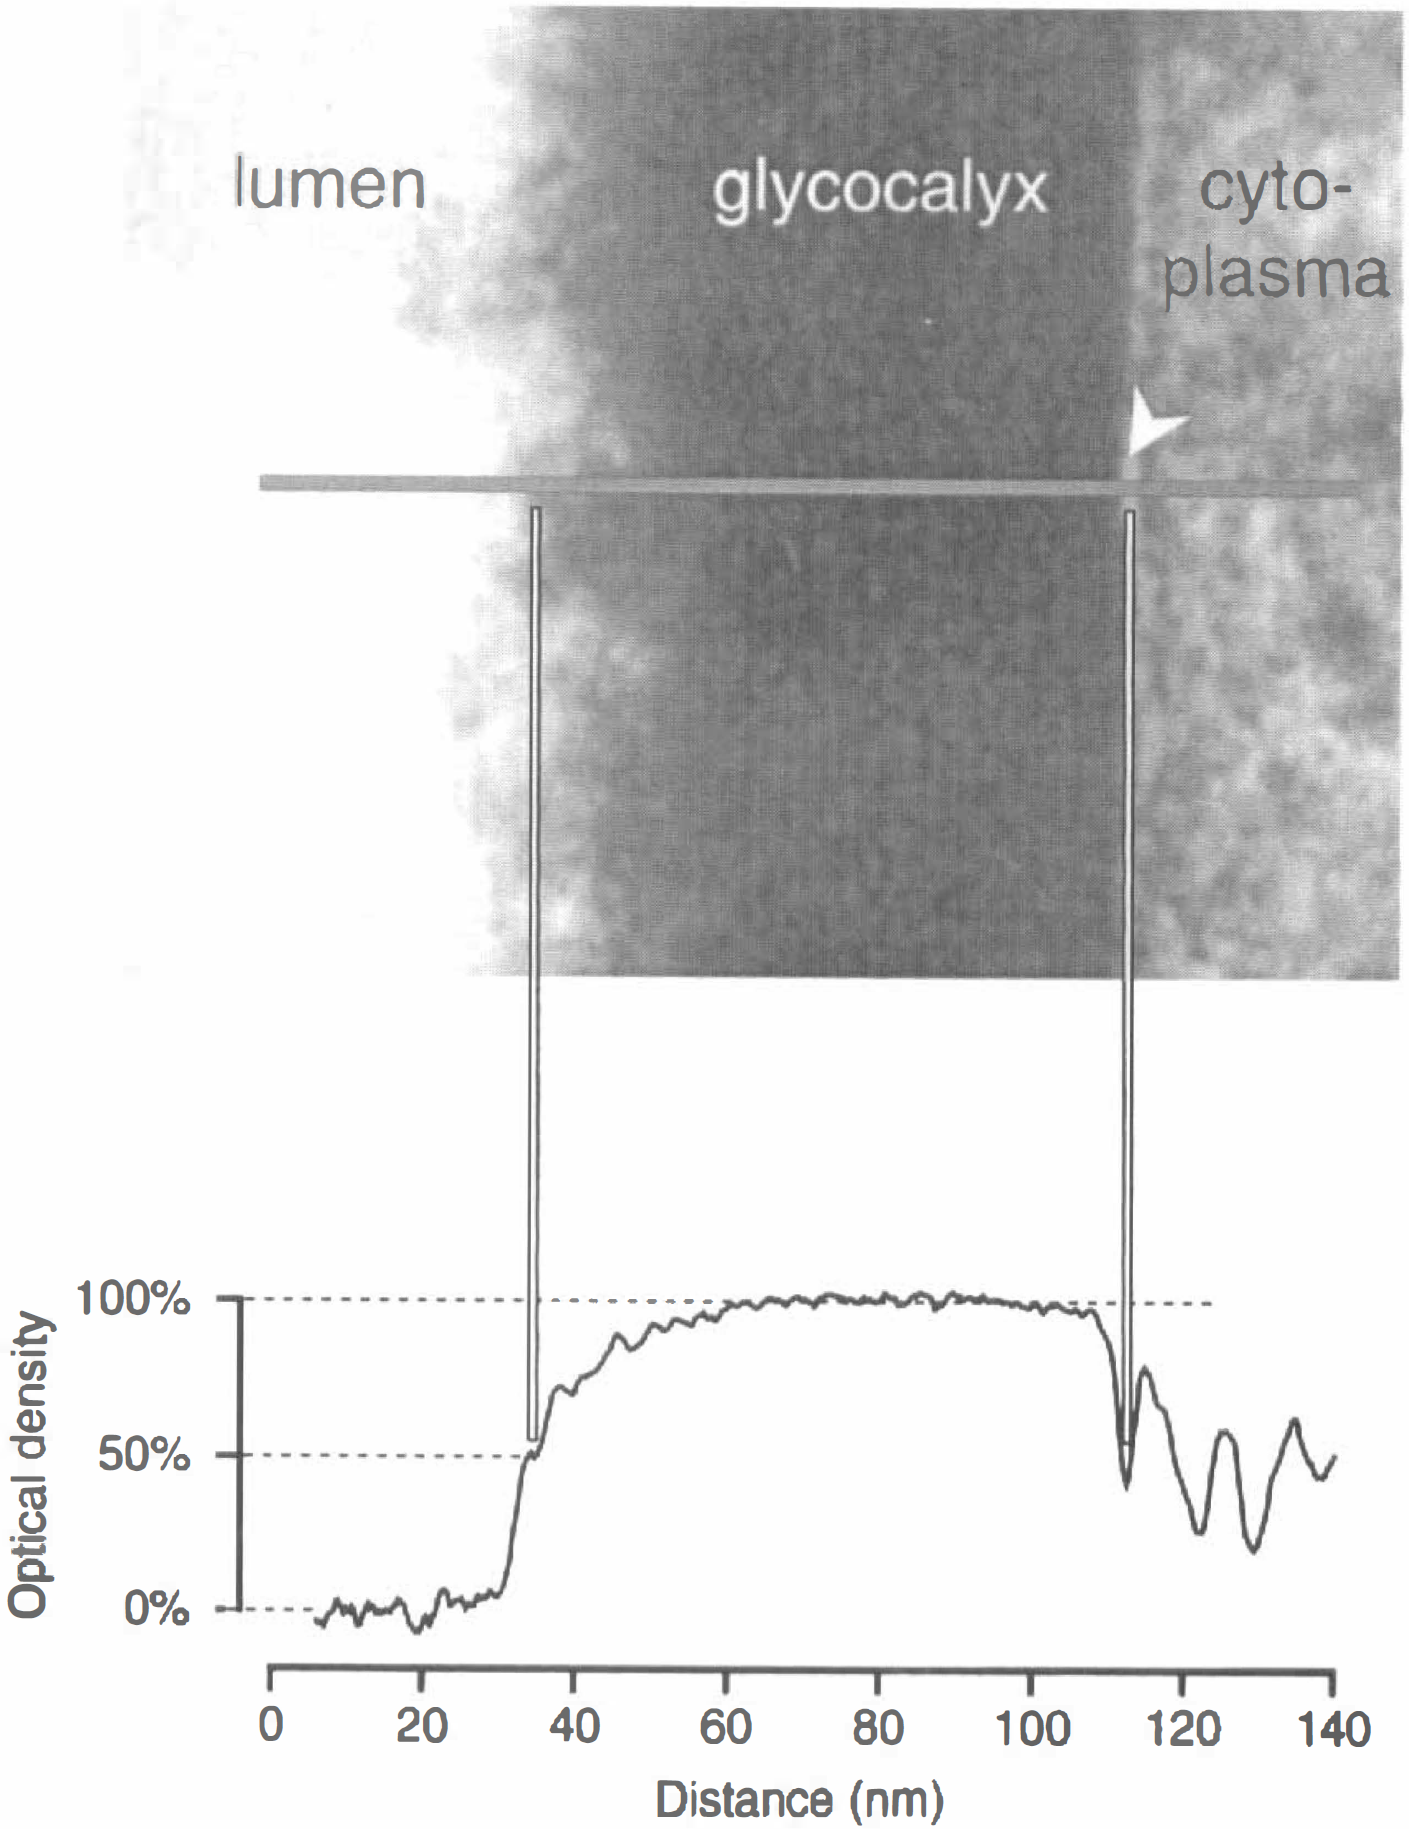
Measurement of the thickness of the glycocalyx. The luminal borderline of the glycocalyx was defined as the point on the horizontal line perpendicular to the cytoplasmic membrane
Laser–Doppler flowmetry
Groups 3 and 4 were used for continuous recording of cerebral flow velocity using laser–Doppler flowmetry (Perimed, Stockholm, Sweden) under normocapnic conditions (group 3) and during severe hypercapnia adjusted to a Paco2 of 120 mm Hg (group 4). This extreme value of Pco2 was chosen because in preliminary experiments at lower sates of hypercapnia only transient effects of heparinase injection could be observed with the laser–Doppler technique. In addition to the above described surgery, a monofil laser–Doppler probe was fixed at the right parietal bone using cyanoacrylate glue (Super Attak®; Loktite, Munich, Germany). Continuous recording of the flow signal was started 5 minutes before the IV injection of 0.3 mL saline to verify the effect of saline on the flow signal. The signal was recorded for an additional 15 minutes after injection of heparinase. The arterial acid base status was measured frequently during the whole observation period.
Determination of cerebral blood flow
In groups 5 to 8, CBF was measured 10 minutes after IV injection of either 0.3 mL saline (groups 5 and 7) or 0.3 mL saline containing heparinase (groups 6 and 8) during normocapnia (groups 5 and 6) or severe hypercapnia of 120 mm Hg (groups 7 and 8), according to the autoradiographic method of Sakurada et al. (1978) and the modifications of Jay et al. (1988). To this end, 125μCi/kg body weight iodo[14C] antipyrine (Biotrend, Cologne, Germany) dissolved in 250 μL saline were infused with an increasing infusion rate for 1 minute. Parallel to this, 12 to 16 timed arterial blood samples were taken for the determination of the time course of the arterial iodo[14C]antipyrine concentration. At the end of the infusion period, the animals were decapitated and the brains were removed as quickly as possible and frozen in 2-methylbutane chilled to −60°C. The brains then were embedded in M-1 embedding matrix (Lipshaw, Detroit, Michigan, U.S.A.) and cut into 20-μm coronal sections at −20°C in a cryomicrotome. After drying on a heating plate at +60°C, the sections were exposed together with a [14C] standard set on a MinR1 x-ray film (Kodak, Stuttart, Germany) for 21 days. From the optical densities of the autoradiograms the local CBF was calculated using the above mentioned image analyzing system.
Data analysis
Measurements of the thickness of the glycocalyx of heparinase-treated mice were compared with those of saline-treated mice to evaluate the degree of reduction in glycocalyx thickness by heparinase. Cerebral blood flow values determined autoradiographically in 22 different brain structures of heparinase-and saline-treated mice were compared. A two-tailed Student's t-test for unpaired samples with Bonferroni correction was used for these comparisons. Laser–Doppler flow velocities measured before the injection of saline or heparinase, respectively, were set to 100%. Flow velocities measured 2.5, 5, 7, 10, and 15 minutes after saline injection during normocapnia and heparinase injection during normocapnia and hypercapnia were compared with the initial value using a two-tailed Student's t-test for paired samples. The level of statistical significance was set at P < 0.05.
RESULTS
Table 1 shows the physiologic variables measured in groups 3 to 8 before injection of saline or heparinase respectively. With the exception of hematocrit, all parameters between the normocapnic and hypercapnic groups were different. However, no differences could be found between the saline-and heparinase-treated groups during normocapnia and during hypercapnia.
Physiologic variables in controls (HEP-) and heparinase-treated (HEP+) mice during normocapnia and during hypercapnia
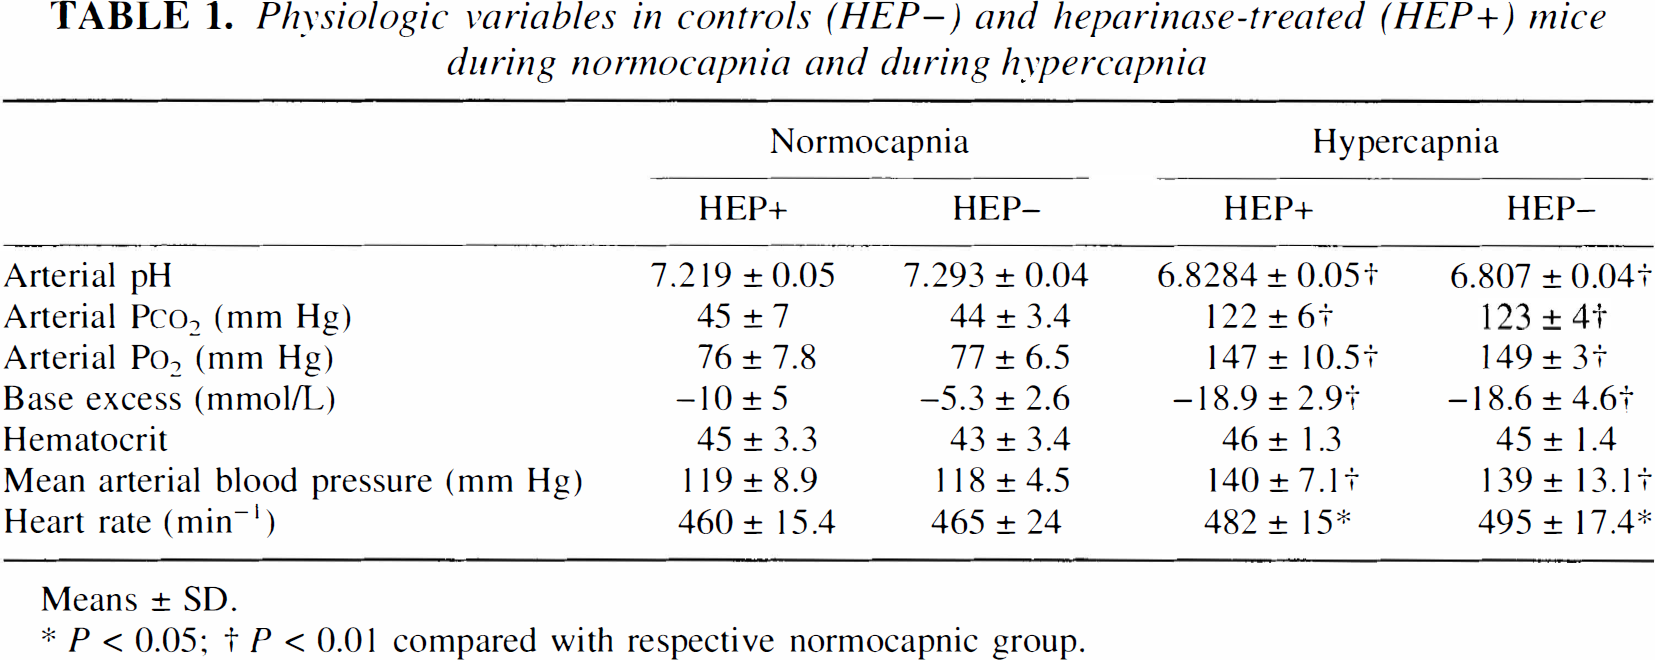
Means ± SD.
P < 0.05
P < 0.01 compared with respective normocapnic group.
Fig. 1 shows that the use of clearly defined optical densities as criterion for the definition of the luminal and abluminal side of the glycocalyx layer ensures reliable measurements of the glycocalyx thickness.
Fig. 2 shows the results of the electron microscopic determination of the thickness of the glycocalyx. Examples of the electron microscopic appearance of the glycocalyx after systemic treatment with either saline or heparinase are given in the upper part of the figure. The thickness of the glycocalyx was clearly reduced after heparinase treatment. The results of densitometric analysis are shown in the lower part of Fig. 2. In heparinase-treated mice, the thickness of the glycocalyx was found to be approximately 57% of saline-treated mice.
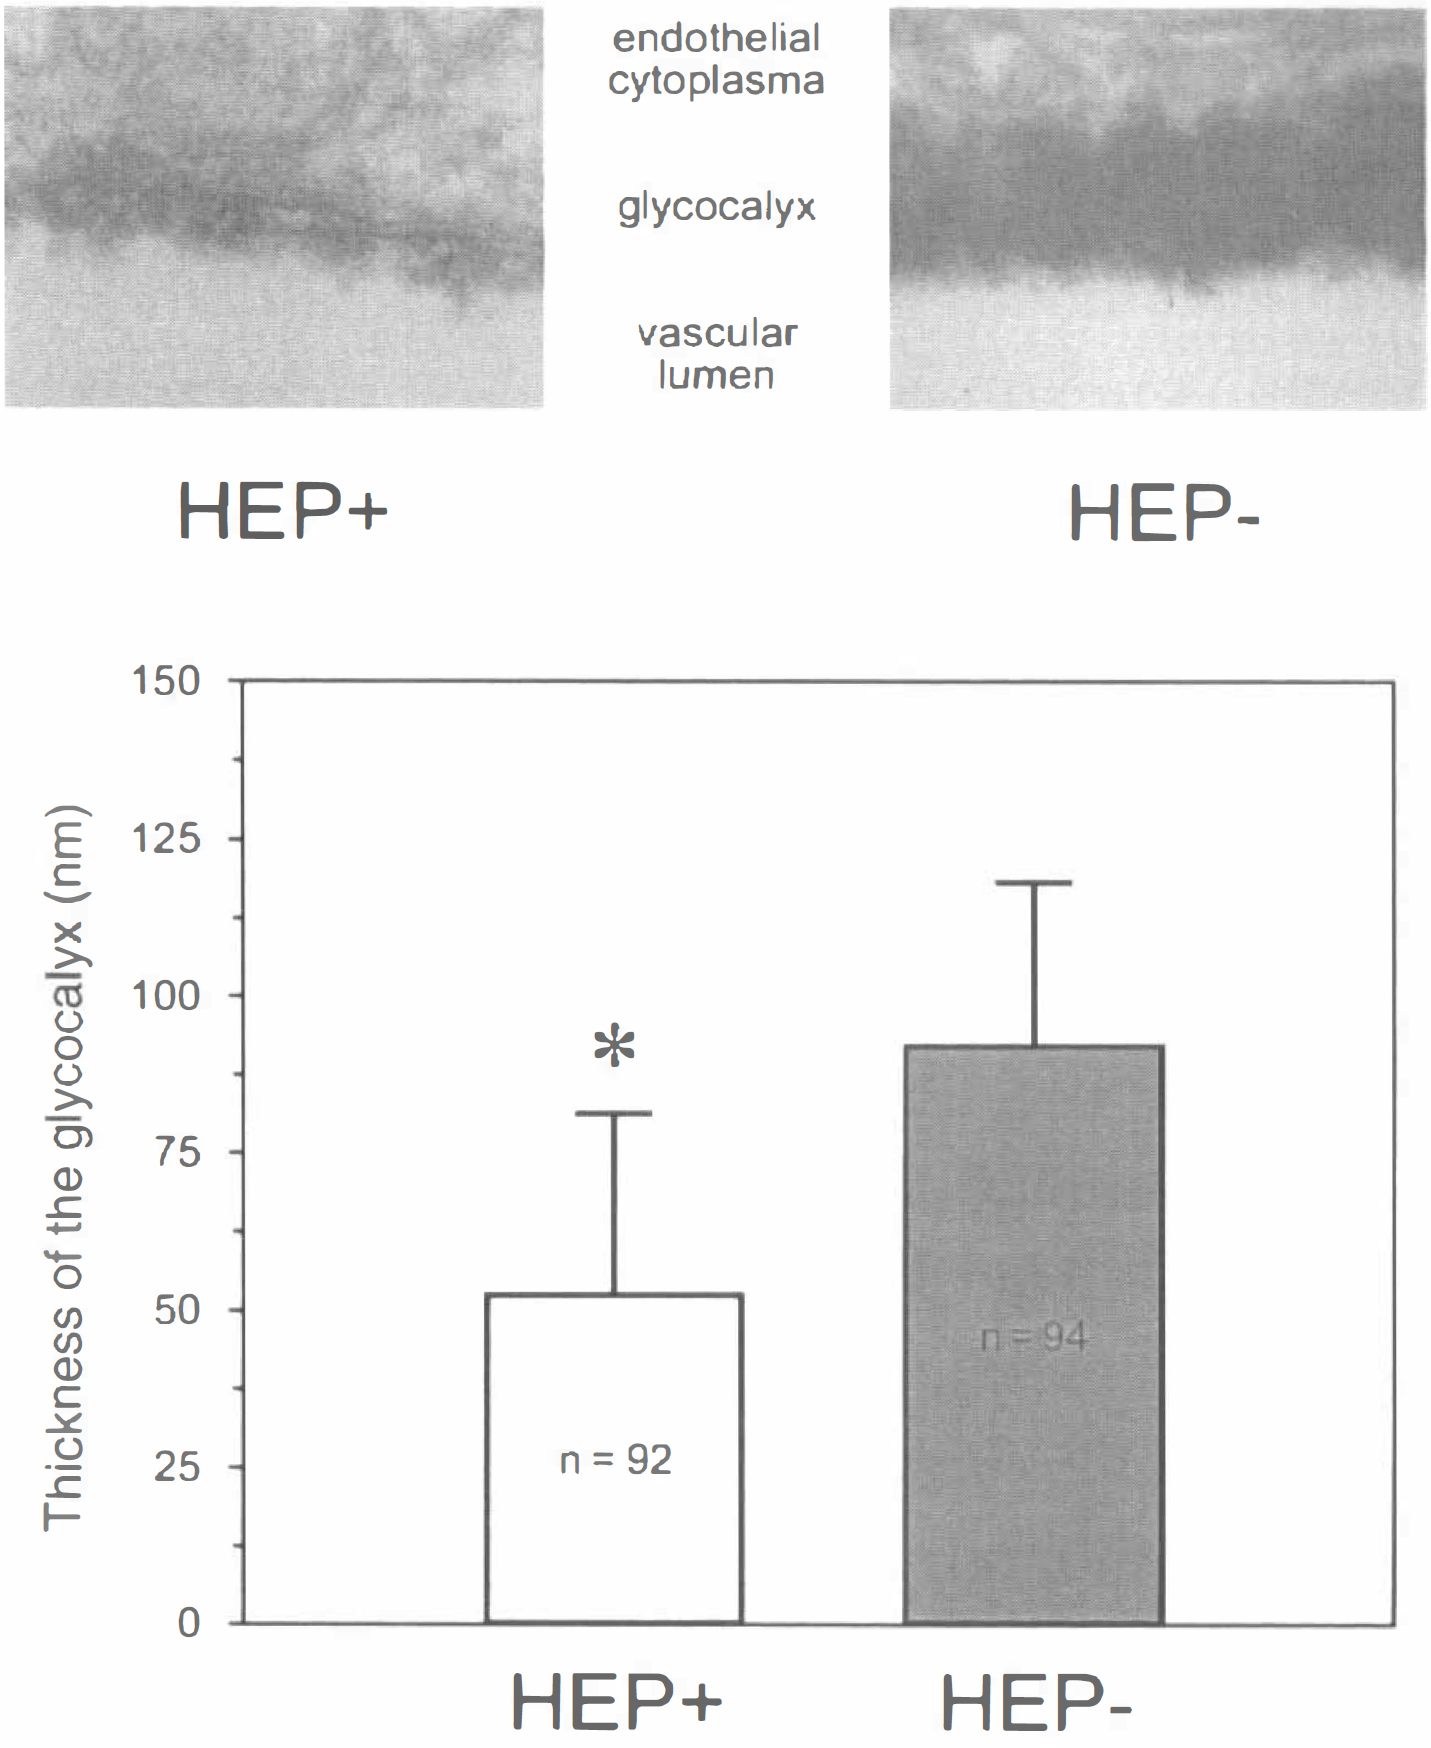
Reduction of the thickness of the glycocalyx by heparinase.
The results obtained with the laser–Doppler technique are shown in Fig. 3; the upper panel shows the changes of the perfusion signal during normocapnia. Injection of saline did not influence the laser–Doppler signal. The flow velocity significantly increased up to 15% during the first 2.5 to 5 minutes after IV injection of heparinase. Thereafter, the perfusion returned to its initial values. The lower panel of Fig. 3 shows the results of the laser–Doppler flowmetry during severe hypercapnia. During hypercapnia, the injection of saline did not affect the cerebral perfusion. In contrast, after the injection of heparinase, cerebral perfusion increased significantly by 6% to 7% during the first 2.5 minutes and remained elevated for 10 minutes. To exclude an influence of the Paco2 or the blood pressure on the flow signal, these parameters were frequently recorded after administration of saline and heparinase. The Paco2 and all other parameters of the acid base status, as well as blood pressure and heart rate, remained unchanged during the whole observation period.
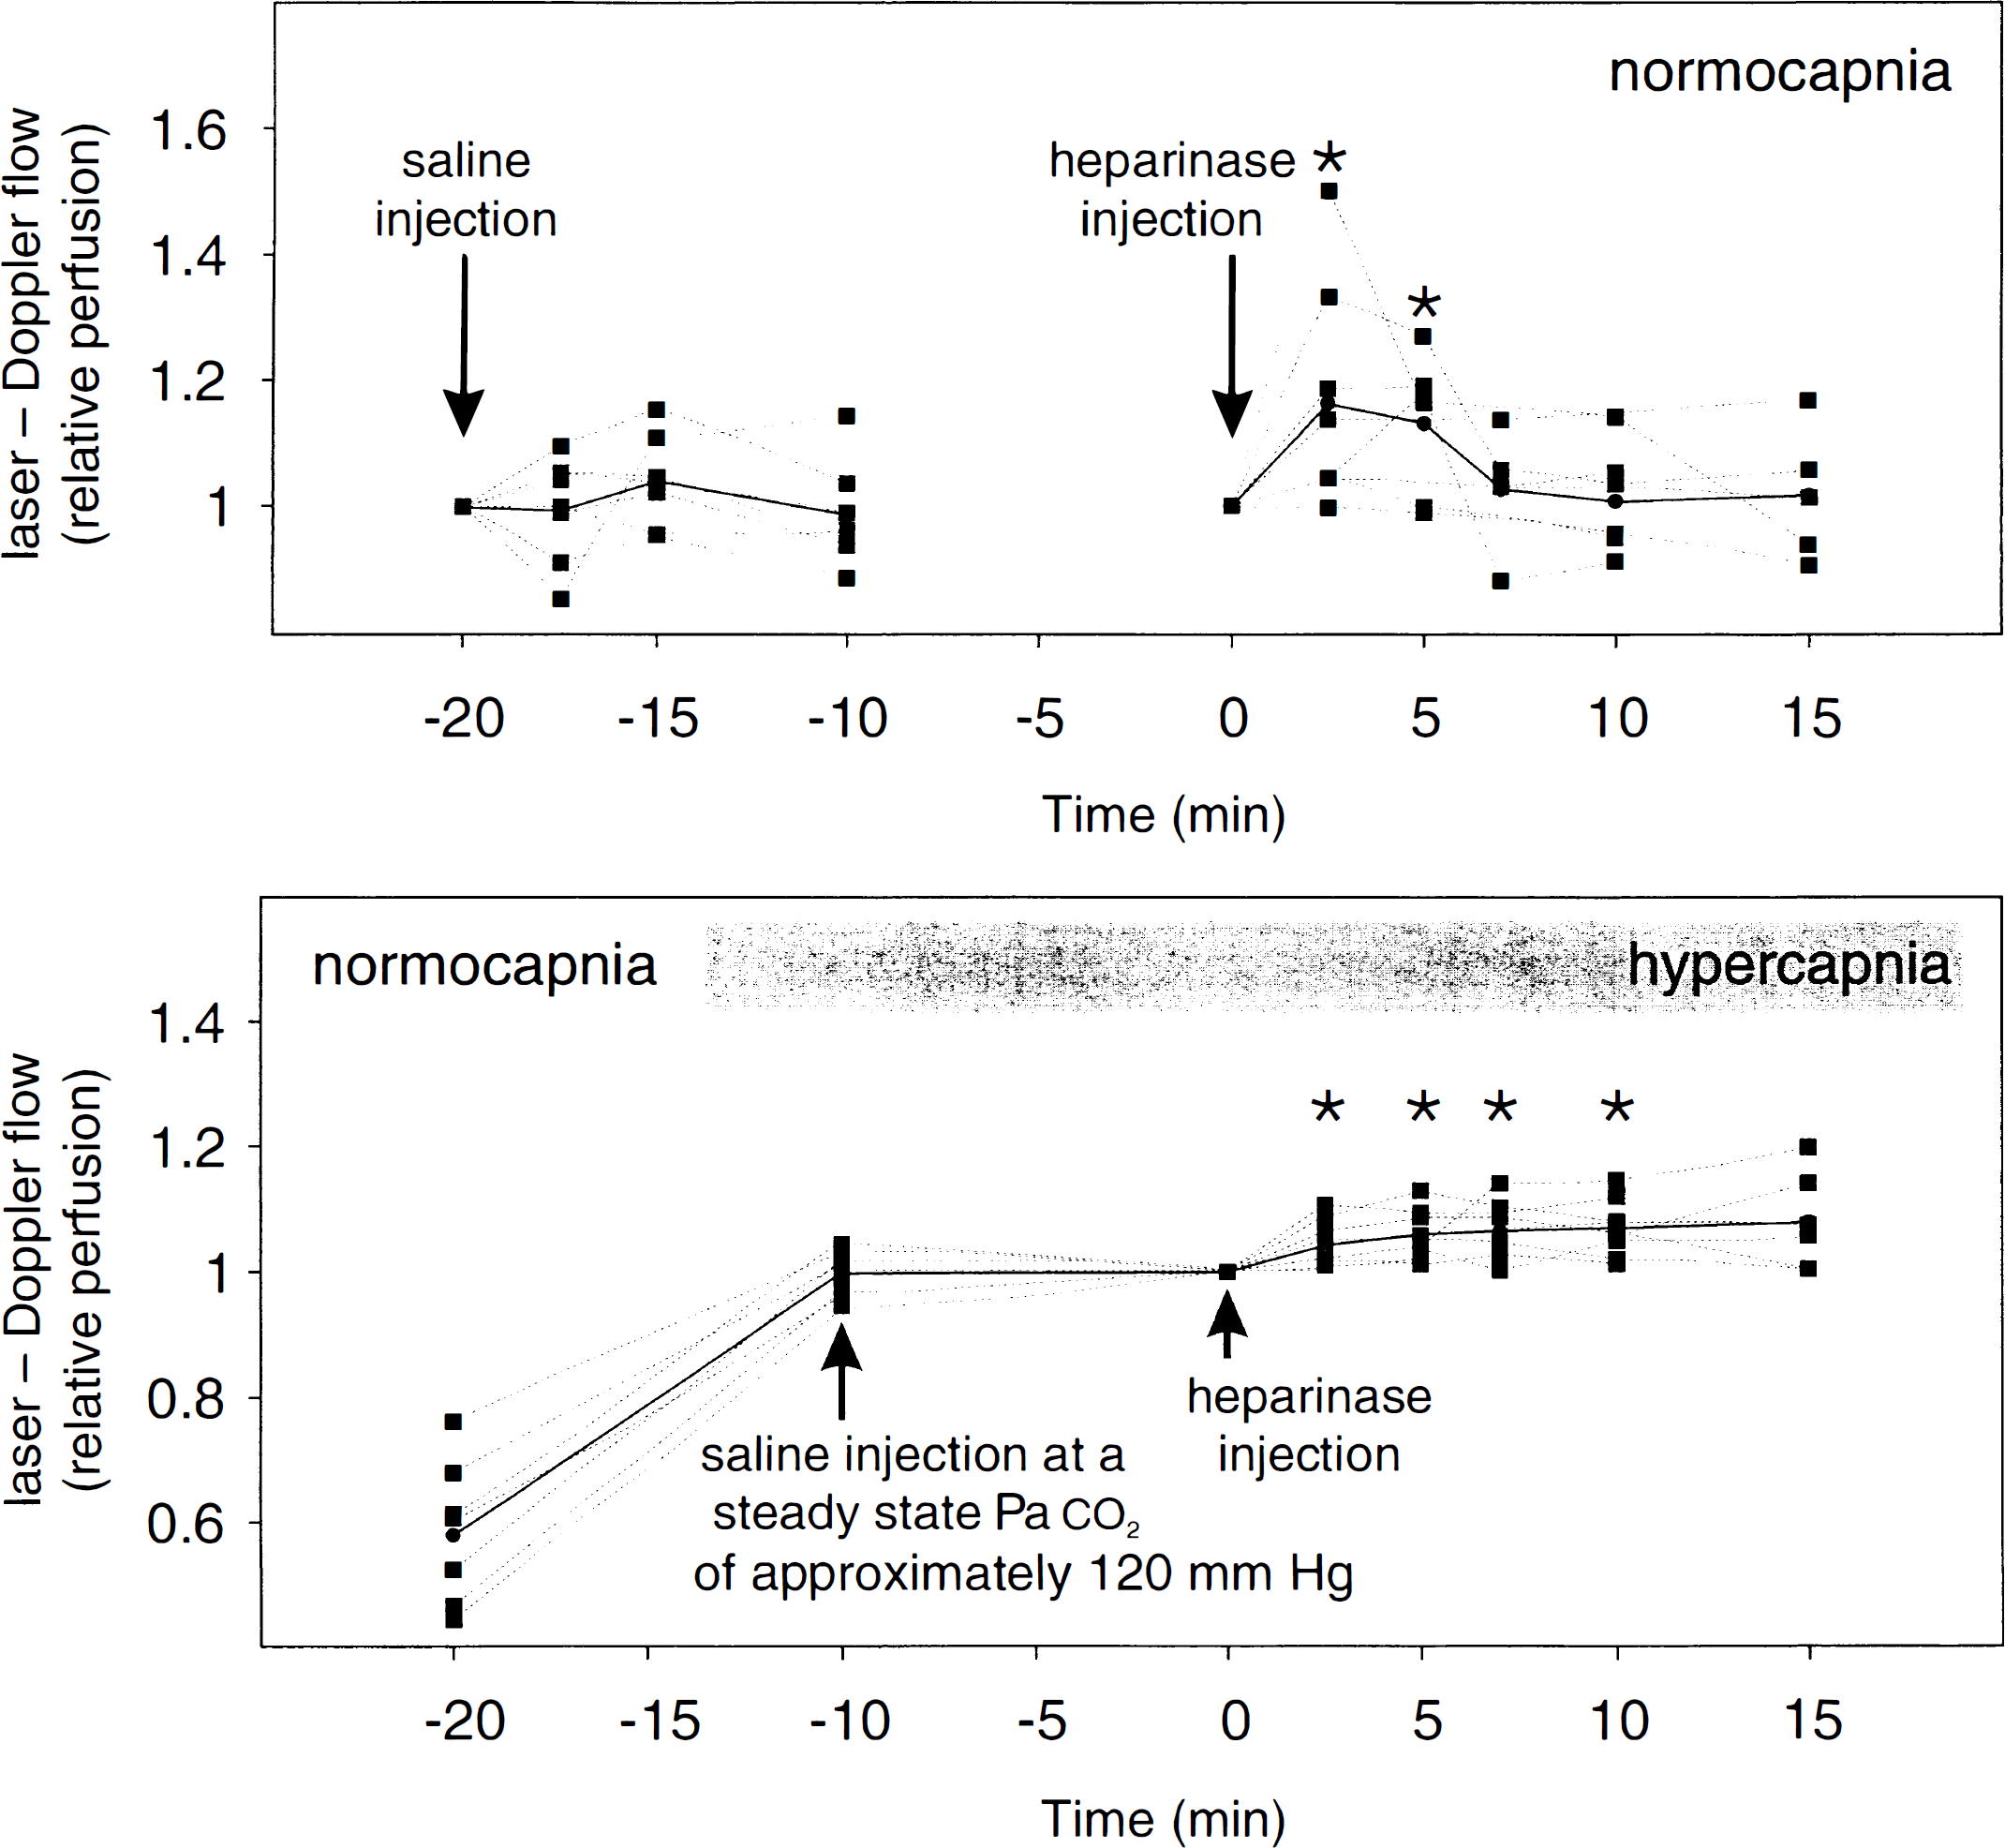
Laser–Doppler flows during normocapnia and hypercapnia. (top) Laser–Doppler flowmetry during normocapnia. Flow velocity (relative perfusion units normalized to the initial values = injection of saline or heparinase) was not significantly influenced by the saline injection (at −20 minutes). After heparinase injection (at 0 minutes), flow velocity (normalized to the initial value) increased by 15% for 2.5 to 5 minutes. The Paco2 remained constant during the whole observation period (Table 1), indicating that the measured laser–Doppler flow signals are not because of changes in arterial acid base status. (bottom) Laser–Doppler flowmetry during normocapnia and severe hypercapnia. Hypercapnia of 120 mm Hg increased the flow signal by 73% (increase between −20 and −10 minutes). Saline injection (at −10 minutes) had no influence on the flow signal. In contrast, 2.5 minutes after heparinase injection (at 0 minutes) flow velocity (relative perfusion units normalized to the initial value) increased approximately 6% and remained thereafter elevated up to the tenth minute. Arterial blood pressure and Paco2 remained constant during the whole observation period (Table 1). Gray dots represent the mean values at each time point (* P < 0.05 compared with initial value = heparinase injection).
Cerebral blood flow was measured using the autoradiographic iodo[14C]antipyrine method during normocapnia and hypercapnia. The results obtained 10 minutes after systemic administration of saline or heparinase are shown in Fig. 4. Twenty-two brain structures were selected for the comparison between saline and heparinase treatment. The upper panel of Fig. 3 summarizes the results obtained during normocapnia. No differences in CBF were found between heparinase-and saline-treated mice. The lower part of Fig. 3 shows the results obtained during severe hypercapnia (Paco2 of 120 mm Hg). In contrast to normocapnic conditions, CBF was significantly greater during hypercapnia in most of the 22 brain structures of heparinase-treated mice.
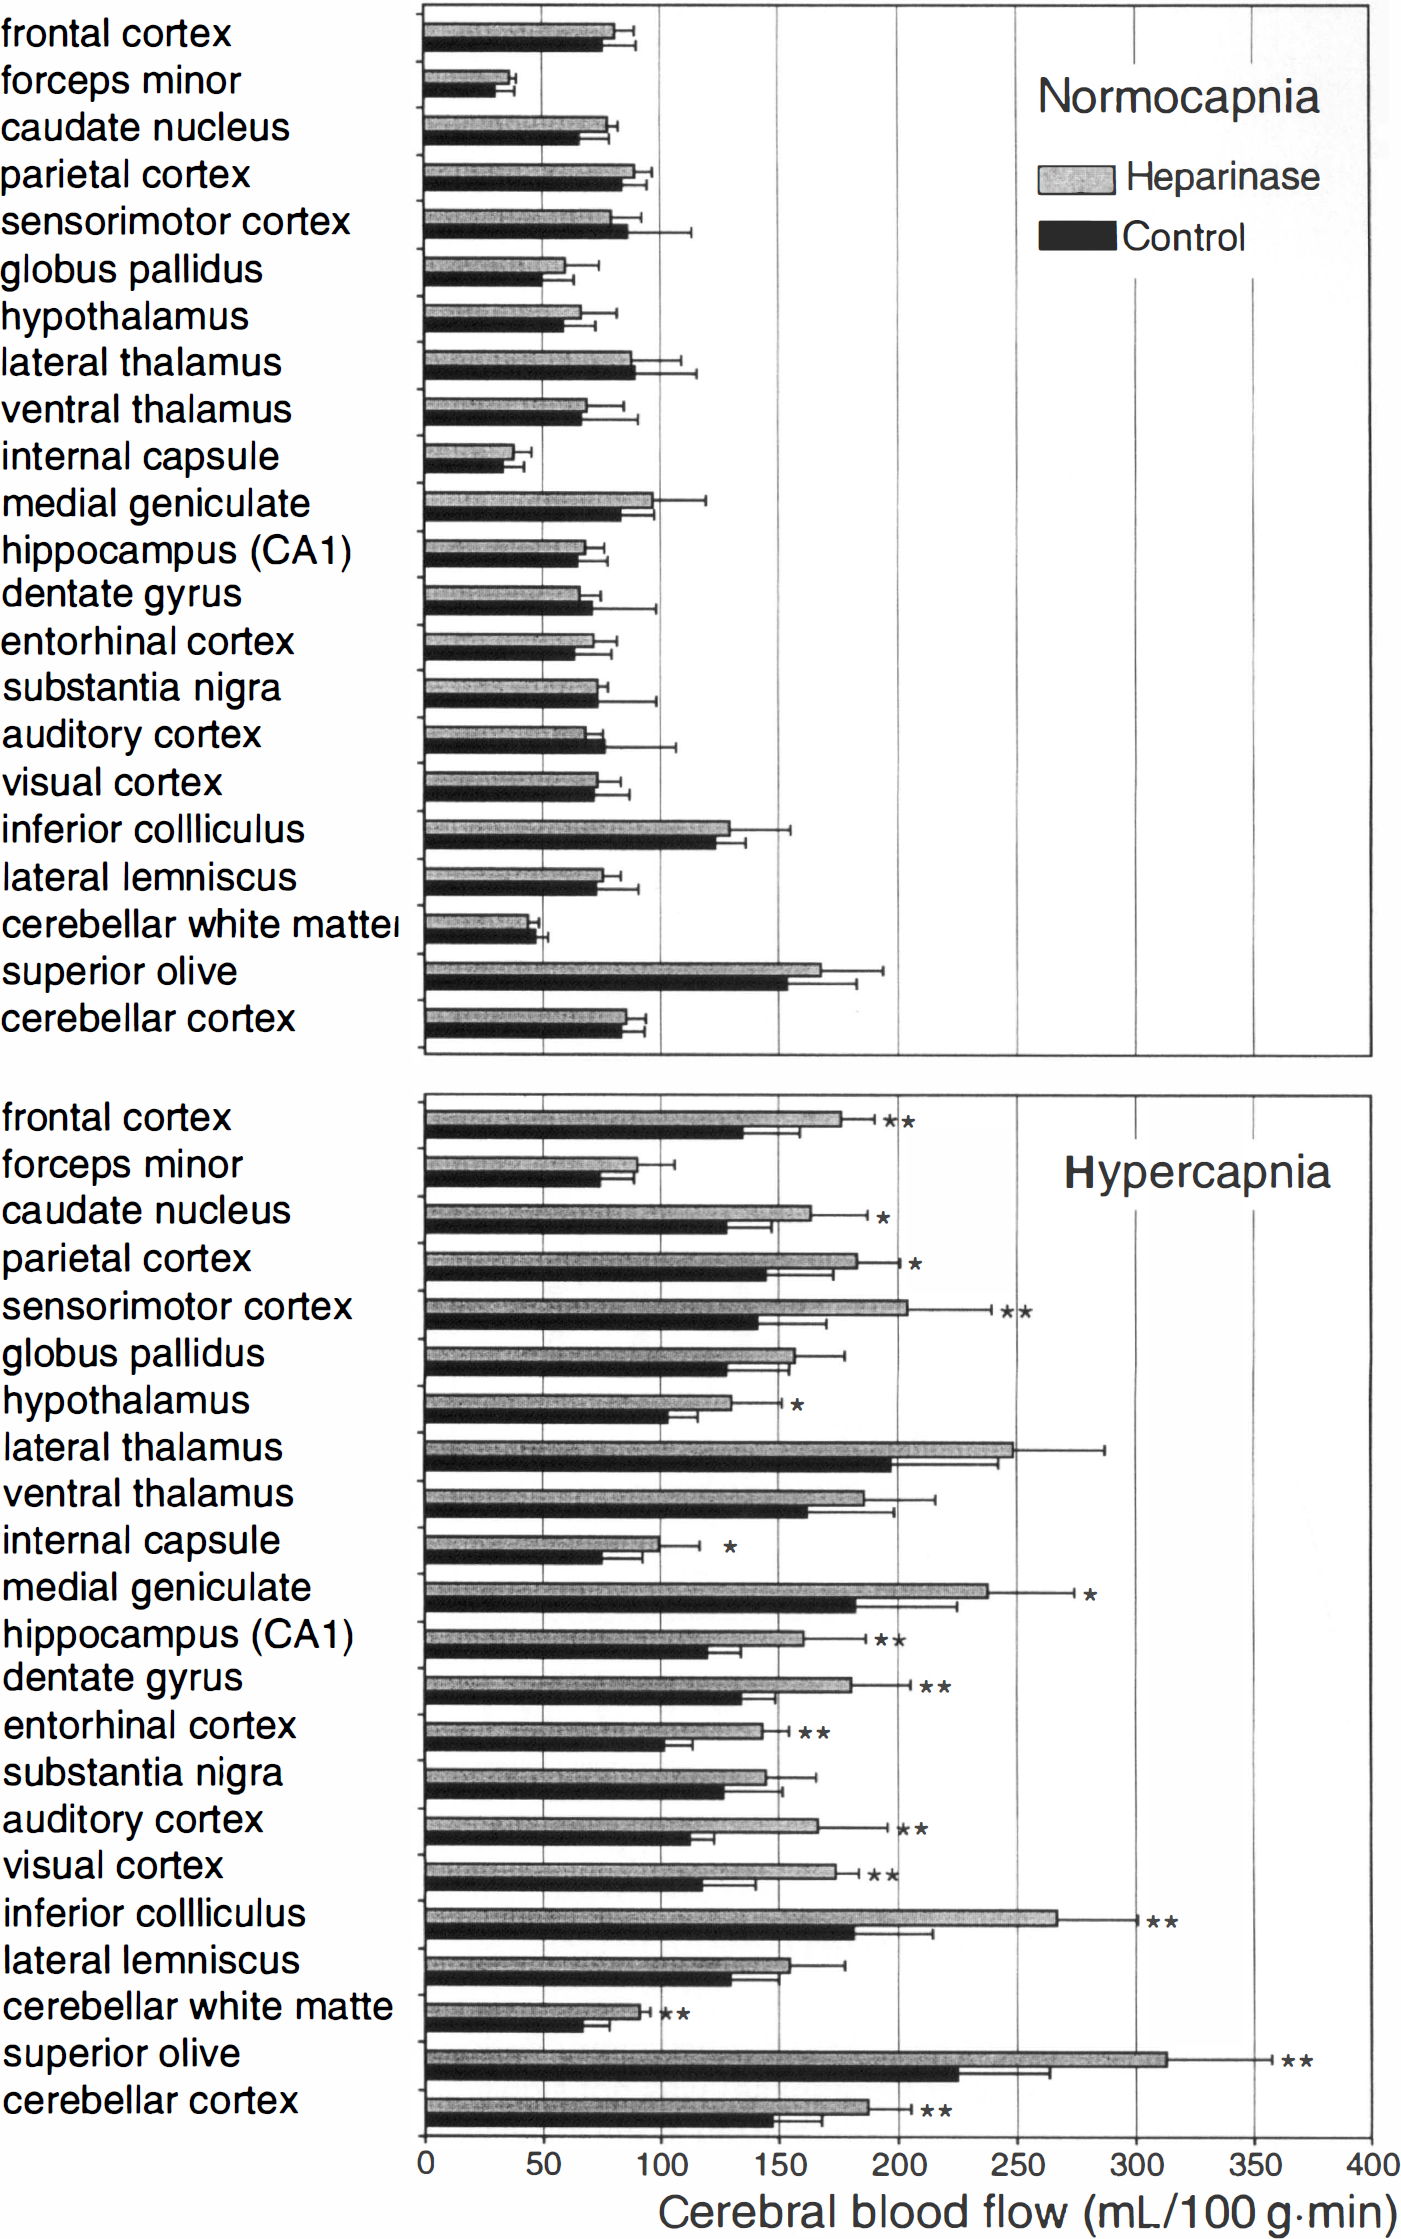
Cerebral blood flow (CBF) measured by autoradiography during normocapnia and hypercapnia. (top) Cerebral blood flow measured in 22 different brain structures of mice 10 minutes after heparinase (gray) or saline (black) injection during normocapnia. Although in most brain structures the CBF was slightly higher in HEP+ mice than in HEP− mice, these differences were not significant. (bottom) Cerebral blood flow measured in 22 different brain structures of mice 10 minutes after heparinase (gray) or saline (black) injection during hypercapnia. In contrast to normocapnic conditions, the CBF was significantly higher in most of the 22 brain structures investigated. The arterial blood pressure and the heart rate did not differ between the saline-and the heparinase-treated groups (Table 1). Means ± SD (* P < 0.05; ** P < 0.01 compared with saline treatment).
DISCUSSION
The current study shows a reduced thickness of the glycocalyx in cerebral capillaries after heparinase infusion. Laser–Doppler blood flow velocity is transiently increased for 2.5 to 5 minutes and returns to control values 10 minutes after heparinase injection. In contrast, during severe hypercapnia, cerebral flow velocity remains elevated for at least 10 minutes after heparinase injection. Cerebral blood flow determined by autoradiography shows comparable values. These data indicate the existence of a flow resistance in cerebral capillaries exerted by the glycocalyx which is decreased for a few minutes after heparinase treatment. The rapid restoration of the blood flow thereafter indicates vascular compensatory mechanisms. This interpretation is supported by the finding that during severe hypercapnia, in which these compensatory vascular adjustments might be exhausted, heparinase treatment causes an additional and longer lasting increase of CBF.
A critical point with regard to determinations of the thickness of the glycocalyx is the methodology used. Plasma proteins may normally be deposited into the glycocalyx resulting in water influx and swelling of the glycocalyx (Wiederhielm and Black, 1976; Pries et al., 1997). The binding of plasma proteins and water to the glycocalyx is rather loose (Adamson and Clough, 1992) so that bound proteins can be squeezed out at increased shear rates (Pries et al., 1997) and washed out at lowered concentrations of plasma proteins (Reinhart et al., 1993). This might be followed by temporal variations in the thickness of the glycocalyx. In vivo measurements using intravital microscopy and fluorescent plasma markers have suggested a thickness of the endothelial surface coating of approximately 0.4 to 0.5 μm (Vink and Duling, 1996). In contrast, perfusion fixation has yielded values that are an order of magnitude smaller. In perfusion-fixed rabbits, a thickness of 45 nm has been determined in coronary arteries and of 81 nm in carotid arteries (Haldenby et al., 1994). The results of the current study obtained from cortical brain capillaries in perfusion-fixed mice (90 nm) are in agreement with these data obtained from rabbits. The large discrepancy between the in vivo measurements and those obtained from perfusion-fixed material might be because of a shrinking of the glycocalyx during preperfusion with protein free saline that induces a partial washout of proteins deposited inside the glycocalyx during perfusion fixation. For the current findings, the absolute thickness of the glycocalyx was less relevant because the main interest was to verify whether systemic administration of heparinase induced a reduction of the thickness of the glycocalyx and whether such a reduction had an influence on cerebral blood flow. In the current study, the thickness of the glycocalyx was reduced by 43% after injection of heparinase as could be shown by electron microscopy.
It could be argued that the transient changes of perfusion after IV administration of heparinase during normocapnia and the increased CBF induced by heparinase treatment in the hypercapnic group could be caused by mechanisms other than a reduction of the thickness of the glycocalyx. One potential influence could be exerted on the smooth muscle tone by a direct action of heparinase. Although such an influence cannot be excluded, no indication exists of such an influence of heparinase on smooth muscle cells. Another influence could arise from changes in the Paco2 (Reivich, 1964). In the current experiments, no changes in the Paco2 occurred after heparinase injection that excluded effects of Pco2 on flow velocity or on CBF during heparinase injection. Changes of circulatory parameters can also be excluded as a cause of the transient (normocapnia) and permanent (hypercapnia) increase in CBF because mean arterial blood pressure and heart rate did not differ between the saline and the heparinase-treated groups (Table 1).
During severe hypercapnia, the average CBF of all 22 investigated brain structures was approximately 30% greater early after heparinase compared with saline treatment. Using Poiseuille's law it can be estimated whether this increase in CBF is primarily because of the reduction of the glycocalyx layer. Vink and Duling (1996) showed that the thickness of the glycocalyx layer is approximately 0.4 to 0.5 μm. The average diameter of rat brain capillaries is 5 to 7 μm (Duelli and Kuschinsky, 1993; Abounader et al., 1995). These data and the reduction of the glycocalyx thickness by 43%, which was measured in the current study, can be used to calculate the hypothetic flow difference between saline-and heparinase-treated mice using Poiseuille's law. These calculations predict a flow difference between both groups ranging from 23% to 34%, which is in good agreement with the measured CBF increase of 30% after systemic heparinase treatment during severe hypercapnia.
The question arises which mechanisms might mediate the maintenance of CBF under normocapnic conditions after the flow resistance of the vasculature has been reduced by heparinase. These mechanisms are not known. The most likely explanation is based on the finding that CBF critically depends on the oxygen content of the blood supplying the brain (Brown et al., 1985). Experiments in which blood viscosity was decreased by hemodilution (Paulson et al., 1973; Hudak et al., 1986; Hartmann et al., 1989) and increased by addition of fluid of high viscosity (Waschke et al., 1994) have shown that the main factor that determines CBF under these conditions is the maintenance of oxygen delivery to the brain. The resistance of cerebral vessels is adjusted in such a way that CBF allows an adequate oxygen delivery. The current results are in accordance with this hypothesis. When the thickness of the endothelial glycocalyx layer is reduced by heparinase, the flow resistance of the cerebral vasculature is decreased. As a direct consequence, the oxygen supply of the brain tissue is increased beyond the actual oxygen demand. Compensatory vasoconstriction then allows for restoration of the oxygen delivery to normal values. It appears that such compensatory adjustments of CBF that restore oxygen delivery after heparinase injection occur over a wide range of CBF values. Preliminary laser–Doppler measurements have shown that the increase of the flow velocity after heparinase injection is still transient at Pco2 levels of approximately 100 mm Hg. The ability of the cerebral vessels to vasoconstrict appear to be overridden by the extreme tissue acidosis and its strong dilating influence only at Pco2 values of 120 mm Hg. As a result, compensatory vasoconstriction cannot take place under these conditions and oxygen delivery and CBF remain increased after heparinase injection.
The current study shows that systemic administration of heparinase results in a marked reduction of the thickness of the endothelial glycocalyx in cerebral microvessels. This reduction is paralleled by a transient increase in cerebral perfusion indicating that the glycocalyx contributes significantly to cerebral flow resistance during normocapnia. The transient nature of this effect may be explained by compensatory vascular adjustments. This interpretation is supported by the finding that in a situation in which vascular compensations are exhausted, such as severe hypercapnia, the cleavage of the vascular glycocalyx causes an additional and long lasting increase of CBF.