
Abstract
In the current study, the temporal and regional changes of the transcription factor cyclic adenosine monophosphate response element binding protein (CREB) were investigated in rat brains subjected to 30 minutes of hypoglycemic coma followed by varied periods of recovery using Western blot and confocal microscopy. The total amount of CREB was not altered in any area examined after coma. The level of the phosphorylated form of CREB decreased during coma but rebounded after recovery. In the relatively resistant areas, such as the inner layers of the neocortex and the inner and outer blades of the dentate gyrus (DG), phospho-CREB increased greater than the control level after 30 minutes of recovery and continued to increase up to 3 hours of recovery. In contrast, little or no increase of phospho-CREB was observed during the recovery period in the outer layers of the neocortex and at the tip of the DG, that is, regions that are selectively vulnerable to hypoglycemic insults. The current findings suggest that a neuroprotective signaling pathway may be more activated in the resistant regions than in the vulnerable ones after hypoglycemic coma.
Severe insulin-induced hypoglycemia causes selective neuronal damage to certain brain regions—such as the outer layers of the cortex, the striatum, the medial CA1 region, and the crest of the dentate gyrus (DG;Auer and Siesjö, 1993). The unique differential damage between the superficial and deeper cortical layers has been long noticed in hypoglycemia. Previous work has shown that 30 minutes of isoelectricity rarely causes neuronal death in layers 4 to 6, and that even 60 minutes of cerebral isoelectricity gives rise to only occasional damaged neurons in cortical layers 4 to 6 in some animals (Auer et al., 1984a, 1984b). In contrast, the cerebral cortex has been shown to sustain superficial damage in hypoglycemia (Auer et al., 1985a; Banker, 1967; Kalimo and Olsson, 1980). It was not clear until now why only the superficial cortical laminae show irreversible neuronal pathology after an identical hypoglycemic insult has been delivered to the superficial and deeper cortical laminae.
The differential activation of an internal death process in vulnerable neurons has been proposed as a mechanism to explain the selective death of neurons. However, it is equally likely that specific neuronal populations contain an intrinsic survival mechanism (Walton and Dragunow, 2000). Research in this cell survival focus on identifying the key mediators in the survival cascade and largely concentrate on endogenous neuroprotective messengers, such as neurotrophic factors and various cytokines (Mattson, 1997). Recently, several studies implied the transcription factor, cyclic adenosine monophosphate response element binding protein (CREB), is not only in the signaling pathway activated by these molecules, but also is a possible regulator of a general survival program in neurons. Phosphorylation of CREB at a single residue, Ser133, by cyclic adenosine monophosphate dependent protein kinase, calcium-and calmodulin-dependent protein kinase IV, or mitogen-activated protein kinase is critical for transcription activation. In a transient forebrain ischemia animal model, CREB is strongly and persistently phosphorylated mainly in resistant regions, such as the dentate gyrus, but to a lesser extent in selectively vulnerable regions such as the CA1 sector of hippocampus (Hu et al., 1999). In another focal cerebral ischemia model, CREB expression and its phosphorylation was significantly activated in the penumbra but not in the infarct area (Tanaka et al., 1999). The objective of the current study was to determine the temporal and regional changes of phosphorylation of CREB after 30 minutes of hypoglycemic coma using Western blot and confocal microscopy.
MATERIALS AND METHODS
Experimental model
Male Wistar rats (Simonsen Laboratory, Gilroy, CA, U.S.A.) weighing 280 to 350 g were used throughout. Rats were fasted the night before the experiments, with free access to tap water. Hypoglycemic coma was induced with the methods described by Auer et al. (1984a). One hour before the operation, the animals were injected intraperitoneally with insulin (2 IU/kg; Eli Lilly and Company, Indianapolis, IN, U.S.A.). The rats were anesthetized with 3% halothane and were intubated and artificially ventilated with 1.5% halothane in N2O:O2 (70:30) during surgery. A tail artery catheter was inserted for blood sampling and monitoring of mean arterial blood pressure, and a tail vein was cannulated for glucose infusion. A central venous catheter was inserted through the right external jugular vein for rapid exsanguination and reinfusion of blood for blood pressure control. Scalp electrodes were used for single channel electroencephalographic monitoring. Body temperature was maintained at approximately 37°C by a combination of a homeothermic blanket control unit and lamp heating. After the above procedures for monitoring physiologic parameters, the halothane was reduced and maintained at 0.8% to 1.0% during the entire experiment.
When the rats went into hypoglycemic coma, as indicated by the onset of cerebral isoelectricity with a flat electroencephalogram, a timer was started. Blood pressure was maintained during hypoglycemic coma at ≈140 mm Hg through reinfusion of the blood. At the end of 30 minutes of electroencephalographic isoelectricity, recovery was induced by an intravenous infusion of 50% glucose (0.2 mL) by hand over 1 minute, followed by continuous infusion at 1 to 1.5 mL/h for 30 minutes. The control group of rats was treated similarly to those subjected to hypoglycemic coma, but animals were killed immediately after administration of insulin. In the hypoglycemic coma group, rats were killed at the end of 30 minutes hypoglycemic coma. In the recovery groups, rats were restored to normoglycemia after 30 minutes of coma by glucose infusion, and brains were sampled or perfusion-fixed at the end of the different recovery times. All animal treatment followed the guidelines of the National Institutes of Health (Guide for the Care and Use of Laboratory Animals) and were approved by the local Ethical Committee. All efforts were made to minimize animal suffering and to minimize the number of animals used.
Histologic procedure
At different periods of recovery, the rats were perfused with 4% phosphate-buffered formaldehyde solution at pH 7.4. The perfusion was continued for approximately 20 minutes allowing fixation in situ, and was then submerged in 4% phosphate-buffered formaldehyde solution for 24 hours before being transferred to 70% ethanol until dissection.
Brains were sectioned coronally into 2.8-mm-thick slices and processed in graded ethanol and xylol. After embedding the slices in paraffin and subserial sectioning at 5 μm, staining was performed with Celestine blue and 1% acid fuchsin. Numbers of damaged and intact neurons were assessed at the level of bregma −3.80 mm for neocortex and hippocampus, and bregma 0.48 mm for caudoputamen.
Preparation of subcellular fractions
Tissue samples for biochemical studies were obtained by freezing (Ponten et al., 1973) the brains in situ with liquid nitrogen while respiration was maintained with a respirator. Outer and inner layers of cortex were dissected out into a glove box at a temperature less than −17°C. Preparation of subcellular fractions was performed at 4°C. Brain tissues were homogenized using an homogenizer (15 strokes) in 10 volume of homogenization buffer containing 15 mmol/L Tris base/HCl pH 7.6, 1 mmol/L DTT, 0.25 mol/L sucrose, 1 mmol/L MgCl2, 1.25 μg/mL pepstatin A, 10 μg/mL leupeptin, 2.5 μg/mL aproptonin, 0.5 mmol/L PMSF, 2 mmol/L EDTA, 1 mmol/L EGTA, 0.1 mol/L Na3VO4, 50 mmol/L NaF, and 2 mmol/L sodium pyrophosphate. The homogenates were then centrifuged at 1000×g at 4°C for 10 minutes. The pellets were discarded and the supernatants were centrifuged at 17,000×g at 4°C for 20 minutes to achieve the cytosolic fraction in the supernatant and the crude mitochondrial fraction in the pellets. The protein concentration was determined by using a Lowry DC kit (Bio-Rad, Hercules, CA, U.S.A.) with bovine serum albumin as a concentration standard.
Western blot analysis
Western blot analysis was performed on 8% sodium dodecyl sulphate-polyacrylamide gel electrophoresis according to the method of Hu et al. (1999). One sample containing 50 μg of protein of cytosolic fraction was applied to each lane in a slab gel of sodium dodecyl sulphate-polyacrylamide gel electrophoresis. After electrophoresis, proteins were transferred to an immobilon-P membrane (Millipore, Bedford, MA, U.S.A.). The membrane was incubated overnight at 4°C with primary antibodies against CREB and phospho-CREB (New England Biolab, Beverly, MA, U.S.A.), each at a dilution of 1:1000. The membranes were then incubated with horseradish-peroxidase conjugated secondary antibodies for 45 minutes at room temperature. The blots were developed using the ECL detection method (Amersham, Piscataway, NJ, U.S.A.). Four animals in each experimental group were used to analyze the levels of each protein by Western blot. Each protein band on the Westerns was derived from one animal.
Laser-scanning confocal microscopy
For immunostaining, the brains were perfused with ice-cold 4% phosphate buffered paraformaldehyde while the animal's respiration was maintained with the respirator. The brains were sectioned with a Leica vibratome (Deerfield, IL, U.S.A.) at a thickness of 50 μm. Double-labeled fluorescence immunocytochemistry was performed on the coronal brain sections from sham-operated controls and animals subjected to 30 minutes of hypoglycemic coma followed by different periods of recovery. Rabbit polyclonal antibodies against CREB and phospho-CREB were obtained from the New England Biolabs. The antibody against total CREB does not distinguish between phosphorylated and unphosphorylated forms, whereas the antibody against the phosphorylated form (referred to as phospho-CREB) recognizes only the phosphorylation of CREB at a single residue, Ser 133, according to the manufacturer's specifications. A mouse monoclonal antibody against microtubule-associated protein 2 (MAP-2) was obtained from Sigma (St. Louis, MO, U.S.A.). The brain sections were washed twice in phosphate-buffered salin (PBS) for 5 minutes at room temperature (RT) and then in PBS containing 0.2% Triton X100 (TX100) for 30 minutes. Nonspecific binding sites were blocked in 3% bovine serum albumin (BSA) in PBS/0.2% TX100 for 30 minutes. The primary antibodies were diluted 1:500 in PBS/0.1% TX100 and 1% BSA. After incubation (overnight at 4°C) in the polyclonal primary antibodies, the sections were washed in PBS containing 0.1% TX100, 3 × 10 minutes at RT. The sections were then incubated for 2 hours at 4°C with the monoclonal antibody against MAP-2, diluted 1:500 in PBS/0.1% TX100 and 1% BSA, followed by washes 3 × 10 minutes at RT. The fluorescent secondary antibodies, fluorescein-labeled anti-rabbit and lissamine rhodamine-labeled anti-mouse, were diluted 1:300 each in PBS containing 0.1% TX100 and 1% BSA and applied for 1 hour at RT. Sections were washed several times in PBS/0.1% TX100, mounted on glass slides, and coverslipped using Gelvatol. The slides were analyzed on a BioRad MRC 1024 laser-scanning confocal microscope.
RESULTS
Table 1 shows the physiologic parameters before depolarization, after hypoglycemic coma, and after 30 minutes of recovery. There were no significant differences among groups except that glucose concentrations were in the ranges expected for hypoglycemic and postinsult animals. The animals were initially inactive and lethargic but regained a seemingly normal behavior after 2 to 4 hours of recovery. Under normal operational conditions, 100% of the animals survive all of the surgical procedures.
Physiologic parameters measured before coma, 10 minutes after coma, and 15 minutes after recovery of glucose in animal groups of control, 30 minutes hypoglycemia coma, and 30 minutes, 3 hours, and 6 hours of recovery after the coma
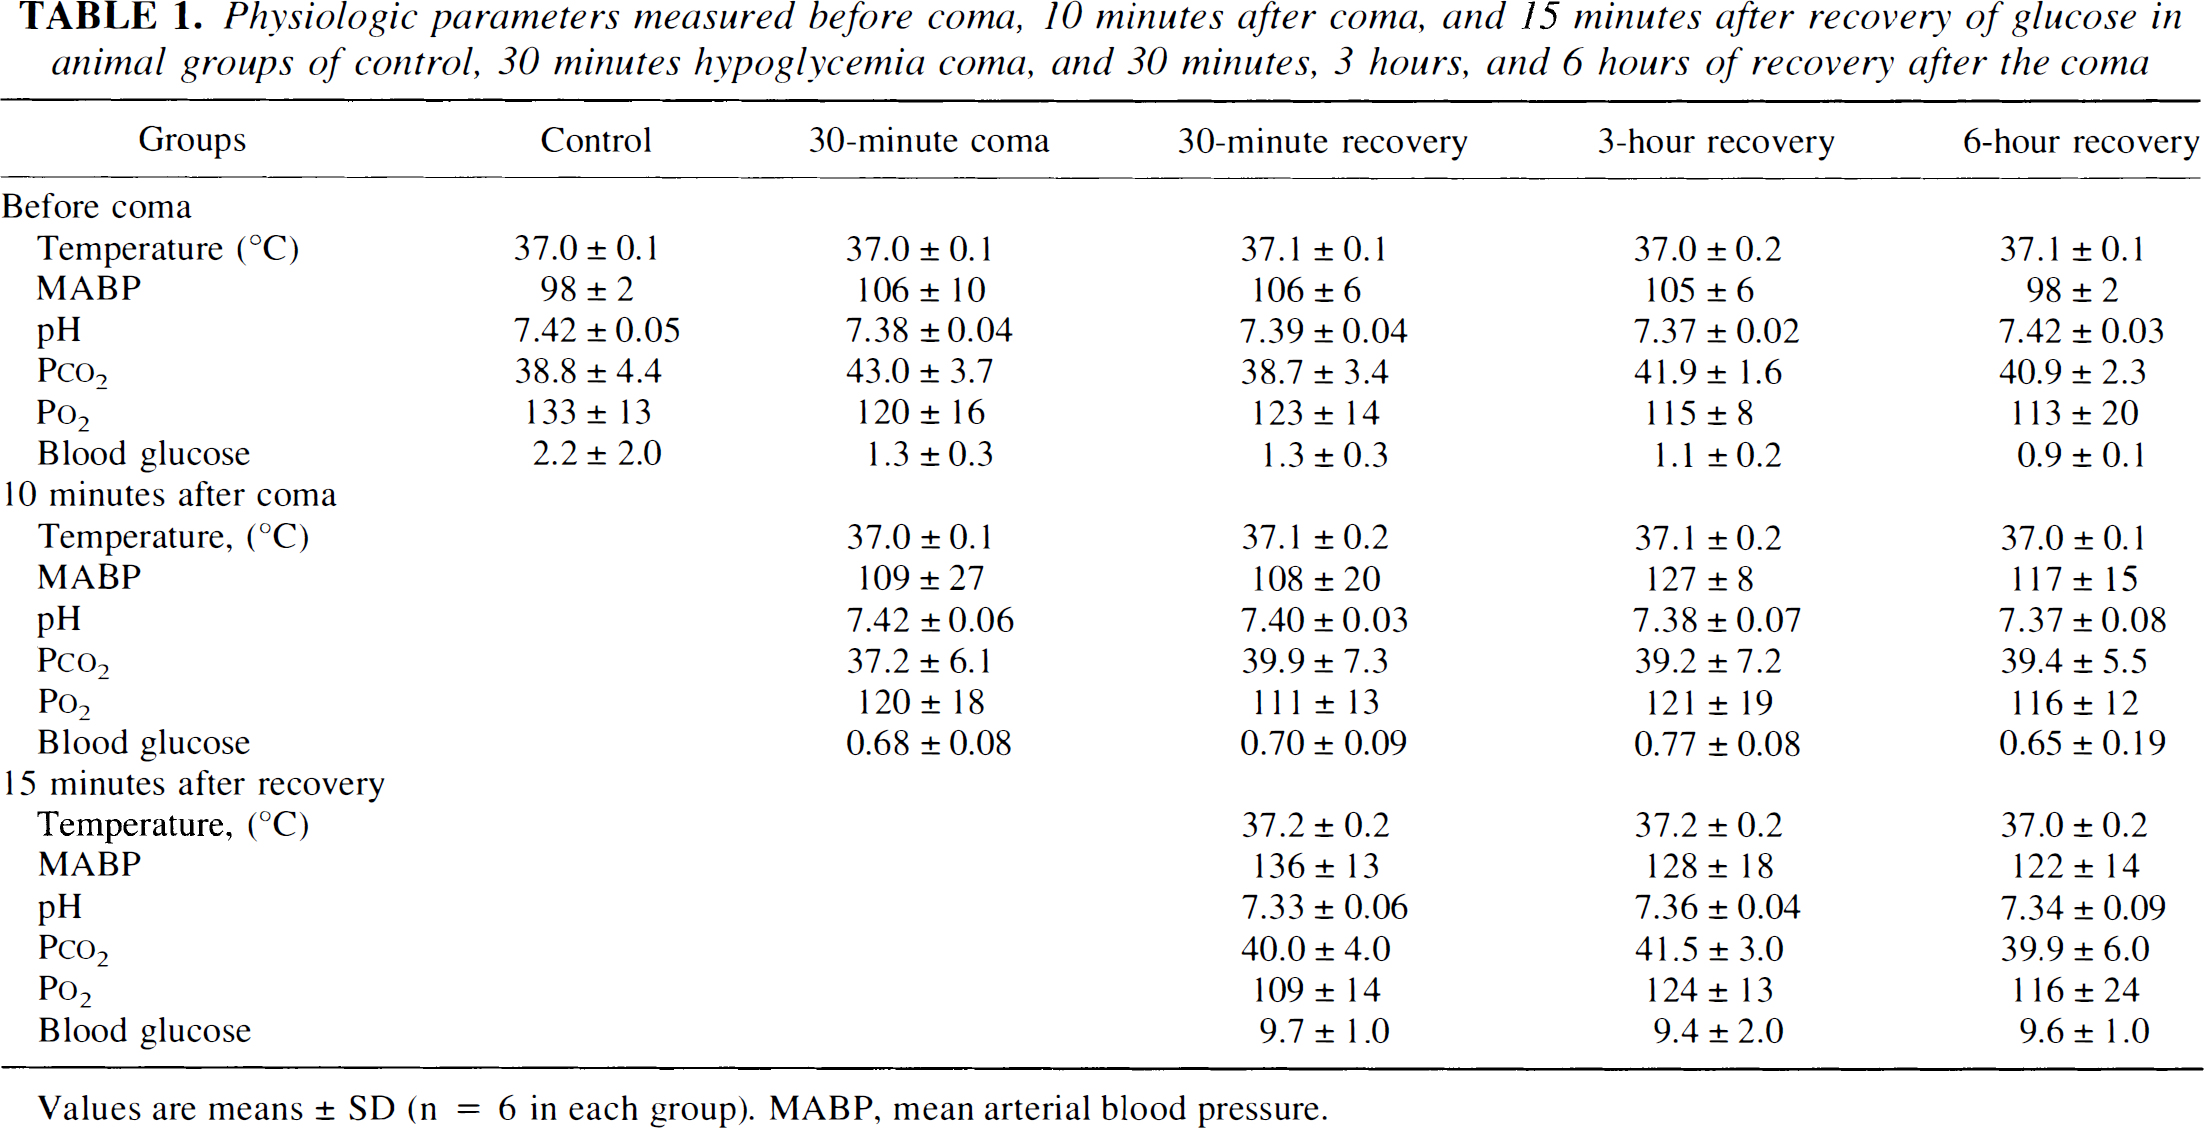
Values are means ± SD (n = 6 in each group). MABP, mean arterial blood pressure.
Histopathologically, the brain damage observed in the current study was similar to that previously reported by Auer et al. (1984b, 1985a, 1985b). Typically, neuronal lesions were observed in the neocortex (particularly in layers 2 to 3), in the dorsolateral crescent of the caudoputamen, and in the tip of the dentate gyrus (data not shown). The authors also saw neuronal necrosis in the subiculum part of the CA1 sector and in the hilar neurons (CA4), but overt CA1 damage was much more sparse in the animals currently studied than in previous reports (Auer et al., 1985b).
In neocortex, some shrunken, triangular neurons with condensed nuclei were scattered in layers 2 to 3 after 3 and 6 hours of recovery. Some dark neurons, which were not shrunken but had an intensely basophilic cytoplasm, were observed in layers 3 to 5 at these recovery times. After 7 days of recovery, the number of acidophilic, shrunken neurons had increased, but the basophilic neurons, observed after 3 and 6 hours of recovery, had disappeared. This pattern of evolution of damage confirms data reported by Auer et al. (1985a).
As remarked, in hippocampus, damage to the CA1 sector was mild. At 3 to 6 hours of recovery, 10 to 20 necrotic neurons per section were observed in the CA1 sector. The damage was not measurably increased after 7 days, suggesting that “maturation” of damage was near completion after 3 to 6 hours of recovery. A similar conclusion can be drawn with respect to the damage observed in the DG. Thus, damage to the tip of the DG was observed as early as after 3 hours of recovery; it was not measurably increased after 6 hours and was similar after 7 days of recovery. In some animals, the damage extended to the inner and outer blades of the DG. However, the damage affected only a small portion of the DG cells and an even smaller proportion of the cells contained in a DG-CA3 tissue sample.
In caudoputamen, the neuronal damage affected, as predicted, the dorsolateral aspects of the nucleus; within that, though, the neuronal necrosis was variable, affecting between 5% and 90% of the neuronal population. In three-fourths of the animals, such damage was observed already after 3 hours of recovery, and the increase in damage to the 7 days endpoint was moderate.
Brain sections from sham-operated control and from animals with 30 minutes hypoglycemic coma followed by different periods of recovery were double-stained with antibodies against CREB or phospho-CREB as well as MAP-2, and they were examined by laser-scanning confocal microscopy. In Figs. 1 and 2, the red color derived from lissamine rhodamine conjugated secondary antibody represents MAP-2, whereas the green color derived from fluorescein indicates labeling of phospho-CREB.
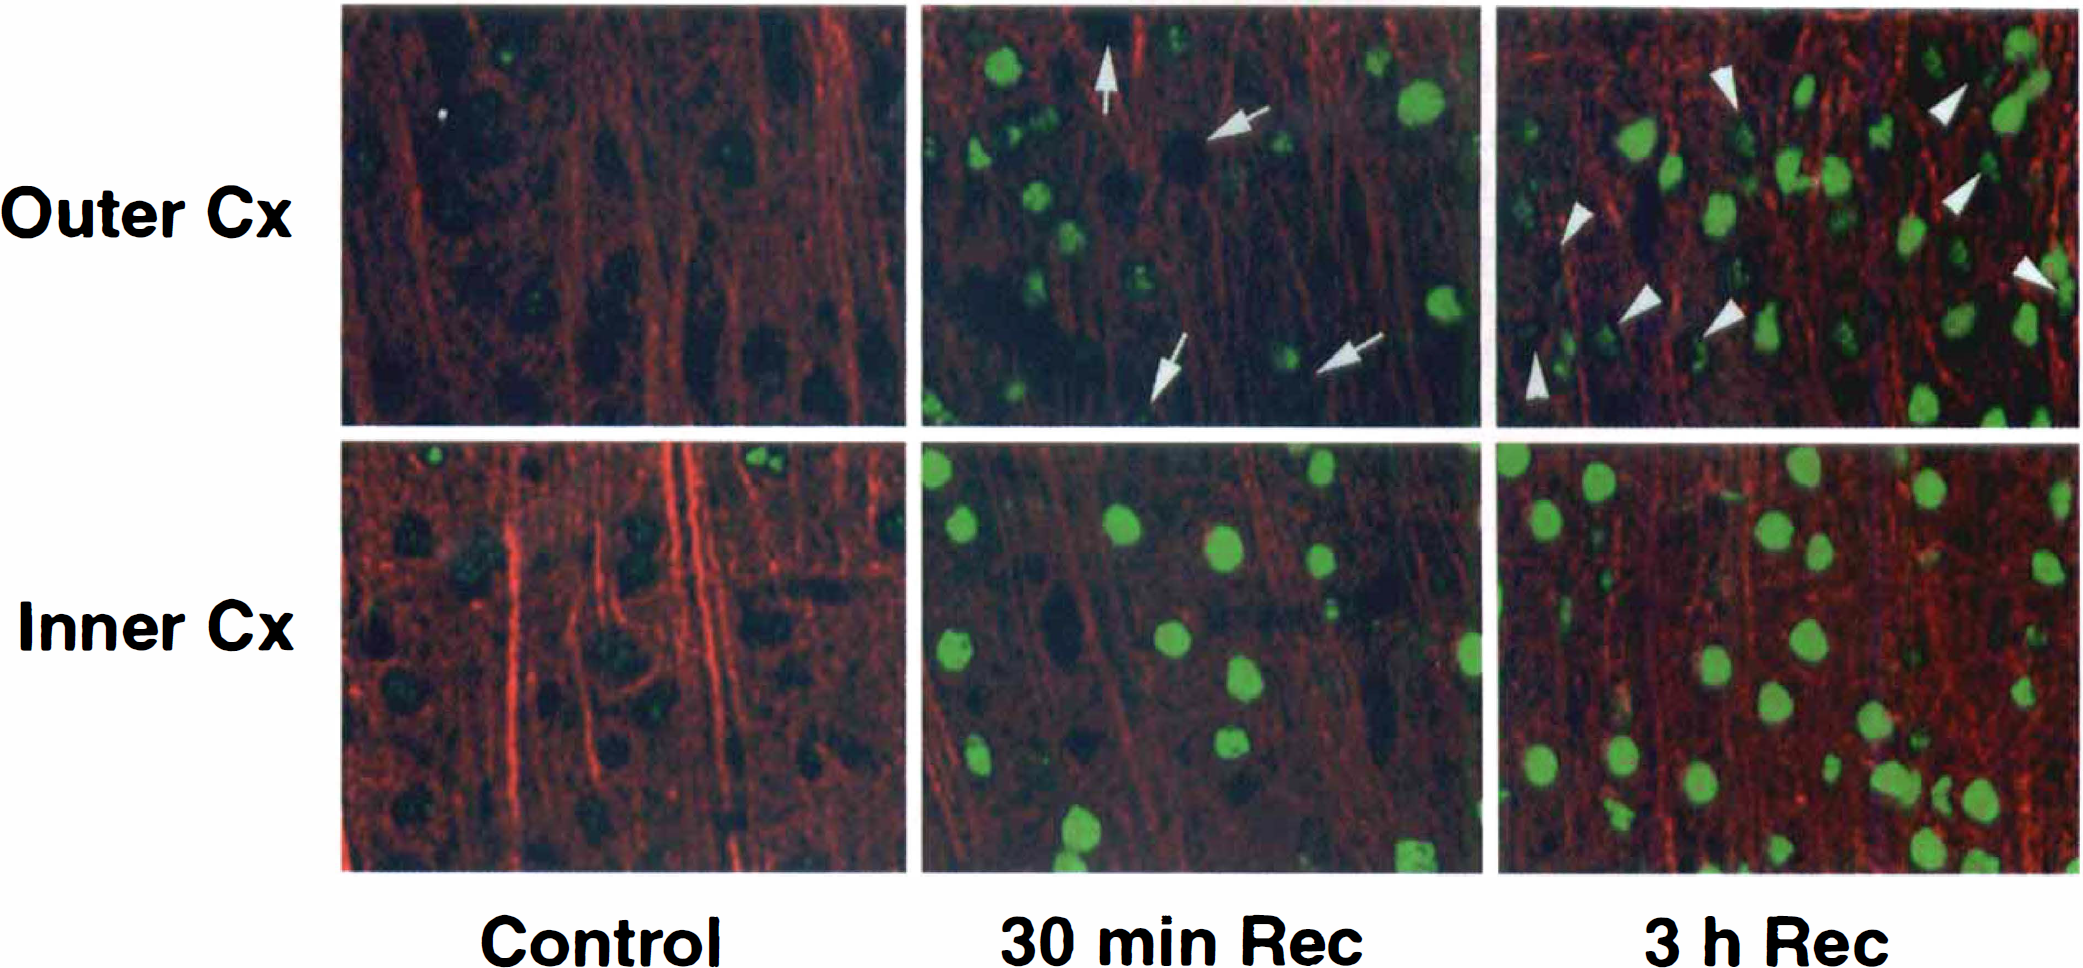
Double-immunostaining images of neocortex for phospho-CREB (green) and MAP-2 (red). At 30 minutes of recovery after 30 minutes of hypoglycemic coma, clear expression of phospho-CREB was observed in the inner layer of neocortex
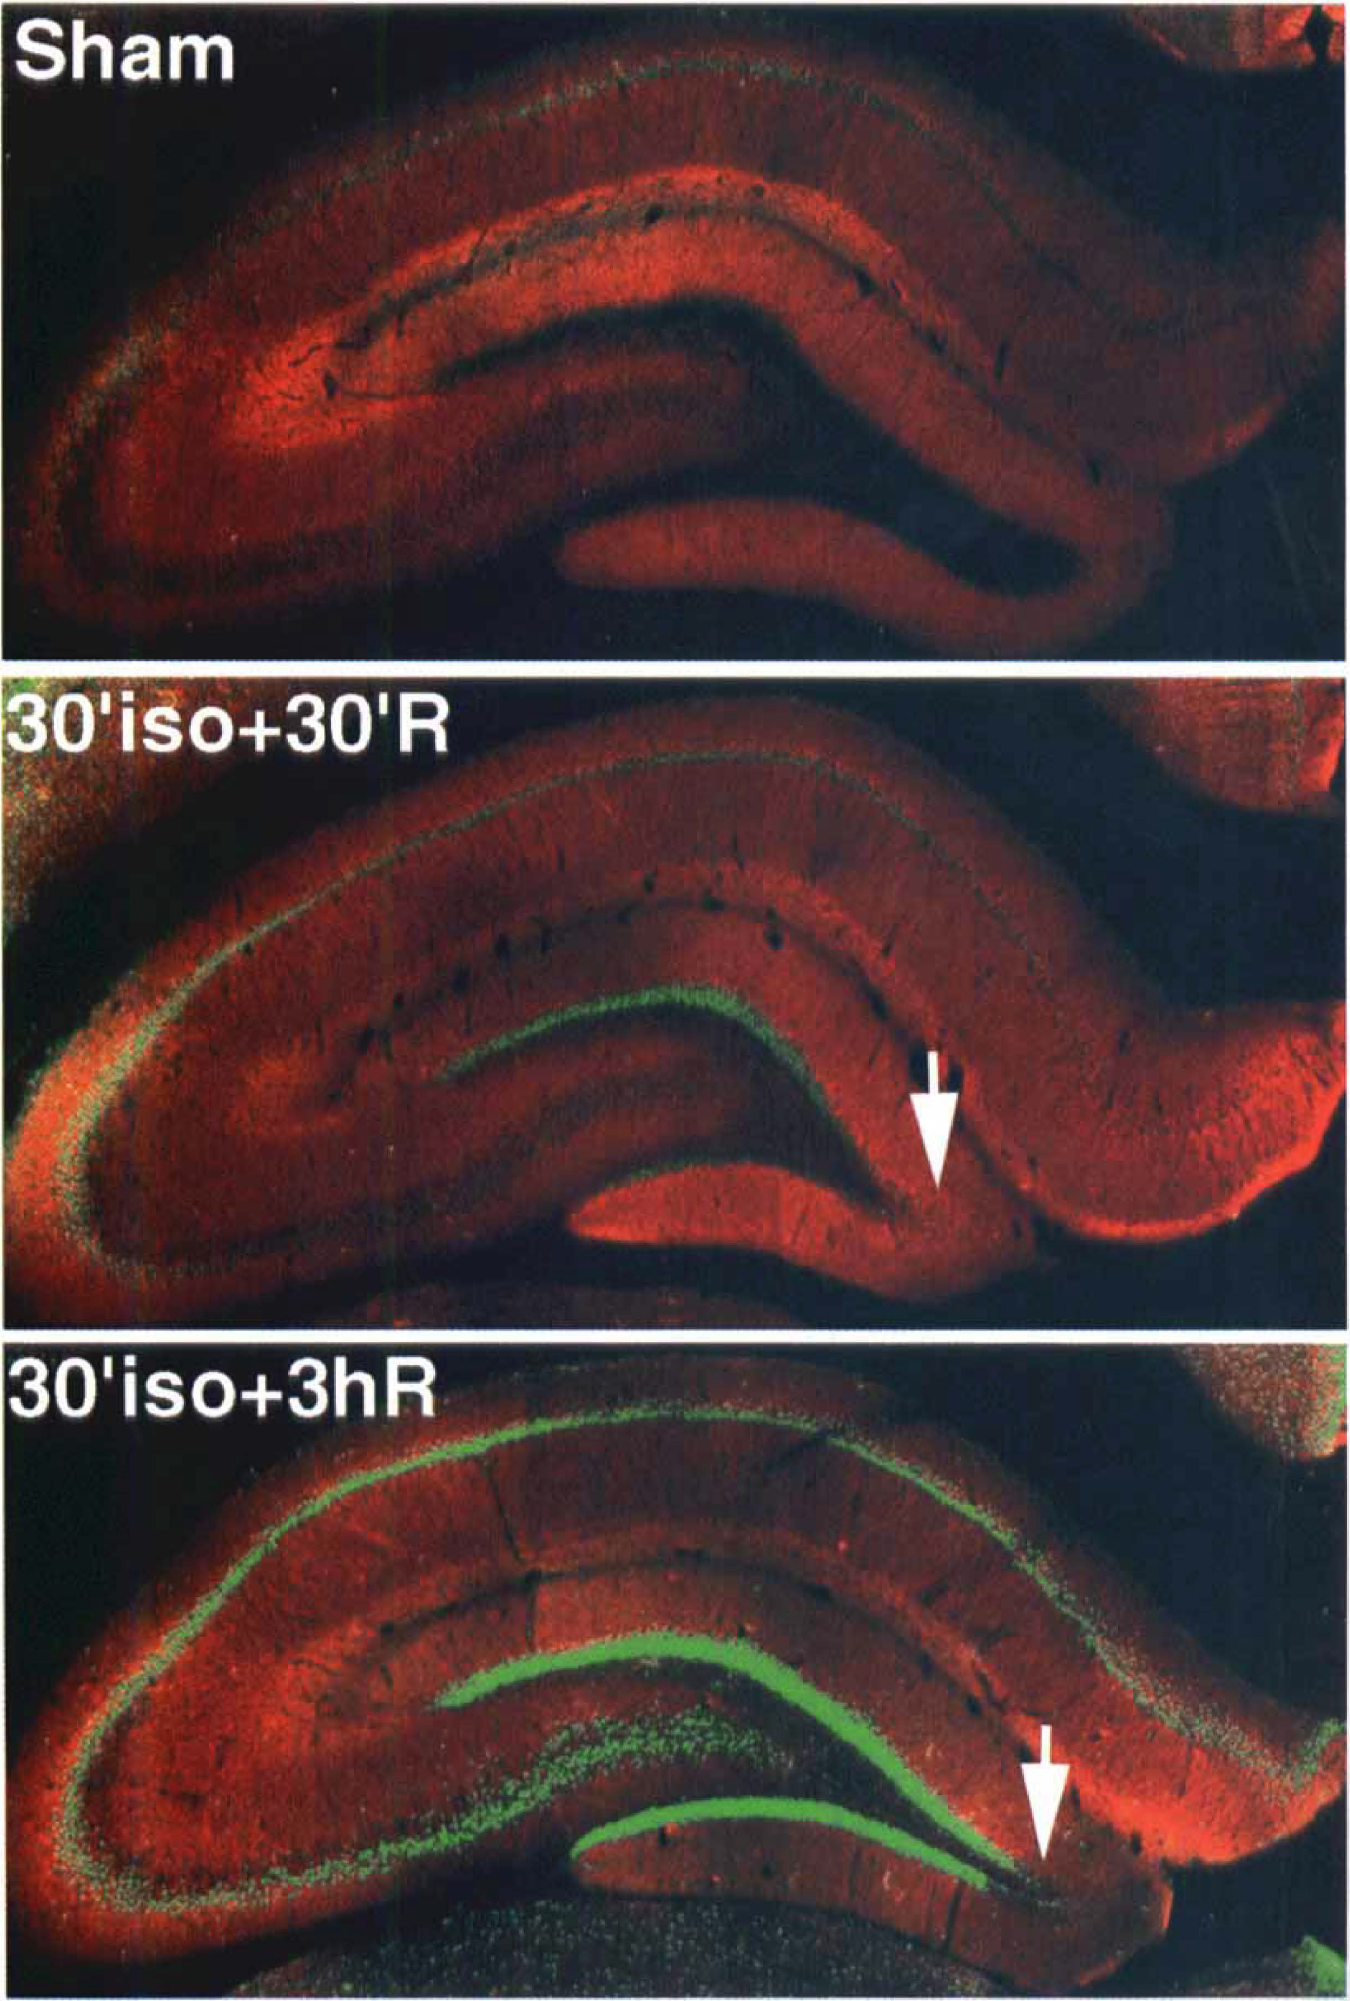
Double-immunostaining images of hippocampus for phospho-CREB (green) and MAP-2 (red). Except for the tip of dentate gyrus (arrows), expression of phospho-CREB was observed in all the neuronal layers at 30 minutes and 3 hours of recovery after 30 minutes of hypoglycemic coma.
In sham-operated controls, an antibody against total CREB (phosphorylated plus unphosphorylated forms) was expressed in nuclei of pyramidal cells, in dentate granule cells, and in neocortical neurons (data not shown) as reported before (Hu et al., 1999). No obvious changes were noted in the immunostaining of total CREB in hippocampal and cortical regions after hypoglycemic coma (data not shown). In contrast, hypoglycemic coma induced a marked and persistent increase in CREB phosphorylation (phospho-CREB) primarily in areas such as the inner layer of the neocortex (Fig. 1, bottom), the inner and outer blades of DG (Fig. 2), and in hippocampal pyramidal neurons (Fig. 2). The increase in phospho-CREB was detectable at 30 minutes (Figs. 1 and 2), and continued until 3 hours of recovery. Phospho-CREB was only induced in some cells in the outer layers (Fig. 1, top) compared with the inner layers of the neocortex (Fig. 1, bottom). At 30 minutes and 3 hours recovery after hypoglycemia almost all of the neurons had strong green staining nuclei, which showed the phosphorylation of CREB (Fig. 2, bottom layer). But in the outer layer of the cortex there were still some cells stained as in the control ones (Fig. 1, arrows) at 30 minutes of recovery. These unstained nuclei became smaller and changed their shapes thus differing from the original round ones (Fig. 1, arrow heads). At the tip of DG, no increase of phospho-CREB was observed at any time point after hypoglycemic coma (Fig. 2, arrows). At 7 days of recovery, all of the up-regulation of phospho-CREB described above disappeared (data not shown).
Following up on the immunocytochemical results, the authors further characterized total CREB and phospho-CREB in the outer and inner layers of cortex after hypoglycemic coma by Western blot analysis. As shown in Fig. 3, total CREB was unchanged in the inner (Fig. 3, top left) and outer (Fig. 3, top right) layers during and after hypoglycemic coma. In contrast to the total CREB, phospho-CREB disappeared in both layers at the end of 30 minutes coma (0 minutes of recovery), but rapidly rephosphorylated to reach levels greater than control, moderately in the outer layers (Fig. 3, bottom right) and more significantly in the inner layers (Fig. 3, bottom left).
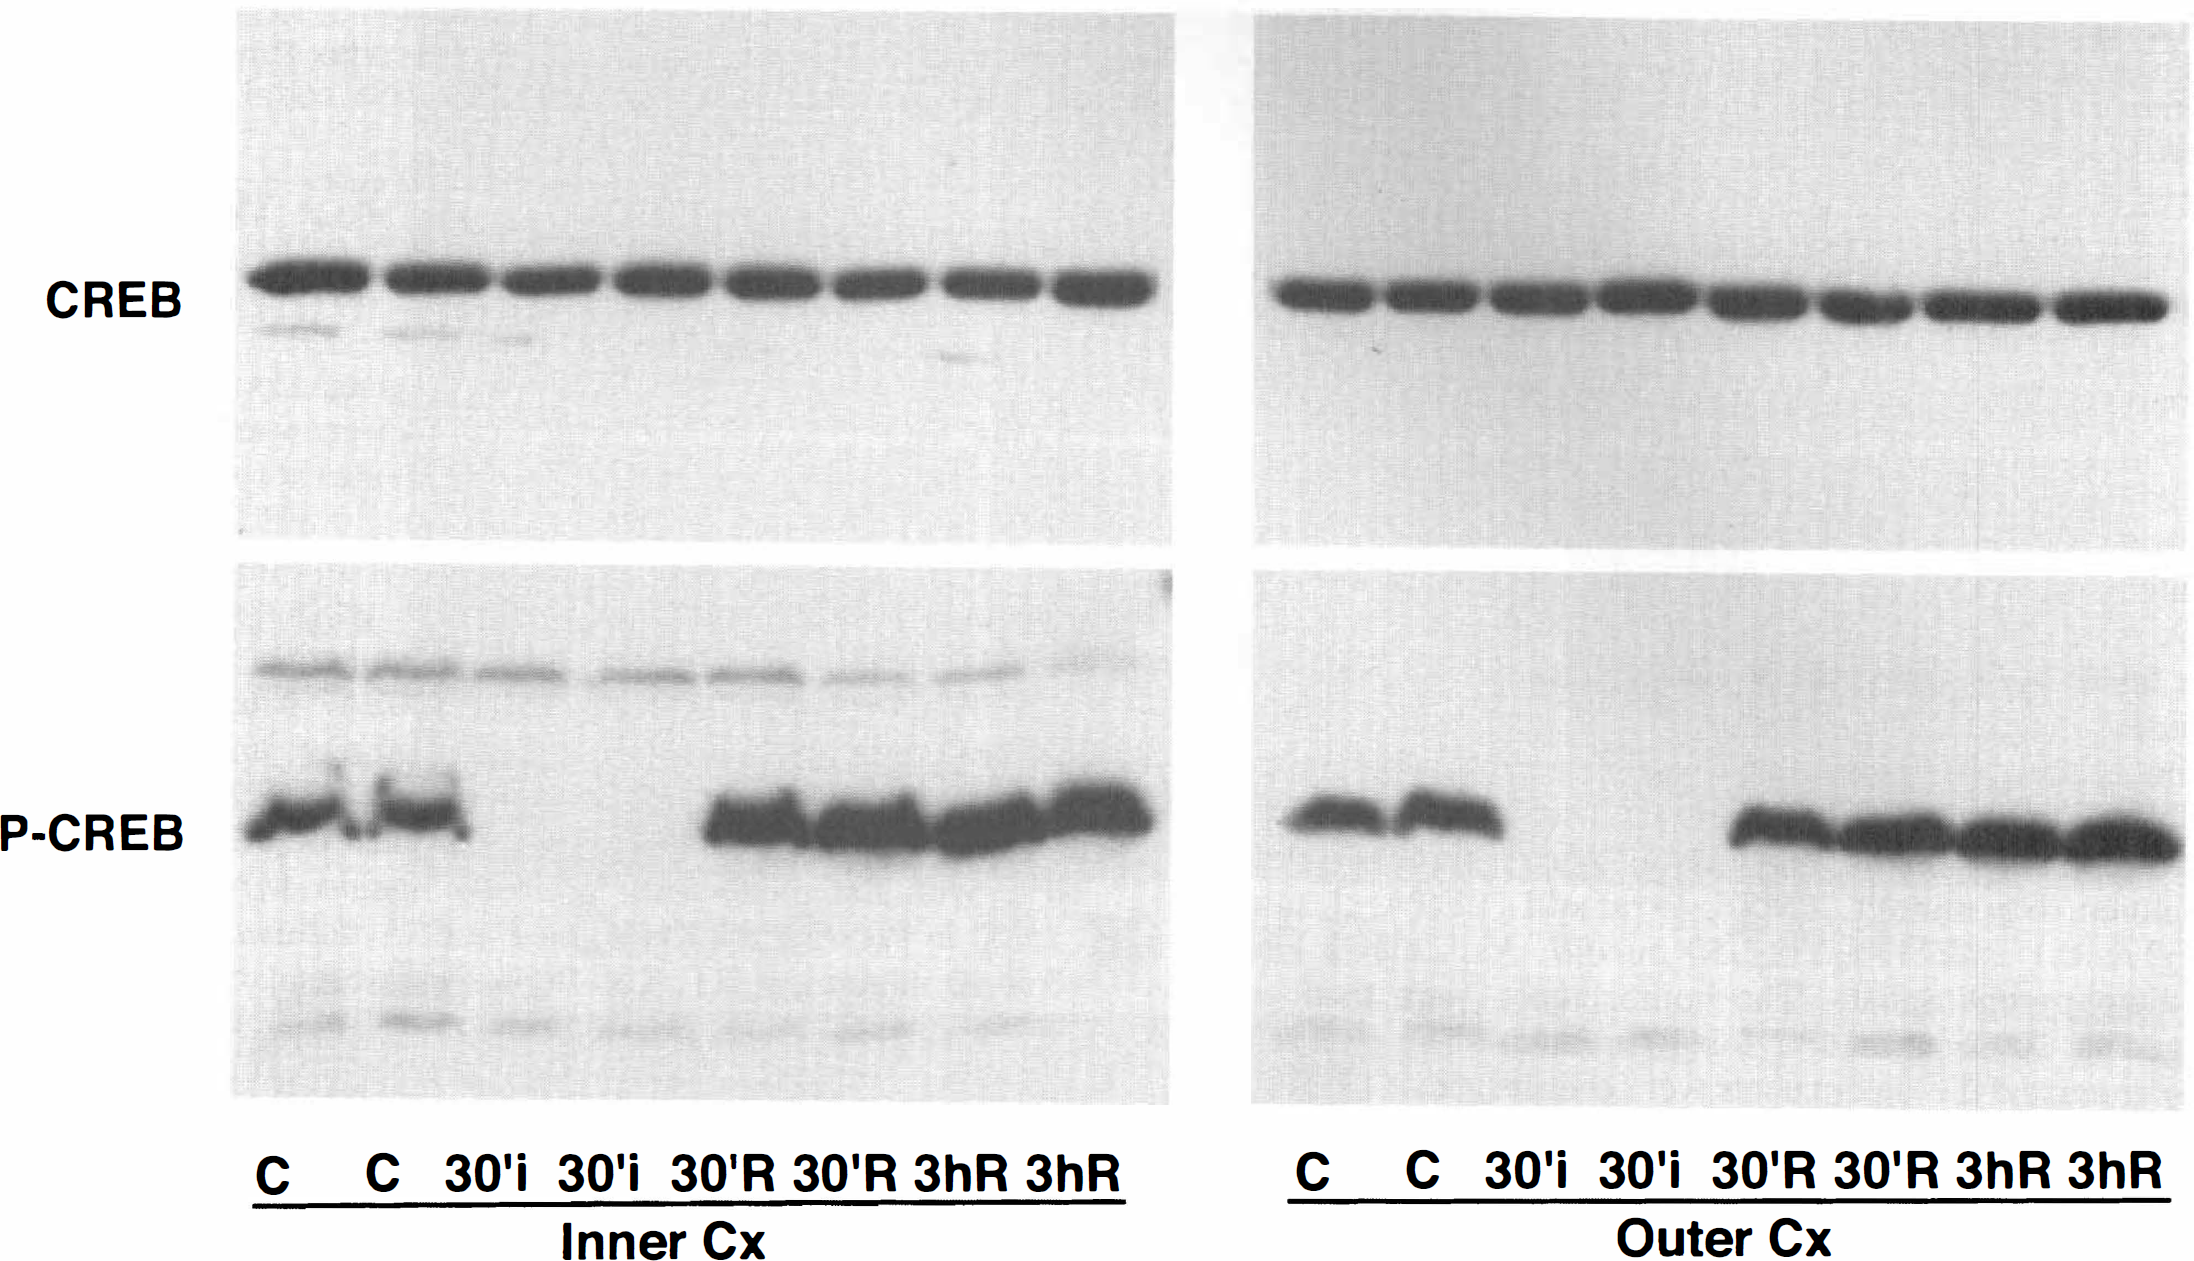
Western blots of total CREB
DISCUSSION
Hypoglycemic coma yields brain lesions dominated by selective neuronal damage localized to selectively vulnerable regions. The current study was conducted to investigate the temporal and regional changes of the transcription factor CREB after hypoglycemic coma in both selectively vulnerable and resistant brain regions. The results showed that the total amount of CREB was not altered in all areas examined after coma. However, in the relatively resistant areas—such as the inner layers of cortex and the inner and outer blades of DG— phospho-CREB was increased greater than the control level after 30 minutes of recovery and continued to increase until 3 hours of recovery. In contrast, little or no increase of phospho-CREB was observed during the recovery period in the outer layers of the neocortex and at the tip of the DG, that is, increases that are selectively vulnerable to hypoglycemic insults. It is clear that cell death does not occur in the inner layers of the cerebral cortex, hence more activation can be seen in those areas because of the increased numbers of surviving cells.
Cyclic adenosine monophosphate response element binding protein is a member of a large family of transcription factors and is activated by phosphorylation at a key regulator site, Ser-133. Phospho-CREB is involved in the transcriptional regulation of certain immediate early gene- (IEG) coded proteins such as c-Fos and JunB (Herdegen et al., 1994). c-Fos protein may be neuroprotective, thus, preischemic induction of c-fos mRNA has been found to suppress the delayed neuronal death of hippocampal neurons after subsequent global cerebral ischemia (Belayev et al., 1996). Intraischemic hypothermia also promoted the expression of c-Fos protein, which was accompanied by inhibition of neuronal death (Kumar et al., 1996). Hypoglycemia has been shown to increase the concentrations of c-Fos and c-Jun in the hippocampus (Gass et al., 1995) and the hypothalamus (Itoi et al., 1996). Transcription of BDNF (brain-derived neurotrophic factor) mRNA recently has been shown to be activated by phosphorylation of CREB or a closely related protein in a Ca2+-dependent manner (Tao et al., 1998). These findings appear compatible with the current findings for phophorylated CREB expression. Taken together, the current findings suggest that after hypoglycemic coma, a neuroprotective signaling pathway may be markedly activated by an increase of phosphorylation of CREB in areas surviving the insult, such as the inner layer of cortex and the inner and outer blades of DG, but not in selectively vulnerable regions such as the tip of DG, where all neurons are destined to die. The current results support the hypothesis that CREB may play a protective role for neurons after insults (Hu et al., 1999) such as hypoglycemia.
Interestingly, compared with results from Auer et al. (1985b) the current results showed very mild CA1 damage. This may explain why such a “selectively vulnerable region” also had increased phospho-CREB after hypoglycemic coma (Fig. 2). As discussed above, morphologic signs of cell injury and cell death during the recovery were mild in the subiculum and CA1 sector of the hippocampus and, although damage was dense in the tip of the dentate gyrus, this damage represented only a fraction of the samples obtained from CA3 plus DG. Thus, in the Western Blot analysis, only the outer and inner layers of neocortical samples can, at best, be used to illustrate changes that are representative of a large group of cells committed to die or survive.