
Abstract
With the advent and emerging importance of neurobiology and its relation to behavior, scientists desire the capability to apply noninvasive, quantitative imaging of neuronal activity to small rodents. To this end, the authors' laboratory has developed microPET, a high-resolution positron emission tomography (PET) scanner that is capable of performing in vivo molecular imaging at a resolution sufficient to resolve major structures in the rat brain. The authors report in this article that, in conjunction with 2-[18F]fluoro-2-deoxyglucose (FDG), microPET provides accurate rates of cerebral glucose metabolism (59.7 to 108.5 μmol/100 g·min) in conscious adult rats as validated by within-subject autoradiographic measurements (59.5 to 136.2 μmol/100 g·min;r = 0.88; F[1,46] = 168.0;P < 0.001). By conducting repeated quantitative scanning, the authors demonstrate the sensitivity and accuracy of FDG-microPET to detect within-subject metabolic changes induced by traumatic brain injury. In addition, the authors report that longitudinal recovery from traumatic brain injury-induced metabolic depression, as measured by quantitative FDG-microPET, is significantly correlated (r = 0.65;P < 0.05) to recovery of behavioral dysfunction, as assessed by the Morris Water Maze performance of the same rats, after injury. This is the first study to demonstrate that FDG-microPET is quantitative, reproducible, and sensitive to metabolic changes, introducing a new approach to the longitudinal study of small animal models in neuroscience research.
Keywords
The autoradiographic technique is commonly used in animal models to measure local metabolic rates of cerebral glucose utilization (lCMRGlc) in vivo using [14C]2-deoxy-D-glucose (2DG; Sokoloff et al., 1977). Despite having excellent spatial resolution (∼0.1 mm), this method requires that the animal be killed, thereby allowing only one experimental timepoint for measurement. As sophisticated experimental designs call for longitudinal studies in animals, new methods must be considered that provide more than a snapshot of brain metabolism.
Among its many uses, positron emission tomography (PET) is a noninvasive imaging technique that permits multiple measurements of lCMRGlc in the same subject (Phelps et al., 1979). Although primarily used in humans, PET has been used, in conjunction with 2-[18F]fluoro-2-deoxy-D-glucose (FDG), to demonstrate dynamic changes in lCMRGlc in nonhuman primates during development (Jacobs et al., 1995; Moore et al., 1999, 2000), aging (Eberling et al., 1995), and behavioral tasks (Chavoix and Baron, 1995; Doudet et al., 1995). Unfortunately, application of FDG-PET to monitor lCMRGlc has been restricted to large laboratory animals because of the limited resolution of the PET scanner relative to brain size.
Recently, improvement in scanner resolution has allowed FDG-PET to become a potential method to monitor cerebral metabolic patterns in rat brain using small-animal tomographs (Marriott et al., 1994; Bruyndonckx et al., 1996; Del Guerra et al, 1996; Bloomfield et al., 1997; Cherry et al., 1997; Watanabe et al., 1997, Weber et al., 1997; Chatziioannou et al., 1999; Jeavons et al., 1999). Although these scanners produce high quality images that provide the researcher with information on relative tracer uptake, the accuracy of conducting quantitative studies with small animal scanners must be scientifically evaluated before application in any study of cerebral metabolism. Specifically, issues regarding validity and reliability need to be clarified to compare between animals. Consequently, determination of absolute rates of metabolism and their accuracy is necessary.
In an effort to establish it as a potential tool for longitudinal assessment of lCMRGlc in the rat, the following studies were conducted to determine the validity, sensitivity, and application of microPET, one of the highest performance small-animal tomographs currently available for small animal imaging (Cherry et al., 1997, Chatziioannou et al., 1999). The first objective was to determine the accuracy and reproducibility of lCMRGlc values calculated using FDG-microPET by comparison to values determined through autoradiography within the same animal. In a separate group of animals, a second study was performed to determine if FDG-microPET was sensitive to metabolic changes induced by the lateral fluid percussion (LFP) model of traumatic brain injury, as observed previously (Yoshino et al., 1991), and the extent to which these measurements correlated to 2 DG autoradiographic measurements in the same animal. The final study was conducted to demonstrate the value of noninvasive quantitative metabolic imaging in rodents by measuring rates of cerebral glucose metabolism and behavioral recovery within-subjects, hypothesizing that cerebral metabolism may serve as a surrogate outcome measure of functional recovery after LFP injury.
METHODS
Animals and experimental design
Twenty-five adult male Sprague-Dawley rats (300 to 400 g) were used in the current study. All animals underwent a control quantitative FDG-microPET scan. Animals were divided into three experimental groups (Table 1).
Experimental design
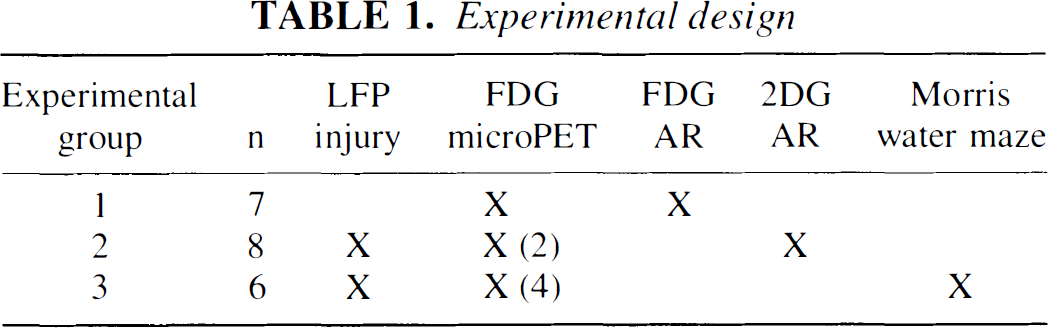
Adult male Sprague–Dawley rats were divided into three experimental groups: (1) to test the accuracy of calculating local cerebral metabolic rates of glucose (ICMRGlc) from quantitative FDG-microPET relative to FDG-autoradiography; (2) to determine if FDG-microPET was sensitive to within-subject metabolic changes induced by lateral fluid percussion (LFP) injury relative to 2DG autoradiography; and (3) to assess the temporal correlation between metabolic and behavioral recovery after LFP injury as measured by FDG-microPET and Morris Water Maze performance, respectively. Numbers in parentheses indi-cate number of scans conducted on each animal.
In the first experimental group (n = 7), animals were killed after the control scan for [18F]-autoradiographic processing to compare metabolic rates calculated between the two imaging techniques.
The second experimental group (n = 8) assessed whether FDG-microPET was sensitive to injury-induced changes in resting cerebral glucose metabolism. Six animals received an LFP injury and the remaining two animals received sham surgeries. One day after the injury (time point of maximum metabolic depression;Yoshino et al., 1991), all animals underwent a second FDG-microPET scan. On the second day postsurgery, the 8 animals (6 injured, 2 sham) were studied using the 2DG autoradioagraphic technique as described by Sokoloff and colleagues (1977). Animals were returned to their home cages for 24 hours between the final microPET study and the autoradiography study to allow complete recovery from anesthesia and sufficient decay of the isotope. Magnitude of metabolic depression does not significantly differ between 1 and 2 days postinjury (Yoshino et al., 1991), thereby allowing comparison between these time points.
In the final experimental group (n = 6), the rats were pretrained on a hidden platform task in the Morris Water Maze for 6 days. On day 0, the rats were subjected to LFP injury. lCMRGlc for cerebral structures were determined 1 day before injury (day −1), 2, 5, and 10 days after LFP injury in the conscious, resting state using FDG-microPET. Reference memory, as determined by escape latency, was tested in the Morris Water Maze on days 1, 3, 4, and 6 to 9 after the LFP–sham injury.
For validation purposes, 4 animals underwent 2DG autoradiography with the tracer uptake period extended to 100 minutes to determine the acceptable duration of scanning without significant effect on the calculation of lCMRGlc from autoradiography. All procedures were approved by the UCLA Chancellor's Committee for Animal Research.
FDG-microPET procedure
After induction of general anesthesia (1.5 to 2.0 mL/min halothane, 100% O2), the femoral triangle was exposed, and the femoral artery was cannulated with polyethylene (PE50) tubing for blood sampling. For animals undergoing repeated scans, the tibial artery was cannulated with PE20 tubing to prevent limb ischemia. To ensure cannula placement, animals' hindlimbs were restrained on cardboard planks with adhesive tape. Animals were allowed 3 hours to recover from halothane anesthesia before a tail vein injection of FDG (∼2 mCi).
Arterial samples (∼0.1 cc) were collected at 0, 20, 45, 75 seconds, and 2, 3, 5, 7.5, 12, 20, 30, 45, 60, 80, and 100 minutes post-FDG administration. Blood samples were immediately centrifuged and the corresponding plasma was analyzed for radiolabeled tracer concentration using an automated gamma well counter (Searle Analytic, Des Plaines, IL, U.S.A.) and for glucose concentration using a diagnostic assay (Sigma Chemical, St. Louis, MO, U.S.A.).
At 42 minutes, animals were sedated with ketamine (40 mg/kg, IP) and xylazine (20 mg/kg, IP), placed in a plastic stereotaxic headholder, and positioned in the scanner. At this time, FDG uptake was essentially complete (Mori et al., 1990), and administration of anesthesia had minimal effect on the calculation of cerebral metabolic rates. Data acquisition began at 60 minutes post-FDG injection and continued for 40 minutes (8 frames × 300 seconds). The microPET (Fig. 1) produces 15 transaxial image planes separated by 1.125 mm. Random and deadtime corrections were performed. In addition, to correct for photon attenuation, a calculated method (Siegel and Dahlbom, 1992) was applied. Data was calibrated using a cylinder comparable to the size of the rat head to minimize scatter-related effects and, as the overall scatter fraction was fairly low, the authors used this calibration approach without scatter correction as validated through phantom experiments (Chatziioannou et al., 1999). Image reconstruction was by 3D filtered back-projection (Kinahan and Rogers, 1989) using a ramp filter for all quantitative data analysis. For visualization purposes only, data were reconstructed using a statistical maximum-a-posteriori probability algorithm (Qi et al., 1998). Image resolution is 1.8 mm in the filtered back-projection reconstructions and 1.5 mm in the maximum-a-posteriori probability reconstructions. All reconstructions were performed on an Ultra SPARC 160 Workstation with computing times of ∼10 minutes and 40 minutes per scan for filtered back-projection and maximum-a-posteriori probability, respectively.
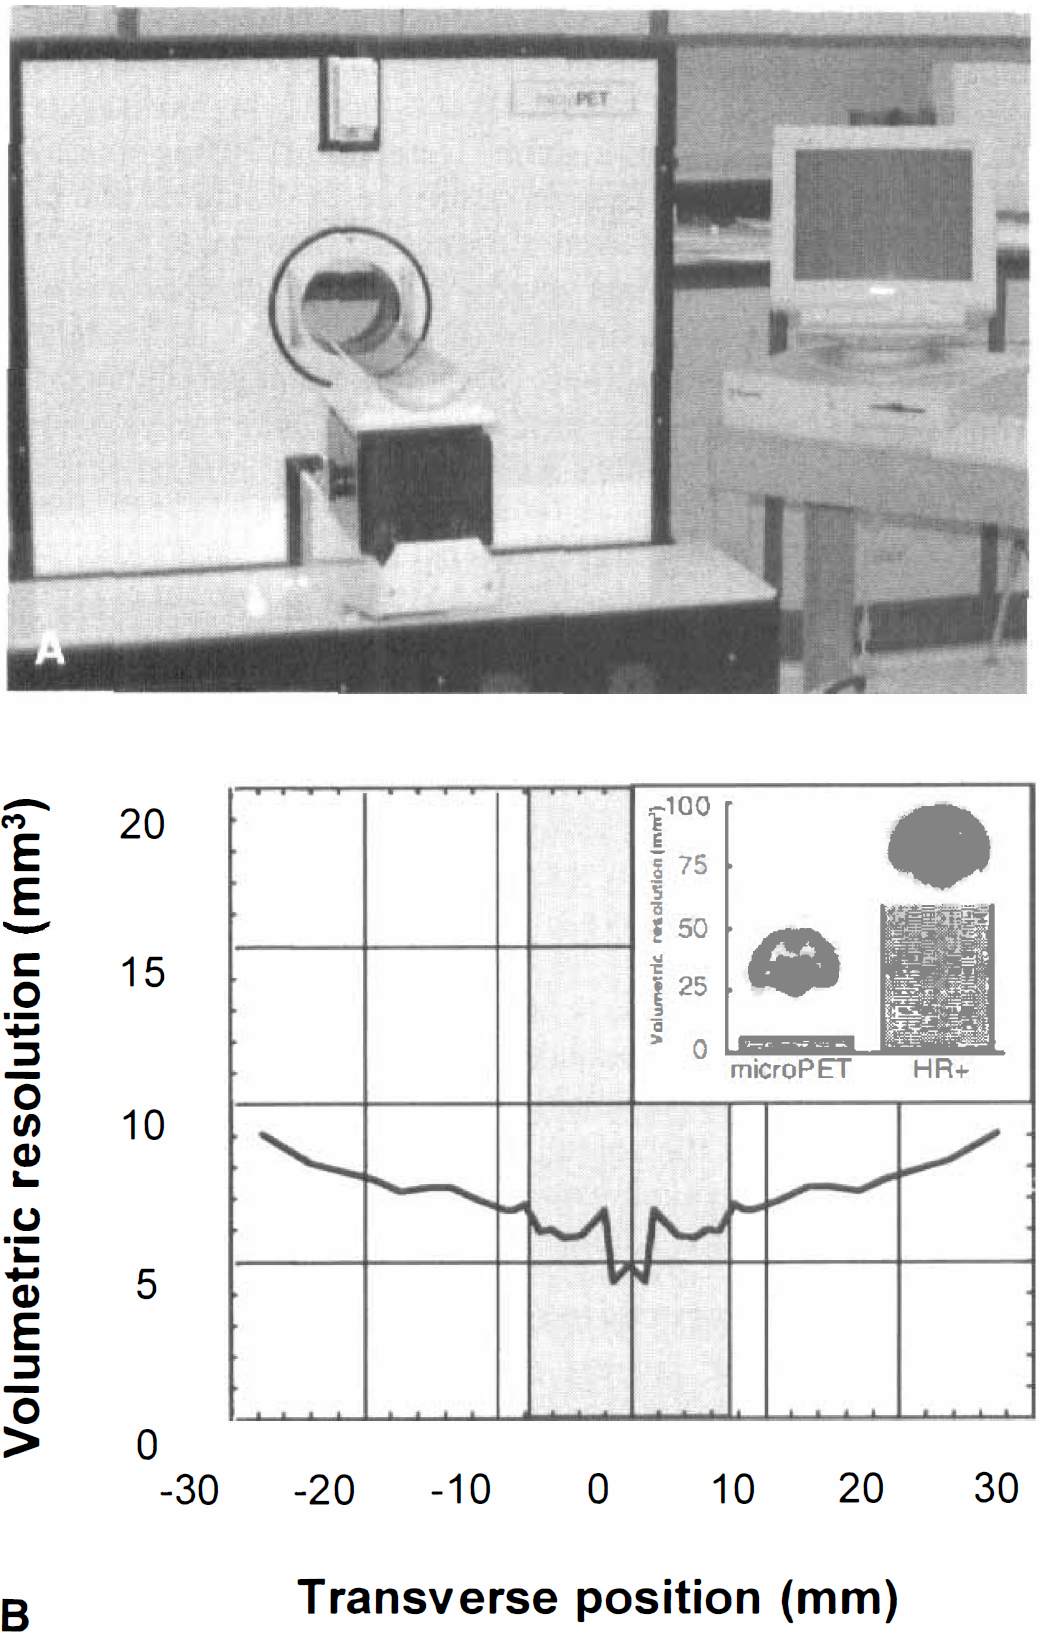
MicroPET is a high-resolution tomograph dedicated for small animal imaging.
FDG-autoradiography procedure
Animals (experimental group 1) were killed (100 mg/kg pentobarbital, IV) upon completion of scanning. The brain was removed immediately and frozen in pulverized dry ice. Coronal sections (20 μm) were exposed to film (Kodak EC-1, Kodak, Rochester, NY, U.S.A.) together with calibrated 14C methacrylate standards. After 110 minutes exposure, brain sections were removed from film, whereas the 14C standards remained on film for 10 days (Ackermann and Lear, 1989). Concentration of [18F]FDG was determined by measuring optical densities from brain regions representing 18F decay and correcting for differences in exposure time and the film efficiency for each radionuclide.
2DG autoradiography procedure
At 2 days postinjury (experimental group 2), animals were surgically prepared, as previously described, for the FDG-microPET procedure with the exception that the femoral artery and vein were cannulated with PE50 tubing for blood sampling and isotope administration, respectively. Timed arterial blood samples were collected during the 45-minute uptake period. Blood samples were immediately centrifuged and the plasma was sampled for determination of [14C] activity using a liquid scintillation counter (Beckman Instruments, Fullerton, CA, U.S.A.). Blood gas measurements (pH, pO2, p CO2) were determined on blood samples collected between 30 and 40 minutes post-isotope injection with a blood-gas analyzer (CIBA Corning 238; CIBA Corning, East Walpole, MA, U.S.A.). Forty-five minutes after the 2DG injection, a lethal dose of sodium pentobarbital (100 mg/kg) was administered. The brain was extracted, frozen in pulverized dry ice, and stored at −80°C until sectioning. Brains were coronally sectioned at 20 μm and exposed to film (Kodak EC-1) for 14 days with [14C]methylmethacrylate standards. Adjacent sections were collected and stained for cresyl violet for histologic analysis.
Lateral fluid percussion injury procedure
Animals were anesthetized with enflurane (1 to 2 mL/min in 100% O2) and body temperature was thermostatically maintained between 36.5°C and 37.5°C using a rectal probe and heating pad. All surgical areas were shaved and bathed in betadine. The animal was placed in a stereotaxic frame and a midline sagittal incision was made. A 3-mm diameter craniotomy was made 3.0 mm posterior to bregma and 6.0 mm lateral to midline on the left side. An injury cap was secured over the craniotomy using silicone adhesive and dental cement. The injury cap was filled with 0.9% saline solution before connection to the injury device. Anesthesia was removed and the animal was connected to the fluid percussion device. The injury was delivered when the animal exhibited a positive toe pinch reflex. The duration of apnea (time from injury until moment of recovery of spontaneous breathing) and unconsciousness, operationally defined as the time from injury until hindlimb withdrawal from toe pinch, was recorded. Anesthesia was restored as soon as a positive toe pinch reflex was measured. The injury cap was removed and the incision was sutured.
The LFP injury has previously been described in detail (McIntosh et al., 1989; Prins et al., 1996). In brief, the device delivers a transient (∼20 ms) pressure fluid pulse to the epidural space, which produced a mechanical stress that is diffusely transmitted to a wide area of the brain resulting in little or no histologic damage at low levels of severity. In the current study, moderate injuries (2.0 to 2.5 atm) were given, as determined by the length of unconsciousness.
Morris water maze
Rats (experimental group 3) were pretrained on a hidden platform task in the Morris Water Maze for 6 days. Each day the rats performed 2 sets of 4 trials. A set consisted of completion of the four drop-spots, completed in random order, as determined by a random number generator. The escape latency of each trial was timed with a stopwatch and recorded in seconds. If the rat did not find the platform within 45 seconds, he was led to it and given the maximum score of 45 seconds for that trial. All rats remained on the platform for 1 minute before being placed at the next drop-spot. After completion of one set, the rat was rinsed in warm water, dried, and returned to a heated chamber. Approximately 30 minutes later, each rat repeated the above procedure and then was returned to its cage.
After completion of the pretraining, rats received a moderate LFP injury. After injury, animals were tested on the same Morris Water Maze as described above. Behavioral data was calculated by taking a mean of each rat's escape latencies (8 trials) for each day tested (pretraining; days 1, 2 or 3, 4, 6 to 9 after injury).
Calculation of lCMRGlc
For both imaging modalities (microPET and autoradiography), lCMRGlc values were determined by the operational equation used in 2DG autoradiography studies (Sokoloff et al., 1977) with the modification of the rate and lumped constants to account for the difference in kinetic characteristics between FDG and 2DG. The following constants were used for 2DG (Sokoloff et al., 1977) and FDG (Ackermann and Lear, 1989) studies, respectively: (gray matter) k1 = 0.18, 0.30;k2 = 0.25, 0.40;k3 = 0.052, 0.068; and LC = 0.46, 0.60. In FDG-microPET studies, only filtered back-projection reconstructed images were used for analysis.
In animals in which FDG-microPET and FDG-autoradiographic studies were performed (experimental group 1), representative coronal slices from the last frame of dynamic FDG-PET images were manually coregistered to the corresponding autoradiographic images. Regions of interest (4 to 8 mm2) were defined bilaterally on the [18F]autoradiographic or histologic sections, and average tissue radioactivities were measured from the same regions on the metabolic images using computerized image analysis software (IDL Clinical Applications Programming Package and NIH Image). For all other animals (experimental groups 2 and 3), lCMRGlc values were calculated from the first frame of dynamic FDG-microPET images. The following regions were examined in all studies: frontal cortex, caudate–putamen, parietal cortex, and thalamus.
Statistical analysis
Linear regression analyses were performed to determine similarity of lCMRGlc values calculated from FDG-microPET and autoradiography (2DG or FDG) and to determine the predictability of escape latency using lCMRGlc values. Analysis of variance with regions treated as repeated within-subject measures was conducted to examine FDG-microPET measures of lCMRGlc pre-and post-LFP injury. Post hoc comparisons were made using paired-sample t- tests with Bonferroni adjustments. Comparisons were considered statistically significant at α = 0.05. Data are presented as mean ± SD.
RESULTS
One animal did not survive the initial PET study because of anesthesia complications and was not included in the analysis. A second animal completed the control PET scan without autoradiography and was removed from further data analysis. For the remaining animals (n = 19), plasma glucose concentrations were within physiologic range (1.91 ± 0.19 mg/mL), with microPET scanning conducted an average of 65.3 ± 10.7 minutes after intravenous injection of FDG.
Mean lCMRGlc values (± SD), as calculated from noninjured (baseline) FDG-microPET studies (n = 19), were 65.2 ± 12.6 and 59.9 ± 11.0 (μm mol/100 g·min) for frontal and parietal cortical regions, respectively. Subcortical regions exhibited similar metabolic rates as observed in the caudate–putamen (79.4 ± 12.6 μmol/100 g·min) and thalamus (73.9 ± 13.4 μmol/100 g·min).
Resting lCMRGlc values—FDG-microPET versus FDG autoradiography
FDG-microPET images were of high quality and allowed delineation between cortical and subcortical structures. Representative FDG-microPET images and autoradiographic images are presented in Fig. 2A. Overall analysis indicated that lCMRGlc values calculated by microPET (59.7 to 108.5 μmol/100 g·min) were significantly similar to those obtained by autoradiography (59.5 to 136.2 μmol/100 g·min;r = 0.88; F[1,46] = 168.0;P < 0.001; Table 2; Fig. 2B). Evaluating each structure individually showed that FDG-microPET values were generally lower (17.0 + 10.3%) than those determined by autoradiography. Cortical regions exhibited a consistent magnitude of decreased lCMRGlc values calculated from microPET with mean differences of 17.4 ± 8.4% and 15.4 ± 4.8% for frontal and parietal regions of interest, respectively. Mean differences for caudate–putamen (7.7 ± 21.1%) and thalamus (13.1 ± 11.8%) were of similar degree, however with greater variation (Table 1).
Mean (SD) local rates of cerebral metabolic rates for glucose in μmol/100 g · min
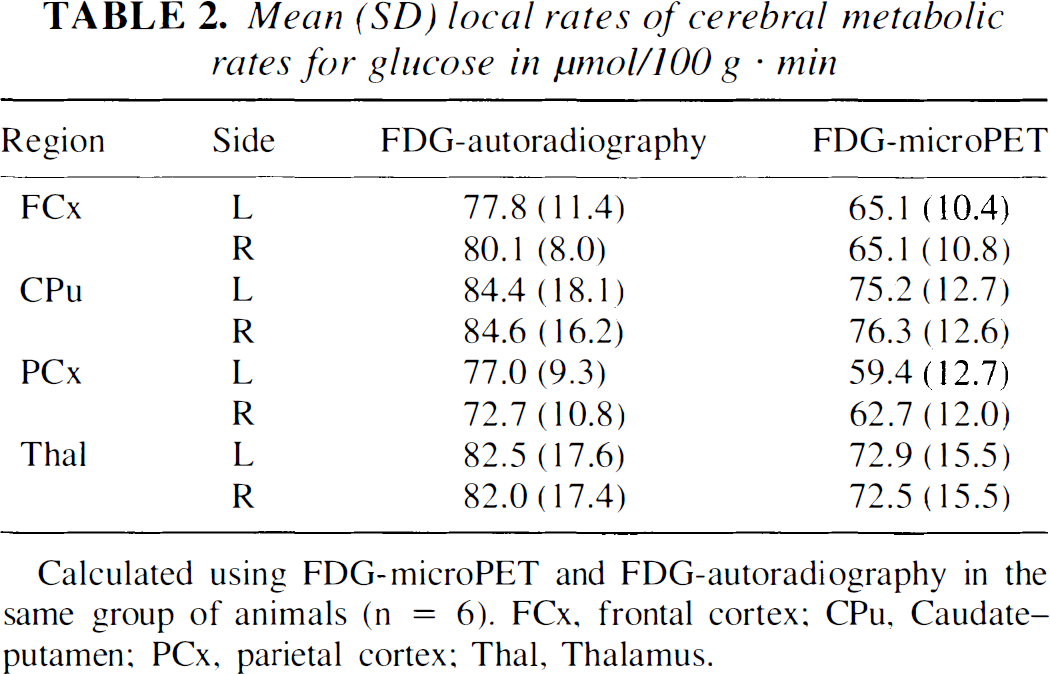
Calculated using FDG-microPET and FDG-autoradiography in the same group of animals (n = 6). FCx, frontal cortex; CPu, Caudate–putamen; PCx, parietal cortex; Thal, Thalamus.
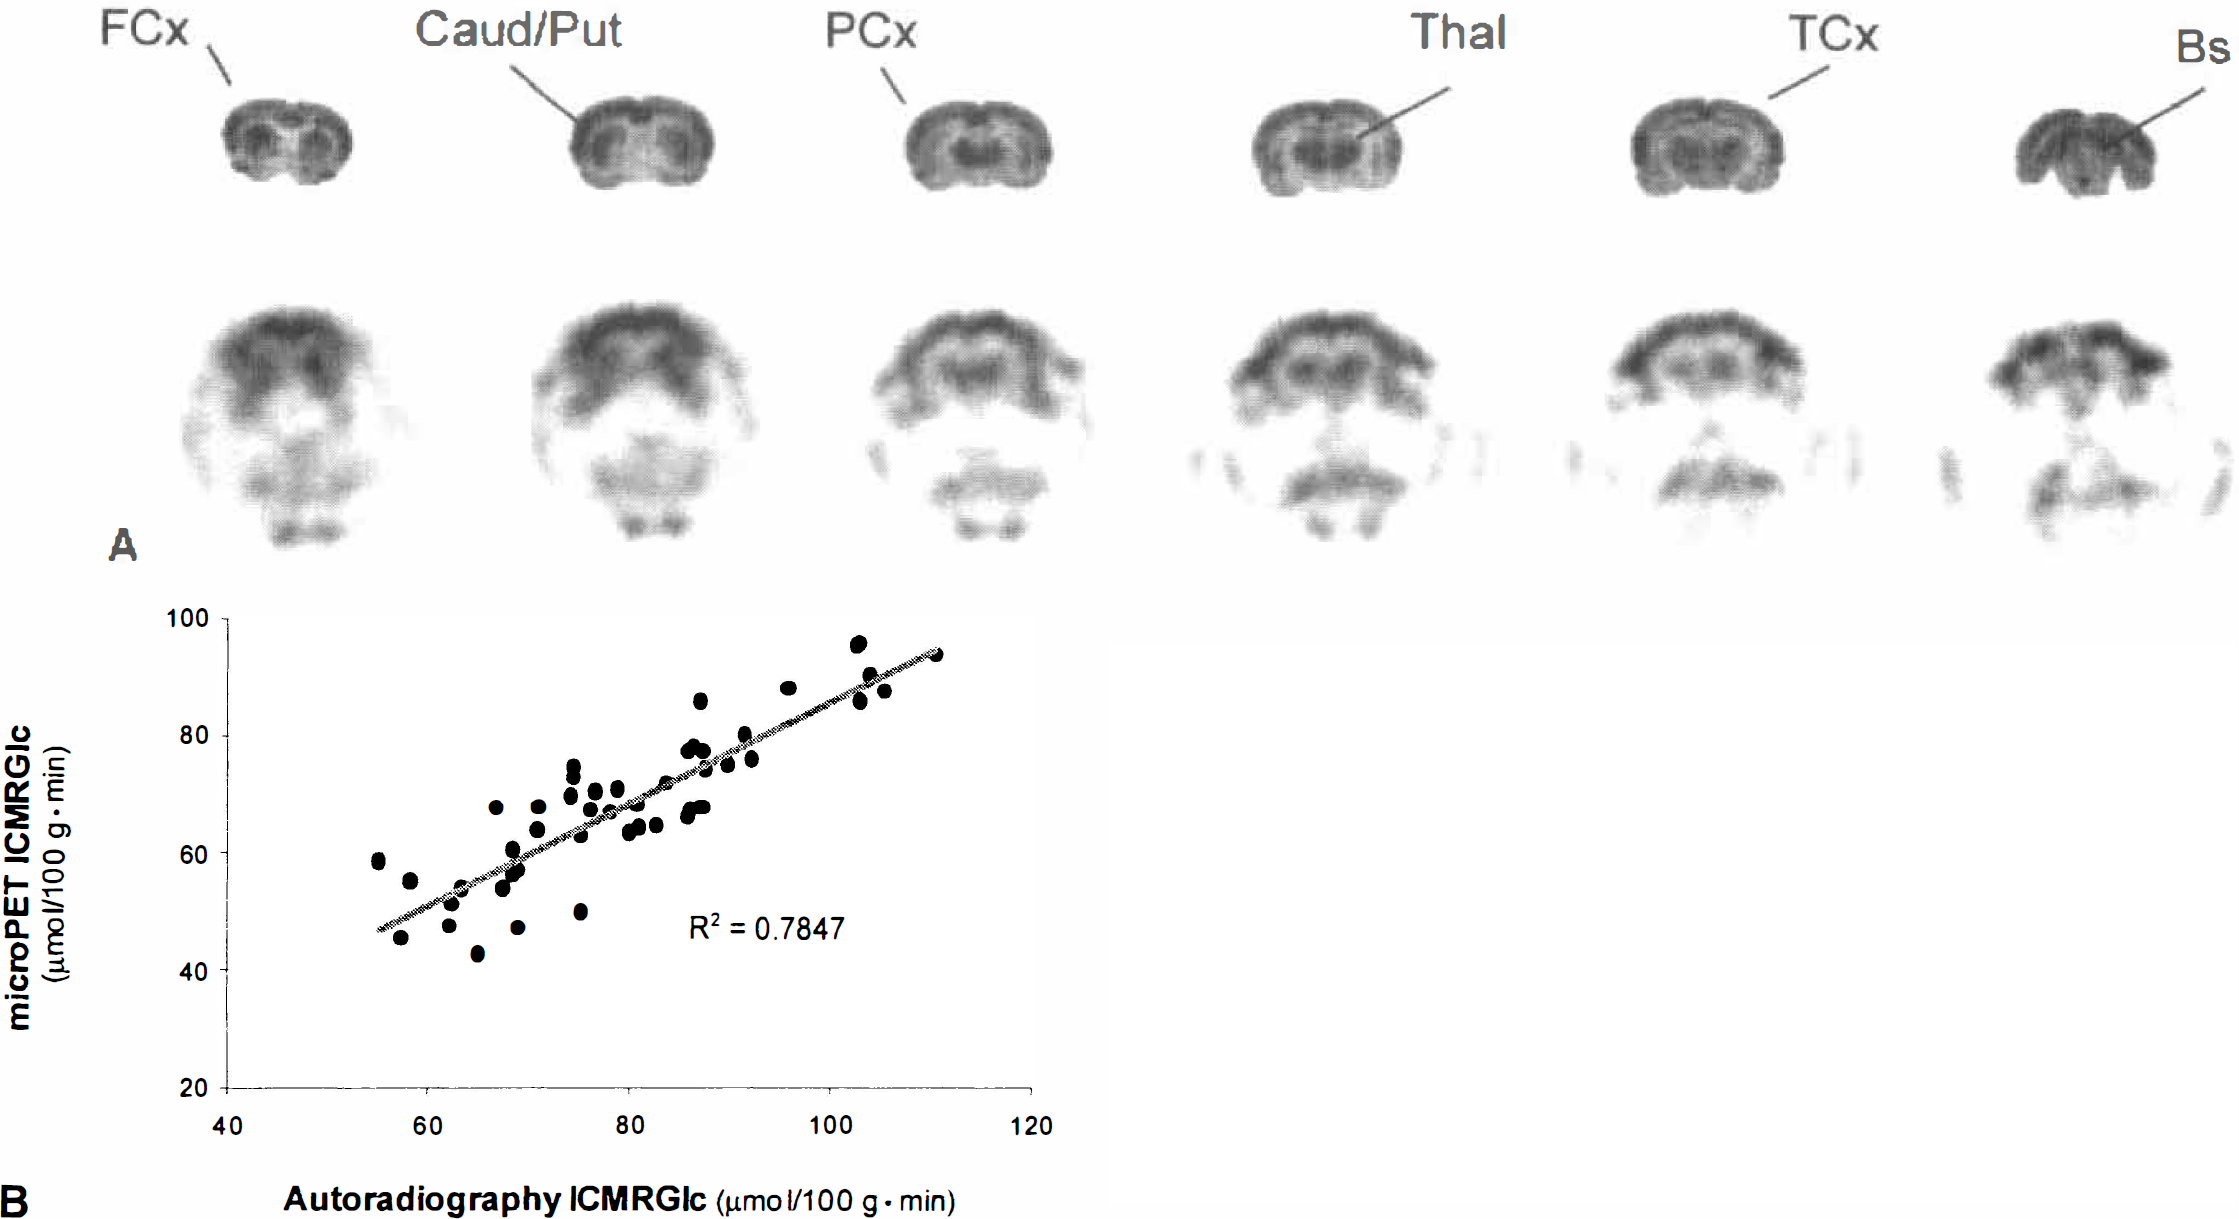
Comparison of FDG-microPET and FDG-autoradiography.
LCMRGlc after traumatic brain injury
All animals (n = 6) completed the pre-and postinjury FDG-PET studies followed by 2DG autoradiography without complication. The LFP injury resulted in mean (± SD) apnea and unconscious periods of 24.5 ± 16.5 seconds and 3.25 ± 1.20 minutes, respectively. In addition, blood gas measurements were within normal physiologic range (pH = 7.37 ± 0.19; pO2 = 93.0 ± 12.1; pCO2 = 40.0 ± 2.6). Histologic evaluation revealed no gross morphologic damage.
FDG-microPET.
Repeated FDG-microPET scans in two sham animals showed a significant relation of lCMRGlc values between scan sessions (r = 0.88, 0.89; F1,6 = 23.4, 25.1, respectively, P < 0.01; Fig. 3). Representative microPET images preinjury and 1 day postinjury within the same animal are displayed in Fig. 4A, demonstrating injury-induced metabolic changes within an animal. Baseline quantitative microPET studies did not show metabolic asymmetry in any structure examined (P > 0.05). However, after LFP injury, a significant depression was evident in all regions ipsilateral to the site of impact relative to the contralateral homotopic regions (F[1,10] = 27.82;P < 0.001). The greatest decreases were observed in the ipsilateral frontal cortex (18.0 ± 13.3%) and parietal cortex (22.5 ± 18.7%). Substantial metabolic depression was also observed in the caudate–putamen (17.4 ± 12.3%) and thalamus (13.5 ± 6.5%) (Fig. 4B). This degree of injury-induced metabolic depression is in agreement with values previously reported from the authors' laboratory (Yoshino et al., 1991).
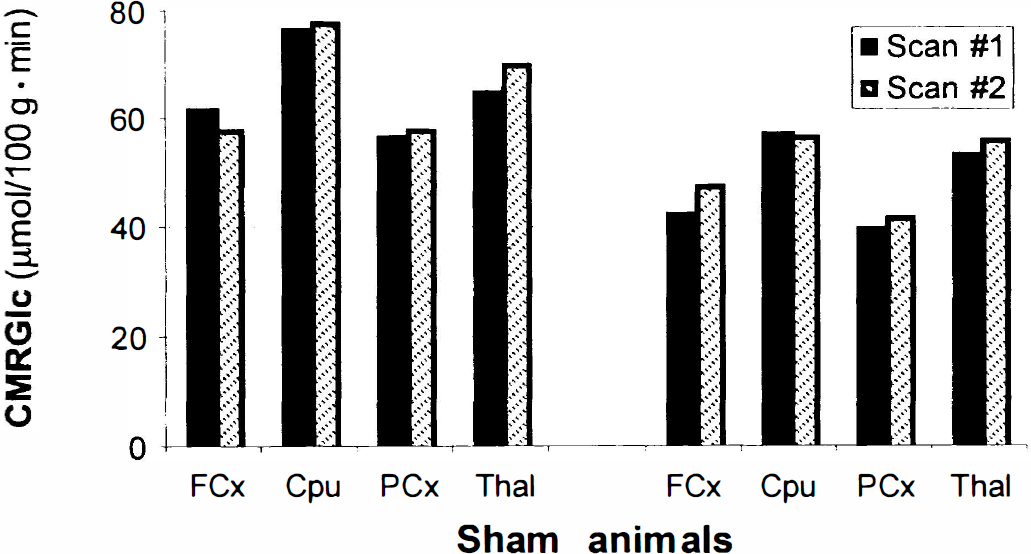
Consistency of lCMRGlc values across two FDG-microPET scans in sham animals. Two animals underwent quantitative FDG-microPET scans before (scan 1) and 1 day after sham surgery (scan 2) to demonstrate that lCMRGlc values are unchanged over this time interval. LCMRGlc values did not significantly differ (P > 0.05) between scans within animal as determined by a sample paired Student's t-test.
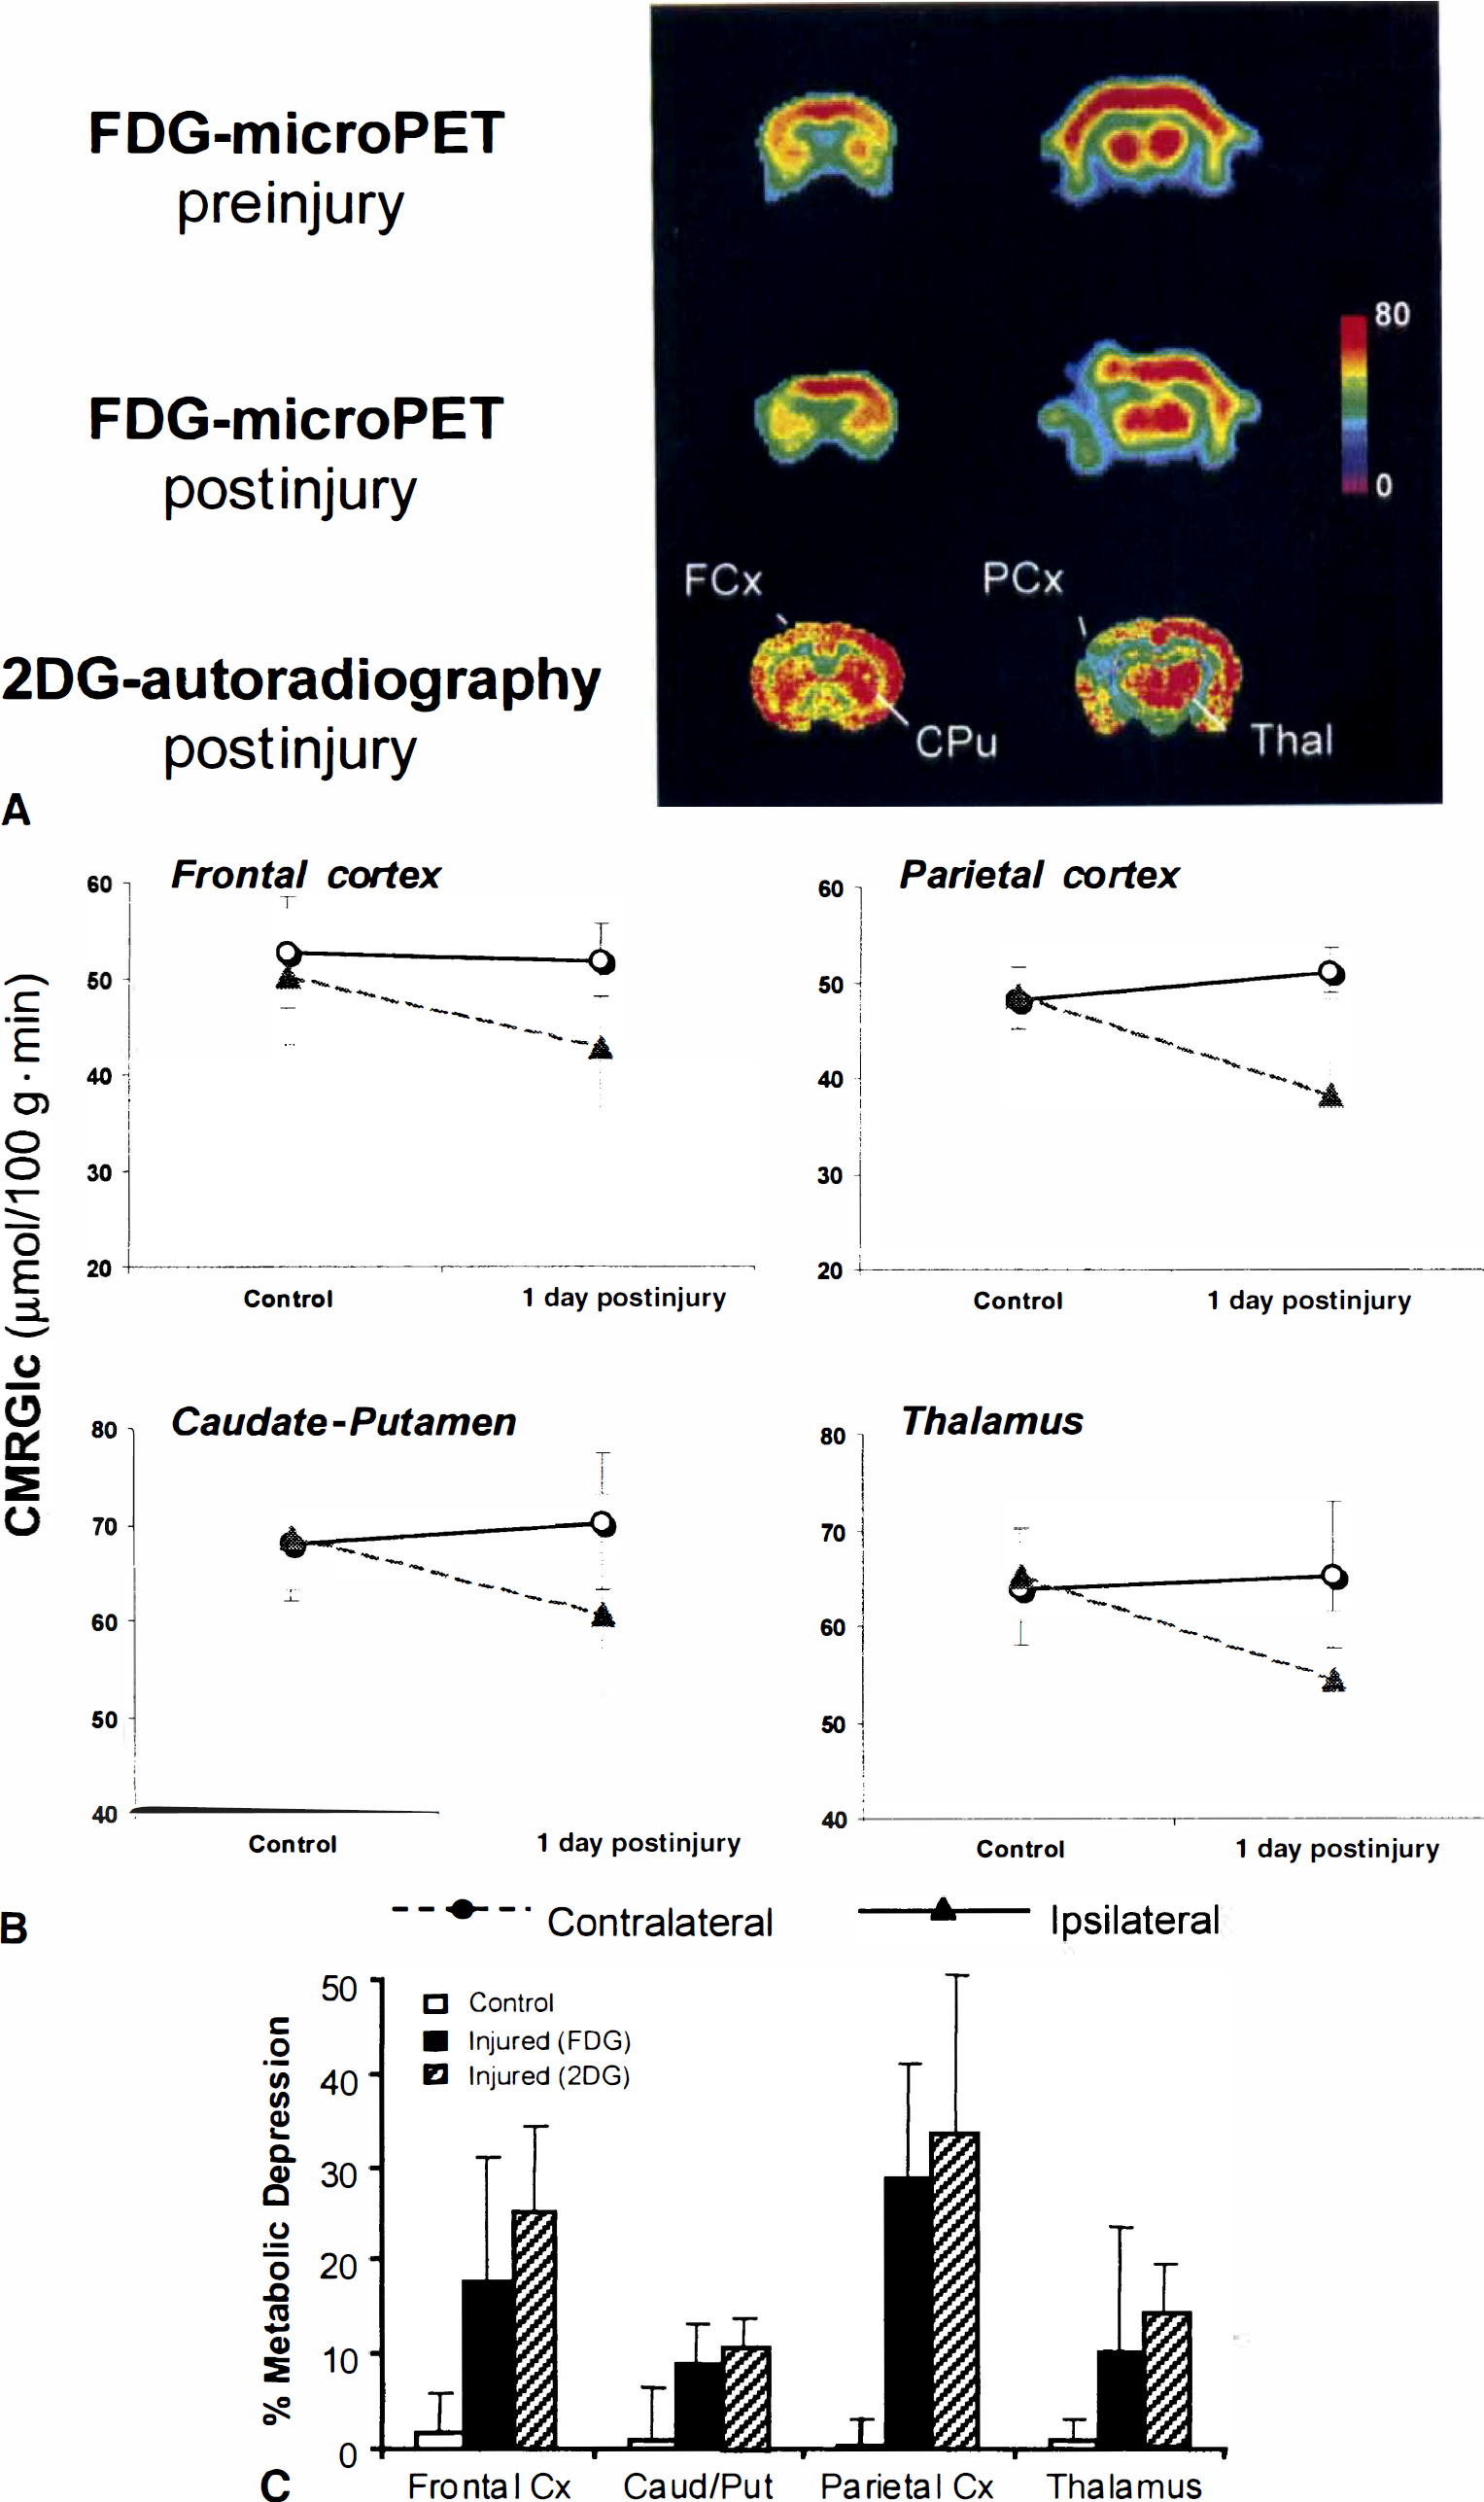
Evidence of metabolic depression after lateral fluid percussion (LFP) injury within the same animal using FDG-microPET.
2DG autoradiography.
As calculated by 2DG autoradiography, lCMRGlc values for frontal and parietal cortices on the injured (ipsilateral) side were 56.8 ± 13.0 and 48.2 ± 18.0 μmol/100 g·min, respectively. In contrast, the lCMRGlc measurements in the noninjured (contralateral) frontal and parietal cortex were 74.6 ± 18.8 and 70.9 ± 18.5 μmol/100 g·min, respectively. The thalamus demonstrated a mean lCMRGlc value of 70.1 ± 20.7 in the injured region compared with 82.5 ± 21.2 μmol/100 g·min in the noninjured region. The caudate–putamen exhibited rates of 79.5 ± 18.2 and 84.6 ± 20.7 μmol/100 g·min in injured and noninjured areas, respectively.
The metabolic depression detected by FDG-microPET was further supported by 2DG autoradiography. 2DG values were significantly similar to the microPET measures of metabolic dysfunction (r = 0.468; F[1,22] = 6.18;P < 0.05). As observed in the microPET results (Fig. 4C), the greatest degree of depression was found in the ipsilateral frontal and parietal cortices with average decreases of 25.2 ± 9.2% and 33.7 ± 16.8%, respectively, relative to contralateral regions. 2DG autoradiography revealed a comparable depression of 14.5 ± 5.1% in the ipsilateral thalamus; however, a smaller magnitude of metabolic asymmetry was seen in the caudate–putamen, showing a depression of 5.7 ± 4.0% in the ipsilateral area compared with the contralateral region.
Metabolic and behavioral recovery after LFP injury
As previously described, baseline quantitative microPET studies did not show metabolic asymmetry in any structure examined (P > 0.05) with lCMRGlc values ranging from 50.1 to 82.3 μmol/100 g·min. However, after LFP injury, a significant effect of time on lCMRGlc was observed (F[4,16] = 3.08;P <0.05) in regions ipsilateral to the site of injury with cortical lCMRGlc being significantly depressed at 2 to 3 days postinjury (41.7 to 68.4 μmol/100 g·min;P < 0.05) and recovering to baseline values by 10 days postinjury (Fig. 5).
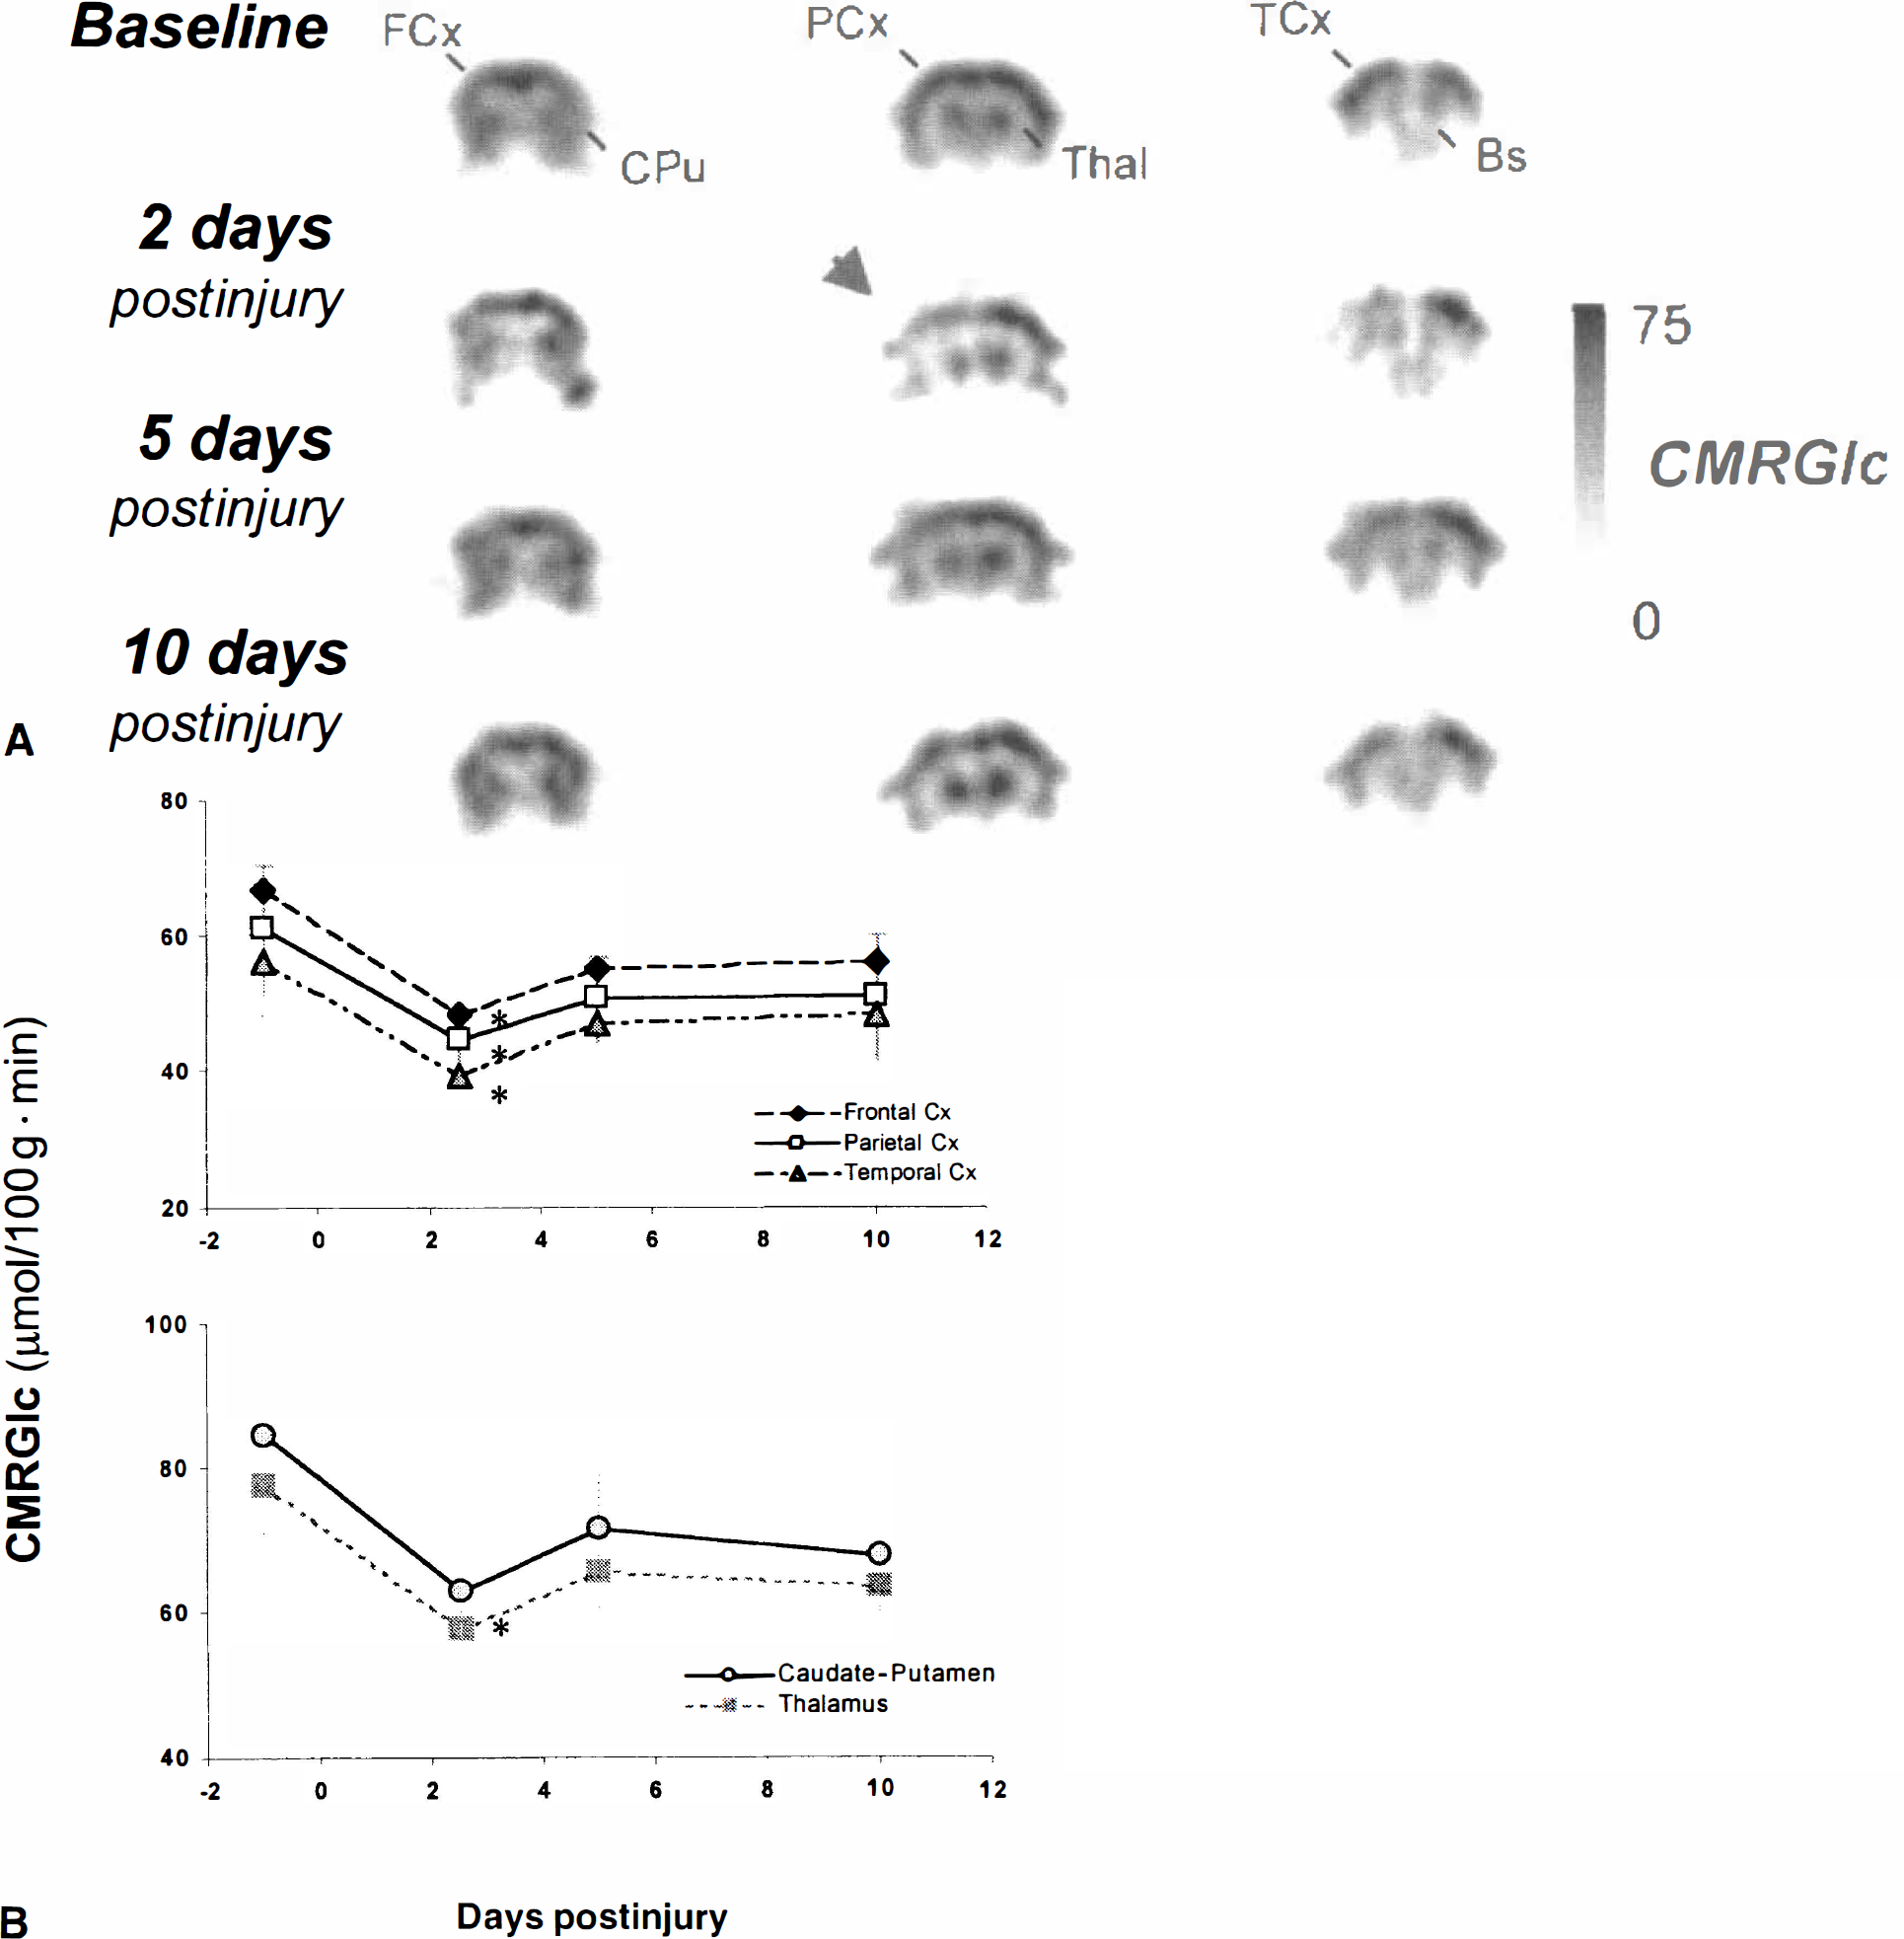
Cerebral glucose metabolism after traumatic brain injury. Animals (n = 6) underwent quantitative FDG-microPET studies before and at 2, 5, and 10 days after a moderate lateral fluid percussion injury.
Similarly, there was a significant effect of time after injury on Morris Water Maze performance (F[13,86] = 11.5;P < 0.05) with significantly poorer cognitive-behavioral performance up to 3 days postinjury (P < 0.05) compared with baseline measurements. Mean escape latencies returned to baseline values by 9 days postinjury. A significant correlation between the duration metabolic depression and behavioral deficits was found (r = 0.65;P < 0.05; Fig. 6), suggesting the use of lCMRGlc as a predictor for behavioral recovery after LFP injury.
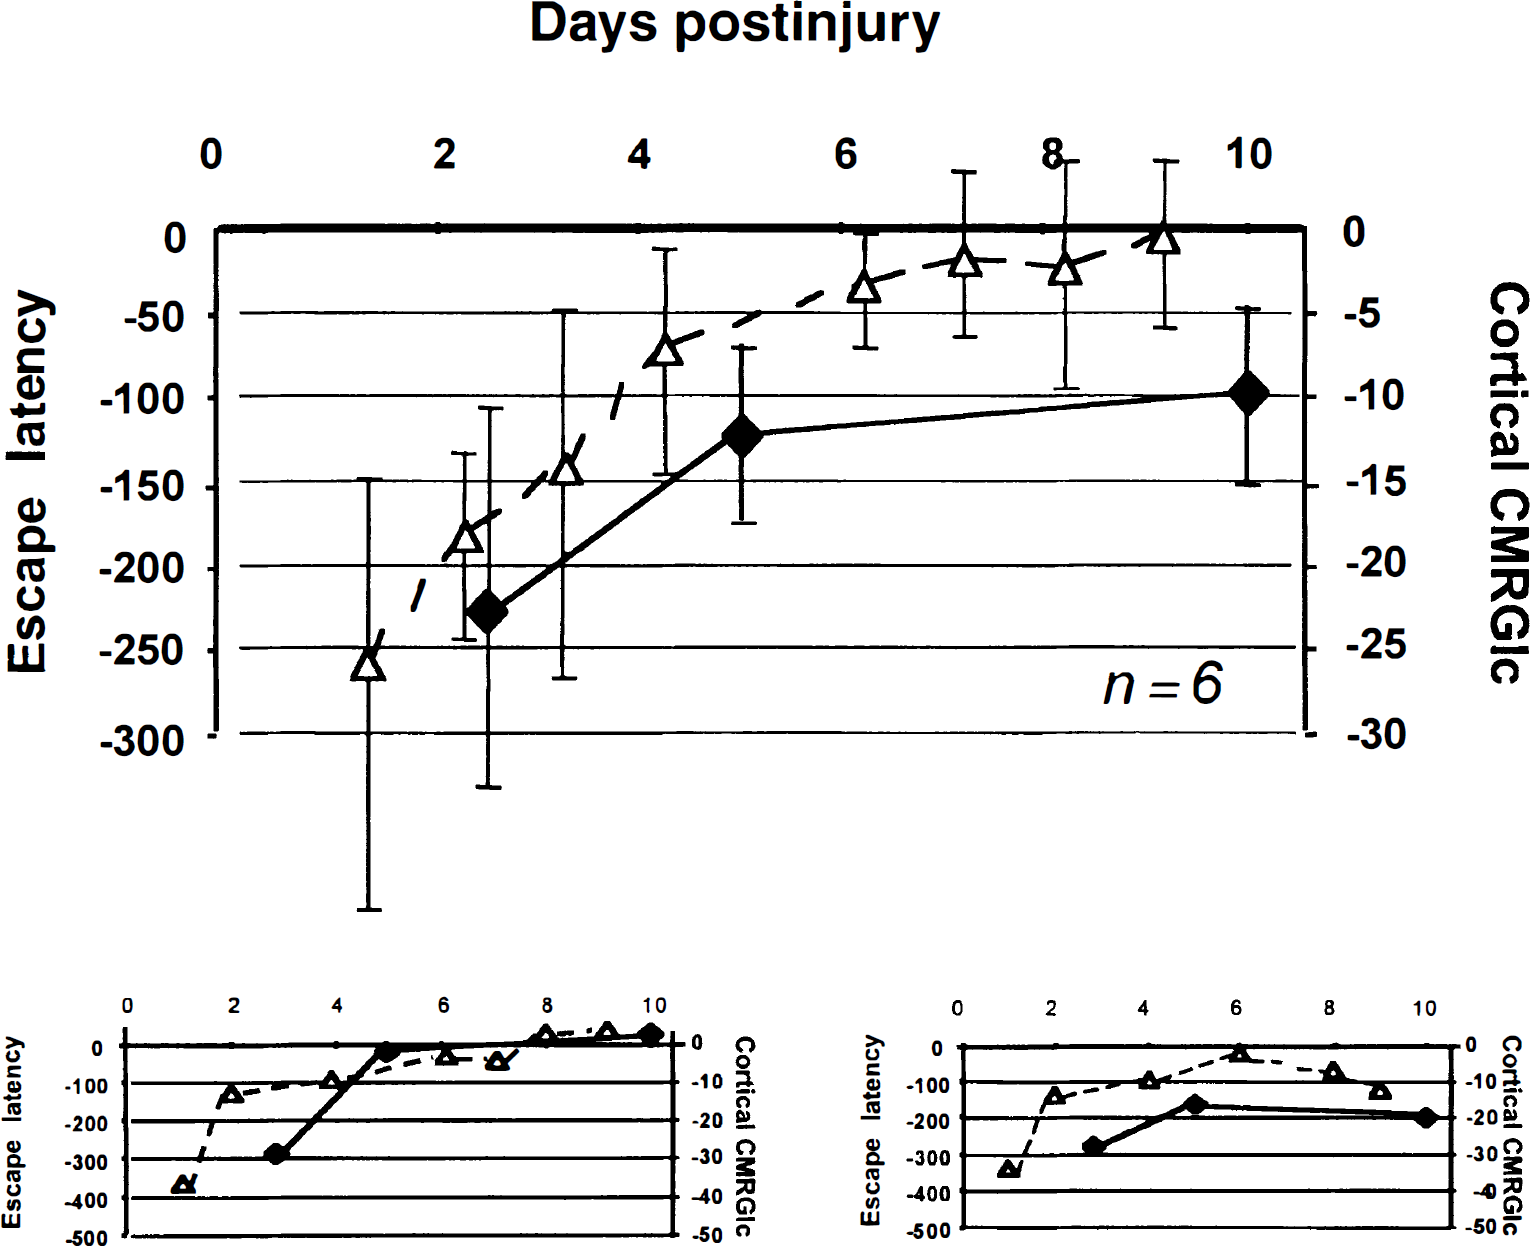
Comparison of metabolic recovery (♦) with behavioral recovery (▵) as measured by quantitative FDG-microPET and Morris Water Maze escape latency, respectively, in the same group of animals (n = 6). Data are presented as percent of baseline values. The top graph displays mean values of all animals (± SD). Pearson product moment correlation found a significant relation between cortical lCMRGlc values and escape latencies (r = 0.65;P < 0.05). The lower graphs represent two individual animals, illustrating the ability to address intersubject variability in the relation between behavioral and metabolic recovery.
DISCUSSION
This is the first report of the application of microPET to quantify rates of glucose metabolism in rat brain. These data demonstrate the validity and sensitivity of the microPET to determine glucose metabolism in the rat brain across-and within-subjects by comparing lCMRGlc values calculated from FDG-microPET to those determined using FDG-and 2DG-autoradiography. In addition, the authors have provided the first data on concurrent repeated measurements of cerebral metabolism and behavior within the same animals, illustrating the potential application of microPET in rodent models.
The current research enables investigators a unique opportunity to longitudinally assess cerebral glucose metabolism in rat animal models. However, it is necessary to discuss several issues that may contribute to the interpretation of this data.
Methodologic issues
Partial volume effect.
One factor that must be taken into consideration is the influence of partial volume effects on the quantification of lCMRGlc in specific regions of the rat brain. As stated by Hoffman and colleagues (1979), any structure that is smaller than twice the tomograph resolution (2 × full width at half maximum [FWHM]) will be subject to underestimation because of the redistribution of activity over a larger area that leads to a decrease in absolute count density in regions of high uptake (for example, gray matter). In addition, this spillover of activity creates less distinct delineation between gray and white matter, a border that is commonly used to define regions of interest. Even though the microPET provides resolution of 1.8 mm FWHM, many structures in the rat brain are smaller than 3.6 mm and, therefore, the calculated rates in gray matter will reflect the combination of loss of activity within the structure of interest and the contribution of activity from neighboring structures.
The authors minimized any bias that may be created when determining regions of interest on a functional image by visually coregistering the FDG-microPET images to images of higher spatial resolution (cresyl violet stained sections or autoradiograms). Regions of interest, ranging from 3.98 to 11.0 mm2, were determined on the higher resolution image and then transferred onto the FDG-microPET image. These regions of interest appeared larger than one would draw independently on PET images, however the calculated lCMRGlc values represent the anatomically-defined regions, which are more appropriate to evaluate the accuracy of quantification on the microPET, rather than using the regions of highest activity. However, this method may maximize partial volume effects, leading to underestimation of gray matter metabolic rates because of the contribution of white matter activity. In the current study, the authors observed an underestimation of lCMRGlc values of ∼17% by FDG-microPET relative to those calculated with autoradiography. More sophisticated experiments are required to specifically determine the influence of partial volume effects and the appropriate correction procedures.
Contribution of extracranial isotope accumulation in the Harderian glands
A recent report (Kuge et al., 1997) states that lCMRGlc quantification in rat brain using PET is not attainable because of the influence of radioactivity from the intraorbital Harderian glands, structures of high FDG uptake, on the activity in the rostral portion of the brain. Although this argument may apply to studies performed in tomographs with poorer resolution, the microPET images show clear separation of the Harderian glands from the brain. Also, there was no indication of disturbance by Harderian gland activity in the current data because the magnitude of discrepancy between lCMRGlc values of each imaging technique was not different for the rostral regions (frontal cortex, caudate–putamen) compared with more caudal regions (parietal cortex, thalamus; see Results). In addition to differences in region of interest size and placement between studies, this lack of effect is probably because of the increased resolution of the microPET (FWHM = ∼1.8 mm) compared with the scanner used by Kuge et al. (1997) (ECAT EXACT-HR/47, FWHM = 3.7 mm). Regardless, the results from the current study indicate that quantification of lCMRGlc in rat brain using microPET is feasible and is not confounded by isotope accumulation in the Harderian glands.
Glucose-6-phosphatase activity
Another methodologic consideration is the procedure to calculate lCMRGlc using FDG-autoradiography. In this study, the authors applied the protocol as described by Ackermann and Lear (1989) who used FDG to quantify lCMRGlc in double-label studies that were completed within 60 minutes after FDG administration. The animals used in the current study remained alive during the PET acquisition and were not killed until 90 to 100 minutes after the dose of FDG. However, the operational equation used to calculate lCMRGlc did not include k4, the rate constant that accounts for dephosphorlyation of FDG-6-phosphate to FDG. Although the authors calculated microPET lCMRGlc values from the last frame of data acquisition to make the comparison of FDG-microPET and autoradiographic metabolic values valid, these values may be underestimations of true cerebral metabolic rates because of loss of FDG-6-phosphate by phosphatase activity. To address this possibility, the authors performed 2DG autoradiography studies (n = 4) killing the animals at 100 minutes post-2 dayG injection. lCMRGlc values ranged from 40.5 to 75.9 μmol/100 g·min and, although consistently lower, remained within one standard deviation of reported lCMRGlc values with experimental periods of 45 minutes (Yoshino et al., 1991). Furthermore, comparison of FDG-microPET lCMRGlc values with those determined with 2 dayG autoradiography (experimental period = 45 minutes) revealed the same degree of underestimation as comparison with FDG-autoradiography (experimental period = 90 minutes), an unexpected result if phosphatase activity was considerable. Based on these results, the reported lCMRGlc values calculated from FDG-autoradiography were most likely accurate estimations of cerebral glucose metabolism with minimal radioactivity loss becaus of k4.
Traumatic brain injury model
To determine the sensitivity of FDG-microPET to detect change in lCMRGlc, the authors used an experimental model of traumatic brain injury. This injury causes dynamic changes in metabolism as characterized by an acute period of hyperglycolysis followed by a metabolic depression at 6 hours postinjury that is maintained for 3 days with recovery to normal values by 10 days after injury (Yoshino et al., 1991). The metabolic depression occurs predominantly on the side ipsilateral to the site of impact and in the absence of cell loss. Therefore, this experimental model provides the opportunity to detect changes in lCMRGlc between scans and between hemispheres without the confounding factor of neuropathology. According to the current results, the degree of metabolic depression assessed by the microPET was not statistically different from values observed by traditional 2 dayG autoradiography at 2 days postinjury. It should be noted that the authors chose to compare imaging techniques at the time point of maximum metabolic depression (Yoshino et al., 1991). Future studies will focus on extending the survival period after injury and systematically evaluating the recovery of glucose metabolism using FDG-microPET.
In conclusion, the authors have demonstrated that quantitative FDG-microPET studies provide reproducible lCMRGlc values that, although lower than autoradiographic values, represent valid estimations of cerebral glucose metabolism. The relative decrease in lCMRGlc values can be largely attributed to the inherent presence of partial volume effects. However, extracranial isotope activity from the Harderian glands appears to have a minimal effect. Furthermore, the current data indicate that FDG-microPET is sensitive to metabolic changes that occur after traumatic brain injury. Finally, longitudinal FDG-microPET studies conducted concurrently with behavioral studies revealed a significant correlation between duration of metabolic depression and cognitive dysfunction traumatic brain injury, illustrating the novel opportunity and value of using in vivo molecular imaging within the same animals to examine intersubject variability and neuroprotective–restorative agents. Although several methodologic issues need to be addressed, primarily the influence of partial volume errors, these data put forth convincing evidence of the potential of high-resolution small-animal microPET to repeatedly measure lCMRGlc; and other markers of neuronal activity in general regions of the rat brain.
Footnotes
Acknowledgements
The authors thank Richard Leahy and Jinyi Qi for providing MAP reconstruction software; Yiping Shao, Robert Silverman, Stefan Siegel, and Ken Meadors for assistance in the development of the microPET scanner; and the staff of the UCLA animal PET, the cyclotron facilities, and the Brain Injury Research Program for their skilled technical support.