
Abstract
Cerebral glucose utilization was higher during the first positron emission tomography (PET) session than during the second session, as assayed using the PET [18F]fluorodeoxyglucose method in male human volunteers. This difference was due largely to data from subjects with low trait anxiety, since subjects with high anxiety showed similar metabolism in both PET sessions. High-anxiety subjects showed greater right/left ratios of cerebral metabolism than low-anxiety subjects, particularly during the second PET session. These findings suggest that the level of anxiety may be an important variable to consider in PET studies using multiple sessions.
Positron emission tomographic (PET) studies frequently utilize repeated-measures designs, with the same subjects participating in two PET assays under different treatment conditions. Concern has been raised about possible confounding effects due to the novelty of the situation during the first session. Furthermore, it has been suggested that patterns of metabolic activity might provide information concerning brain substrates underlying anxiety or stress (Reivich et al., 1983).
Studies of cerebral blood flow using 133Xe have shown higher rates during the first of two test sessions (Prohovnik et al., 1980; Warach et al., 1987; Warach et al., 1992). A preliminary report of a study using [18F]fluorodeoxyglucose (FDG) indicated that regional CMRglc (rCMRglc) values in normal subjects were higher during the first PET session than the second (Metz et al., 1989). The difference was small but statistically significant and was largest in temporal cortex. A trend in the same direction has been reported in some studies (Tyler et al., 1988; Camargo et al., 1992), but other studies have reported data with no trends or a trend toward lower metabolic rates during the first session (Brooks et al., 1987; Duara et al., 1987: Bartlett et al., 1988; Maquet et al., 1990).
These studies differed in several important methodological details. One study (Bartlett et al., 1988) used [11C]deoxyglucose, the others FDG. One study (Duara et al., 1987) used elderly subjects. Two studies (Tyler et al., 1988; Maquet et al., 1990) used arterial blood sampling; the others sampled arterialized venous blood. The time between the first and second scans varied from 1 h (Brooks et al., 1987) to up to 12 weeks (Maquet et al., 1990). The number of normal subjects studied ranged from 2 (Brooks et al., 1987) to 22 (Bartlett et al., 1988). Resting state studies were performed with or without eyes and/or ears occluded, and one study used an activation condition as well (Duara et al., 1987). Such differences in experimental design can contribute to inconsistencies in reports of order effects on rCMRglc, but personality traits of the subjects may also play an important role with respect to this issue.
Metabolic rates for glucose were reported to be uncorrelated with subjective ratings of stress or with measures of anxiety in some studies (Bartlett et al., 1988; Mountz et al., 1989; Giordani et al., 1990), but scores on the Tension-Anxiety scale of the Profile of Mood States (POMS) were reported to be higher during the first than the second of two PET assays (Metz et al., 1989). Studies of cerebral blood flow using 133Xe have found a negative relationship between anxiety and cerebral blood flow in patients with generalized anxiety disorder or moderately high levels of self-reported anxiety (Rodriguez et al., 1989; Matthew and Wilson, 1990). One study reported a negative correlation between anxiety and cortical rCMRglc as well as an inverted U relationship between anxiety and cerebral blood flow (Gur et al., 1987). The authors concluded that there is a curvilinear relationship between anxiety and cortical activity (Gur et al., 1987). It has also been suggested that subjects with high anxiety scores have higher right/left ratios of metabolism than subjects with low anxiety scores (Reivich et al., 1982).
The present study was designed to answer the question of whether there are order effects on glucose metabolism in repeated PET sessions and whether any such effects are related to the individual level of anxiety. Subjects were tested twice under the same conditions, and trait anxiety was assessed with a well-accepted, standardized measure.
METHODS
Subjects were 12 healthy, right-handed men, 23–43 years of age (mean ± SD = 28.9 ± 4.2 years). They were recruited by newspaper advertisements and were paid for their participation. Most had completed high school (education, mean ± SD 12.6 ± 1.7 years). They showed no pathological conditions in a complete physical examination and in standard diagnostic tests, including complete blood cell count, serum electrolyte assay, liver function tests, fasting blood glucose level, prothrombin and partial thromboplastin times, thyroid function tests, urinalysis, electrocardiography, and tests for exposure to tuberculosis, viral hepatitis, and human immunodeficiency virus I. Patency of radial and ulnar arteries in both arms was demonstrated by Allen's test.
Subjects denied any history of neurological disorder, psychiatric illness, or intravenous drug use. A score of at least 18 on the Vocabulary subtest of the Shipley Institute of Living Scale was required (Zachary, 1986). Subjects were excluded from further study if they showed any visible brain abnormality on research noncontrast x-ray computed tomography (CT) or magnetic resonance imaging (MRI) scan of the brain. All subjects gave informed consent under the supervision of the institutional review boards of the Johns Hopkins Hospital and Francis Scott Key Medical Center, Baltimore, MD, U.S.A., which houses the Addiction Research Center.
During the study, all subjects resided on a supervised residential unit where they had no access to drugs except for nicotine (cigarettes) and caffeine (beverages). They were admitted to the unit at least 11 days (mean ± SD 22.6 ± 8.6 days) before the first PET session. Each subject participated in two PET assays separated by 3–18 days (mean ± SD 8.7 ± 5.2 days). Prior to the first PET scan, they participated in one preliminary session to familiarize them with the procedures. Subjects received a battery of psychological tests, including the Spielberger State Trait Anxiety Inventory (STAI) (Spielberger, 1983) and the National Institute of Mental Health Diagnostic Interview Schedule, modified for computerized self-administration (C-DIS) (Robins et al., 1981). With use of criteria of the Diagnostic and Statistical Manual of Mental Disorders (DSM-III), the following diagnoses were found: Tobacco Dependence, six; Alcohol Dependence, two; Marijuana Abuse, one; and Antisocial Personality, two (American Psychiatric Association, 1980). No other diagnoses were found, and five subjects did not meet criteria for any Axis I or II diagnosis.
Procedures for PET data collection have previously been described in detail (London et al., 1990) and are briefly summarized here. Each subject was fitted with a molded plastic face mask to facilitate positioning in the PET scanner as well as for CT and/or MRI scanning. On the day of a PET scan, the subject was given a standard nonketogenic breakfast and then was deprived of food for at least 4 h and of cigarettes for at least 2 h before the radiotracer injection. A radial arterial catheter was inserted after the administration of local anesthetic (0.5% lidocaine HCl s.c.). Intravenous catheters were placed in forearm veins of both arms. An intravenous infusion of 0.45% NaCl was initiated in the arm opposite to the arterial catheter. Subjects received an intravenous injection of 0.9% NaCl simultaneously with the injection of radiotracer (5 mCi FDG). Subjects knew that the saline injection would not contain active drug in any session. Vital signs were monitored during all studies. All studies were performed in the afternoon, with FDG injection between 12:30 and 3:30 p.m.
Subjects completed a set of questionnaires at −60 min before, 30 min before, and 30 min after the radiotracer injection. Questionnaires included the POMS, with scales for Tension, Depression, Anger, Vigor, Fatigue, and Confusion (McNair et al., 1981), the Cocaine Sensitive Scale (CSS) (Muntaner et al., 1989), and three subscales from the Addiction Research Center Inventory (Haertzen, 1974). For −30 min before and 30 min after injection of the radiotracer, subjects were blindfolded and under headphones with white noise and a tone presented once per minute to prompt a subjective self-report of any effect of the injection of NaCl given along with the FDG. The CSS was also administered over the headphones at 1, 5, 15, and 20 min after the injection, with the subject giving verbal responses. The CSS was completed in <1 min each time. Placebo injection and questionnaires sensitive to drug effects were given so that the procedures would be comparable to studies in our laboratory with substance abuse subjects (Stapleton et al., 1995). All procedures were identical for the two PET scans.
PET data were collected using the FDG procedure as previously described, including arterial blood sampling on a fixed schedule (London et al., 1990). Twelve images, on 8-mm centers parallel to the infraorbitomeatal plane, were obtained. Modeling of metabolic rates was performed using the operational equation of Huang et al. (1980), and data were quantified using a PET image analysis system (LOATS Associates, Westminster, MD, U.S.A.). Regions of interest (ROI) were located using an anatomical atlas (Hanaway et al., 1980) and have been shown previously (Stapleton et al., 1995). Regions of interest were located visually on PET images obtained from each session, with viewing of the CT or MRI films to guide anatomical placement. Average rCMRglc for each slice was determined using an edge-finding algorithm. Global CMRglc was estimated by computing the weighted average of the slices used for analysis of ROI.
To assess the effects of anxiety on cerebral glucose metabolism, subjects were divided into two groups based on their trait anxiety score on the STAI (Spielberger, 1983). The high-anxiety group (n = 7) had scores at or above the median of the sample, which was 35 (57th percentile of published norms).
Statistical comparisons were performed with a criterion of p < 0.05 using BMDP 4v for analysis of variance (ANOVA) with Group as a between-group factor and Session, Laterality, and/or Time as within-group factors (Dixon et al., 1988). Greenhouse-Geisser correction was used as appropriate. Correlational analyses were performed using BMDP 8d with a criterion of r > 0.7069 or r < −0.7069 (critical value for n = 12, p < 0.01, two-tailed).
RESULTS
Global glucose metabolism data were submitted to ANOVA with factors of Group (high or low anxiety) by Session (PET 1 or PET 2). A statistically significant main effect of Session (p < 0.03) was found, with global glucose metabolism higher during PET 1 than PET 2 (Table 1). There were no statistically significant effects of the factor of Group or the Group-by-Session interaction on global glucose metabolism.
Mean rCMRglc (mg/100g/min) ± standard deviation
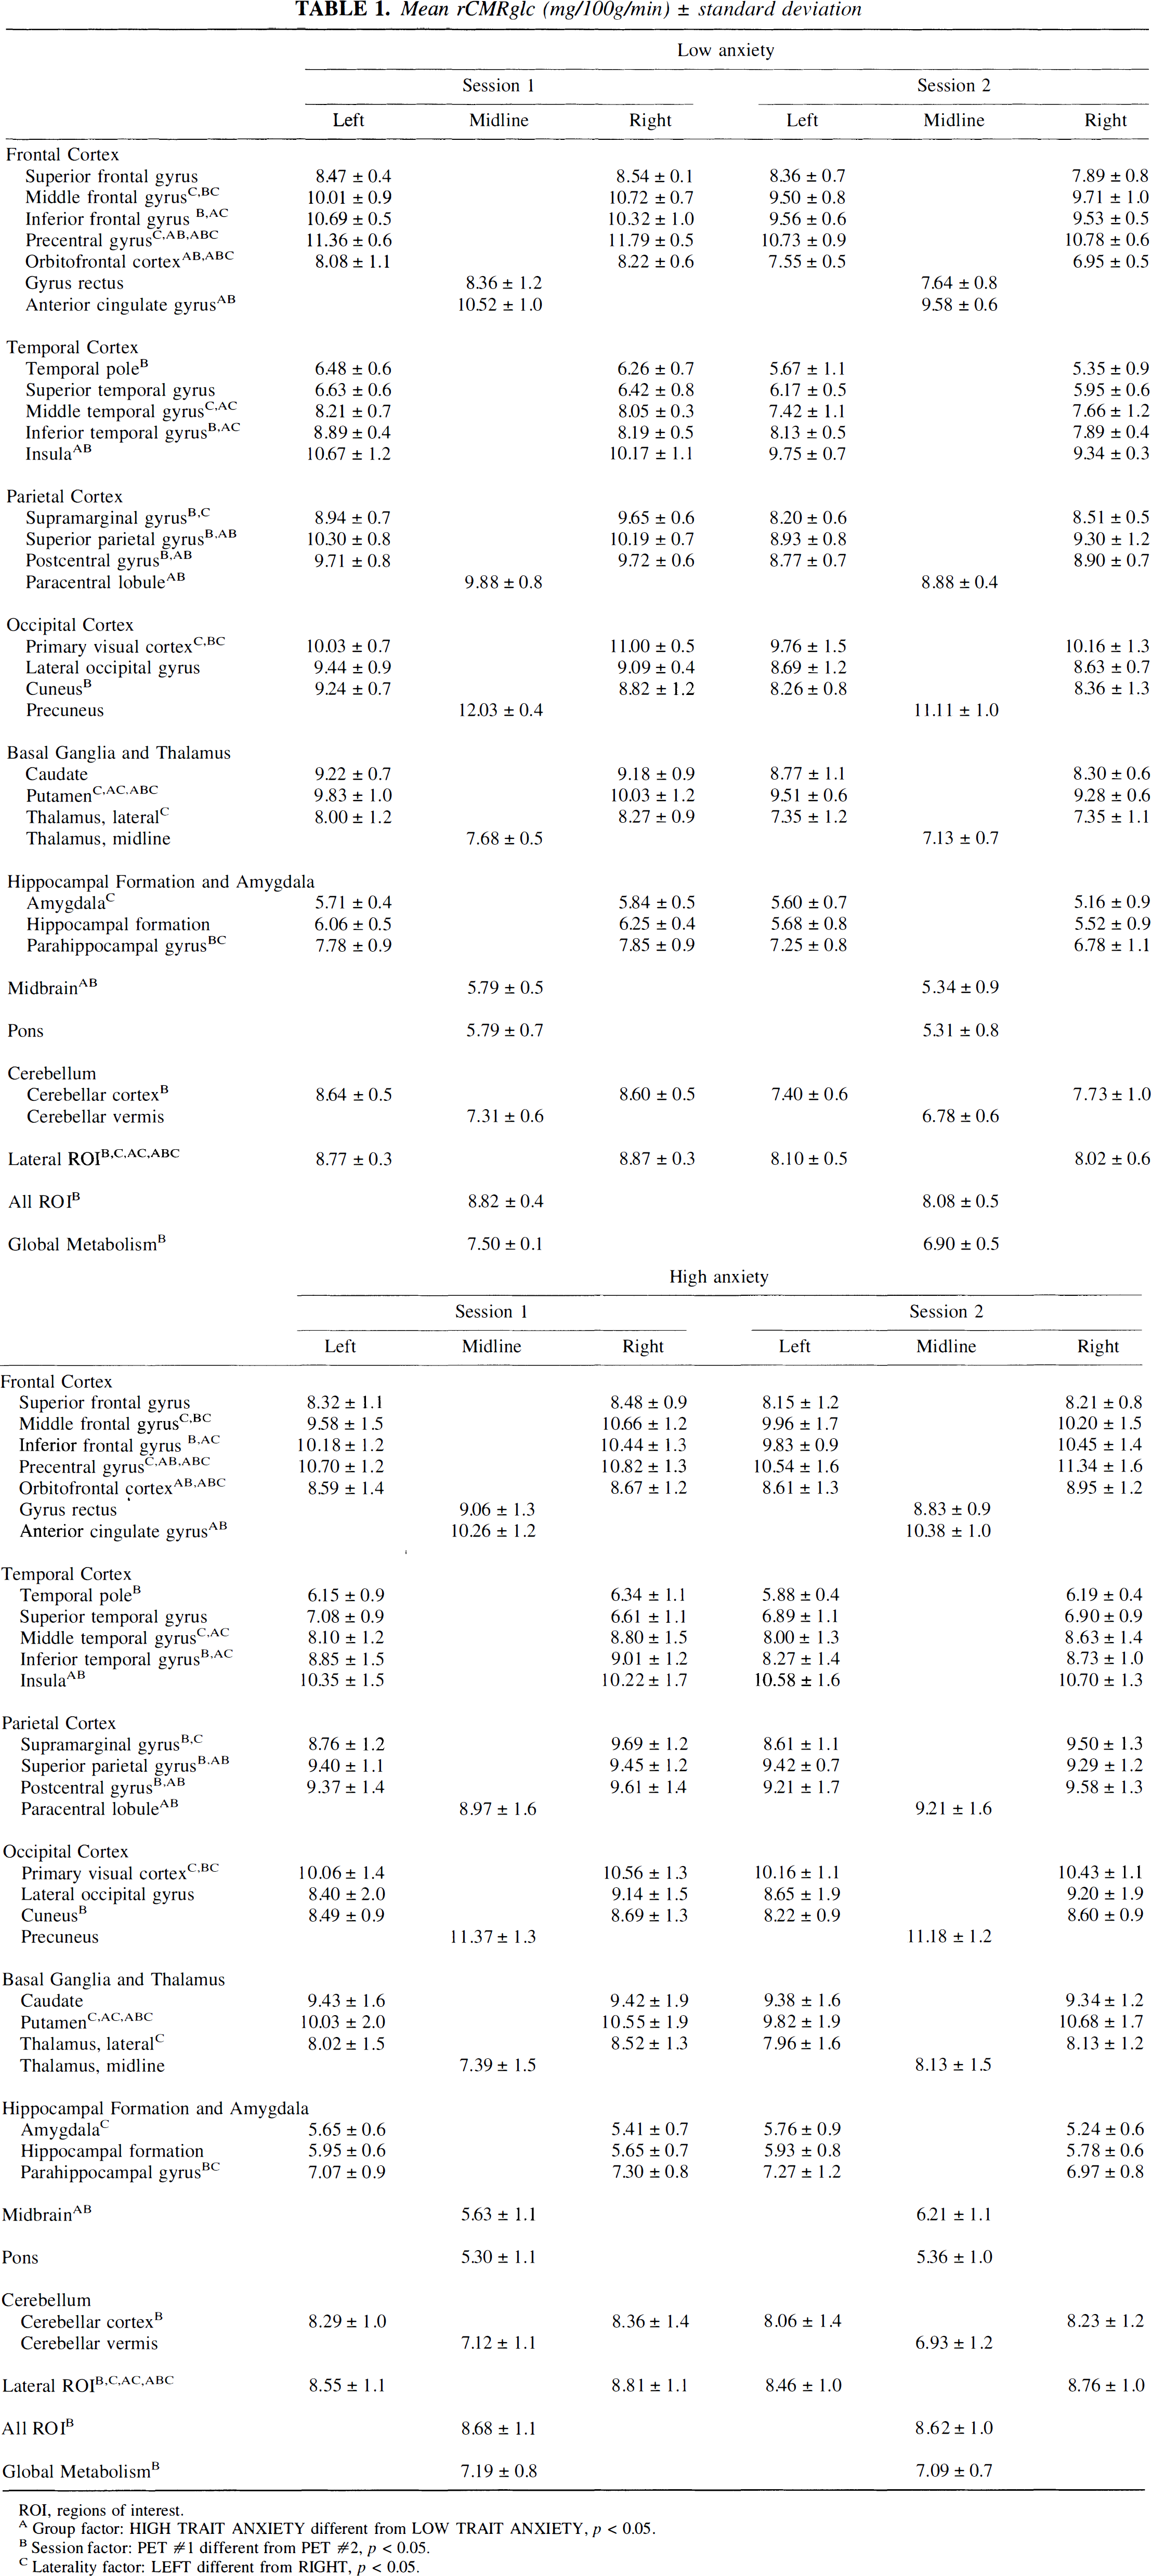
ROI, regions of interest.
Group factor: HIGH TRAIT ANXIETY different from LOW TRAIT ANXIETY, p < 0.05.
Session factor: PET #1 different from PET #2, p < 0.05.
Laterality factor: LEFT different from RIGHT, p < 0.05.
Composite scores derived from the average of all lateral ROI weighted by area (Fig. 1) were submitted to ANOVA with factors of Group (high or low anxiety) by Session (PET 1 or PET 2) by Laterality (left or right). This analysis yielded a statistically significant interaction of all three factors (p < 0.05) and a significant interaction of Group by Laterality (p < 0.02) as well as statistically significant main effects of Session (p < 0.03) and Laterality (p < 0.02). The interaction of Group by Session failed to meet the criterion for statistical significance (p = 0.056), and there were no other statistically significant main effects or interactions. The interactions reflected greater lateralization (right > left) of metabolic rate for the high-anxiety group, particularly during the second PET session. If the two subjects at the median or the two subjects with a DSM-III diagnosis of Alcohol Dependence were omitted from the analysis, the same pattern of results was seen, but the Group-by-Session-by-Laterality interaction fell short of statistical significance (p = 0.059, 0.066) due to the loss of power.
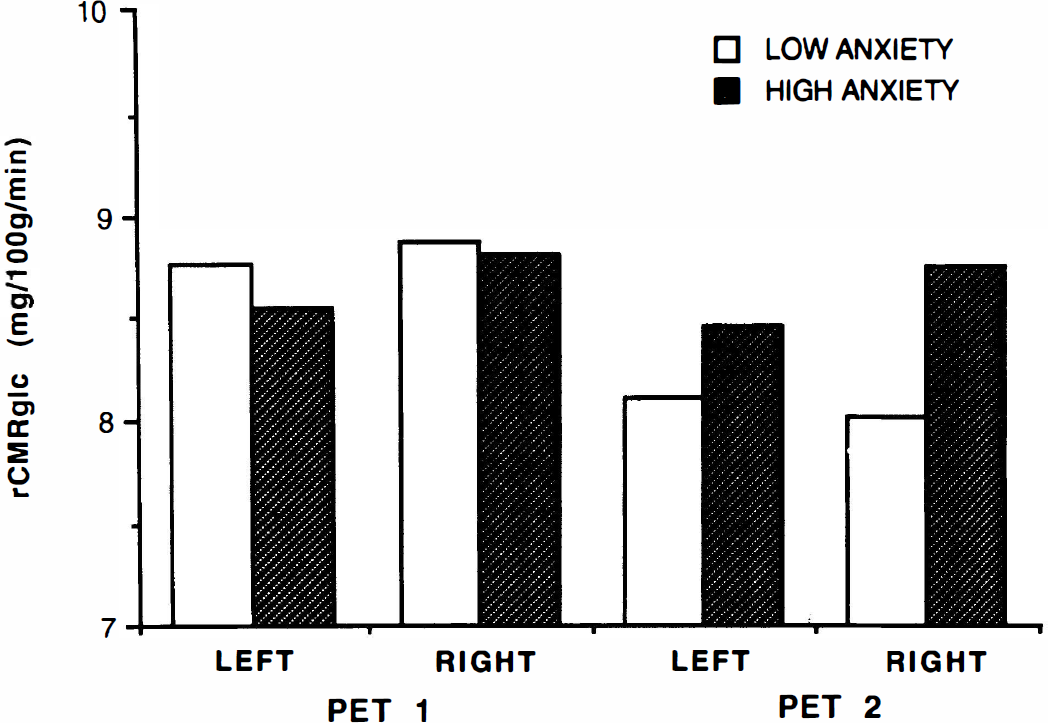
Mean rCMRglc, calculated as the weighted average of all ROI measured on the right and on the left, for the low-anxiety group and the high-anxiety group. During the second PET session, the high-anxiety group shows a greater right/left ratio of rCMRglc than the low-anxiety group. See text for abbreviations.
Metabolic rates for each ROI were submitted to ANOVA with factors of Group (high or low anxiety) by Session (PET 1 or PET 2) by Laterality (left or right), with the Laterality factor omitted for midline structures (Table 1). A statistically significant interaction of all three factors was found for precentral gyrus, putamen, and orbitofrontal cortex. The triple interactions were all due primarily to greater lateralization (right > left) of metabolic rates during the second PET session for the high-anxiety group. Analysis of variance of the rCMRglc data from each session separately showed a statistically significant interaction of Group by Laterality for PET 2 but not PET 1 for all these structures.
Significant interactions of Group by Session were found for precentral gyrus, insula, superior parietal gyrus, postcentral gyrus, orbitofrontal cortex, paracentral lobule, midbrain, and anterior cingulate gyrus. In all these structures, metabolism tended to be higher during PET 1 than PET 2 in the low-anxiety group but not the high-anxiety group. Separate ANOVA of the data from each group for each of these structures showed a statistically significant main effect of Session for the low-anxiety group for superior parietal gyrus, postcentral gyrus, orbitofrontal cortex, and paracentral lobule. There were no statistically significant main effects of Session for the high-anxiety group for any of these structures. Fig. 2 shows an example of this interaction in anterior cingulate gyrus.
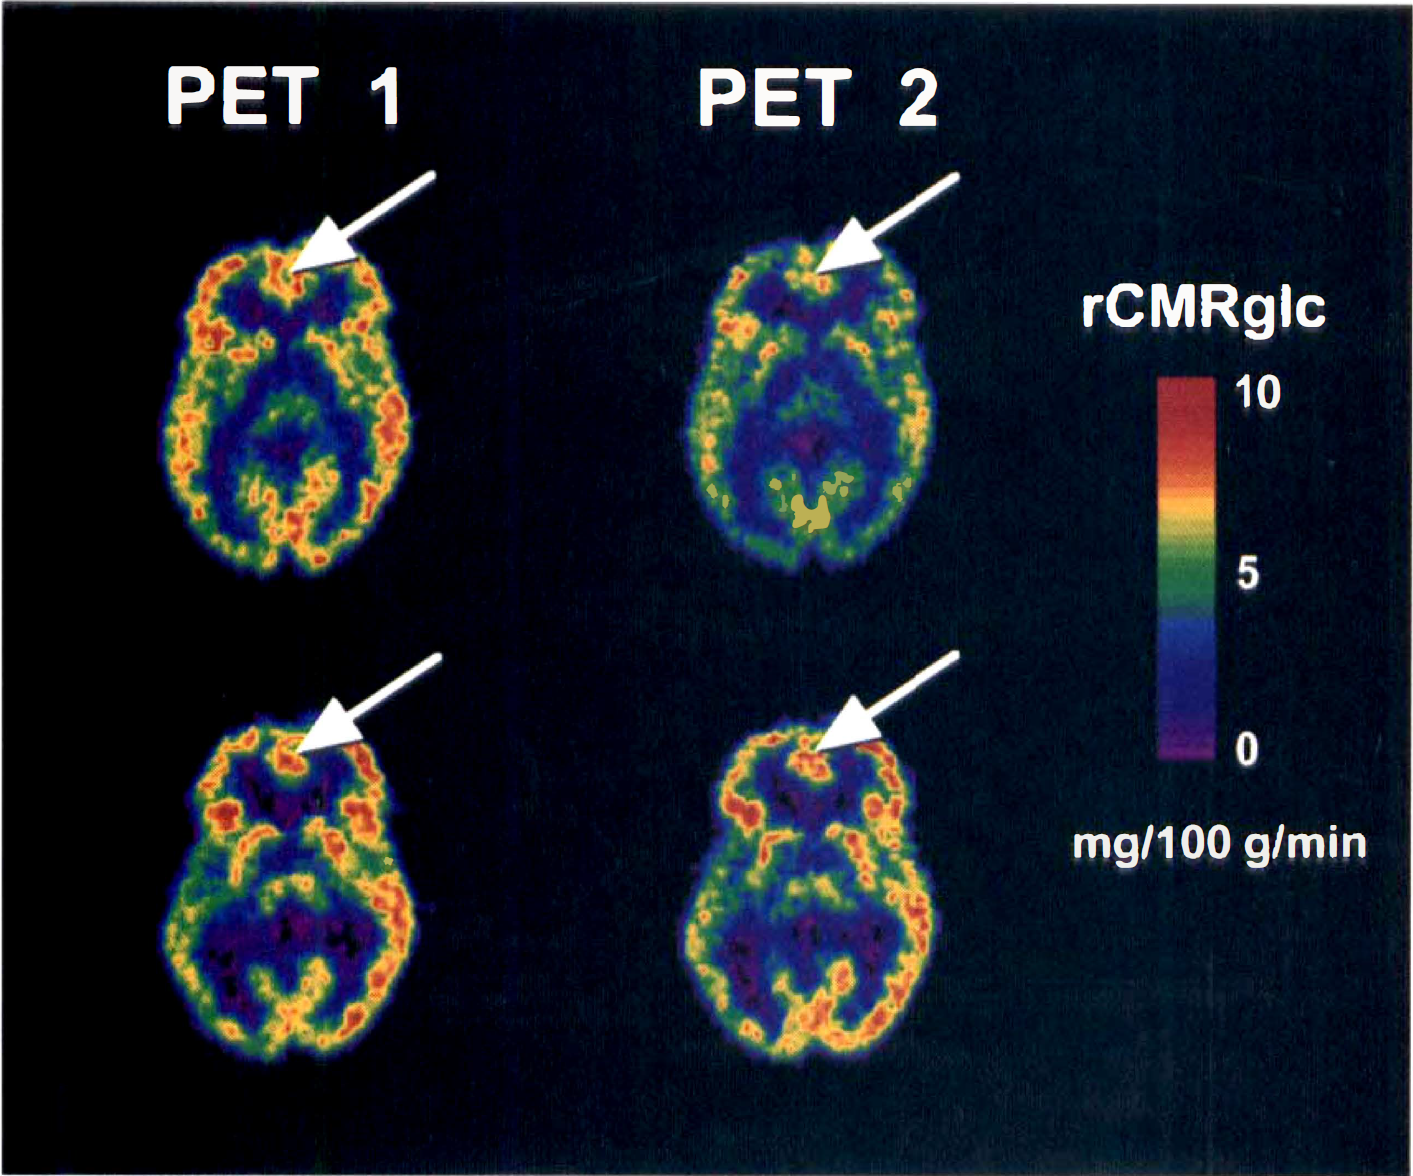
Color-coded transforms showing rCMRglc during PET 1 and PET 2 in a typical subject from each of the two groups. In some sites, such as anterior cingulate gyrus (indicated by arrows), the low-anxiety group shows a decline in metabolic rate for PET 2 compared with PET 1 that is not seen in the high-anxiety group. See text for abbreviations.
Significant interactions of Group by Laterality were found for inferior frontal gyrus, middle temporal gyrus, inferior temporal gyrus, and putamen. For all these structures, metabolism tended to be higher on the right than on the left in the high-anxiety group but similar or lower on the right than on the left in the low-anxiety group. Separate ANOVA of the data from each group for each of these structures showed a statistically significant main effect of Laterality for the low-anxiety group for inferior temporal cortex (left > right) and for the high-anxiety group for inferior frontal gyrus, middle temporal gyrus, and putamen (right > left).
A statistically significant main effect of Laterality with rCMRglc overall higher on the right than on the left was found for middle frontal gyrus, middle temporal gyrus, primary visual cortex, supramarginal gyrus, putamen, and lateral thalamus. For amygdala, rCMRglc overall was significantly higher on the left than on the right. A statistically significant interaction of Session by Laterality was found for middle frontal gyrus and primary visual cortex. For these structures, the right > left difference in rCMRglc was larger during PET 1 than PET 2. Separate ANOVA of the data from each session for each of these structures showed a statistically significant main effect of Laterality during PET 1 but not PET 2.
A statistically significant main effect of Session was found for inferior frontal gyrus, inferior temporal gyrus, temporal pole, supramarginal gyrus, superior parietal gyrus, postcentral gyrus, cuneus, and cerebellar cortex. In all these structures, rCMRglc was higher during PET 1 than PET 2. There were no statistically significant main effects of Group.
Table 2 shows the percent change between the two PET sessions, considering the two groups separately and combined. The low-anxiety group averaged a change of about −8% overall with the biggest changes of −14 to −15% in right orbitofrontal cortex, right cuneate, right temporal pole, and right superior temporal gyrus. All change percentages were negative (PET 2 < PET 1). The high-anxiety group, on the other hand, averaged a change of only about −1% overall. The biggest decreases of −4 to −7% were in left inferior temporal gyrus, left thalamus, right parahippocampal gyrus, and right middle frontal gyrus. Twenty-one of 54 ROI showed a positive percent change (PET 2 > PET 1) with the largest increases of 10% in midbrain and midline thalamus.
Percent Change = (PET 2 – PET 1)/PET 1
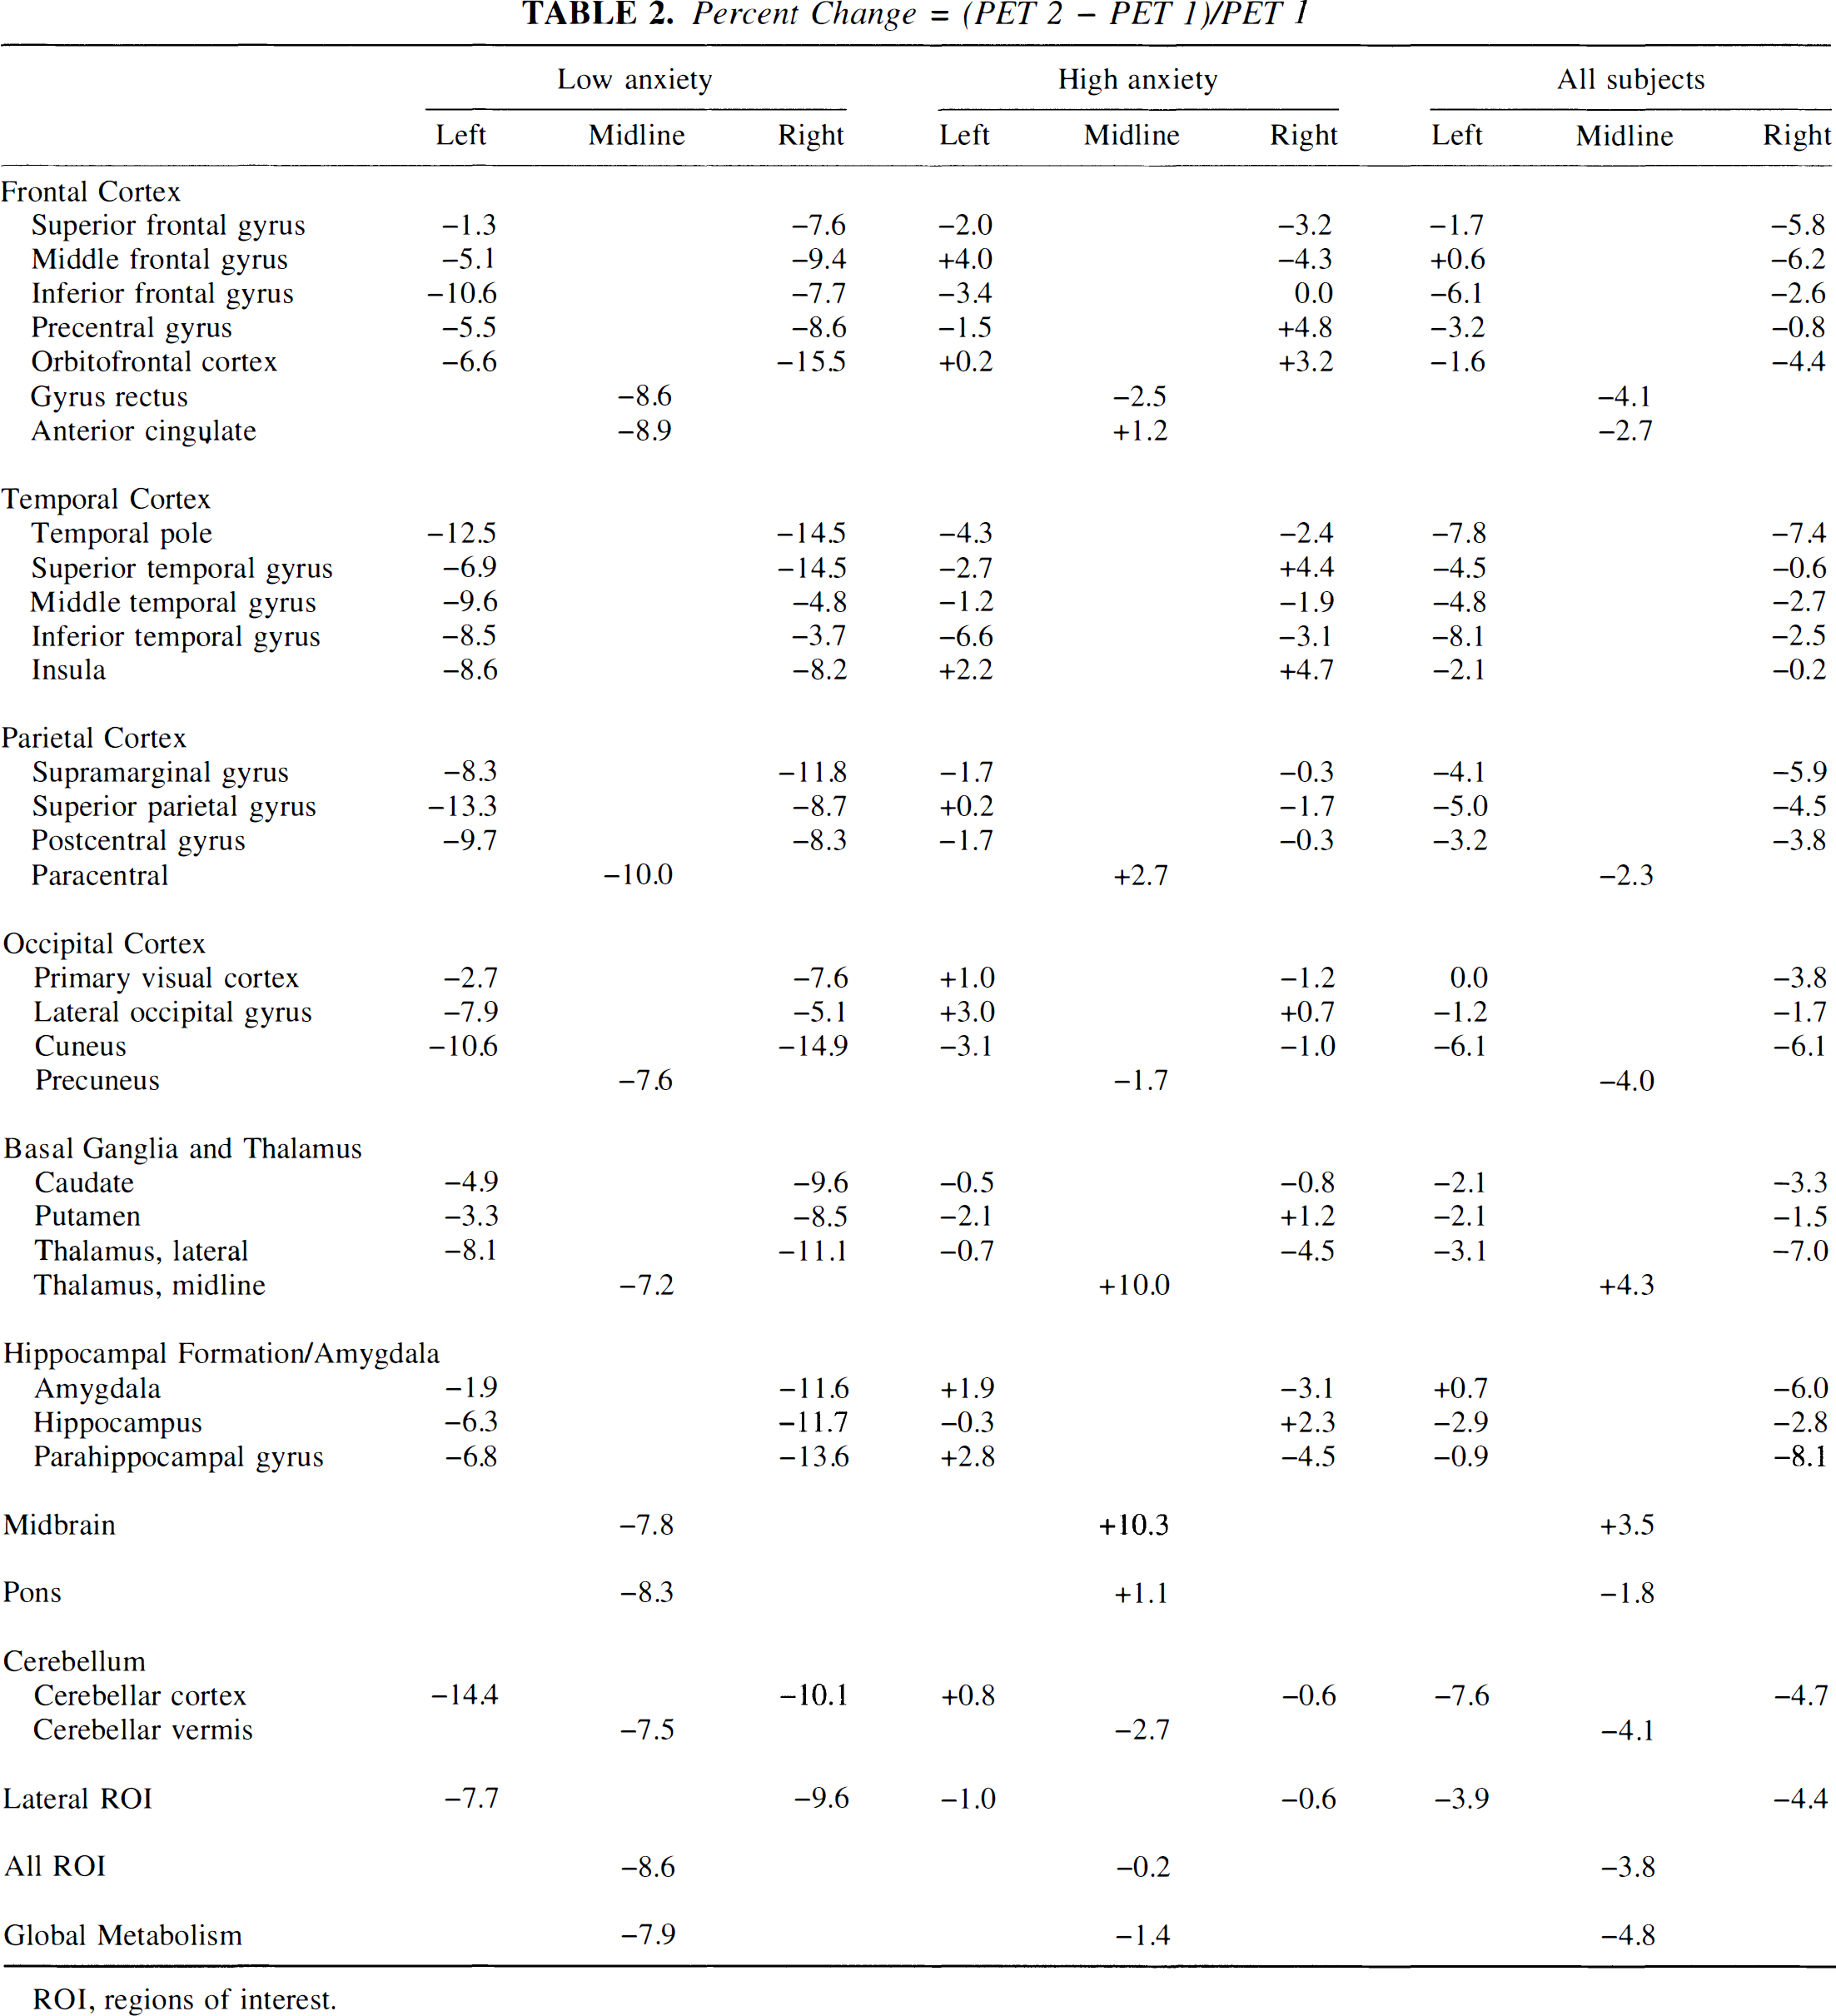
ROI, regions of interest.
As shown in Table 3, ANOVA were performed for subjective measures and vital signs, with factors of Group (high or low anxiety) by Session (PET 1 or 2) by time (−60, −30, +30 min from FDG injection). A statistically significant interaction of Session by Time was found for the fatigue scale of the POMS. Although the triple interaction did not reach statistical significance, ANOVA for each group separately showed a statistically significant interaction of Session by Time for the high-anxiety group but not the low-anxiety group. The high-anxiety group reported the greatest fatigue of the session at +30 min on day 1 but at −30 min on day 2. A statistically significant main effect of Group was found for the POMS Confusion scale, with the high-anxiety group having higher confusion scores than the low-anxiety group. No significant main effects or interactions were found for any other subjective measure. There were no statistically significant effects on heart rate or oral temperature.
Subjective measures and vital signs
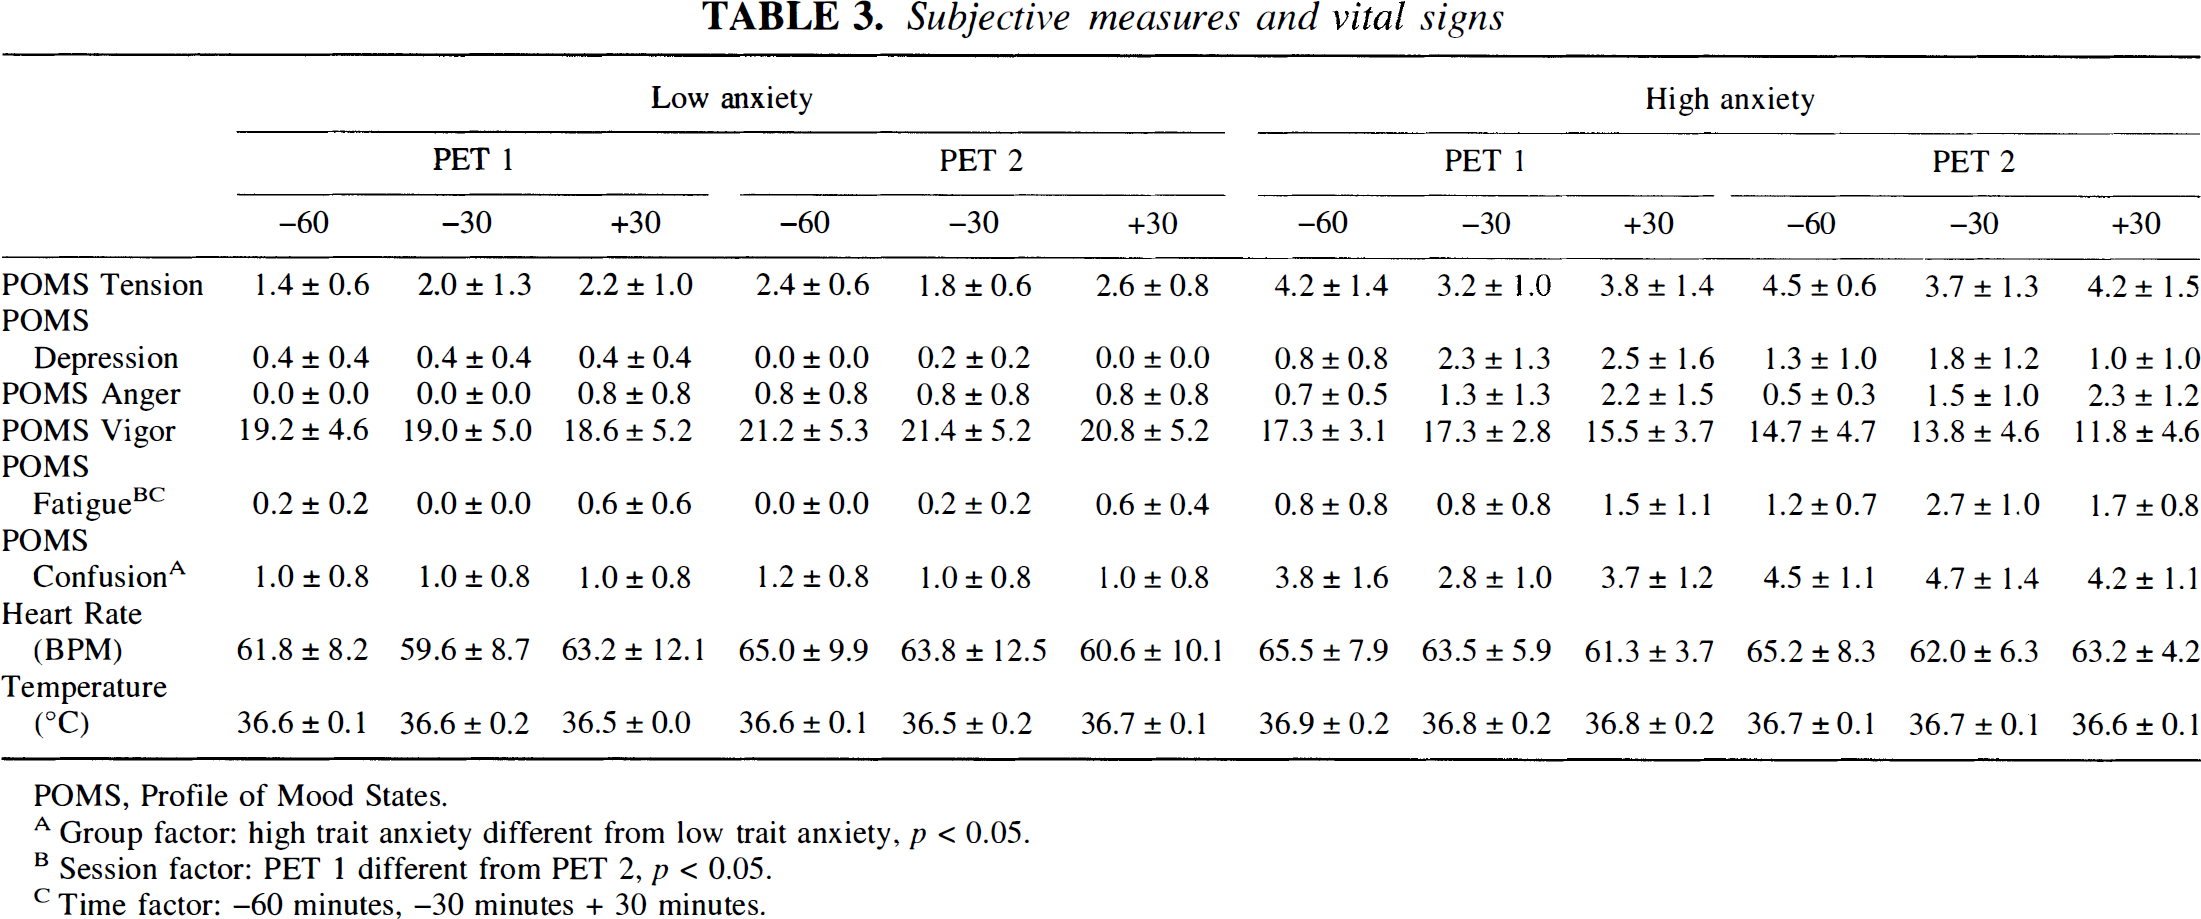
POMS, Profile of Mood States.
Group factor: high trait anxiety different from low trait anxiety, p < 0.05.
Session factor: PET 1 different from PET 2, p < 0.05.
Time factor: −60 minutes, −30 minutes + 30 minutes.
Analysis of variance with factors of Group (high or low anxiety) by Session (PET 1 or 2) was performed on plasma glucose values. No significant effects or interactions were found (mean ± SD: low anxiety, PET 1 89.4 ± 3.6, PET 2 90.6 ± 5.1 mg/dl; high anxiety, PET 1 89.5 ± 7.4, PET 2 91.7 ± 5.3 mg/dl).
To consider the possibility of a relationship between glucose metabolism and subjective and vital signs assessment, correlation coefficients were computed between global glucose metabolism and each measure as well as the daily mean (mean of all measures on the same day, before and after FDG injection) and the difference between the means of the 2 days (PET 2 – PET 1) for the six POMS scales, heart rate, and oral temperature. No statistically significant correlations were found.
Trait anxiety, as measured by the STAI, was not significantly correlated with global glucose metabolism during PET 1, PET 2, or the difference (PET 2 – PET 1). There were no statistically significant correlations between trait anxiety and rCMRglc of individual ROI, the mean of all ROI, or the mean of all cortical ROI for PET 1 or PET 2. There were also no statistically significant correlations between trait anxiety and scores on the Tension-anxiety subscale of the POMS, whether analysis was done on individual measures, mean of all measures each day (pre and post), or mean difference (PET 2 -PET 1).
For each of the six POMS scales, correlations were computed between the daily mean and rCMRglc for each ROI on the same day. The POMS confusion scale was significantly correlated with rCMRglc in right inferior temporal gyrus during PET 1 but not significantly correlated with rCMRglc in left inferior temporal gyrus during PET 1 or with rCMRglc in the inferior temporal gyrus of either hemisphere during PET 2. CMRglc in both left and right orbitofrontal cortex was significantly correlated with the POMS Confusion scale during PET 2 (left: r = 0.738, right: r = 0.729); the correlation was significant for left orbitofrontal cortex during PET 1 (r = 0.711). For right orbitofrontal cortex during PET 1, the correlation was slightly below our criterion for statistical significance (r = 0.706). Scatterplots showed a positive linear relationship. Orbitofrontal rCMRglc, both left and right, was also significantly correlated with the POMS tension-anxiety scale during PET 2 (left: r = 0.740, right: r = 0.734) but not PET 1 (left: r = 0.585, right: r = 0.514).
DISCUSSION
This study demonstrated that cerebral metabolism was higher during the first PET session than the second session in normal subjects. This effect was statistically significant for global glucose metabolism and for the weighted average of all regions measured as well as for certain individual ROI. The effect was not large, averaging overall <5%. These data are consonant with the preliminary findings of Metz et al. (1989). On the other hand, the findings reported in that study of differences between the two sessions in subjective responses on the POMS Vigor and Tension-Anxiety scales were not seen in this study.
The finding that for some ROI the difference in metabolism between the two PET sessions was larger in subjects with low trait anxiety scores than those with high trait anxiety suggests that the low-anxiety subjects may habituate more readily to the novel situation. The topographic pattern of changes between the two sessions suggests that the right hemisphere may be particularly engaged in response to this novel situation since across all ROI the high-anxiety group showed greater lateralization (right > left) than the low-anxiety group, particularly during the second session. It is also possible that the high-anxiety subjects may show greater lateralization regardless of their degree of habituation to the particular situation. This finding is consonant with the suggestion by Reivich et al. (1983) of higher right/left ratios in high-anxiety subjects. It is also consistent with the neuropsychological literature suggesting an important role in emotion of the hemisphere nondominant for language (Silberman and Weingartner, 1986). Given the extensive literature implicating orbitofrontal cortex in emotion (Stuss and Benson, 1984), it may be of interest that orbitofrontal cortex was the only structure that showed a consistent linear relationship between rCMRglc and any subjective measure (the POMS Confusion scale).
A previous study reported a significant negative relationship between anxiety and cortical metabolic activity (Gur et al., 1987). In the present study, this effect was not seen, whether anxiety was measured by the STAI or by the Tension-Anxiety scale of the POMS.
The results of this study clarify the apparent contradictions in the literature. Discrepancies between different studies exploring order effects in cerebral metabolism may be due to differences in the anxiety level of the subjects studied. It would be prudent for investigators to include a measure of anxiety in future studies, particularly when studying a clinical population that might have higher or lower anxiety levels than control subjects.
It also should be noted that repeated testing may reveal differences between groups not seen in a single scan. In this study, the high- and low-anxiety groups did not differ in rCMRglc during the first PET scan, but the response to repetition of the experience revealed group differences.
Footnotes
Abbreviations used
Acknowledgements
The authors thank W. Robert Lange, M.D., and Carlo Contoreggi, M.D., for medical coverage, Roger L. Grayson, M.D., for anesthesiology services, and Merrily Smith, R.N., and Robin Stauffer, R.N., for nursing services. Our appreciation is extended to M. Loretta Spurgeon, Valerie O'Brien, and Jennifer Schmidt for assistance in data collection and analysis, to Victor Villemagne, M.D., for preparation of ![]() , and to Stephen F. Gilson, Ph.D., for helpful discussions. We thank David Clough, C.N.M.T., for operation of the PET scanner and William Smoot, C.N.M.T., for assistance in preparation of the radiotracer.
, and to Stephen F. Gilson, Ph.D., for helpful discussions. We thank David Clough, C.N.M.T., for operation of the PET scanner and William Smoot, C.N.M.T., for assistance in preparation of the radiotracer.