
Abstract
Although perfusion-weighted imaging techniques are increasingly used to study stroke, no particular hemodynamic variable has emerged as a standard marker for accumulated ischemic damage. To better characterize the hemodynamic signature of infarction, the authors have assessed the severity and temporal evolution of ischemic hemodynamics in a middle cerebral artery occlusion model in the rat. Cerebral blood flow (CBF) and total and microvascular cerebral blood volume (CBV) changes were measured with arterial spin labeling and steady-state susceptibility contrast magnetic resonance imaging (MRI), respectively, and analyzed in regions corresponding to infarcted and spared ipsilateral tissue, based on 2,3,5-triphenyltetrazolium chloride histology sections after 24 hours ischemia. Spin echo susceptibility contrast was used to measure microvascular-weighted CBV, which had a maximum sensitivity for vessels with radii between 4 and 30 μm. Serial measurements between 1 and 3 hours after occlusion showed no change in CBF (22 ± 20% of contralateral, mean ± SD) or in total CBV (78 ± 13% of contralateral) in regions destined to infarct. However, microvascular CBV progressively declined from 72 ± 5% to 64 ± 11% (P < 0.01) during this same period. Microvascular CBV changes with time were entirely due to decreases in subcortical infarcted zones (from 73 ± 9% to 57±14%, P < 0.001) without changes in the cortical infarcted territory. The hemodynamic variables showed differences in magnitude and temporal response, and these changes varied based on histologic outcome and brain architecture. Such factors should be considered when designing imaging studies for human stroke.
In acute stroke, the ability to image the hemodynamic state of the brain may be useful for determining tissue viability and guiding therapeutic options (Powers, 1991; Heiss et al., 1994). So-called perfusion-weighted imaging studies in humans have measured a wide variety of potential markers, including cerebral blood flow (CBF), cerebral blood volume (CBV), mean transit time, bolus peak-relaxivity, and bolus time-to-peak maps (Warach et al., 1992; Sorensen et al., 1996; Hunter et al., 1997; Tong et al., 1998; Neumann-Haefelin et al., 1999). It is still unclear whether these different markers yield inherently different information and which, if any, best reflect the tissue energy status, final infarct size, or potentially salvageable tissue in the brain after ischemic injury.
Previous focal ischemia studies have shown that CBF thresholds maintained beyond a certain period of time have a high likelihood of predicting infarction, and that CBF reductions present in the first minutes of ischemia remain essentially unchanged over the next several hours (Jones et al., 1981; Heiss, 1983; Dirnagl et al., 1989; Pappata et al., 1992; Hossmann, 1994). Thus, CBF in ischemic areas does not change significantly over the critical period when injury is still partially reversible with reperfusion therapy (Memezawa et al., 1992; Garcia et al., 1993; Jiang et al., 1998). In clinical settings, the ischemic duration is often unknown, making it difficult, if not impossible, to determine whether salvageable tissue exists even given the most accurate measurement of CBF.
Cerebral blood volume changes during ischemia have been less frequently studied, primarily because equilibrium methods such as microwave fixation autoradiography and positron emission tomography (PET) are either expensive, technically demanding, or incompatible with continuous in vivo measurements (Sette et al., 1989; Todd et al., 1993). Cerebral blood volume alterations may reflect changes in cerebrovascular caliber mediated by the endothelium and vascular smooth muscle that are a reaction to sustained, low CBF, and as such may be uniquely sensitive to cumulative tissue damage. Preserved CBV in the setting of low CBF is believed to represent an appropriate vasodilatory response to maximize oxygen extraction (Gibbs et al., 1984; Powers, 1991; Derdeyn et al., 1998), and such CBV-CBF mismatched areas have been observed during early ischemia (Dijkhuizen et al., 1997; Schulz et al., 1997; Caramia et al., 1998; Hatazawa et al., 1999).
There are compelling reasons to focus on microvascular changes during stroke. Measurement of microvascular CBV changes would permit analysis of the response of small vessels to ischemia in isolation from changes in other vascular compartments. Small arterioles and capillaries are the site of reperfusion-mediated parenchymal hemorrhage, and their integrity may play an important role in the safety and efficacy of reperfusion therapy. Inflammatory mediators, both cytokine and cell-mediated, may cause microvascular plugging and attendant perfusion compromise (Ames et al., 1968; del Zoppo et al., 1991). Microvascular CBV measurement is possible with magnetic resonance imaging (MRI) susceptibility contrast because spin echo images may be made highly sensitive only to blood in small vessels; gradient echo images are insensitive to vessel size and therefore reflect total CBV changes (Fisel et al., 1991; Weisskoff et al., 1994). Experimental studies comparing quantitative MRI-based microvascular CBV measurements with PET are consistent with known vessel size distributions in brain (Østergaard et al., 1998). Previous studies have shown that microvascular and total CBV behave differently during global hypoperfusion and focal ischemia in rats (Jones et al., 1996; Zaharchuk et al., 1999).
In the current article, the authors have used MRI to assess the hemodynamic response of the rat brain after 1 to 3 hours of focal ischemia, and have correlated this MRI data by both brain region and by using 2,3,5-triphenyltetrazolium chloride (TTC) staining as evidence of infarction after 24 hours ischemia. Cerebral blood flow changes were measured with an arterial spin labeling (ASL) method, CAPTIVE imaging (Zaharchuk et al., 1998), that is also capable of simultaneous measurement of total and microvascular CBV using steady-state susceptibility contrast methods.
MATERIALS AND METHODS
Animal model
The following protocol was approved by the Office of Laboratory Animal Research at Massachusetts General Hospital, Charlestown, MA, U.S.A. Male Sprague-Dawley rats (Charles River Laboratories, Wilmington, MA, U.S.A.; n = 12; 355 ± 30 g, mean ± SD) were anesthetized free-breathing with 0.7% to 1.0% halothane in a 1.5:1 nitrous oxide:oxygen mixture. Permanent middle cerebral artery occlusion (MCAO) was accomplished by inserting a 4-0 nylon monofilament (Ethicon; Johnson & Johnson, Edison, NJ, U.S.A.) coated with a mixture of silicone resin (Xantopren; Bayer Dental) and a hardener (Elastomer Activator; Bayer, Osaka, Japan) through the common carotid, internal carotid, and past the origin of the MCA. The surgery was performed with the animal positioned in a plastic stereotactic frame within the RF surface coil. A femoral intraarterial catheter was placed to monitor mean arterial blood pressure and arterial blood gases (pH, Paco2, and Pao2). A femoral intravenous catheter was placed to administer contrast agents. Core temperature was maintained with a heated water blanket.
After imaging, the rats were allowed free access to food and water. After death after 24 hours ischemia, the rats' brains were cooled with ice and the bregma point was identified visually. The skulls were carefully removed and the brains were positioned into a custom brain slicing device. Then, 2-mm coronal slices were taken, with the center slice aligned at the previously identified bregma level. Histologic staining for infarcted tissue was performed using 2,3,5-triphenyltetrazolium chloride. These stained sections were then photographed in a horizontal position using a photomicroscope integrated with an IBM-PC for comparison with the MR images.
Magnetic resonance imaging methods
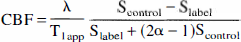
where Slabel and Scontrol represent signal intensity during proximal and distal spin labeling, T1app is the gray matter T1 (taken to be 1.5 seconds), λ is the brain:blood partition coefficient (taken to be 0.88), and α is the degree of spin labeling at the imaging plane, measured in previous experiments to be 0.7 (precontrast) and 0.6 (postcontrast;Zaharchuk et al., 1998).
Data analysis
Regions of interest corresponding to infarcted and spared ipsilateral tissue were determined by a coauthor (M. Yamada) blinded to the MR data by comparing the TTC-stained photomicrographs to the acquired MR images using anatomical landmarks for guidance. Spared tissue was defined as ipsilateral brain tissue that was not infarcted after 24 hours ischemia. Subcortical and cortical regions of interest were outlined, allowing examination of hemodynamic changes in a matrix of the following four areas: subcortical infarcted, subcortical spared, cortical infarcted, and cortical spared. Tissue of the olfactory bulb, substantia nigra, and preoptic regions were not included in these measurements. Measurements were also made in five anatomically defined regions in the single slice located at bregma. In one rat there was no infarction in this slice, therefore the CBF and CBV data presented for the infarcted and spared regions in Table 1 represent the mean of 5 rats and 11 rats, respectively.
Regional hemodynamic changes after middle cerebral artery occlusion in a 2-mm-thick coronal slide located at bregma*
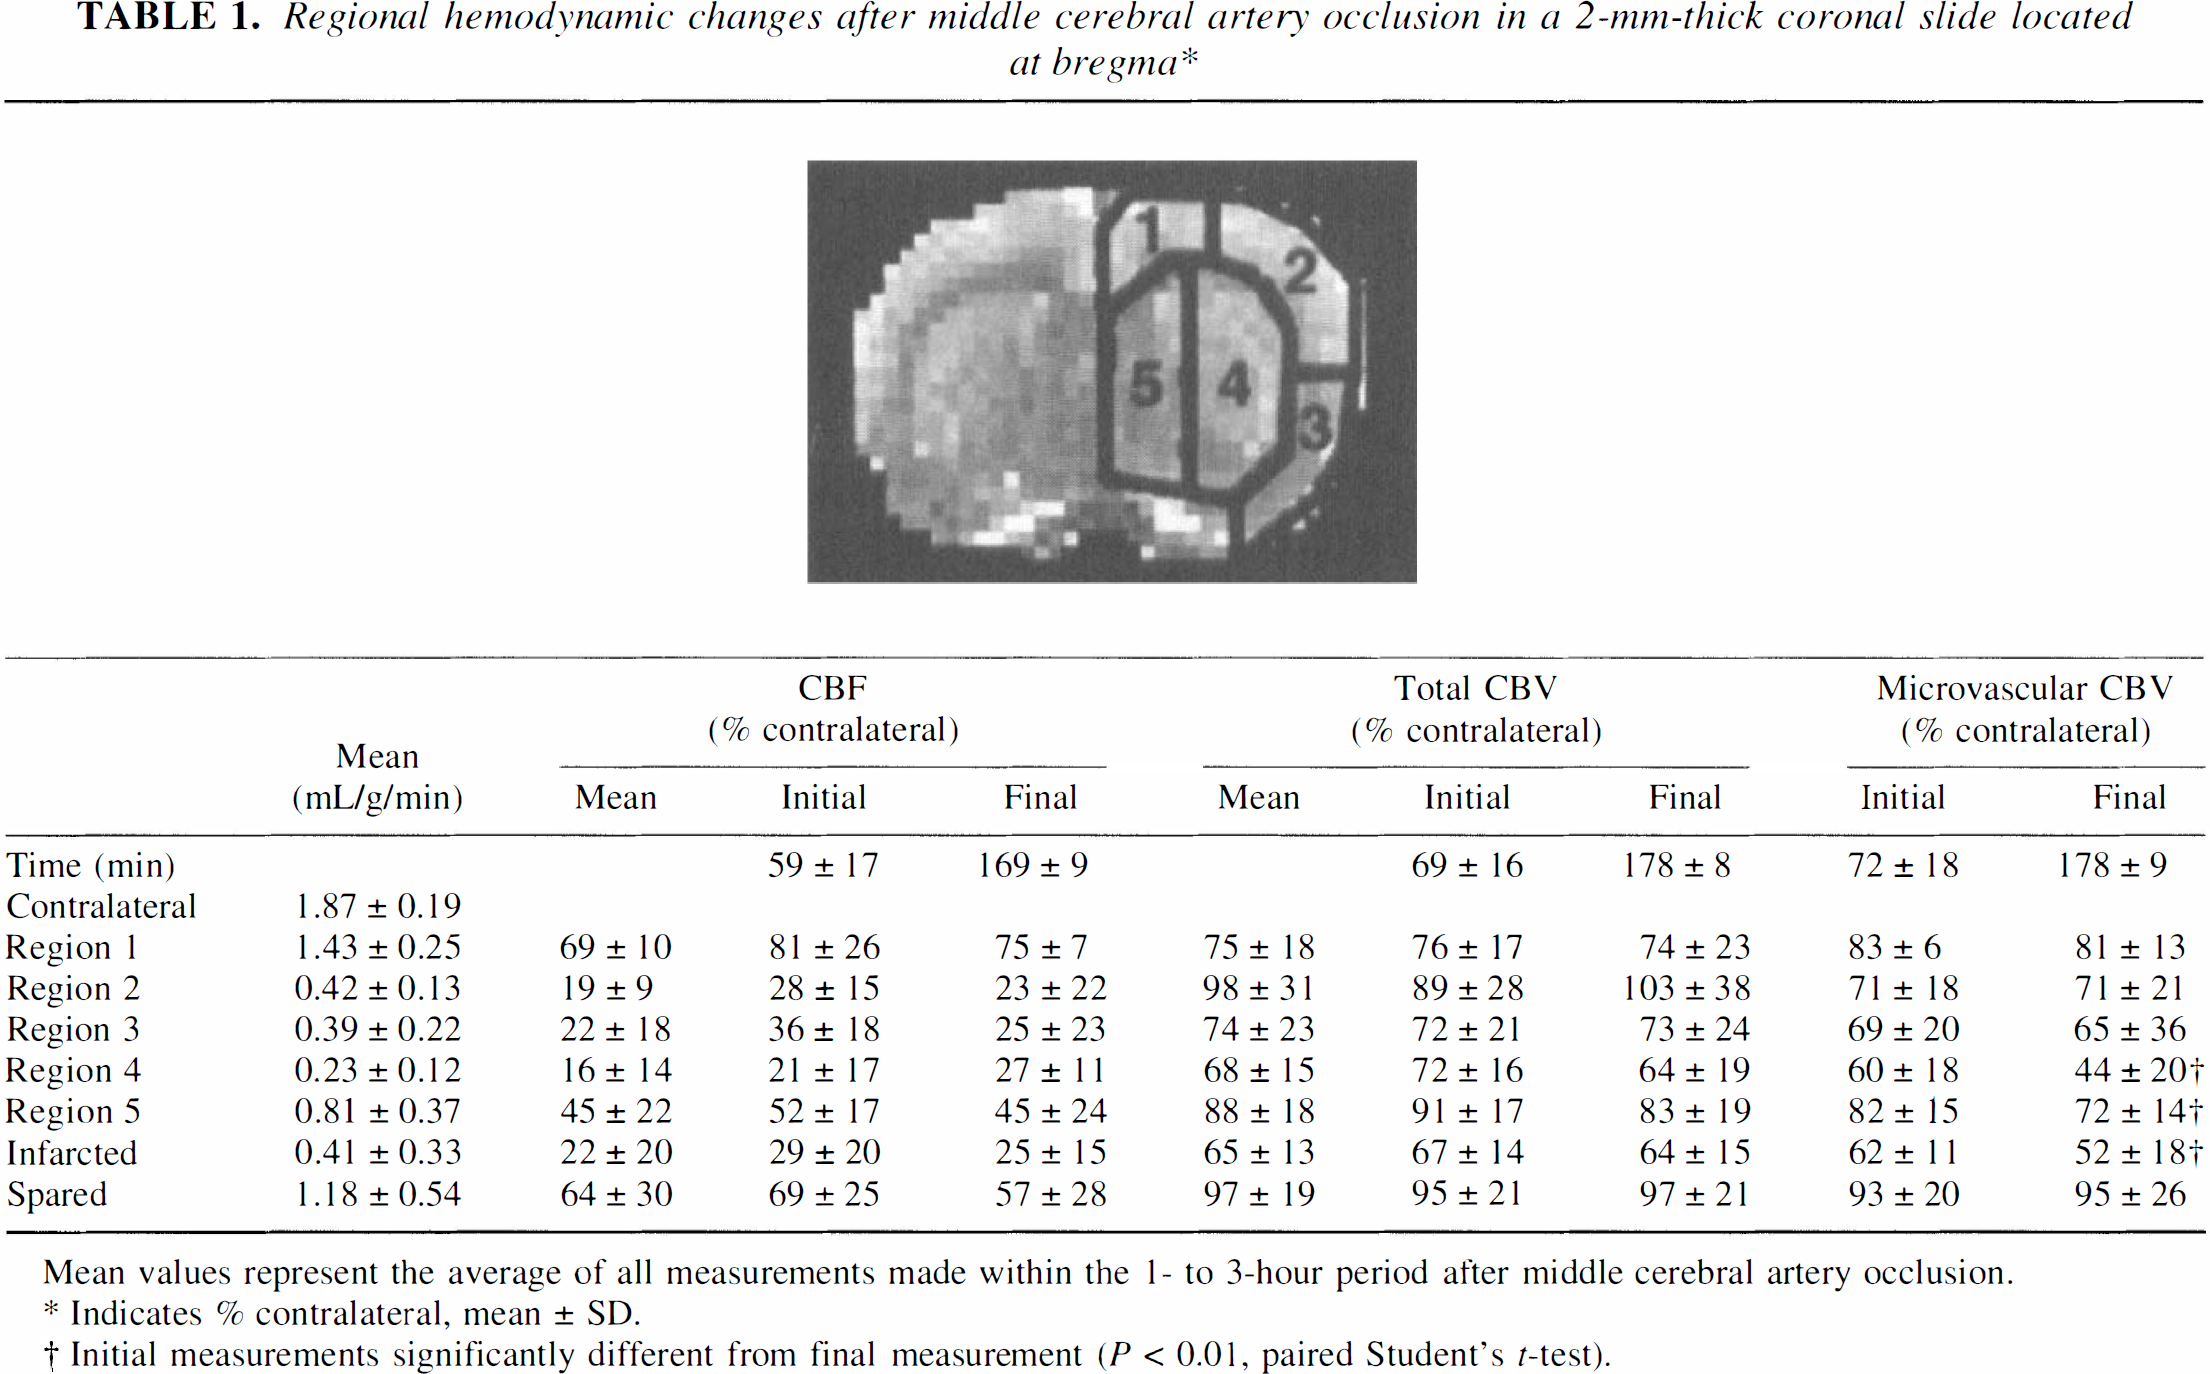
Mean values represent the average of all measurements made within the I- to 3-hour period after middle cerebral artery occlusion.
Indicates % contra lateral, mean ± SD.
Initial measurements significantly different from final measurement (P > 0.01 paired Student's t-test).
Hemodynamic measurements were expressed as percent of the mean contralateral level at the same time point. All measurements in each rat were binned into groups based on the time from occlusion using 20-minute intervals (that is, <80 minutes, 80 to 100 minutes, 100 to 120 min, and so on). As CBV changes in the MION and MPEG-PL-DyDTPA groups were similar, all CBV results are shown as the pooled data for 12 animals. Paired two-tailed Student's t-tests using the Bonferroni correction for multiple comparisons were used to compare the different hemodynamic parameters. Repeated measures analysis of variance was used to compare the physiologic parameters. To determine the significance of changes in hemodynamic parameters over time, the authors used a test for nonzero slope on each parameter. All data is expressed as mean ± SD.
RESULTS
Physiologic monitoring was stable and reflected normal values for nonventilated rats (Table 2). For all rats, infarction volume as determined by TTC staining after 24 hours ischemia comprised 35 ± 15% of the ipsilateral hemisphere.
Physiologic parameters in rats subject to MCAO
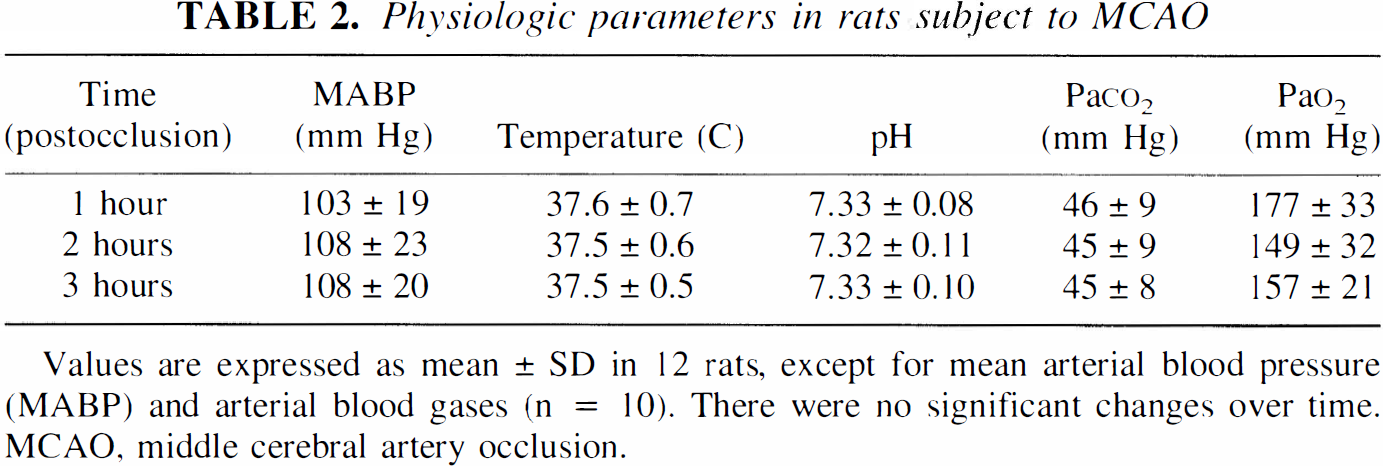
Values are expressed as mean ± SD in 12 rats, except for mean arterial blood pressure (MABP) and arterial blood gases (n = 10). There were no significant changes over time. MCAO, middle cerebral artery occlusion.
Fig. 1 is an example of total and microvascular CBV images after 1 hour of MCAO with representative TTC-stained sections demonstrating infarction after 24 hours occlusion. Differences in image contrast were evident—the total CBV maps outlined major vascular structures, whereas the microvascular CBV maps demonstrated primarily parenchymal (that is, gray–white) contrast. In addition, the relative reduction in microvascular CBV was greater than that for total CBV in regions that later infarcted. Fig. 2 is representative of the images used to examine the changes in several different hemodynamic parameters over time. Cerebral blood flow was decreased in a region that corresponded to infarcted tissue and did not change between 1 and 3 hours after occlusion. Total CBV in this rat was minimally affected and was also unchanged between 1 and 3 hours after occlusion. In contrast, a focal area of microvascular CBV decrease was seen to expand with time in the ischemic regions, particularly in striatum.
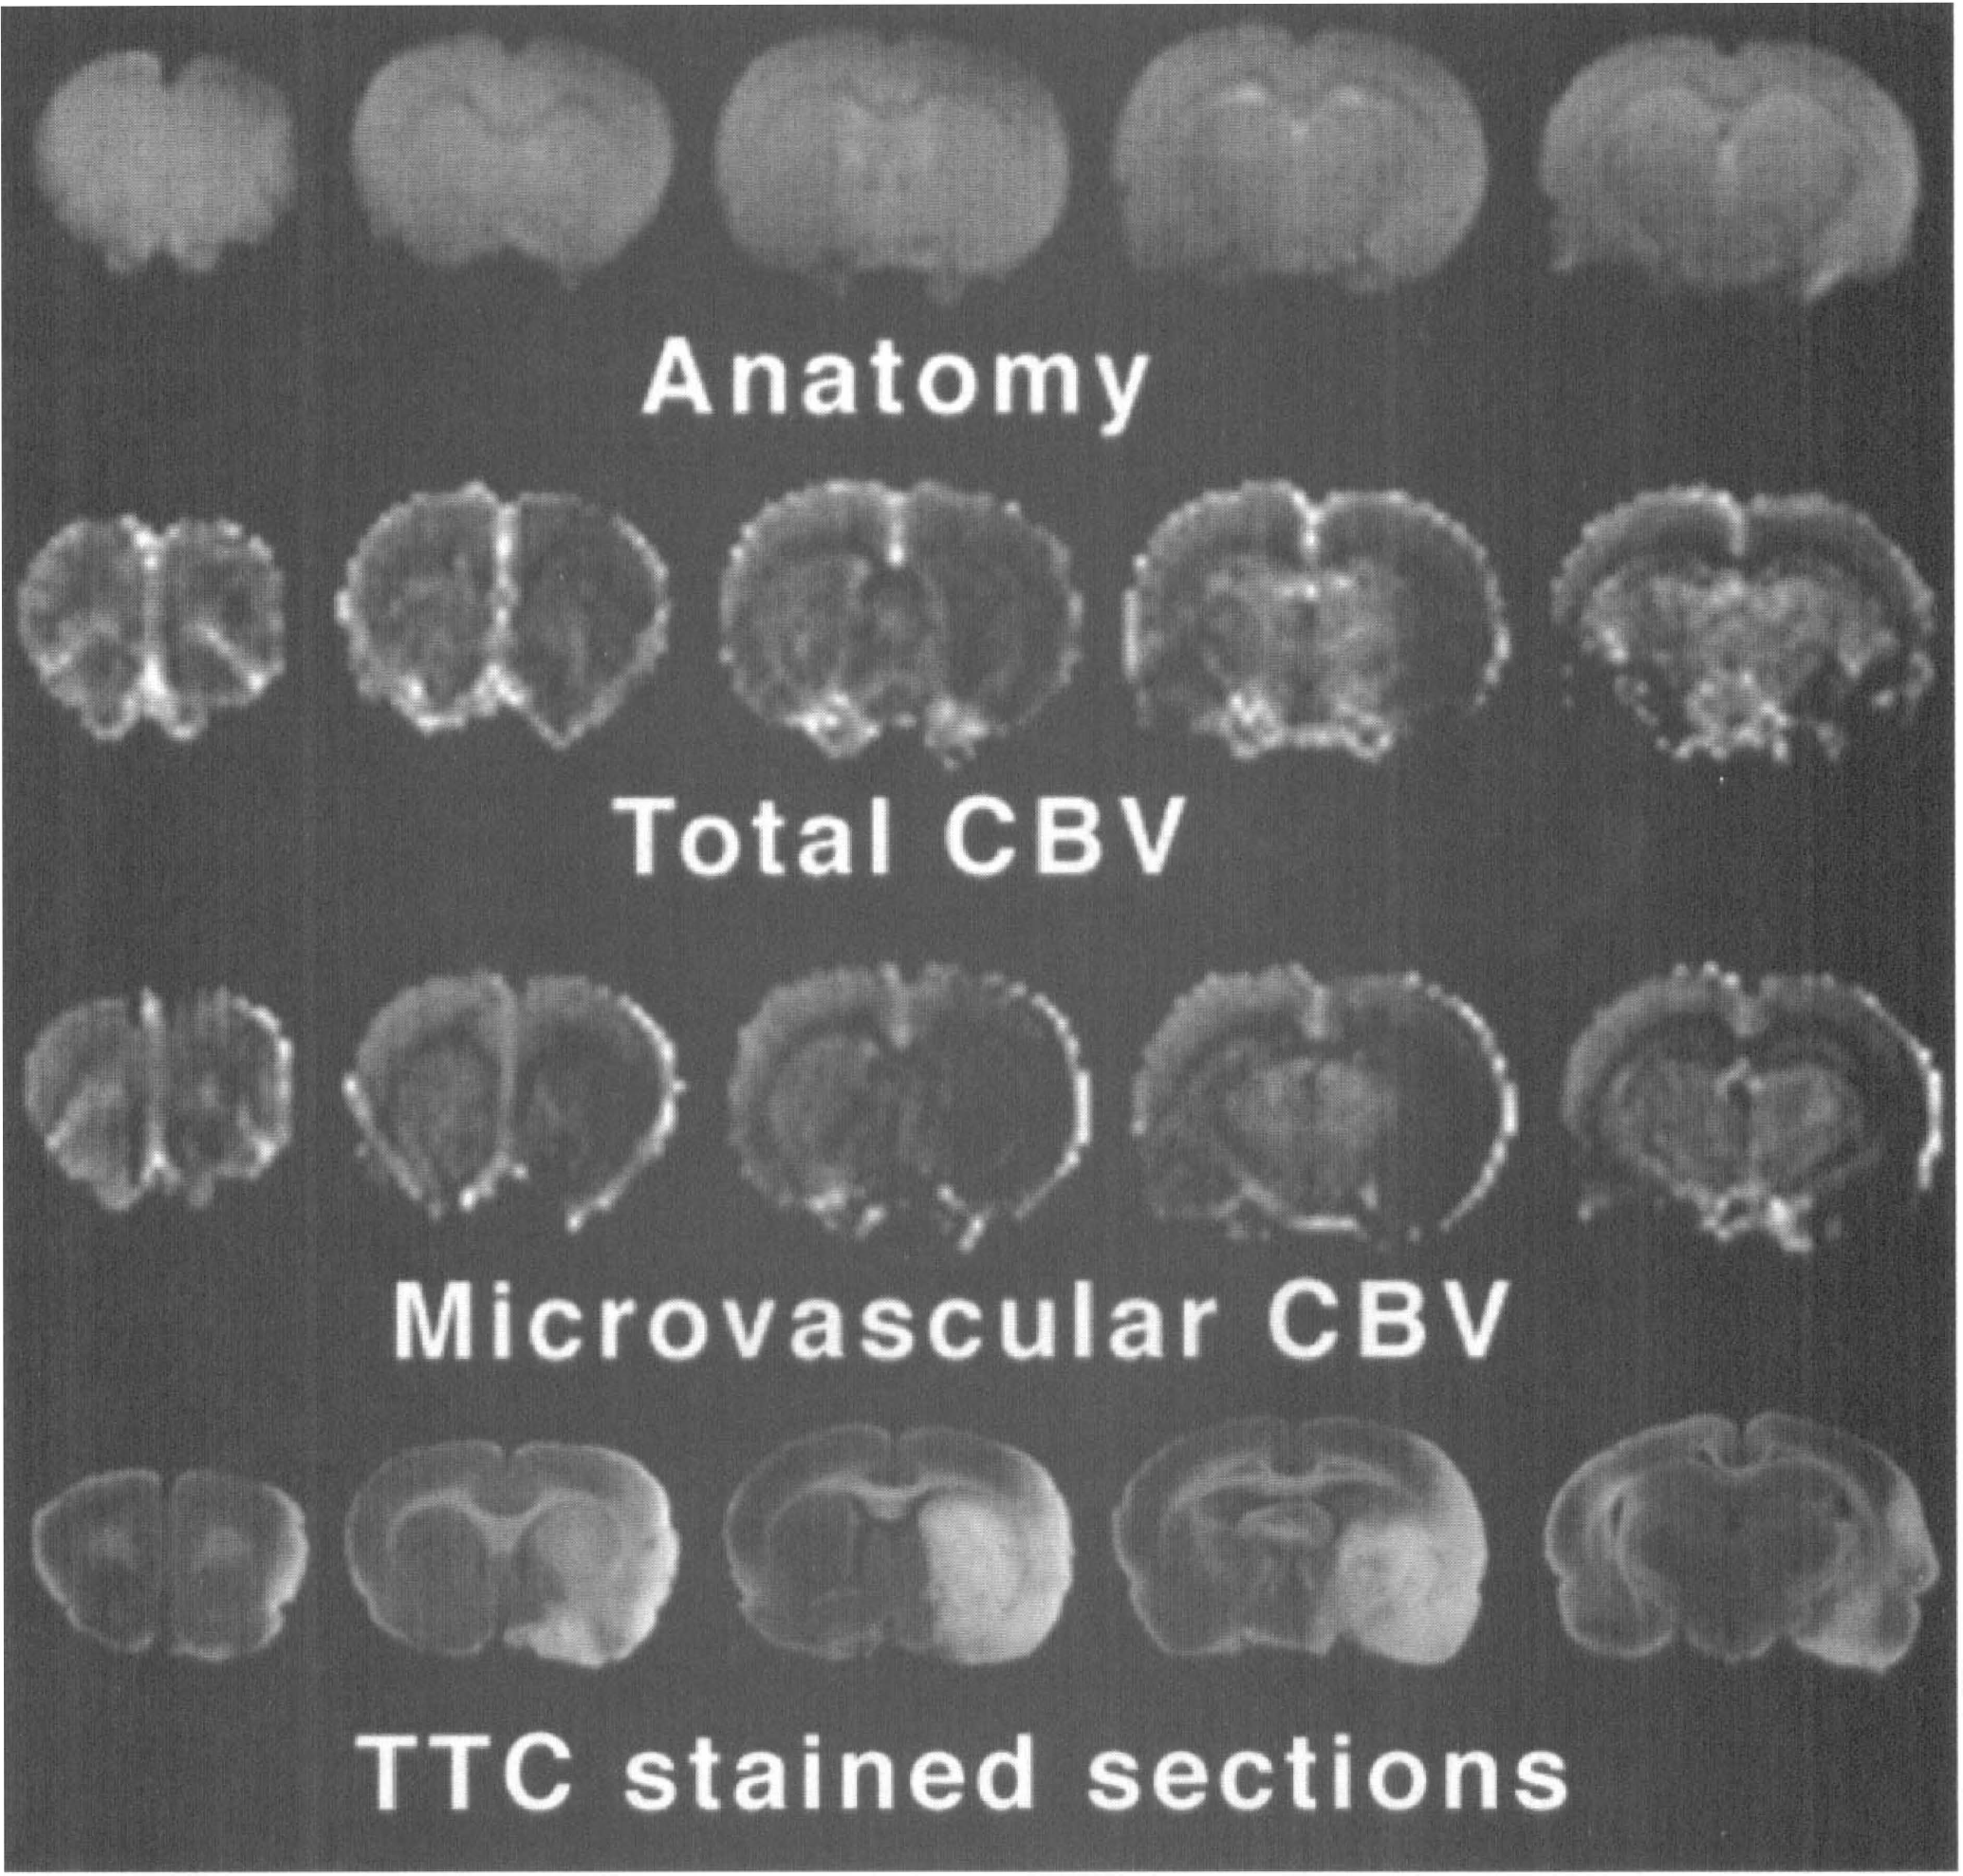
Spin echo anatomic images, total cerebral blood volume (CBV) maps, microvascular CBV maps, and 2,3,5-triphenyltetrazolium chloride (TTC) stained photomicrographs after middle cerebral artery occlusion using the steady-state contrast agent monocrystalline iron oxide nanoparticles (MION). Total and microvascular CBV images were taken after 1 hour, whereas TTC staining was performed after 24 hours occlusion. Total CBV images were dominated by large vessels, whereas microvascular CBV images emphasized parenchymal (that is, gray–white matter) differences. Note that microvascular CBV was more severely affected in the infarcted regions than was total CBV.
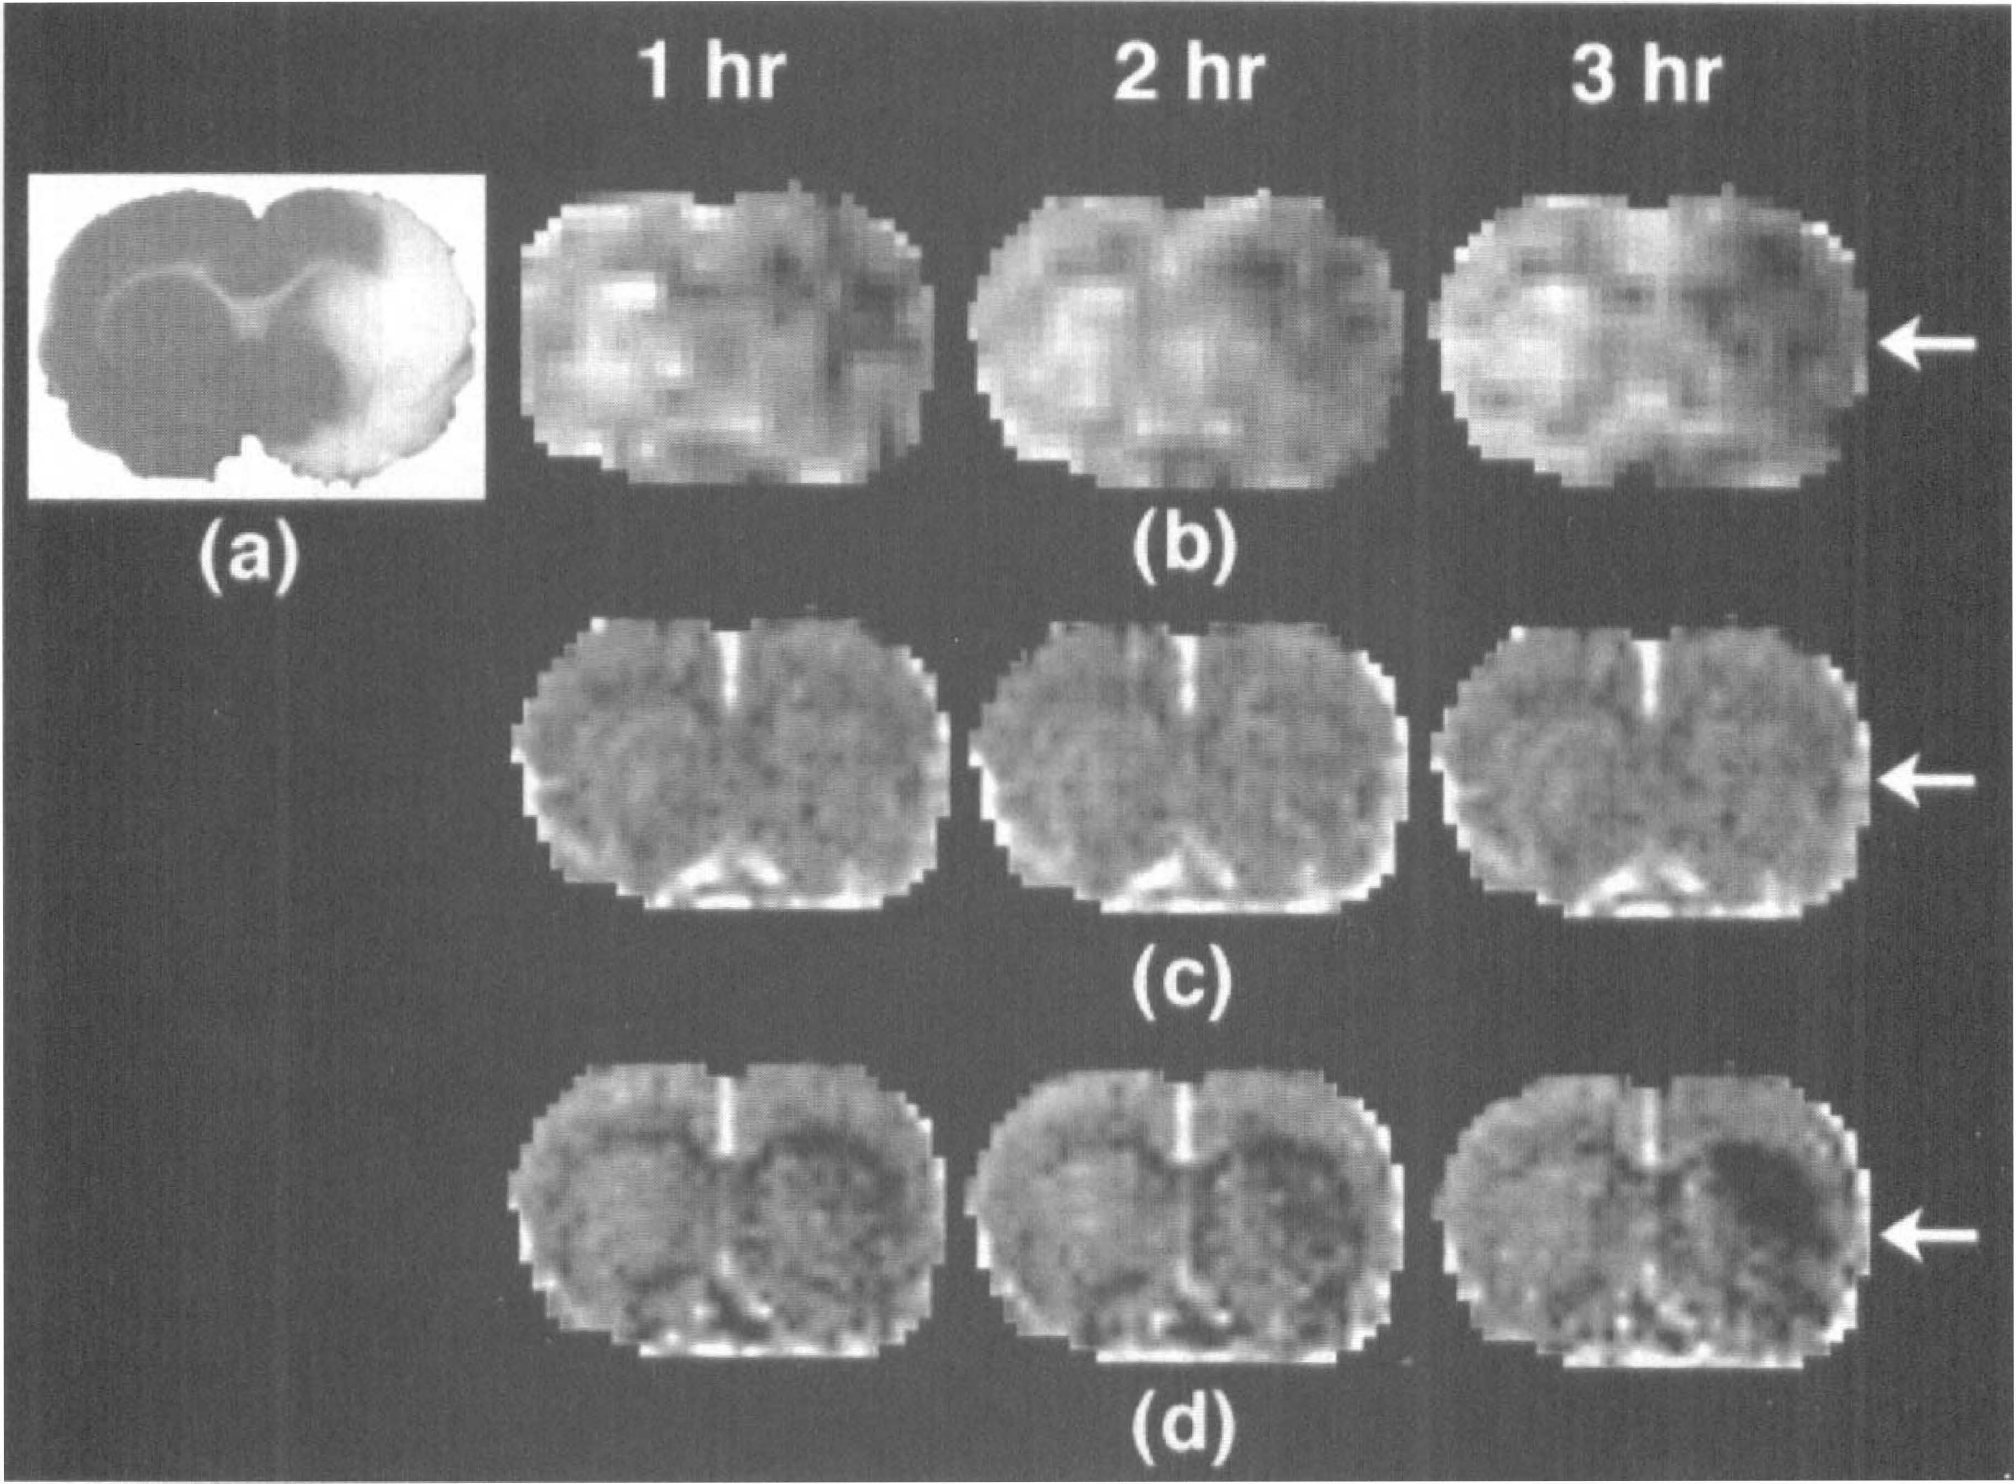
Fig. 3 shows the temporal evolution of CBF in infarcted and spared tissue. Static CBF reduction wasobserved in infarcted tissue between 1 and 3 hours of occlusion, with a mean CBF of 0.41 ± 0.33 mL/g/min, corresponding to 22 ± 20% of contralateral. In spared tissue, CBF was higher but still not normal (1.18 ± 0.54 mL/g/min, or 64 ± 30% of contralateral). Contralateral CBF was 1.87 ± 0.19 mL/g/min. Cerebral blood flow in different anatomical regions is shown in Table 1.
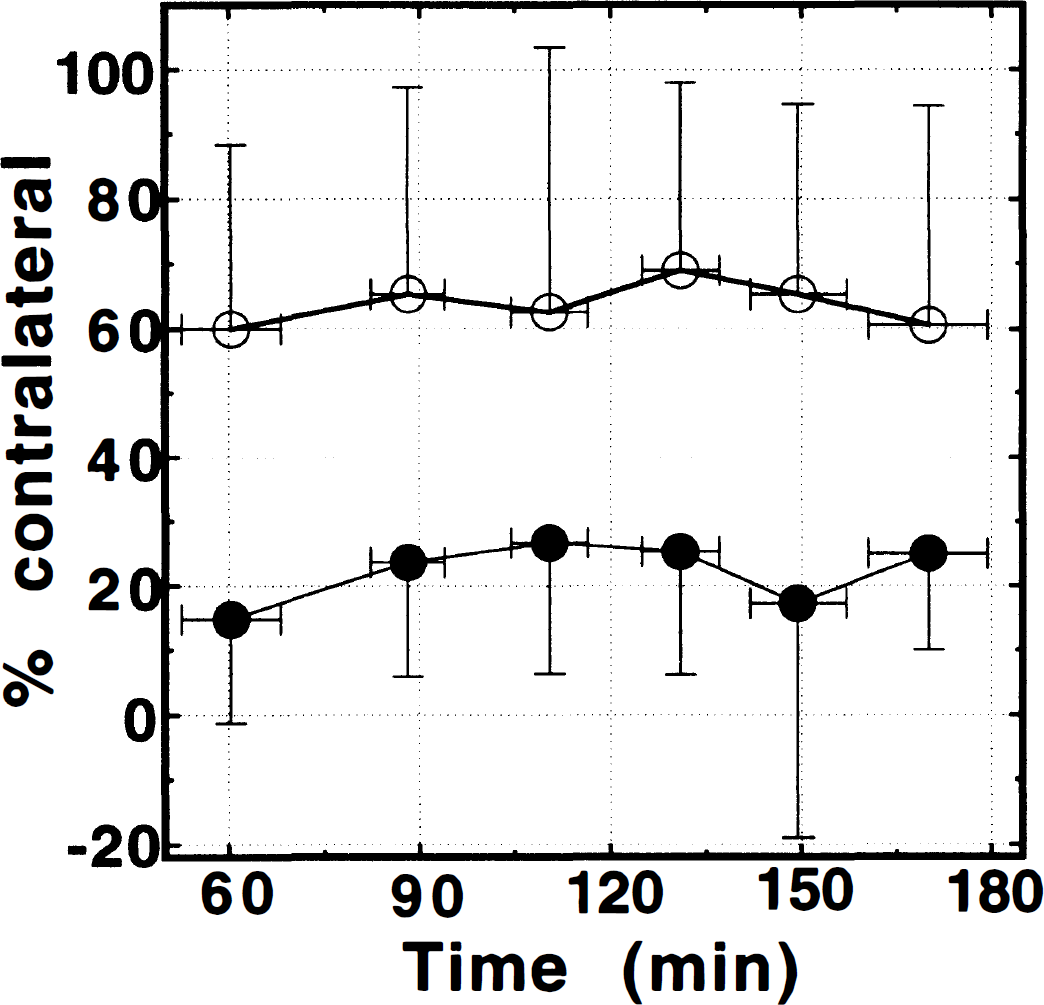
Cerebral blood flow (CBF) versus time in ipsilateral tissue that was either infarcted (•) or spared (○) after 24 hours of middle cerebral artery occlusion in a single 2-mm-thick slice located at bregma. Cerebral blood flow was sharply decreased in the infarcted zone and did not change with time. Significant hypoperfusion was also seen in ipsilateral spared regions. The difference between CBF in the spared and infarcted tissue was significant at all time points (P < 0.05).
Total and microvascular CBV changes are shown in Fig. 4. There was no significant difference between total CBV in the infarcted zone depending on the contrast agent (MION: 78 ± 8% versus MPEG-PL-DyDTPA: 74 ± 16%, P > 0.10) used during the 2 hour period of the experiment. Based on this, all CBV data shown represents pooled data from both groups of animals. Total and microvascular CBV changes in different anatomical regions are shown in Table 1. While all regions except region 1 (which is in the anterior cerebral artery rather than the MCA territory) demonstrated some degree of CBV/CBF mismatch, the most striking mismatches were present in cortex. For example, in region 2, mean CBF was only 19 ± 9% of contralateral while the total CBV was unchanged (98 ± 30% of contralateral); microvascular CBV in this region showed an intermediate decline to 71 ± 18% of contralateral.
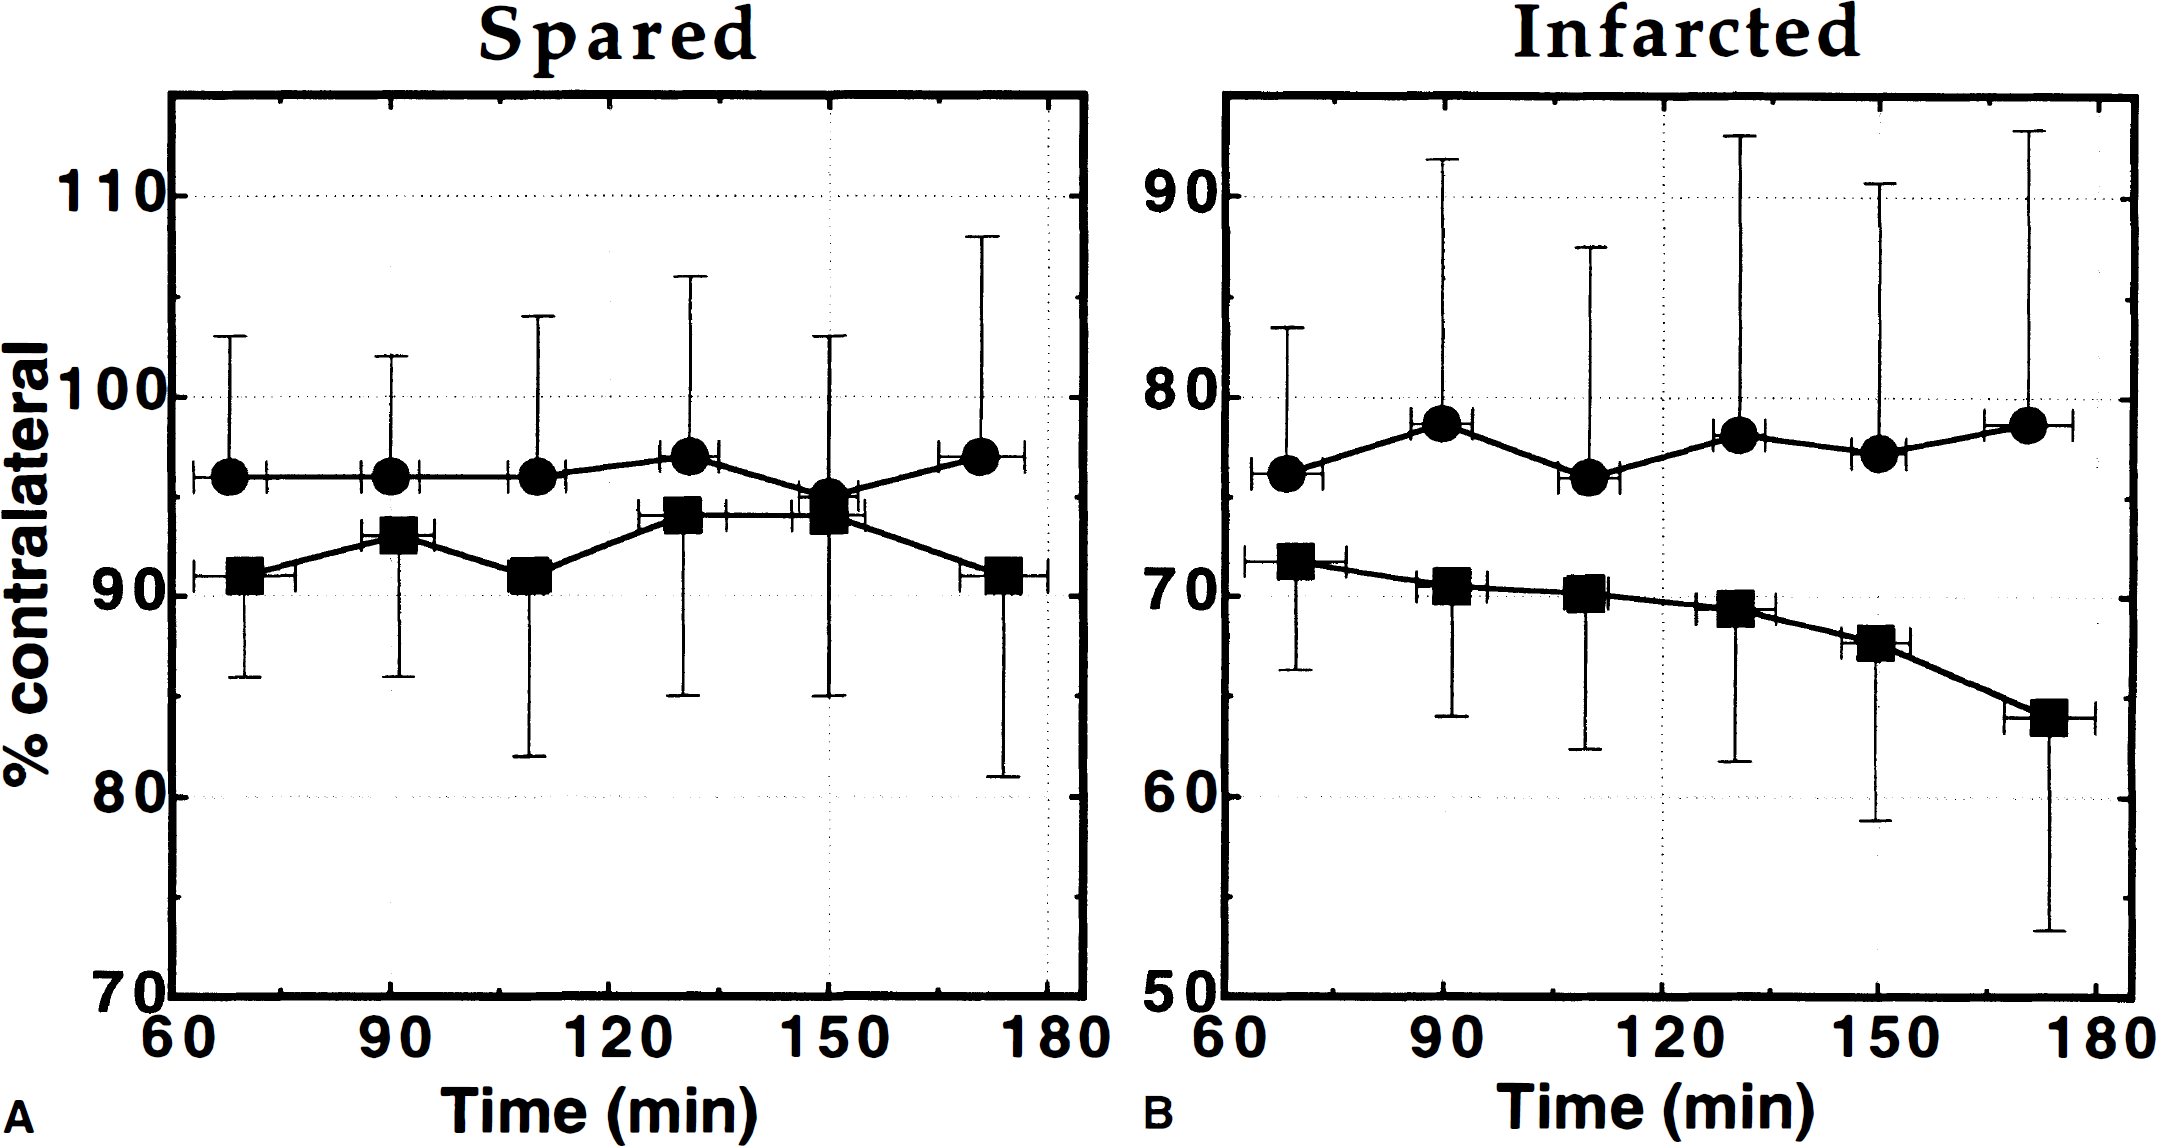
Total cerebral blood volume (CBV) (•) and microvascular CBV (▪) versus time in
Small reductions in total CBV (97 ± 10% of contralateral, P > 0.05) and microvascular CBV (92 ± 9% of contralateral, P < 0.05) were observed in spared ipsilateral tissue (Fig. 4A). No changes with time were present. In the infarcted zones (Fig. 4B), total CBV was mildly but significantly reduced and did not change between 1 and 3 hours occlusion (78 ± 10% after 1 hour versus 76 ± 14% of contralateral after 3 hours ischemia). Mean total CBV during the 2-hour interval was 76 ± 12% of contralateral. After 1-hour occlusion, microvascular CBV in the infarcted zone was more severely affected than total CBV and declined steadily during the following 2 hours (Fig. 4B). The decrease of microvascular CBV in infarcted tissue with advancing time was the only hemodynamic parameter measured in which a linear fit showed a slope significantly different from zero (P < 0.01).
When the temporal changes were further broken down into subcortical and cortical regions (Table 3), it became clear that the progressive microvascular CBV decline in infarcted zones was specific only to subcortical areas, where a decrease from 73 ± 9% to 57 ± 14% (P < 0.001) of contralateral was observed between 1 and 3 hours of ischemia; cortical infarcted regions did not change significantly (from 72 ± 12% to 75 ± 20% of contralateral, respectively). Slight decreases in total CBV were also seen in subcortical infarcted areas (from 82 ± 10% to 76 ± 16%), but this was not statistically significant (P > 0.10).
Total and microvascular cerebral blood volume changes in cortical and subcortical regions of the full brain*
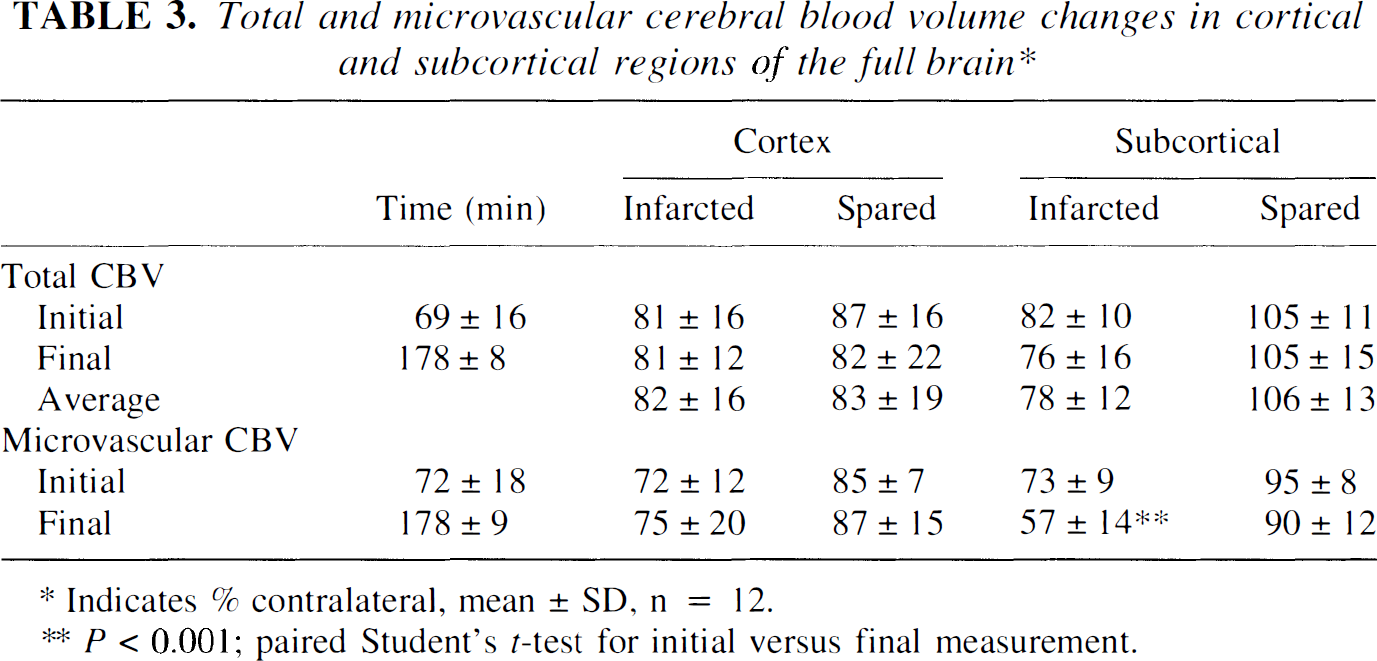
Indicates % contralateral, mean ± SD, n = 12.
P < 0.001; paired Student's t-test for initial versus final measurement.
DISCUSSION
Cerebral blood flow
The measurement of mean CBF in the contralateral hemisphere of 1.87 ± 0.19 mL/g/min is slightly higher than that reported in some other rodent studies (1.1 to 1.7 mL/g/min) (Bolander et al., 1989; Back et al., 1995), but the value is consistent with the slightly higher Paco2 levels in the authors' nonventilated rats and the use of halothane anesthesia. In regions that infarcted, marked CBF deficits were observed, whereas for spared regions, a lesser but still significant degree of hypoperfusion was present. The finding of static flow reduction in tissue destined to infarct was consistent with previous results in different species, using autoradiographic and noninvasive MR perfusion measurements (Dirnagl et al., 1989; Pappata et al., 1992; Schulz et al., 1997; Calamante et al., 1999). Thus, the current study further demonstrates that CBF alone cannot distinguish reversible from irreversible tissue damage without knowledge of ischemic duration.
Although this is the first study to measure CBF with a high-resolution imaging modality during early ischemia and compare it with infarction at a later time point in the same animals, several previous studies attempted to address this issue using either early histologic markers or different groups of animals. Tyson et al. (1984) demonstrated that CBF levels below 0.25 mL/g/min after 4 hours ischemia produced consistent histologic signs of derangement, whereas for CBF levels between 0.25 and 0.35 mL/g/min such signs were inconsistently observed. By examining the spatial coincidence of CBF and infarction measured in a separate group of animals, a flow level of 0.23 mL/g/min was found to be consistent with infarction using a photochemically-induced distal MCA thrombosis model (Back et al., 1995). In two separate studies, Jacewicz et al. (1990 and 1992) subjected normal Fisher and spontaneously hypertensive rats to both MCA and common carotid occlusion and found that a CBF level of 0.50 mL/g/min was most consistent with that determined histologically in separate groups of animals. The results presented in the current article of absolute CBF of 0.41 ± 0.33 mL/g/min between 1 and 3 hours of ischemia in infarcted tissue in the same rats after 24 hours are more consistent with the studies of Jacewicz et al. (1990 and 1992). This may reflect the similar timing of CBF measurements and infarct determination. Although the blinded observer relied on anatomical landmarks to delineate infarction areas, it is possible that a small amount of misregistration due to edema could still be present, making precise correlation of early and late markers of infarction difficult.
A previous study comparing a volume-based ASL method for measuring CBF with radiolabeled microspheres concluded that ASL underestimated flow by as much as 32% at low flow and suggested that this was likely due to increases in the arterial transit delay of labeled spins (Walsh et al., 1994). In this measurement, the authors aimed to decrease transit delay effects by using a postlabeling delay (Alsop and Detre, 1996), which has been demonstrated to be effective (Calamante et al., 1999). Arterial spin labeling is likely to have heightened sensitivity for CBF changes at low flow because direct flow effects and transit delay increases combine to affect the ASL signal; however, because of the overall variability in CBF levels measured, as demonstrated by the error bars in Fig. 3, small changes in CBF during this time period cannot be ruled out.
Total and microvascular CBV
Several experimental studies of susceptibility contrast MRI have demonstrated the accuracy of this tool for studying CBV changes in vivo.Boxerman et al. (1995) showed concordance between Monte Carlo and experimental susceptibility contrast studies with measurement of total CBV in rat brain using 125I-labeled albumin autoradiography. Also, Ostergaard et al. (1998), using a quantitative approach to dynamic susceptibility contrast found that the spin echo susceptibility contrast measurement was sensitive to approximately 50% of the total CBV, which is consistent with estimates of small vessel volume in the pig brain.
Steady-state susceptibility contrast methods, in which the contrast agent reaches an equilibrium blood level during the imaging period, improve the sensitivity of CBV measurements by increasing the available imaging time (Kent et al., 1990). Equilibrium methods may also be required for accurate measurement of CBV because they are less sensitive to regional flow differences. Incomplete or delayed access of the bolus to low flow regions may cause significant underestimations in bolus-based CBV measurements (Lassen and Perl, 1979; Hunter et al., 1997). Such underestimation is suggested by previous reports during early focal ischemia, in which steady-state techniques such as PET have consistently reported higher CBV levels than bolus MRI and CT studies (Pappata et al., 1992; Warach et al., 1992; Heiss et al., 1994; Furlan et al., 1996; Sorensen et al., 1996; Hunter et al., 1997). Gamma-variate fitting of the agent's first pass should minimize these problems; however, fitting a broad gamma-variate function under noisy conditions can be unreliable, especially in the presence of heterogeneous flow within a voxel (Boxerman et al., 1997). In the current study, total and microvascular CBV in tissue destined to infarct were significantly reduced from their mean value in the contralateral hemisphere during the 1 to 3 hours after occlusion. The absolute level of total CBV decrease was mild, which was consistent with other steady-state techniques in animals and humans (Powers et al., 1985; Heiss et al., 1992; Pappata et al., 1992; Furlan et al., 1996; Quast et al., 1997).
Although coupling between CBF and CBV has been demonstrated during Paco2 alterations (Grubb et al., 1974) and functional activation (Mandeville et al., 1998), it appears to break down during ischemia (Gibbs et al., 1984; Dijkhuizen et al., 1997; Quast et al., 1997; Schulz et al., 1997; Caramia et al., 1998). Microvascular CBV images are maximally sensitized to blood volume in capillaries, small arterioles, and small venules (Weisskoff et al., 1994). An important limitation of the technique is that it cannot distinguish between blood volume in these different vessels, which may behave differently during hypoperfusion. Nevertheless, by removing large vessel effects the technique offers a closer examination of microvascular hemodynamic changes, whose precise anatomical location and mechanism may be explored further with more invasive techniques. In this study, microvascular CBV reduction within the infarcted zones were larger than total CBV reduction, and both were less severely affected than CBF. No hyperemic regions surrounding infarcted tissue were observed; rather, small CBV decreases were noted in the hypoperfused regions that were spared. Such hemodynamic relations were in agreement with a previous study of global hypoperfusion (Zaharchuk et al., 1999).
Several studies have examined total and microvascular CBV changes after focal ischemia in rats. Jones et al. (1996) demonstrated microvascular CBV reduction greater than total CBV reduction in ipsilateral caudoputamen and cortex after 1 to 2 hours of MCAO. Mild microvascular CBV decreases in the MCA territory of rats using spin echo susceptibility contrast have also been shown after 4 hours of permanent MCAO (Quast et al., 1997). However, the current study differs from these previous studies in two key respects: the examination of temporal changes and the use of regions of interest based on histologic evidence of infarction in the same animals. Such an experimental protocol may be important given the known variability of rat stroke models.
In this study, the combination of constant CBF and total CBV reductions coupled with a progressive drop in microvascular CBV reflects a redistribution of blood volume between different compartments. One reasonable explanation is that flow is diverted from the microvasculature bed to thoroughfare channels, causing a decrease in capillary perfusion and a shift in blood volume from the microvasculature to larger vessels. Such behavior would be consistent with the concept of ineffective perfusion and venous pooling after focal ischemia (Tomita, 1988). Ultimately, such hemodynamic changes should lead to decreases in the oxygen extraction fraction, which appears to be a marker for irreversibly damaged tissue based on PET measurements (Sette et al., 1989; Powers, 1991).
Temporal evolution of microvascular cerebral blood volume
Progressively decreasing microvascular CBV levels during the period from 1 to 3 hours were seen only in the regions destined to infarct. This decrease could be attributed solely to changes in subcortical infarcted regions with static CBV reductions in cortical infarcted areas. Although the etiology of this decrease could not be elucidated in this study, several reports suggest that microvascular compromise is a significant feature of early ischemia, particularly in subcortical regions. Polymorphonuclear leukocytes have been found to occlude up to 40% of capillaries in the striatum of baboons after 2 hours focal ischemia (del Zoppo et al., 1991) and may be responsible for the “no-reflow” phenomenon after reperfusion (Ames et al., 1968). Polymorphonuclear leukocyte migration into tissue is maximal after 48 to 72 hours ischemia, but increases in polymorphonuclear leukocyte density that may cause vessel occlusion occur during the initial 4 hours of ischemia (Knight et al., 1994). Although a recent study suggested that all capillaries are perfused during the first hour after MCAO (Theilen et al., 1994), if ischemia is further prolonged, the ratio of perfused to nonperfused capillaries may change. Also, the swelling of astrocytic foot processes, which is known to occur with cytotoxic edema (Willard-Mack et al., 1996), may cause significant changes in microvascular CBV with minimal effects on total CBV.
The different microvascular structure of the striatum may explain the regional differences in microvascular CBV behavior. Cortical regions may be more resistant to microvascular compromise based on their ability to form perfusion collaterals. As the striatum is known to be the most difficult tissue to salvage with neuroprotective strategies, it is possible that targeting strategies that preserve the microvasculature may prove effective. Although it could not be observed in this study, microvascular CBV changes may occur later in cortical ischemic regions, as suggested by a previous report using a bolus technique (Dijkhuizen et al., 1997).
Microvascular CBV lesions developed in regions with the most severe CBF deficits, suggesting that microvascular CBV status may reflect increasing severity of the ischemic insult with time. This decrease occurred over the time period reported by previous studies to represent the therapeutic window in reperfusion models of ischemia in rats (Memezawa et al., 1992; Garcia et al., 1993) and evolves over a somewhat longer time period than the changes in apparent diffusion coefficient thought to represent the onset of cytotoxic edema (Moseley et al., 1990). Furthermore, apparent diffusion coefficient changes also appear to be different in cortical and subcortical regions (Hoehn-Berlage et al., 1995). Studies of the relation between apparent diffusion coefficient changes and microvascular CBV may shed light on the relation between microvascular perfusion changes and their effect on tissue metabolism.
Potential errors in susceptibility contrast cerebral blood volume measurements
Cerebral blood volume measurement errors with steady-state MR susceptibility contrast can occur with changes in blood contrast agent concentration or in such MR parameters as proton density, T1, T2, or T2*. The contrast agents used in the current study have biological half-lives on the order of 24 hours (Bogdanov et al., 1993; Mandeville et al., 1998). During the time between 1 and 3 hours ischemia, previous studies have shown no changes in proton density and only minimal changes in T1 (Hoehn-Berlage et al., 1995; Calamante et al., 1999). Because T1 insensitive sequences were used in the current study, the authors estimate an error of less than 0.3% based on T1 increases during this time frame. The relatively large contrast agent doses used in this study mitigate the effects of T2 and T2* changes that may reflect either blood oxygenation level-dependent effects or the onset of vasogenic edema (Hoehn-Berlage et al., 1995; Jiang et al., 1998). Also, any such errors would affect the measurements in rats using MPEG-PL-DyDTPA more significantly than those that received MION (a maximum possible effect of 11% versus 4%, respectively), because the baseline relaxivity increase for MPEG-PL-DyDTPA treated rats was greater than for those rats receiving MION. In the current study, no differences were seen between the two groups, and there were no parallel changes between microvascular (T2) and total (T2*) CBV measurements. Based on this, the authors believe that the actual error is far less, particularly as contrast agents remove the intravascular blood oxygenation level-dependent effect. Changes in the permeability of the blood–brain barrier would not affect the CBV measurements presented in this article because the contrast agents used are macromolecules with effective radii greater than 20 nm.
Finally, several authors have suggested that changes in flow may lead to errors in measuring CBV using susceptibility contrast. White et al. (1992) suggest that decreased flow would lead to CBV underestimation, whereas others (Hardy and Henkelman, 1991; Boxerman et al., 1995) predict that there may be a slight CBV overestimation with a maximum possible effect on the order of 10% for total and microvascular CBV. It is unlikely that such effects are responsible for the progressive decline in microvascular CBV in subcortical infarcted areas because similar flow levels are present in the infarcted cortex in the absence of such effects.
Conclusion
The fundamental finding of this study was that several different hemodynamic parameters (CBF, total CBV, and microvascular CBV) were found to have significantly discordant behavior in the early ischemic period. Thus, great care is required when interpreting perfusion-weighted imaging studies in humans that use different markers or combinations of markers to assess ischemic damage after human stroke, as not all markers of ischemia are equal. Differing degrees of CBF and total CBV reduction were observed in infarcted versus spared tissue, which were independent of ischemic time during the first 3 hours after occlusion. The authors found that microvascular CBV, measured by spin echo susceptibility contrast MRI, progressively decreased with the duration of the ischemic insult as the tissue became irreversibly damaged. Measurement of microvascular CBV, particularly using steady-state paradigms, may prove valuable for examining stroke in humans, as it may be sensitive to accumulated ischemic damage.
Footnotes
Acknowledgements
The authors thank Dr. Eng H. Lo for valuable discussions and encouragement.