
Abstract
The peripherally born metabolite of FDOPA, 3-O-Methyl-FDOPA (3OMFD), crosses the blood-brain barrier, thus complicating positron emission tomography-FDOPA (PET-FDOPA) data analysis. In previous reports the distribution volume (DV) of 3OMFD was constrained to unity. We have recently shown that the forward transport rate-constant of FDOPA (KS1) and the cerebellum-to-plasma ratio (Cb/Cp), a measure for the DV of 3OMFD, are functions of plasma large neutral amino acid (LNAA) concentration. Given large interstudy and intersubject differences in plasma LNAA levels, variations in the DV of 3OMFD are significant. In this report, the authors propose a constraint on the DV of 3OMFD that accounts for these variations. Dynamic PET-FDOPA scans were performed on 12 squirrel monkeys and 12 vervet monkeys. Two sets of constraints were employed on the compartmental model—M1 or M2. In M1, the striatal DV of 3OMFD was constrained to unity; in M2, the striatal DV of 3OMFD was constrained to an estimate derived from the cerebellum. Striatal and cerebellar time-activity curves were fitted using FDOPA and 3OMFD plasma input functions. The estimate of KS1 and that of the compartmental FDOPA uptake-constant (Ki), both obtained using M2, were adjusted to values corresponding to average LNAA levels. Finally, Ki was compared with the graphical uptake-constant (PKi). With the use of constraint M2, intersubject variability of squirrel monkey kS3 and Ki was reduced by 45% and 53%, respectively; and for vervet monkeys, by 54% and 44%, respectively. Intersubject variability of Kl and Ki was further reduced after correction for variations in intersubject plasma LNAA levels (for squirrel monkeys, by 67% and 41%; for vervet monkeys, by 40% and 36%, respectively). Ki correlation to PKi was enhanced to identity. Finally, average cerebellar kC2 estimates were more than 2.5-fold higher than striatal kS2 estimates (P < 0.0001). In modeling of PET-FDOPA data, it cannot be assumed that the DV of 3OMFD is unity. The cerebellar-derived constraint furnishes a reliable estimate for the DV of 3OMFD. Invoking the constraint and correcting for variations in plasma LNAA significantly reduced interstudy and intersubject variations in parameter estimates.
The central dopaminergic system has been implicated in movement disorders such as Parkinson's disease (Langston et al., 1990; Brooks et al., 1995; Scherman et al., 1989). In normal and disease subjects, dopamine is synthesized through a series of enzymatic-mediated reactions ending with the conversion of L-DOPA to dopamine by aromatic L-amino acid decarboxylase (AAAD; EC4.1.1.28). Idiopathic Parkinson's disease, however, is characterized with the loss of midbrain substantia nigra dopaminergic neurons, which house AAAD activity. L-3,4Dihydroxy-6-[18F]fluorophenylalanine (FDOPA), coupled with positron emission tomography (PET), is employed to assess the integrity of the central dopaminergic system. As a tracer analog of L-DOPA, FDOPA is decarboxylated by AAAD to 6-[18F]fluorodopamine (FDA) in the dopaminergic terminals of the striatum. Like dopamine, FDA accumulates, thus providing a measure for the integrity of the dopaminergic system (Barrio et al., 1988).
Various methods have been proposed to quantify this accumulation of FDA including simple specific-to-nonspecific affinity ratios (for example, striatum-to-cerebellum ratio) (Garnett, 1983; Leenders KL, 1986; Doudet et al., 1989), graphical methods (Patlak et al., 1983; Patlak and Blasberg, 1985; Martin et al., 1989; Ishikawa et al., 1996; Holden et al., 1997; Doudet et al., 1998; Takikawa et al., 1994), and compartmental models of varying degrees of complexity (Huang et al., 1989; Huang et al., 1991a; Reith et al., 1990; Kuwabara et al., 1993; Cumming et al., 1994; Deep et al, 1997). Compartmental models, however, are attractive because they can be used to investigate the underlying biochemical and transport mechanisms. Recent reports suggesting that AAAD activity is modulated (Zigmond, 1997; Eberling et al., 1997; Bezard et al., 1997a; Bezard et al., 1997b; Bezard et al., 1998; Bezard and Gross, 1998; Yee et al., 2000), to possibly compensate for dopaminergic deficiencies, advance the application of compartmental models on PET-FDOPA data because they can be used to quantify AAAD activity in humans (Huang et al., 1991a; Kuwabara et al., 1993; Deep et al., 1997) and non-human primates (Yee et al., 2000).
The interpretation of FDOPA-PET data is compromised by the presence of a peripherally born metabolite, 3-O-Methyl-FDOPA (3OMFD), which crosses the blood—brain barrier (BBB), thus contributing to the total radioactivity in brain tissue. This particularly complicates compartmental modeling analysis by introducing two critical issues. The first issue questions the forward transport rate-constant of 3OMFD relative to FDOPA in crossing the BBB (KS5/KS1) (Huang et al., 1991a; Reith et al., 1990; Cumming et al., 1994; Dhawan et al., 1996; Wahl and Nahmias, 1996), and the other issue concerns the distribution volume (DV) of 3OMFD in the striatum (KS5/kS6) (Horne et al., 1984; Doudet et al., 1991; Melega et al., 1991a; Dhawan et al., 1996; Wahl and Nahmias, 1996). Although the first issue has been addressed in several investigations, most recently arguing that the forward transport rate-constant of 3OMFD relative to FDOPA in crossing the BBB is approximately unity (Cumming et al., 1994; Dhawan et al., 1996; Wahl and Nahmias, 1996), the latter issue has only been investigated by advancing a population mean rather than at an individual subject level (Doudet et al., 1991; Wahl et al., 1994).
In earlier reports it was assumed that 3OMFD is uniformly distributed in cerebral tissue (Huang et al., 1991a; Reith et al., 1990; Kuwabara et al., 1993; Deep et al., 1997; Hoshi et al., 1993; Cumming et al., 1994). It was further assumed that either the striatal DV of 3OMFD (that is, KS5/kS6) is unity (Huang et al., 1991a, Doudet et al., 1991), or that the striatal partition coefficients (the ratio of forward-to-reverse transport rate-constants across the BBB) of both FDOPA and 3OMFD (that is, KS1/kS2 and KS5/kS6, respectively) equal that of the frontal cortex (Reith et al., 1990; Kuwabara et al., 1993; Deep et al., 1997; Hoshi et al., 1993; Cumming et al., 1994). Recent studies suggest that the first assumption is upheld, with a slightly higher radioactivity in the striatum (approximately 10%) (Wahl et al., 1994; Stout et al., 1999). The second set of assumptions, however, has been challenged by several reports. Dhawan et al. (1996) reported that the striatal partition coefficient of FDOPA (that is, KS1/kS2) does not equal that of the frontal cortex. Moreover, because transport across the BBB is mediated by the large neutral amino acid (LNAA) carrier system (Oldendorf, 1971; Oldendorf and Szabo, 1976), for which both FDOPA and 3OMFD must compete, Stout et al. (1998a) demonstrated that the forward transport rate-constant of FDOPA (that is, KS1) is a function of plasma LNAA levels. Stout et al. (1998a) also demonstrated that the cerebellum-to-plasma ratio (Cb/Cp), 120 minutes post-FDOPA administration, is inversely related to plasma LNAA levels. Because at 120 minutes post-FDOPA administration the radioactivity in the cerebellum and plasma is primarily due to 3OMFD, Cb/Cp should characterize the DV of 3OMFD at late time points (Huang et al., 1998).
In the following section, we demonstrate how intersubject variations in plasma LNAA levels might be linked to comparable variations in the striatal DV of 3OMFD, and that the latter might be ascribed to the competitive nature of LNAA transport across the BBB. With that at hand we reexamined FDOPA kinetics in cerebral tissue by proposing a constraint on the striatal DV of 3OMFD that takes into account interstudy and intersubject variations in plasma LNAA levels. In doing so, we will contrast changes to striatal parameter estimates between the case for which the striatal DV of 3OMFD is constrained to unity to that which takes into account variations in plasma LNAA. We will show, using two sets of monkey PET-FDOPA data, that by using this constraint, intersubject variations in parameter estimates are reduced.
Theory
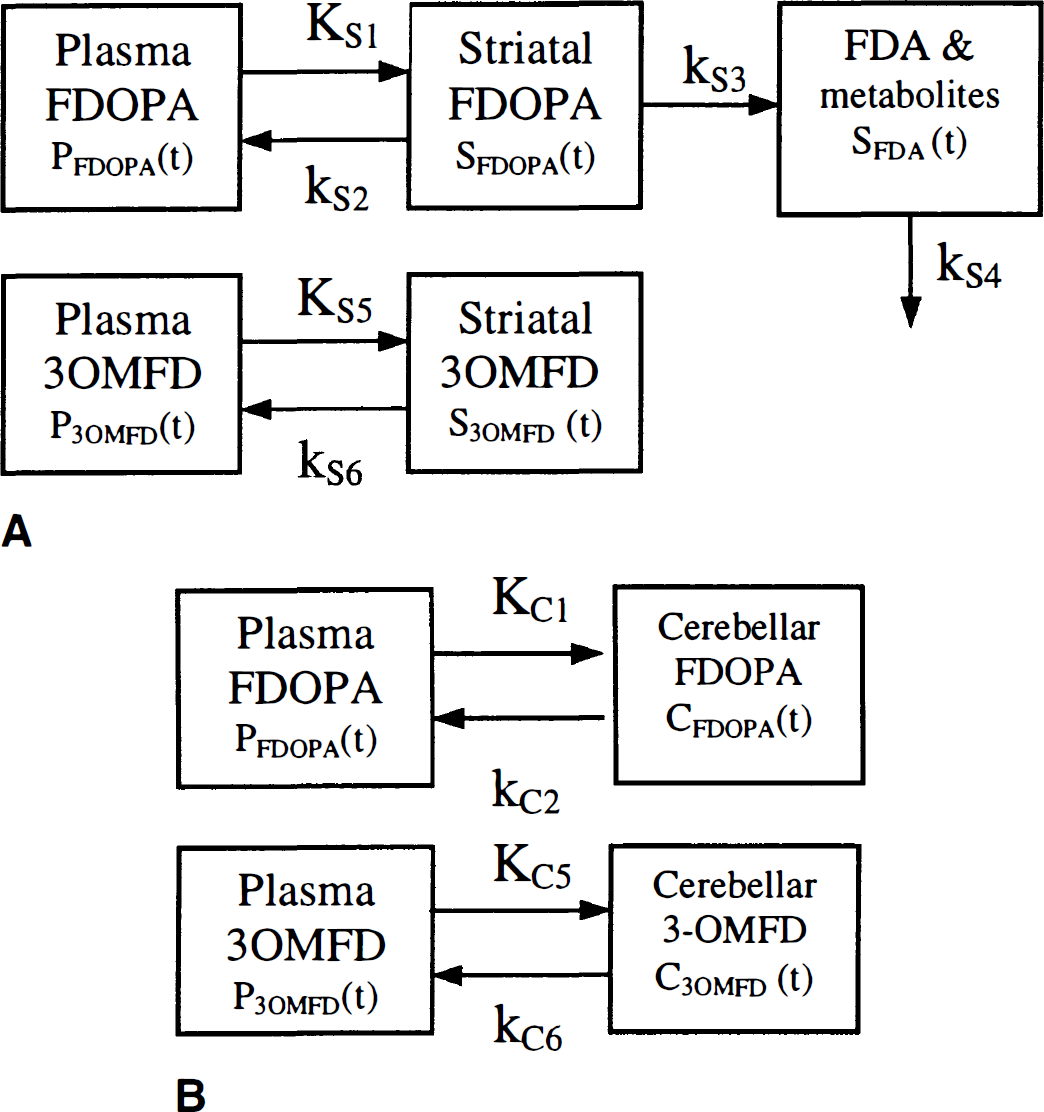
The various transport and biochemical pathways of FDOPA are depicted in the compartmental model of Huang et al. (1991a) (Fig. 1). The plasma component consisted of a pool for FDOPA (PFDOPA) and its major peripheral metabolite, 3OMFD (P3OMFD), which cross the blood—brain barrier (BBB) through the facilitated LNAA transport system (Oldendorf, 1971; Oldendorf and Szabo, 1976). In the striatum, the bidirectional passage of FDOPA across the BBB is denoted by the rate-constants KS1 and kS2 (mL · g−1 · min−1 and min−1, respectively); whereas, the bidirectional transport of 3OMFD across the BBB is denoted by the rate-constants KS5 and kS6 (mL · g−1 · min−1 and min−1, respectively). The radioactivity concentrations of FDOPA and 3OMFD in the striatum are denoted by SFDOPA and S3OMFD, respectively. The fate of FDOPA after it passes the BBB is tissue-dependent. In the striatum, FDOPA is decarboxylated to FDA by AAAD with a rate-constant kS3 (min−1). The AAAD mediated conversion of FDOPA introduces a compartment for FDA and its metabolites (SFDA). Clearance of 18F radioactivity from striatal tissue to plasma is represented by the rate-constant kS4 (min−1). A similar model is proposed for the kinetics of FDOPA and 3OMFD in the cerebellum except that AAAD activity is assumed absent (that is, kC3 = 0) (Melega et al., 1990a; Melega et al., 1991b; Baker et al., 1991; Sims et al., 1973; Loyd et al., 1972) and kC4 = 0. By replacing the character ‘S' with ‘C‘, we denote cerebellar rate-constants and radioactivity concentrations.
The striatal
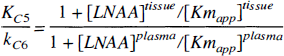
Fitting an unconstrained striatal (5 parameters) or cerebellar (4 parameters) model to PET-derived tissue kinetics resulted in large variability of parameters estimates (large asymptotic standard error), which necessitated the introduction of physiologically motivated constraints. First, we constrained the ratios KC5/KC1 and KS5/KS1 to a common value. Based on the Michaelis—Menten equation for competitive enzyme binding or carrier transport, the influx (nmol · min−1 · g−1) of a particular LNAAi across the BBB can be formulated (Huang et al., 1998) as
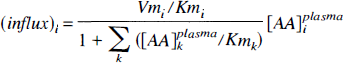
where [AA] i plasma, Vmi, and Kmi denote the plasma concentration, maximal rate (nmol · min−1 · g−1), and half-saturation concentration (nmol · mL) of LNAAi for the transport carrier.
Assuming that LNAA transport across the BBB is mediated by a dominant carrier, the cerebellar transport rate-constant of 3OMFD relative to FDOPA in crossing the BBB (KC5/KC1) reduces to the following expression:
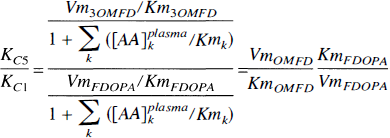
Equation 2 entails that the transport rate-constant of 3OMFD relative to FDOPA in crossing the BBB is a function of the Michaelis—Menten parameters Vm and Km of both FDOPA and 3OMFD, where Vm represents a measure of carrier density (or concentration) and Km represents the transport efficiency (inversely related to affinity) of the carrier. In addition, Eq. 2 implies that the relative transport rate-constant is unaffected by plasma LNAA levels. Assuming that the transport of LNAAs across the BBB in and out of the striatum and cerebellum is mediated by the same carrier, the ratio is also unaffected by differences in localities. The striatum and cerebellum thus share a common ratio for the transport rate-constant of FDOPA and 3OMFD, that is,
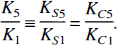
Recent reports suggest that the transport rate-constant of 3OMFD relative to FDOPA is unity in humans (Wahl and Nahmias, 1996; Dhawan et al., 1996) and rats (Cumming et al., 1994), that is, K5/K1 = 1. Interspecies dependencies for the ratio have been reported (Huang et al., 1991a; Reith et al., 1990) and will be addressed in the Discussion section.
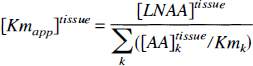
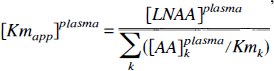
Secondly, the striatal DV of 3OMFD (KS5/kS6) in each study was constrained to the cerebellar DV of 3OMFD (KC5/kC6). The DV of a biochemically inactive radiolabeled LNAA in brain tissue has been characterized by Huang et al. (1998). The cerebellar DV of 3OMFD (with a dominant transport carrier) can be formulated as,
where,
MATERIALS AND METHODS
Animals
Twelve guyana squirrel monkeys (Saimiri sciureus) and twelve vervet monkeys (Cercopithecus aethips sabaeus) were used in this investigation. The University of California, Los Angeles Animal Research Committee approved all procedures and protocols.
PET Protocol
Blood and LNAA analysis
During and after PET data acquisition process, total radioactivity in plasma, due to FDOPA and its metabolites, were determined and decay-corrected to time zero (time of FDOPA administration). This was then used to construct total plasma FDOPA and 3OMFD time-activity curves (TACs) (Huang et al. 1991b; Melega et al., 1991a; Melega et al., 1991b), which were utilized as input functions in subsequent kinetic data analysis. Plasma concentration of LNAAs—including tryptophan, tyrosine, methionine, valine, phenylalanine, leucine, isoleucine—were determined by following previously prescribed procedures (Barrio et al. 1986).
Image processing
All images were reconstructed using filtered-backprojection with measured attenuation correction. Dynamic images were reconstructed using a Hann filter (0.3 Nyquist cutoff) resulting in an in-plane resolution of 5.5 mm full width at half maximum. Because of the high noise level of dynamic images, a low noise sum image was reconstructed from PET data collected over a 90-minute period (30 to 120 minutes) using a Shepp 0.5 filter (4.7 mm full width at half maximum). It was on these images that striatal (left and right) regions of interest (ROIs) were defined and overlaid onto the dynamic images to obtain the striatal TAC.
Determination of nonspecific uptake was furnished by defining ROIs on the cerebellum. For squirrel monkeys, cerebellar ROIs were evaluated by coregistration of PET-summed images to anatomical MRI images (Lin et al, 1994). Subsequently, PET-to-MRI registration parameters were used to reslice dynamic PET images. Cerebellum ROIs (6-mm diameter) were defined on MRI and applied to the resliced dynamic PET images to give cerebellar TAC. For vervet monkey studies, cerebellar ROIs were determined by drawing a circular ROI (6-mm diameter) on summed images, which were then projected onto all frames of dynamic images.
Kinetic analysis
Configuration of parameter constraints for FDOPA model of Fig. 1
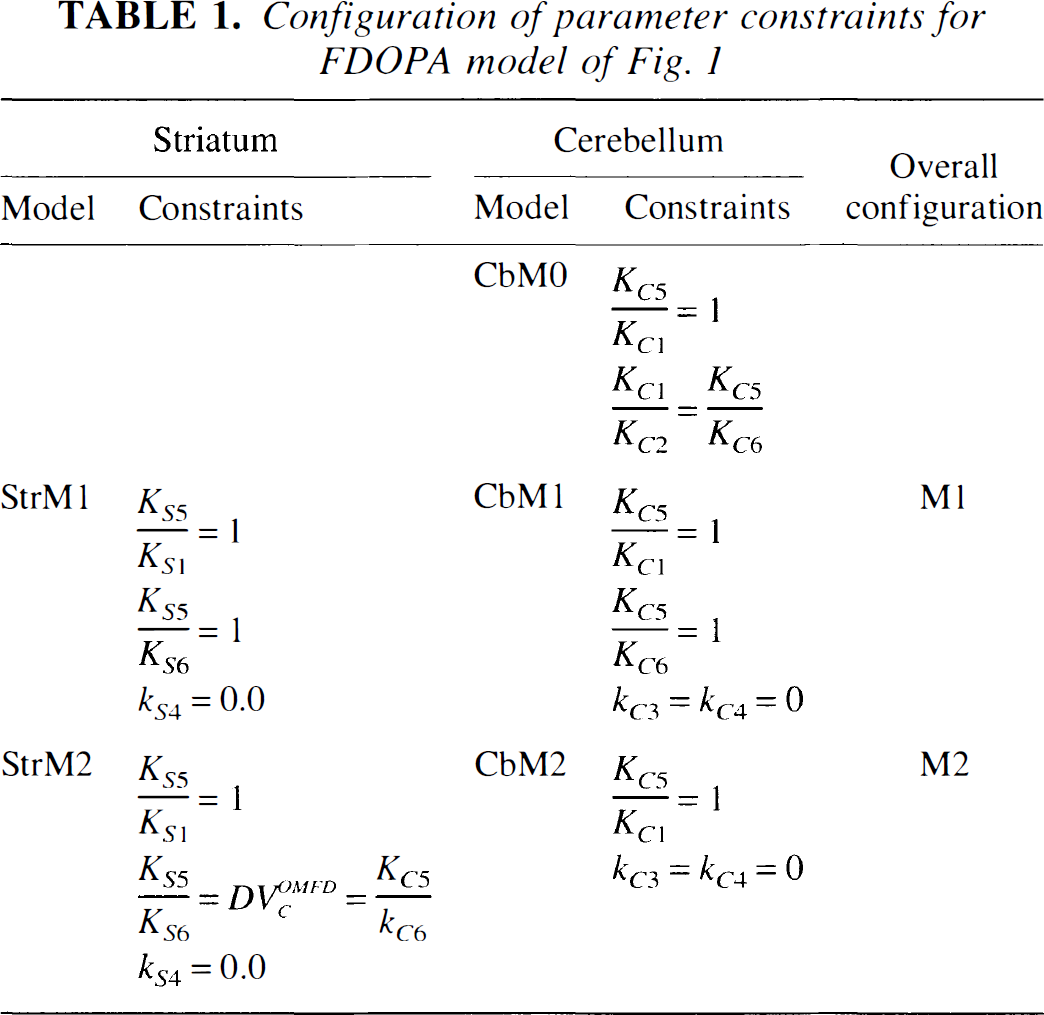
In fitting striatal ROI data with the model of Fig. 1A two sets of constraints were employed (Table 1). In StrM1, the striatal DV of 3OMFD was constrained to unity; and in StrM2, the striatal DV of 3OMFD was constrained to that of the cerebellum (Table 1). In addition, based on a recent report by Wahl and Nahmias (1996), striatal 18F clearance was assumed negligible (kS4 = 0.0 min−1) for constraints StrM1 and StrM2. The striatal DV of FDOPA was given by DVSFDOPA = KS1/(kS2 + kS3) (mL · g−1). The compartmental FDOPA uptake-constant relative to plasma FDOPA concentration was given by Ki = KS1kS3/(kS2 + kS3) (mL · g−1 · min−1). The set of constraints given by CbM1-StrM1 and CbM2-StrM2 made up the overall constraint configurations M1 and M2, respectively (Table 1).
Cerebellar and striatal kinetic analysis was performed with the transport rate-constant of 3OMFD relative to FDOPA constrained to unity (that is, KS5/KS1 = KC5/KC1 = 1) (Table 1). However, a cerebellar residual sum of squares (RSS) profile as a function of KC5/KC1, ranging from 0.5 ≤ KC5/KC1 ≤ 3 for squirrel and vervet monkeys, was plotted for each study to examine its effects on the RSS value and the cerebellar DVs of 3OMFD and FDOPA (Fig. 2). The constraints described in Table 1 permitted 3 fitted parameters for the striatal model (namely, KS1, kS2, and kS3) and 3 fitted parameters for the cerebellar model (namely, KC1, kC2, and kC6).
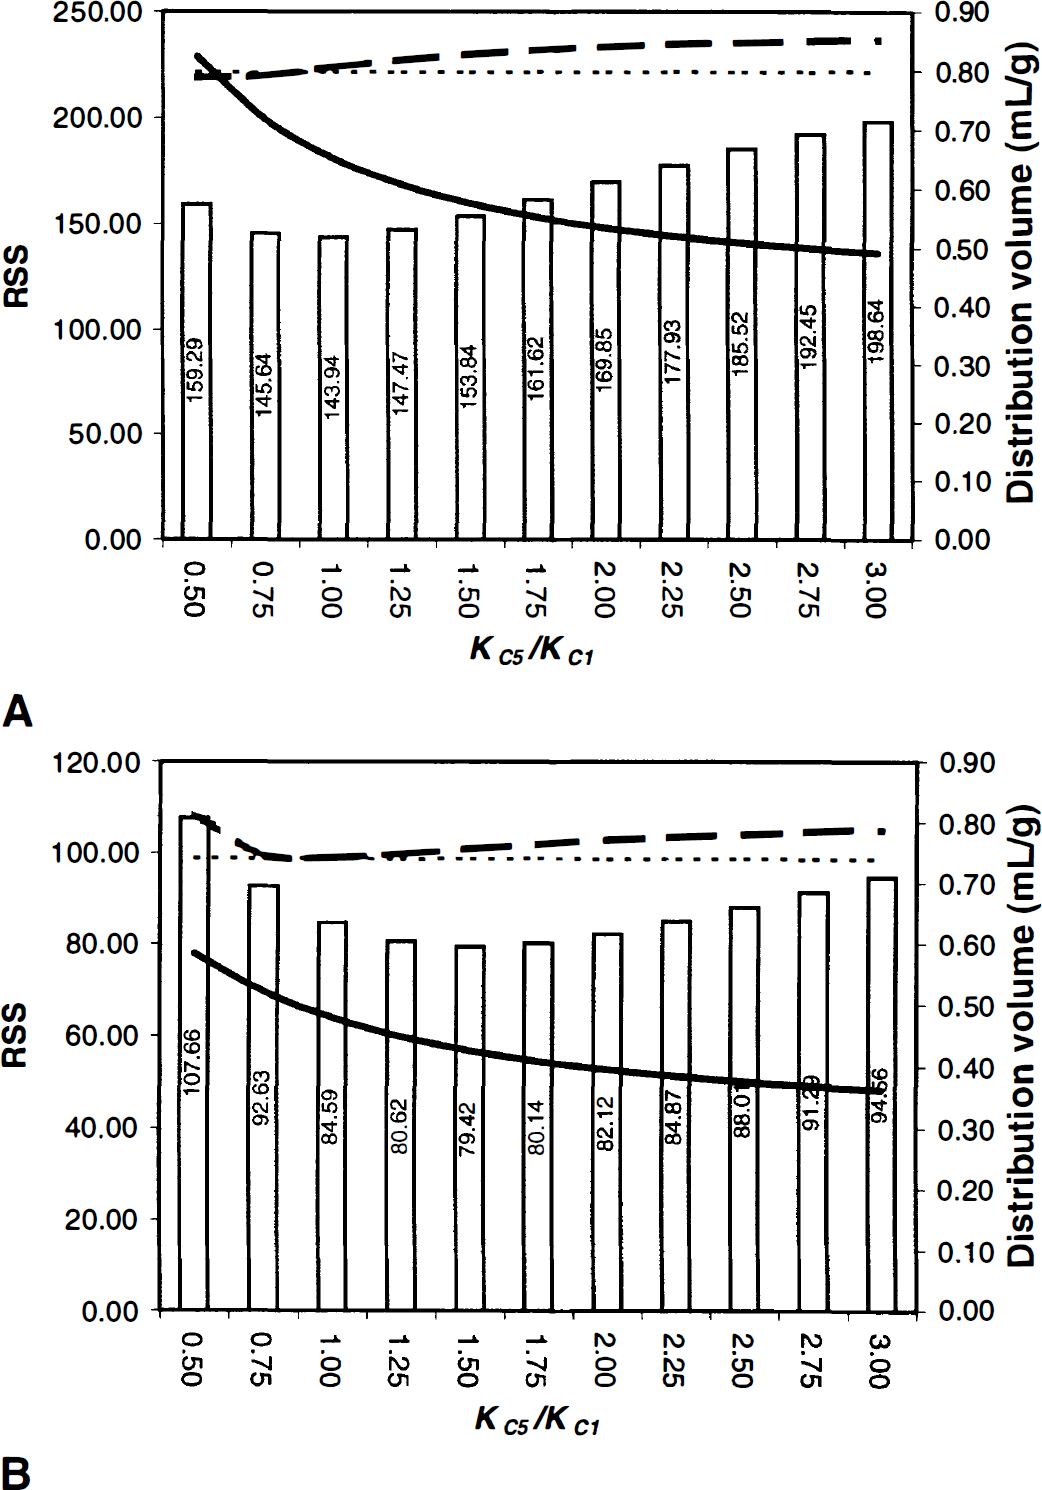
The cerebellar distribution volume (DV) of 3OMFD (DVC3OMFD, dark dashed line), cerebellar DV of FDOPA (DVCFDOPA dark solid line), and the residual sum of squares (bar representation) as a function of the forward transport rate-constant of 3OMFD relative to FDOPA in crossing the blood—brain barrier (KC5/KC1) for squirrel monkeys
Tissue TACs were preprocessed by subtracting a vascular component that assumes a 5% blood volume in striatal and cerebellar ROIs (Phelps et al., 1979). In fitting the compartmental models of Fig. 1 to PET data, FDOPA and 3OMFD plasma TACs were used as input functions. All model fitting and simulations were performed with a software package for kinetic data analysis, BLD (Carson et al., 1981), using a weighted least-square criterion and the Marquardt algorithm. The weightings used were scan duration divided by activity level (Chen et al., 1991).
LNAA correction
To correct for the effects of plasma LNAA on transport across the BBB (Stout et al., 1998a), the estimates of KS1 and Ki were adjusted to values corresponding to the average LNAA concentration of squirrel (LNAAAVG = 408.1 μmol/L) and vervet monkeys (LNAAAVG = 434.4 μmol/L). The transformation was based on the linear regression line of KS1 against plasma LNAA concentration (Fig. 3). For squirrel monkeys the transformation for KS1 is KS1 transformed = KS1 estimate −0.00008·(LNAAAVG − LNAA), and for vervet monkeys the transformation is KS1transformed = KS1estimate −0.00005·(LNAAAVG − LNAA). For squirrel and vervet monkeys the transformed Ki estimate is given by the relation Kitransformed = KS1 transformed ·kS3/kS2 + kS3). The percent change between the parameter estimates with and without LNAA correction was calculated.
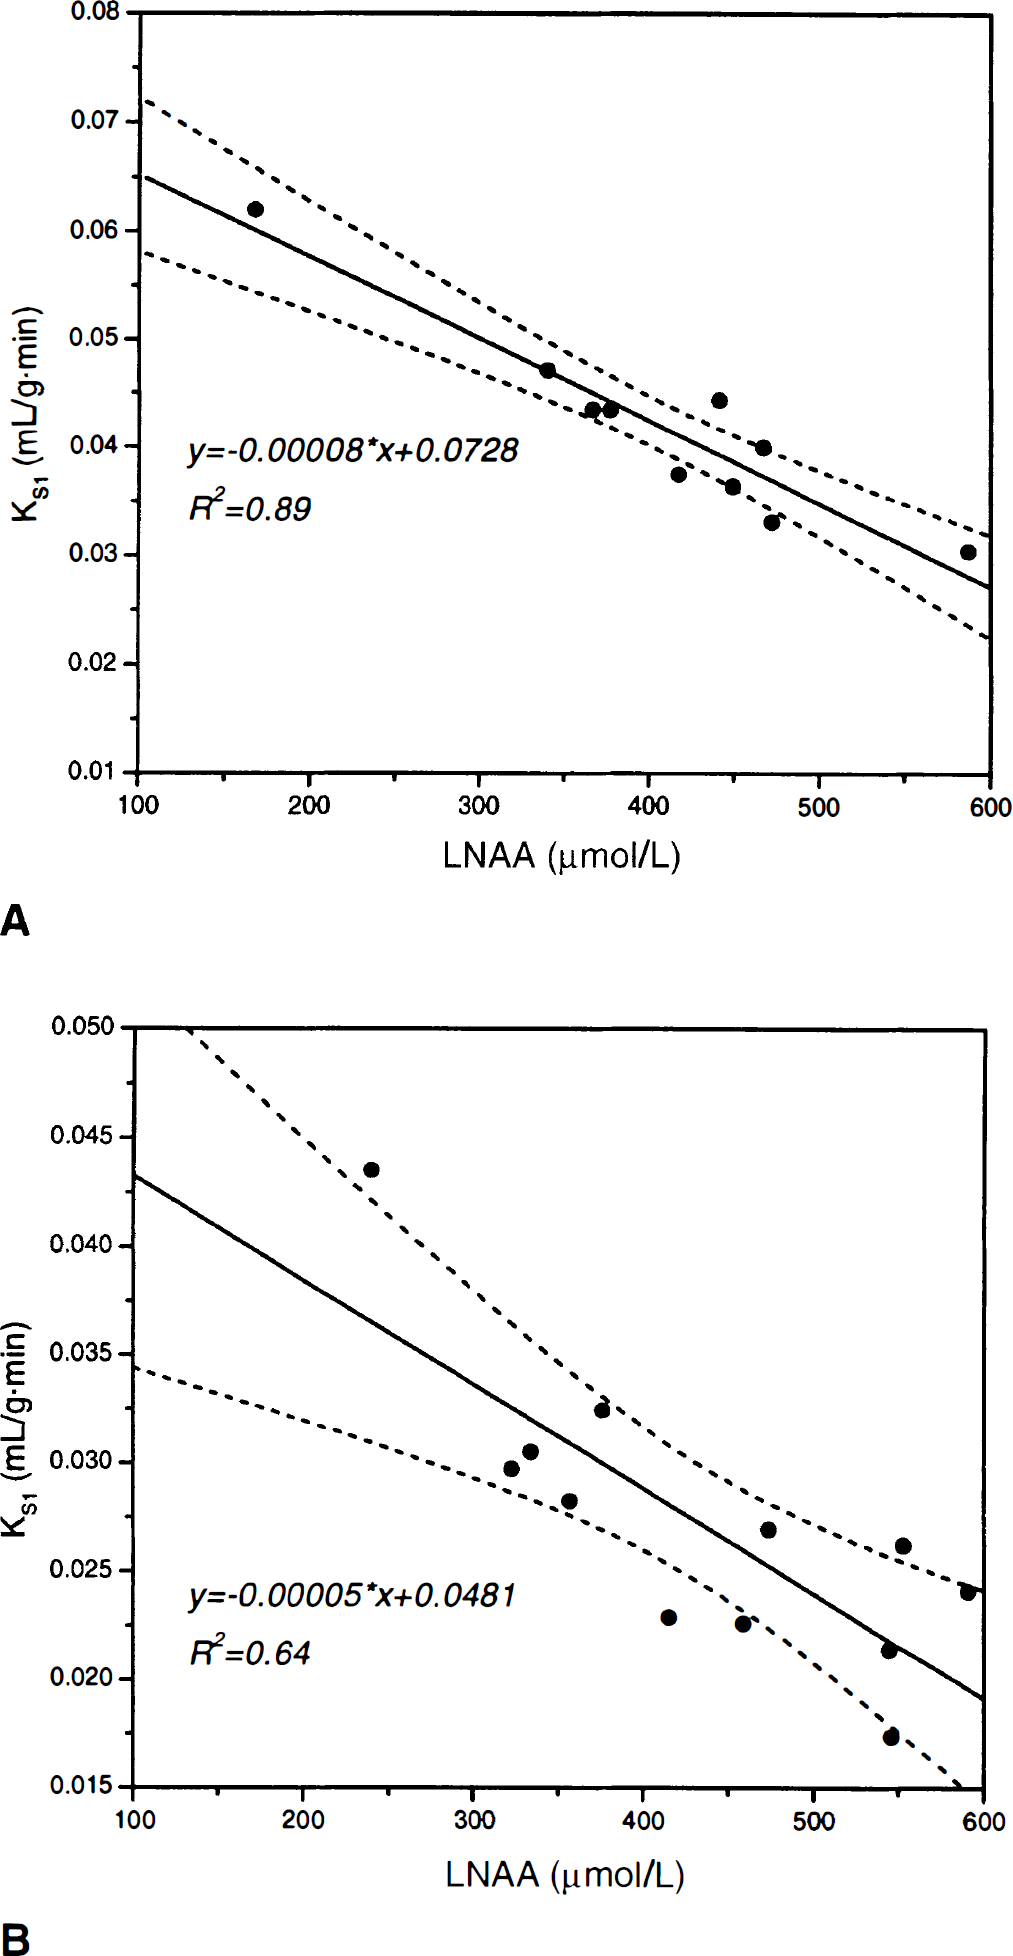
Dependency of the forward transport rate of FDOPA across the blood—brain barrier on plasma LNAA concentration for squirrel monkeys
Statistical analysis
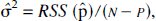
The confidence interval for the ratio K5/K1 was based on the maximum likelihood profile given by RSS. As an illustration, let

Then an approximate 95% confidence interval for p1 true consisted of the values of p̂1 for which

where
RESULTS
Cerebellum
Fitting an unconstrained (all parameters are fitted) cerebellar model resulted in large variability in parameter estimates (large asymptotic variance) and poor convergence. Fitting the cerebellar tissue TAC with constraint CbMO or CbM1 (Table 1) resulted in residual values that were correlated with time (plot not shown), which implied the inadequacy of the model (Landaw and Distefano, 1984). For squirrel monkeys, fitting the cerebellum with model CbM2 resulted in a significantly better fit (F-test; Landaw and Distefano, 1984) compared with models CbMO

and CbM1 (excluding two studies)

Similarly, for vervet monkeys, the fit with constraint CbM2 was significantly better than with constraint CbM0

or constraint CbM1 (excluding two studies)

In four instances, two from each group, the fit of constraint CbM2 was not significantly better than constraint CbM1 because the estimated ratio KC5/kC6 was close to unity (see Discussion).
Figure 2 (bar representation) depicts a cerebellar RSS profile as a function of the constrained ratio 0.5 ≤ KC5/ KC1 ≤ 3, for squirrel monkeys (Fig. 2A) and vervet monkeys (Fig. 2B). Figure 2 illustrates that for this particular squirrel monkey study a RSS local minima occurred approximately at KC5/KC1 = 1 (with a 95% confidence interval of 0.5 < KC5/KC1 < 2) and for a vervet monkey occurred at KC5/KC1 = 1.5 (with a 95% confidence interval 0.25 < KC5/KC1 < 3.25). The values of KC5/KC1 that minimized the RSS profiles of all squirrel monkeys were in the interval 0.75 ≤ KC5/KC1 ≤ 1 and in the interval 0.75 ≤ KC5/KC1 ≤ 3.25 for vervet monkeys. Because of the variability in KC5/KC1, we constrained the ratio KC5/KC1 to unity (that is, KC5/KC1 = 1) following recent reports by Cumming et al. (1994), Wahl and Nahmias (1996), and Dhawan et al. (1996).
Figures 4A and 4B depict a typical cerebellar model fit with constraint CbM2. The figures illustrate that the measured cerebellar activity is fitted well by the model. At late time points, cerebellar radioactivity consists primarily of 3OMFD (90% for squirrel and 89% for vervet monkeys). Comparable 3OMFD fractions are found in plasma at 120 minutes post-FDOPA injection (Tables 2A and 2B, columns A and B).
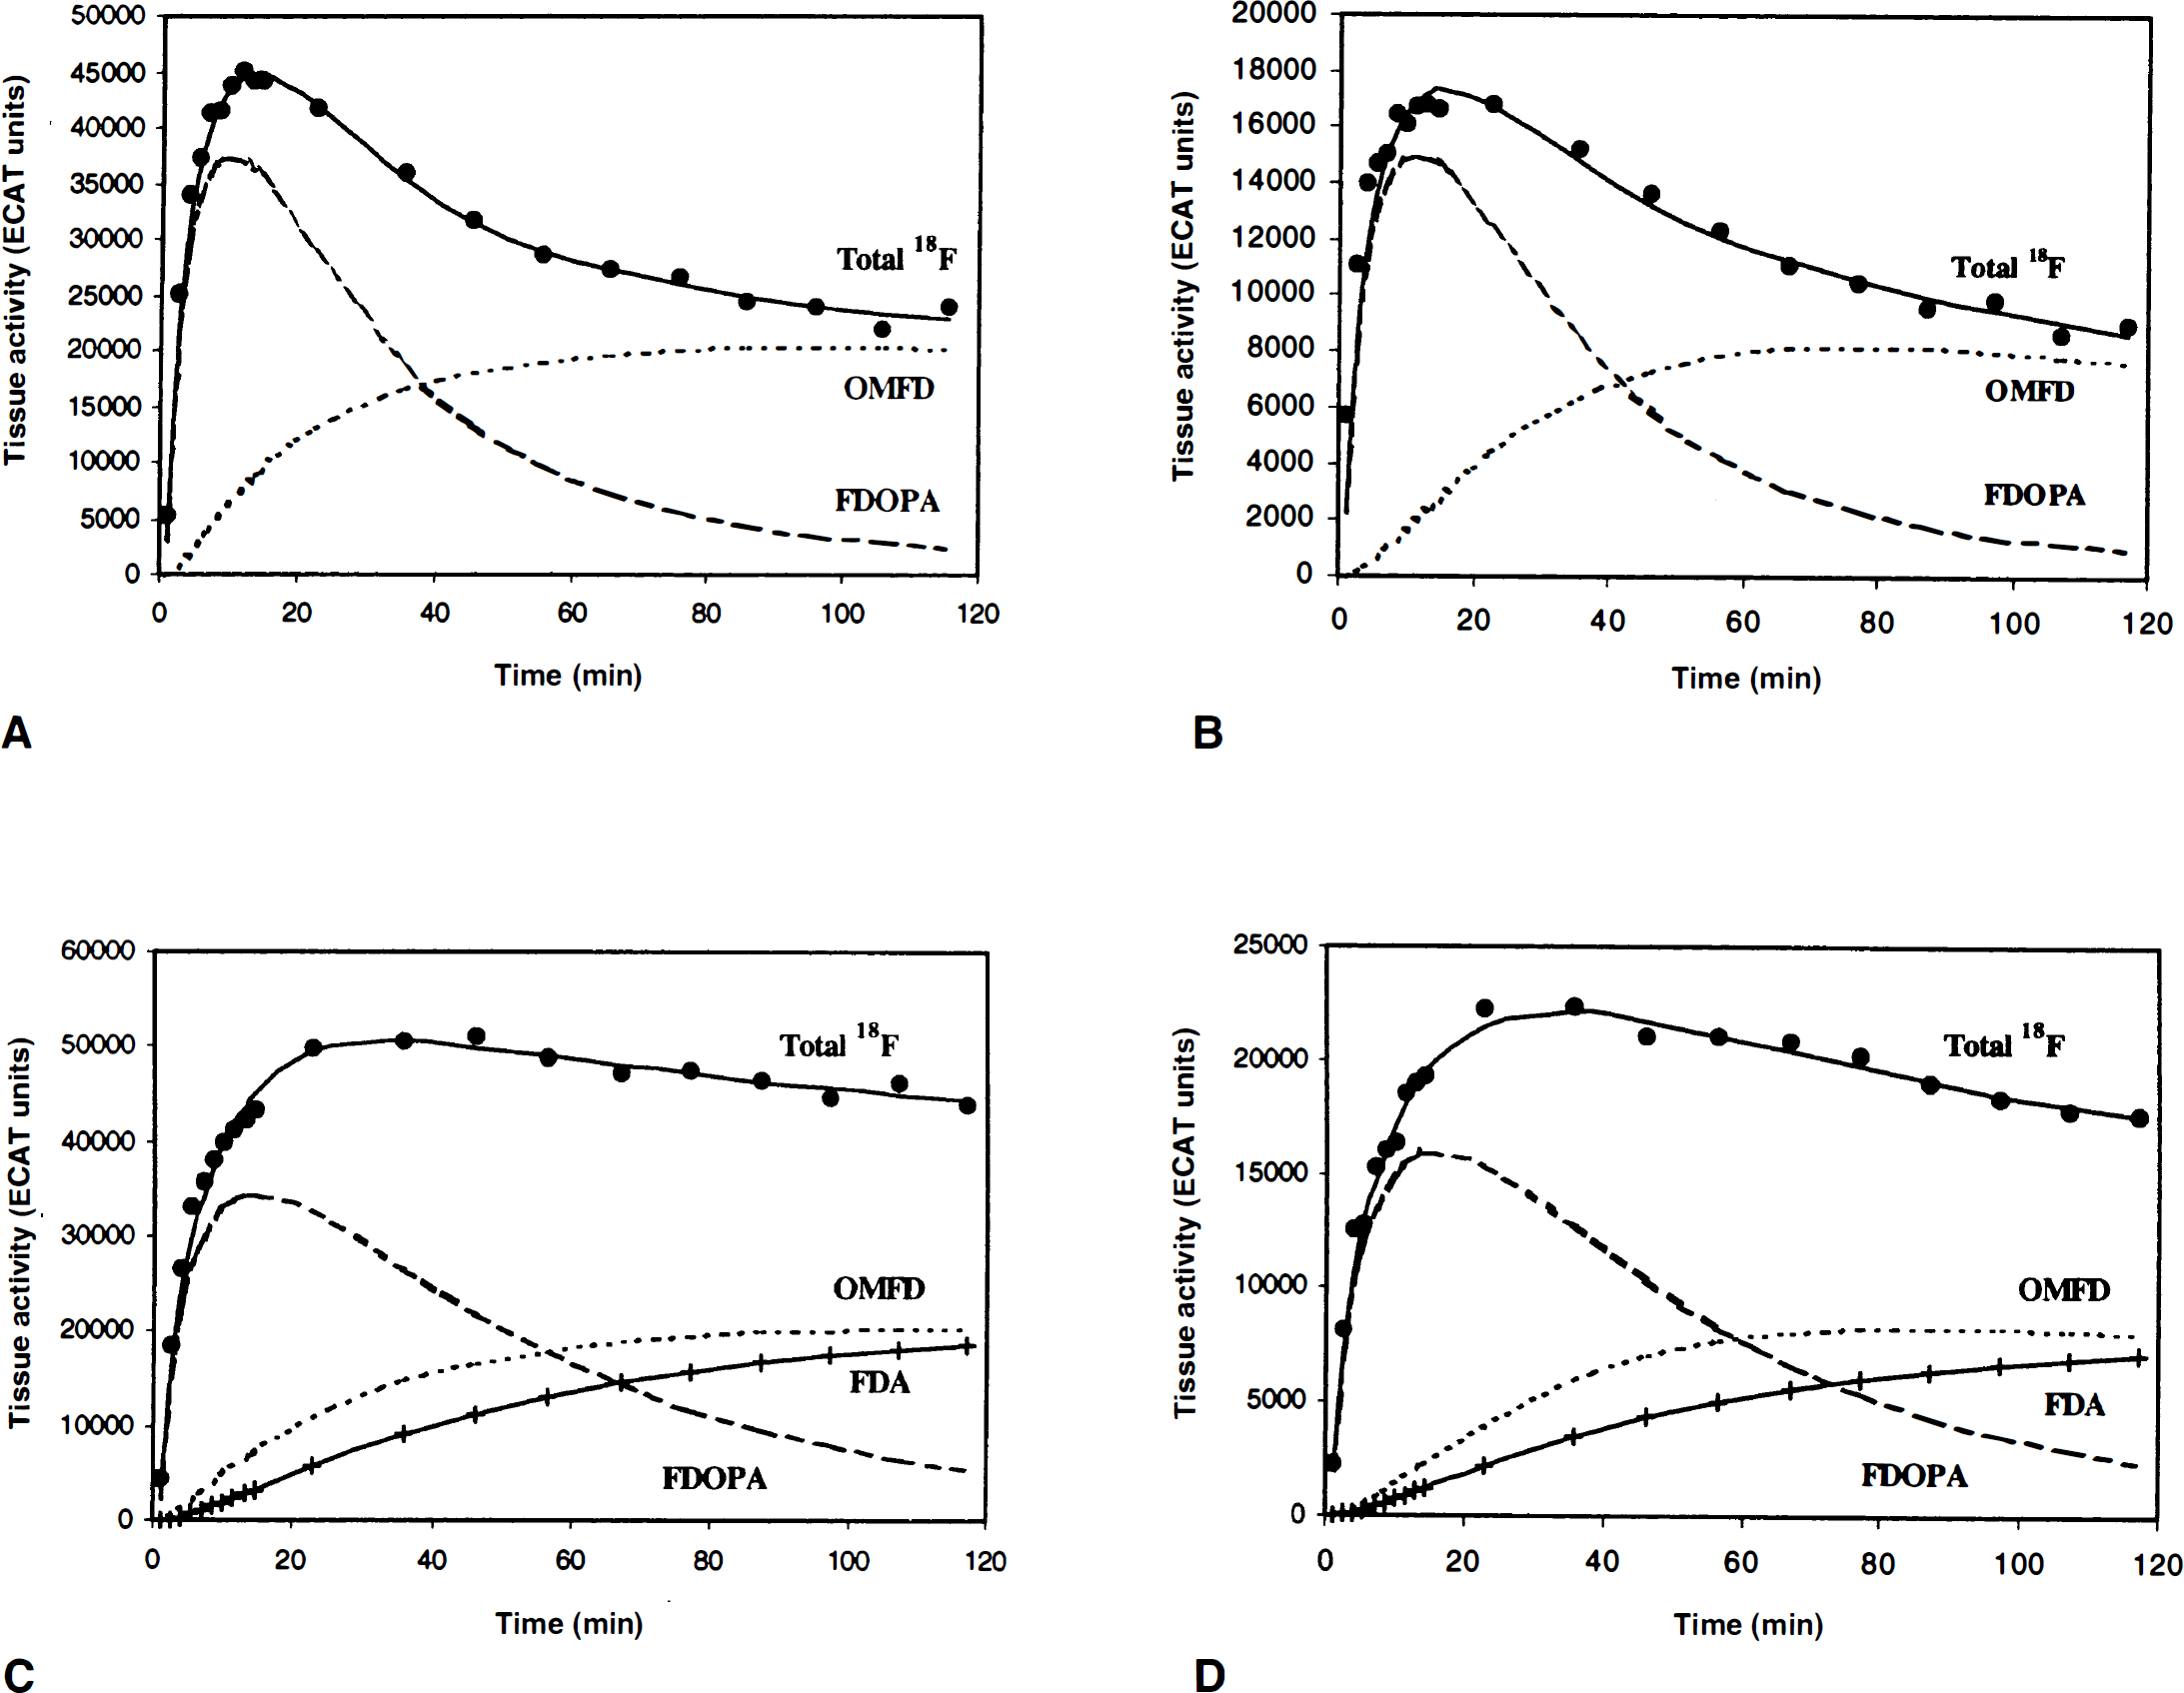
Typical cerebellar model fit to cerebellar time-activity curves (TACs) for squirrel
Squirrel monkey blood and ROI analysis at 120 minutes post-FDOPA administration
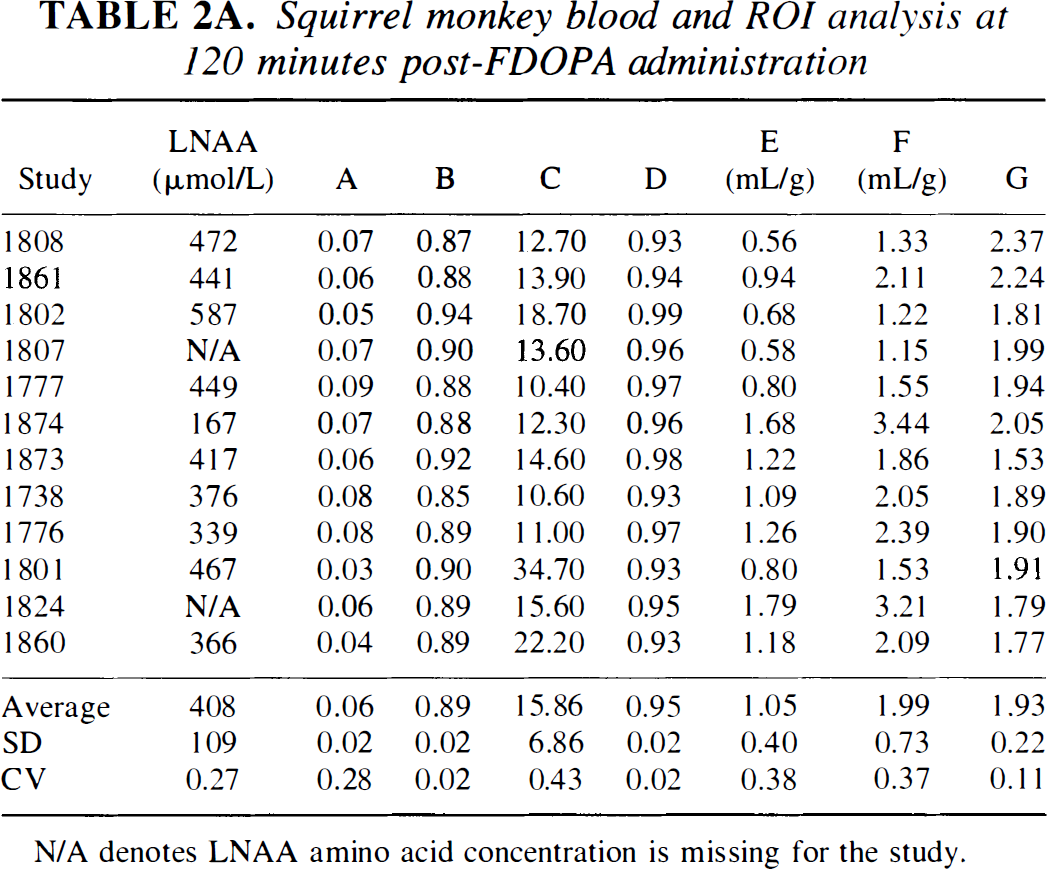
N/A denotes LNAA amino acid concentration is missing for the study.
Vervet monkey blood and ROI analysis at 120-minutes post-FDOPA administration
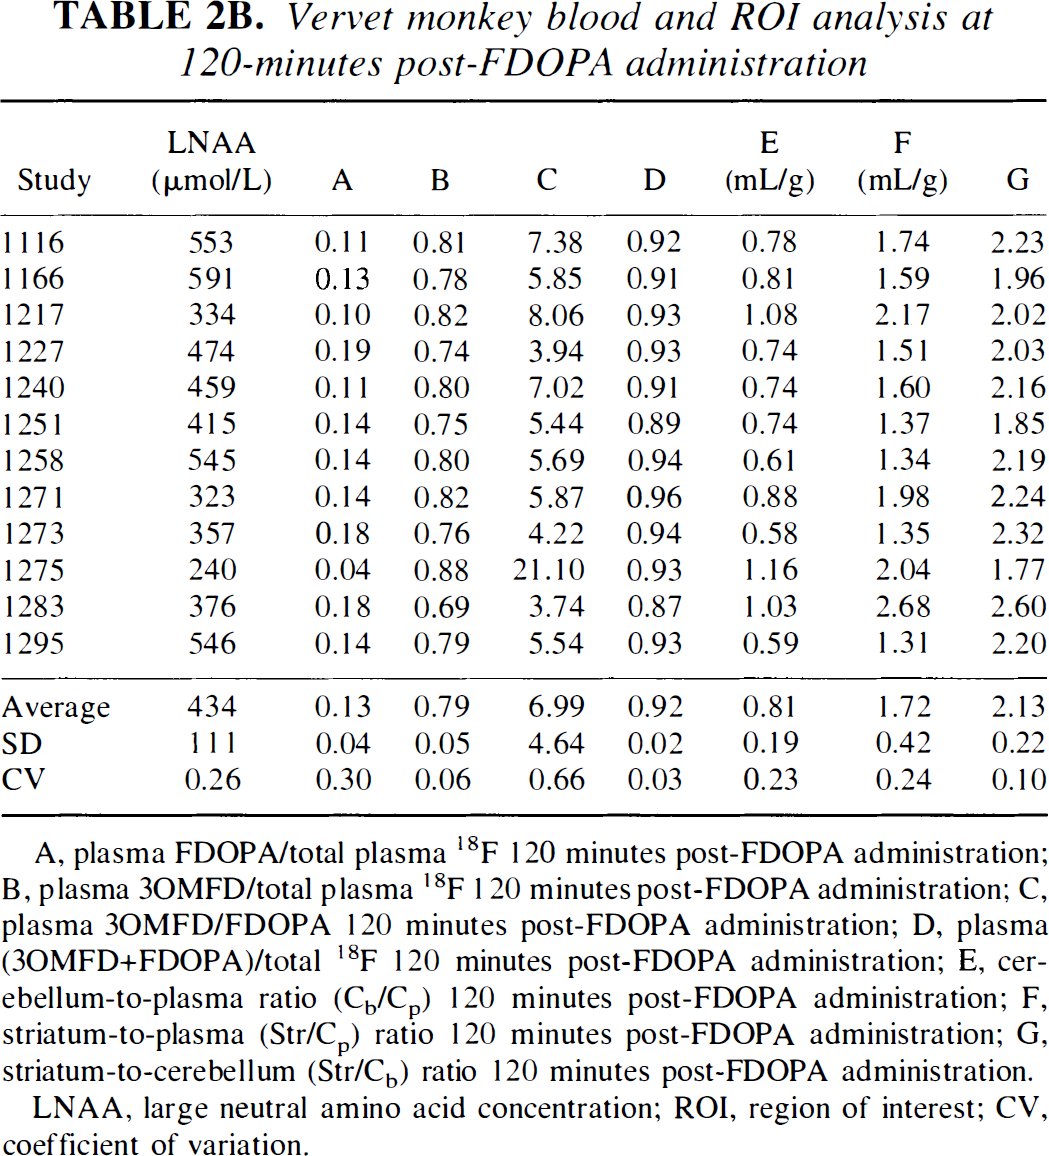
A, plasma FDOPA/total plasma 18F 120 minutes post-FDOPA administration; B, plasma 3OMFD/total plasma 18F 120 minutes post-FDOPA administration; C, plasma 3OMFD/FDOPA 120 minutes post-FDOPA administration; D, plasma (3OMFD+FDOPA)/total 18F 120 minutes post-FDOPA administration; E, cerebellum-to-plasma ratio (Cb/Cp) 120 minutes post-FDOPA administration; F, striatum-to-plasma (Str/Cp) ratio 120 minutes post-FDOPA administration; G, striatum-to-cerebellum (Str/Cb) ratio 120 minutes post-FDOPA administration.
LNAA, large neutral amino acid concentration; ROI, region of interest; CV, coefficient of variation.
Tables 3A and 3B show tabulations of cerebellar parameter estimates for squirrel and vervet monkeys, respectively. Table 3A reveals that the average reverse transport rate of FDOPA across the BBB (kC2 = 0.0678 ± 0.0124 min−1) is significantly higher (paired t-test, P < 0.0001) than that of 3OMFD (kC6 = 0.0544 ± 0.0117 min−1). These findings, coupled with the constraint on KC5/KC1 = 1, entail that the average cerebellar DV of FDOPA (DVCFDOPA = 0.84 ± 0.30 mL · g−1) was significantly lower (paired t-test, P < 0.0001) than that of its major peripheral metabolite, 3OMFD (DVCOMFD = 1.05 ± 0.39 mL · g−1). The above findings were also apparent in studies involving vervet monkeys (Table 3B). Moreover, Fig. 2 shows that differences in the cerebellar DVs of FDOPA and 3OMFD become larger with higher values for KC5/KC1 in squirrel (Fig. 2A) and vervet (Fig. 2B) monkey investigations.
Striatal and cerebellar model parameter estimates for squirrel monkeys with model M2
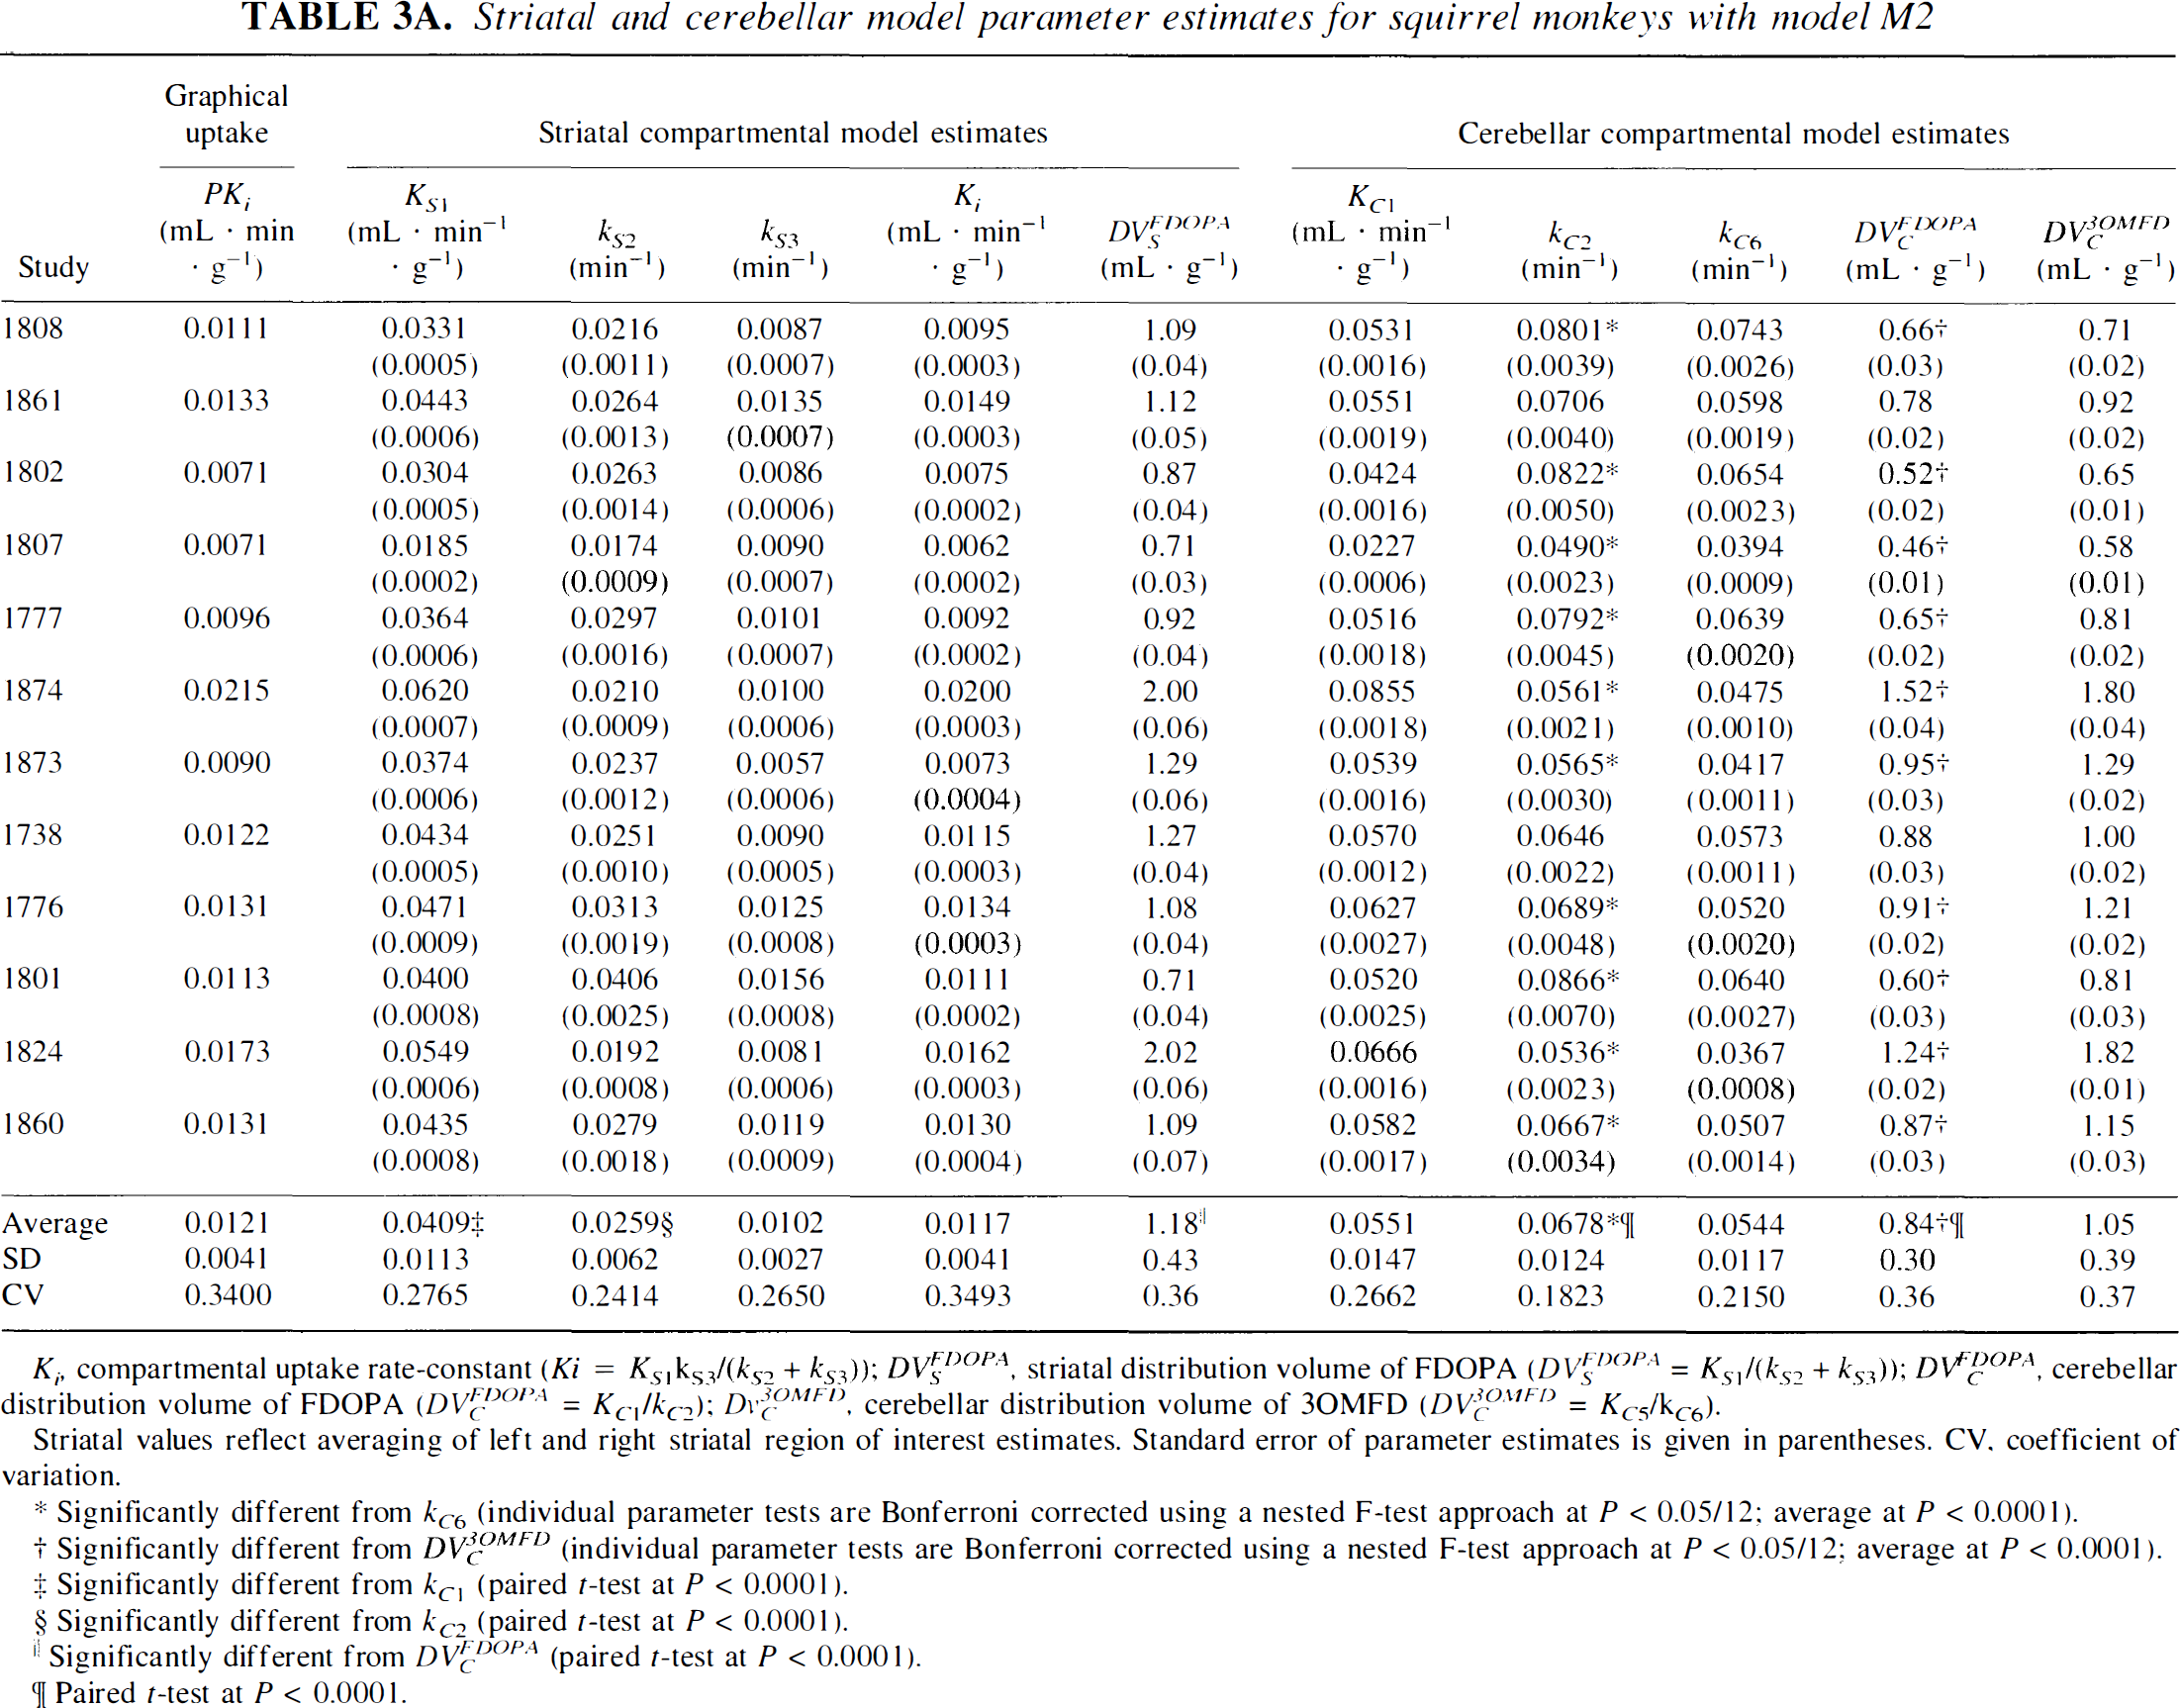
Ki, compartmental uptake rate-constant (Ki = KS1kS3/(kS2 + kS3)); DVSFDOPA, striatal distribution volume of FDOPA (DVSFDOPA = KS1/(kS2 + kS3)); DVCFDOPA, cerebellar distribution volume of FDOPA (DVCFDOPA = KC1/kC2); DvC3OMFD, cerebellar distribution volume of 3OMFD (DVC3OMFD = KC5/kC6).
Striatal values reflect averaging of left and right striatal region of interest estimates. Standard error of parameter estimates is given in parentheses. CV. coefficient of variation.
Significantly different from kC6 (individual parameter tests are Bonferroni corrected using a nested F-test approach at P < 0.05/12; average at P < 0.0001).
Significantly different from DVC3OMFD (individual parameter tests are Bonferroni corrected using a nested F-test approach at P < 0.05/12; average at P < 0.0001).
Significantly different from kC1 (paired t-test at P < 0.0001).
Significantly different from kC2 (paired t-test at P < 0.0001).
Significantly different from DVCFDOPA (paired t-test at P < 0.0001).
Paired t-test at P < 0.0001.
Striatal and cerebellar model parameter estimates for vervet monkeys with model M2
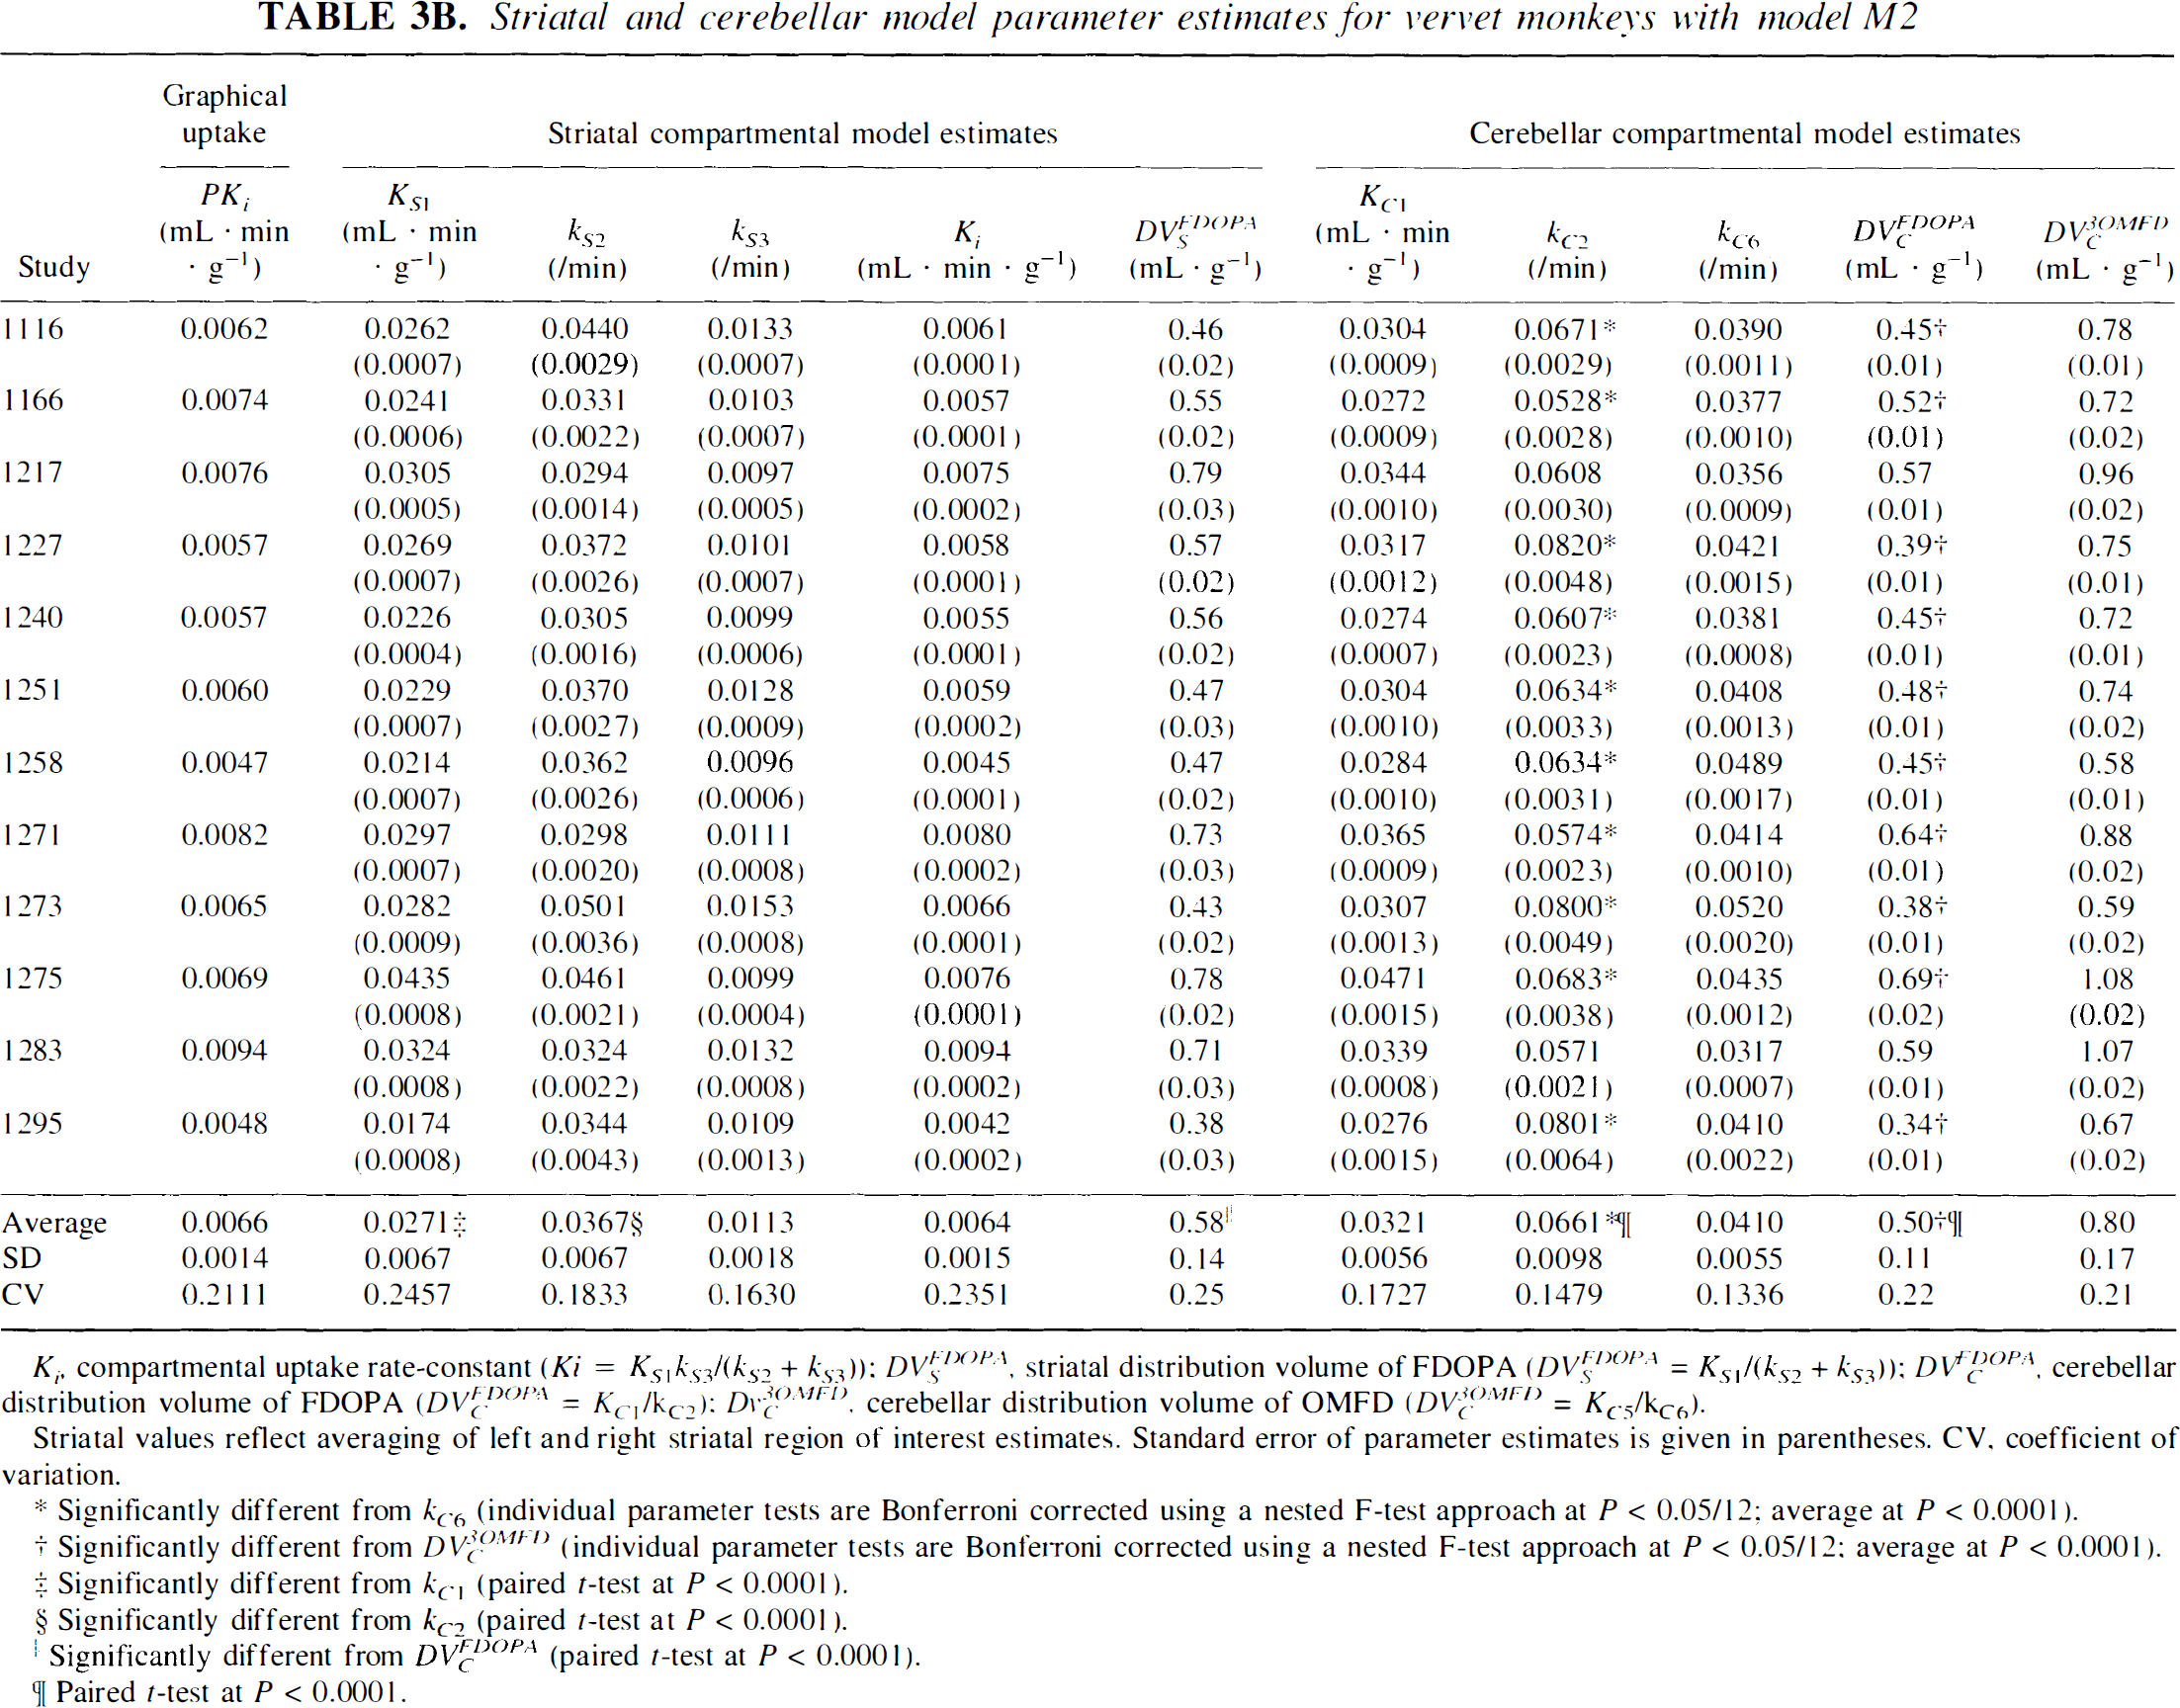
Ki, compartmental uptake rate-constant (Ki = KS1kS3/(kS2 + kS3)): DVSFDOPA striatal distribution volume of FDOPA (DVSFDOPA = KS1/(kS2 + kS3)); DVCFDOPA, cerebellar distribution volume of FDOPA (DVCFDOPA = KC1/kC2): DvC3OMFD, cerebellar distribution volume of OMFD (DVC3OMFD = KC5/kC6).
Striatal values reflect averaging of left and right striatal region of interest estimates. Standard error of parameter estimates is given in parentheses. CV, coefficient of variation.
Significantly different from kC6 (individual parameter tests are Bonferroni corrected using a nested F-test approach at P < 0.05/12; average at P < 0.0001).
Significantly different from DVC3OMFD (individual parameter tests are Bonferroni corrected using a nested F-test approach at P < 0.05/12: average at P < 0.0001).
Significantly different from kC1 (paired t-test at P < 0.0001).
Significantly different from kC2 (paired t-test at P < 0.0001).
Significantly different from DVCFDOPA (paired t-test at P < 0.0001).
Paired t-test at P < 0.0001.
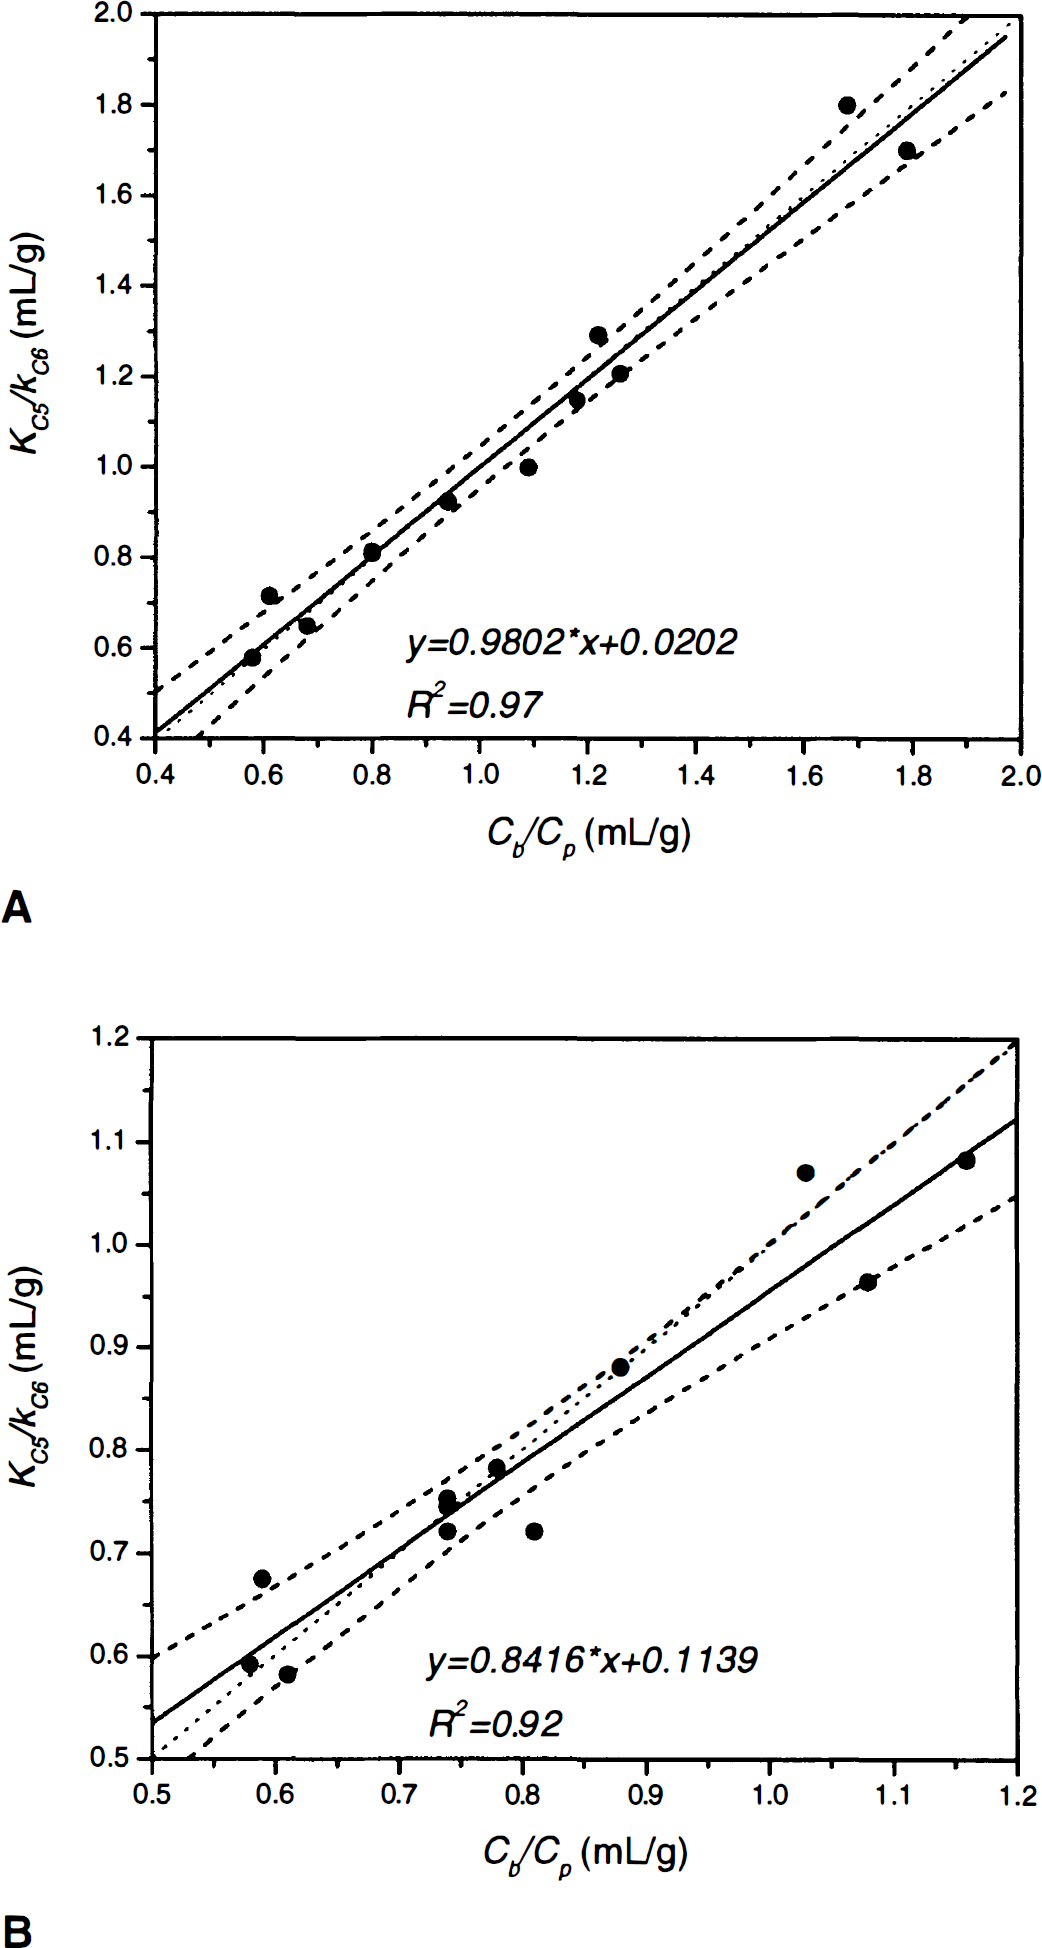
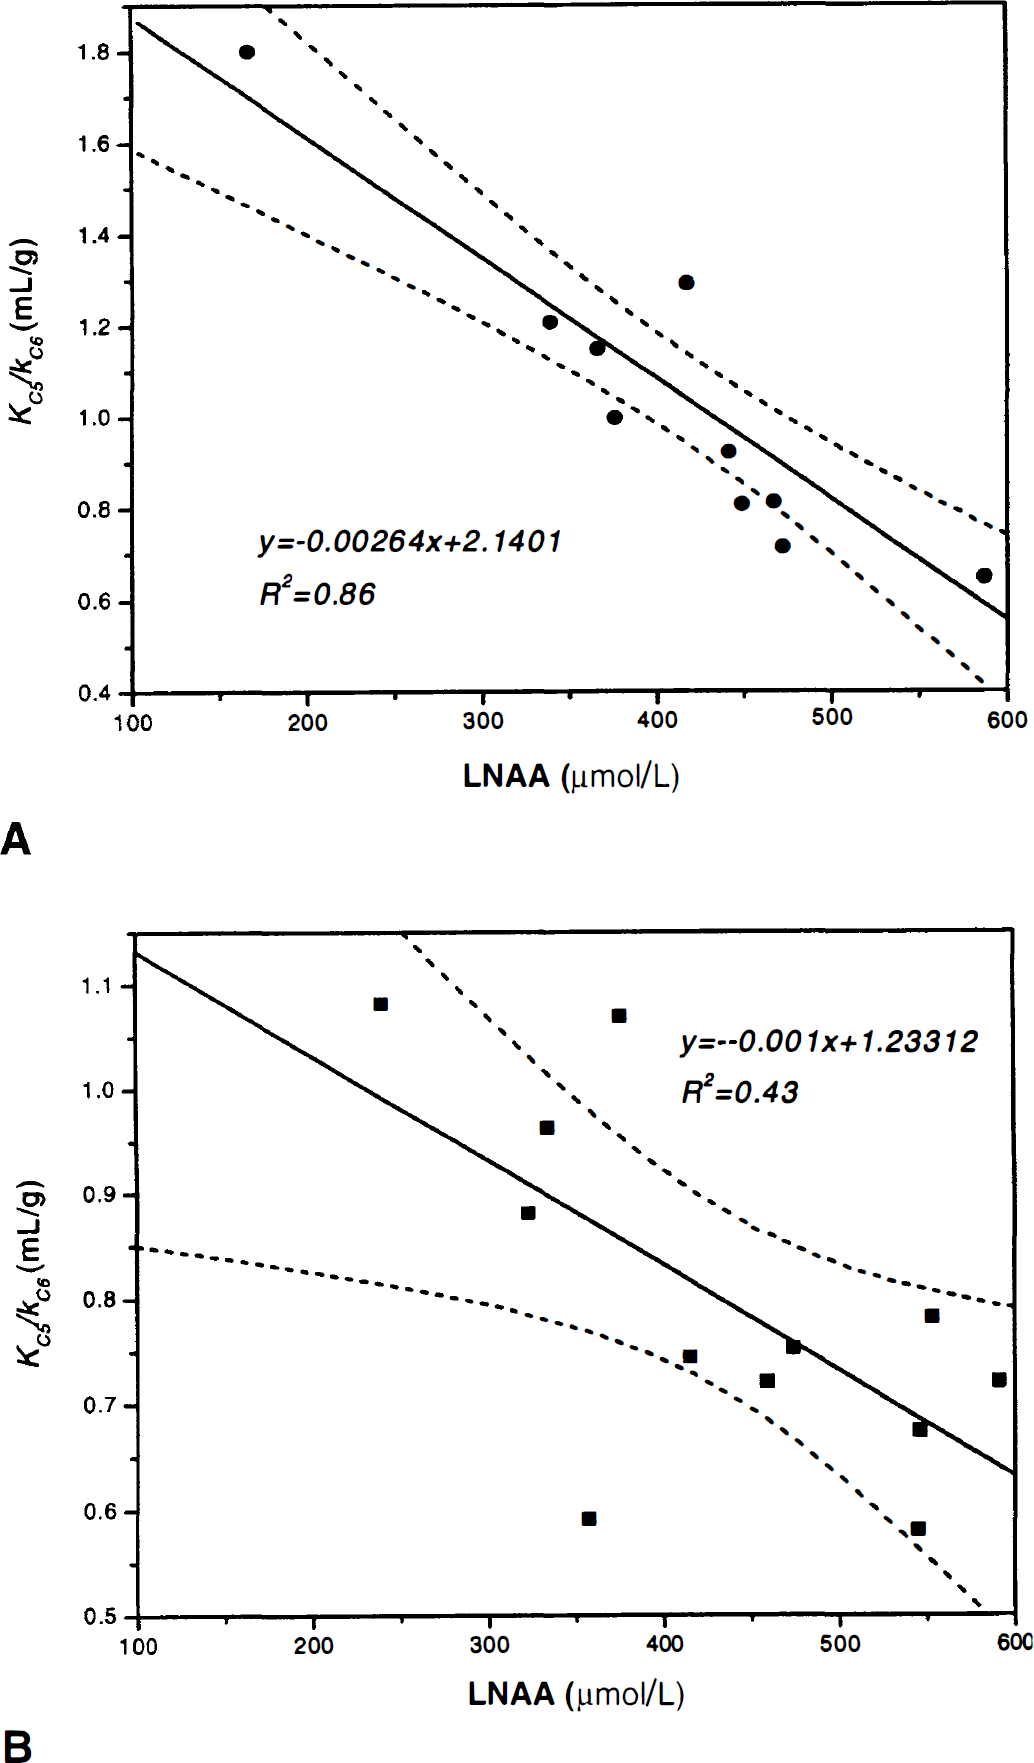
Figure 5 portrays the correlation between KC5/KC6 versus Cb/Cp for squirrel (Fig. 5A; y = 0.9802x–0.0202, r2 = 0.97) and vervet monkeys (Fig. 5B; y = 0.8416x+0.1139, r2 = 0.92). In Fig. 5A, the linear regression line is not significantly different from the identity line (F* = 0.093 < Fthreshold[1,10,0.05] = 4.96), but only marginally significant in Fig. 5B (F* = 5.13 > Fthreshold[1,10,0.05] = 4.96). In Fig. 6, the cerebellar DV of 3OMFD (KC5/kC6) is plotted against plasma LNAA levels. Figure 6 shows that the cerebellar DV of OMFD (KC5/kC6) is inversely related to plasma LNAA levels, as expected based on Eq. 4. Average KC5/kC6 is approximately unity for squirrel monkeys and average KC5/kC6 = 0.80 for vervet monkeys.
Cerebellar distribution volume of OMFD (KC5/kC6) judged against the cerebellum-to-plasma ratio (Cb/Cp) for squirrel monkeys
Cerebellar distribution volume of OMFD (KC5/kC6) versus plasma LNAA concentration for squirrel monkeys
Striatum
For squirrel monkeys, fitting the striatal model with constraint StrM1 resulted in parameter estimates with mean KS1 = 0.0408 ± 0.0107 mL · min−1 · g−1, kS2 = 0.0261 ± 0.0075 min−1, kS3 = 0.0095 ± 0.0049 min−1, and Ki = 0.0121 ± 0.0086 mL · g−1·min−1 (individual parameter estimates are not shown for constraint StrM1). Similarly, for vervet monkeys average KS1 = 0.0278 ± 0.0066 mL · g−1 · min−1, kS2 = 0.0498 ± 0.00899 min−1, kS3 = 0.0112 ± 0.00403 min−1, and Ki = 0.0053 ± 0.00269 mL · g−1 · min−1.
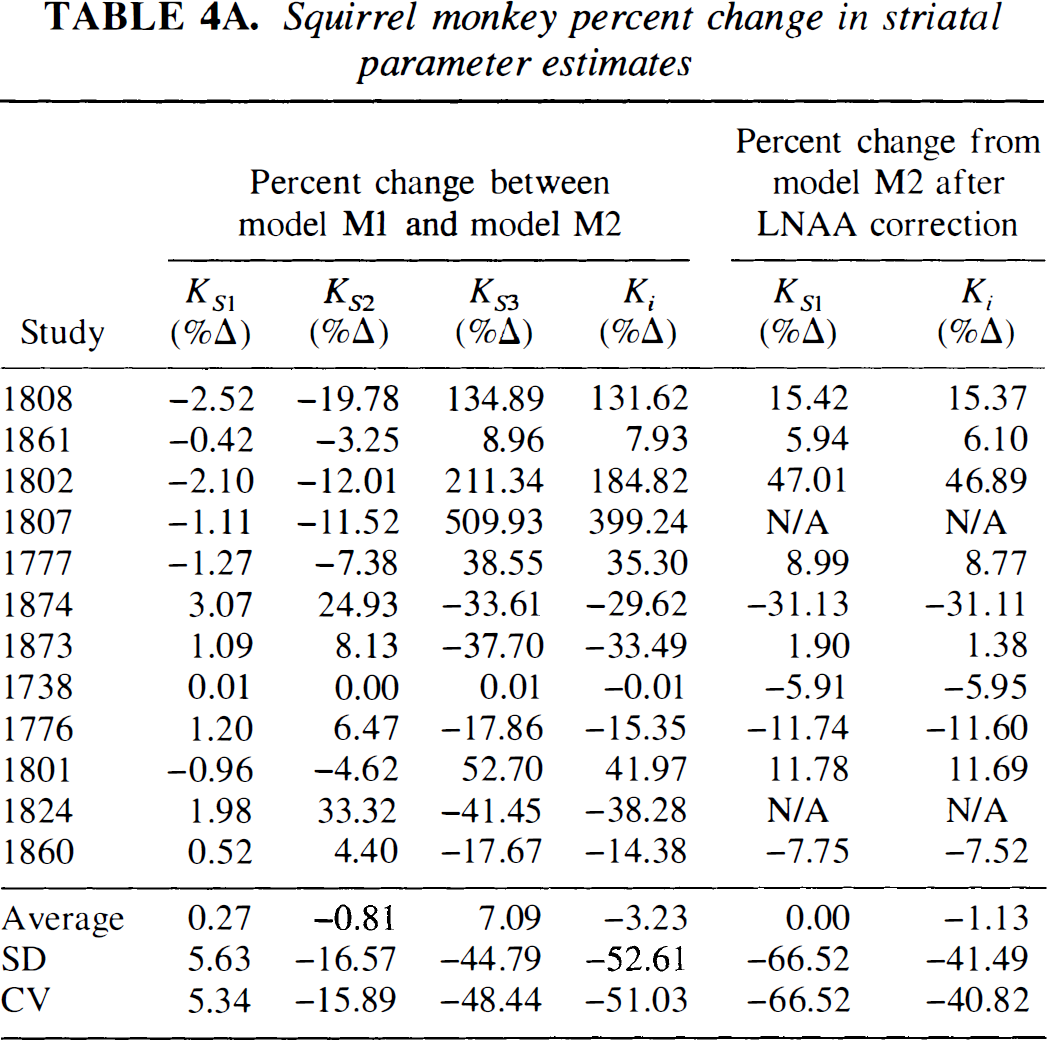
Figures 4C and 4D depict a representative striatal model fit with constraint StrM2 for squirrel and vervet monkeys, respectively. In Table 3A (squirrel monkey investigations), we tabulate striatal parameter estimates with constraint StrM2, and in Table 4A (squirrel monkey investigations), we list the percent change in striatal parameter estimates between constraint StrM1 and constraint StrM2. Compared with constraint StrM1, the average of parameter estimates of constraint StrM2 did not change significantly (P > 0.30); but there was a significant reduction in the SD and the coefficient of variation, particularly for kS3 and Ki. With constraint StrM2, the SD of kS2, kS3, and Ki diminished by 16.57%, 44.79%, and 52.61%, respectively. Studies involving vervet monkeys are characterized in a similar fashion in Tables 3B and 4B.
Squirrel monkey percent change in striatal parameter estimates
Vervet monkey percent change in striatal parameter estimates
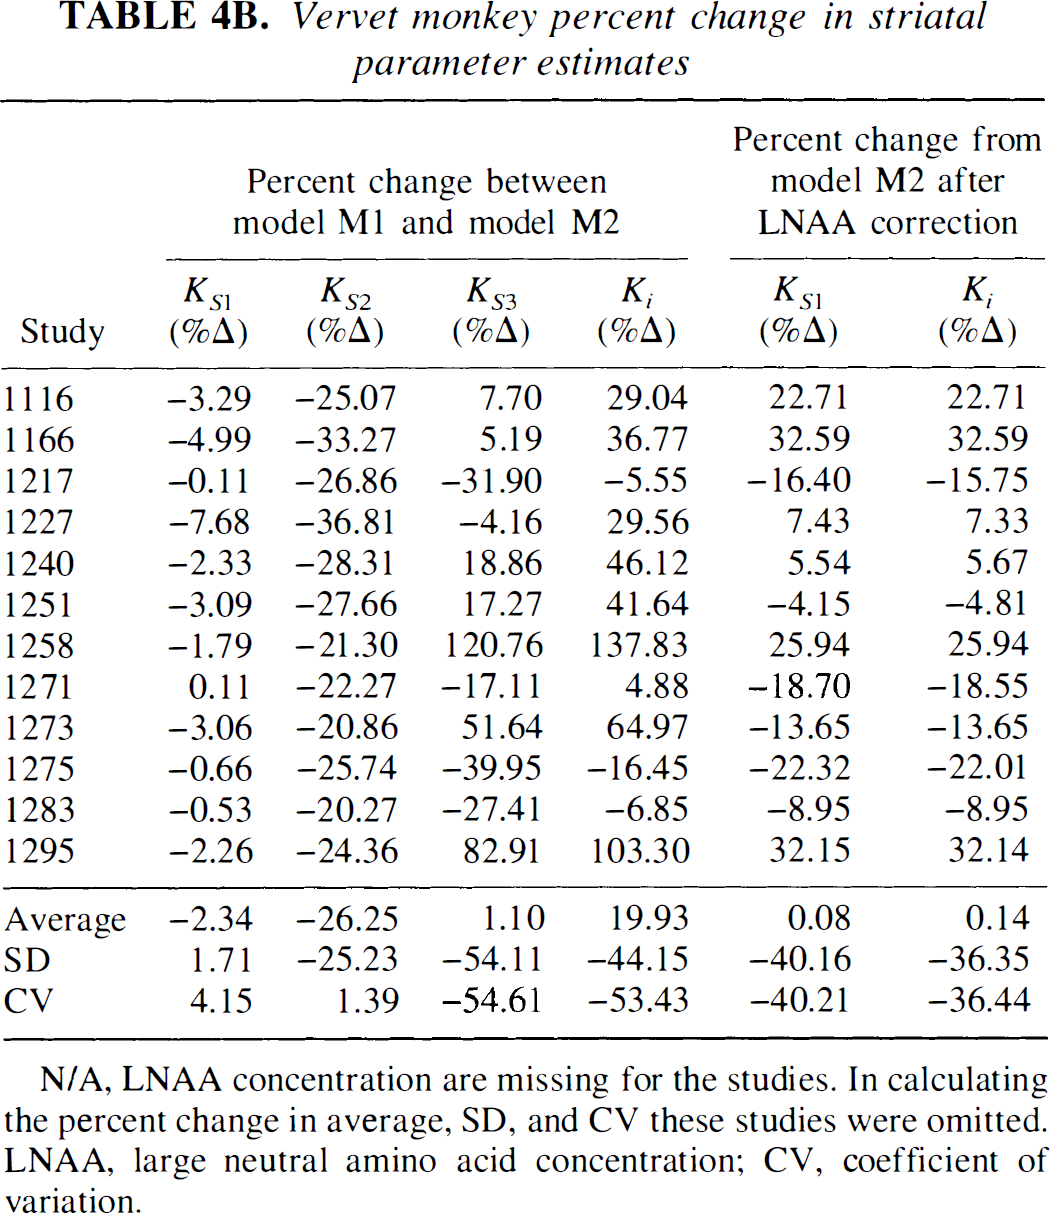
N/A, LNAA concentration are missing for the studies. In calculating the percent change in average, SD, and CV these studies were omitted. LNAA, large neutral amino acid concentration; CV, coefficient of variation.
Figure 3 depicts the dependency of FDOPA transport across the BBB on plasma LNAA concentration. Table 4 summarizes LNAA correction results. The procedure resulted in a significant reduction in SD of KS1 and Ki. For squirrel monkeys, the SD of KS1 and Ki was reduced by 66.51% and 41.49%, respectively; whereas for vervet monkeys, the SD was reduced by 40.16% and 36.35%, respectively. Using the line of regression in Figs. 3A and 3B, the normalized slope, f(the ratio of slope-to-intercept), for squirrel monkeys is fs = 0.0011 ± 0.000142 μmol · L−1 and for vervet monkeys it is fv = 0.0010 ± 0.00778 μmol · L−1, which are not statistically different (P > 0.1).
The compartmental uptake estimate (Ki) is compared with the graphical uptake estimate (PKi) in Fig. 7. For squirrel monkeys (Fig. 7A), the correlation between Ki and PKi is enhanced with constraint StrM2 (constraint StrM1 regression line: y = 1.963x–0.01179, R2 = 0.88; constraint StrM2 regression line: y = 0.962x–0.000015, R2 = 0.94). Similarly, for vervet monkeys (Fig. 7B), the correlation between Ki and PKi is improved (constraint StrM1 regression line: y = 1.6831x–0.00576, R2 = 0.75; constraint StrM2 regression line: Ki = 1.0078 PKi–0.000243, R2 = 0.86). Moreover, in using constraint StrM2, the regression line of Fig. 7 is not significantly different from the identity line (for squirrel monkeys, F* = 2.91 < Fthreshold [1,19,0.05] = 4.96; for vervet monkeys, F* = 1.27 < Fthreshold[1,19,0.05] = 4.96).
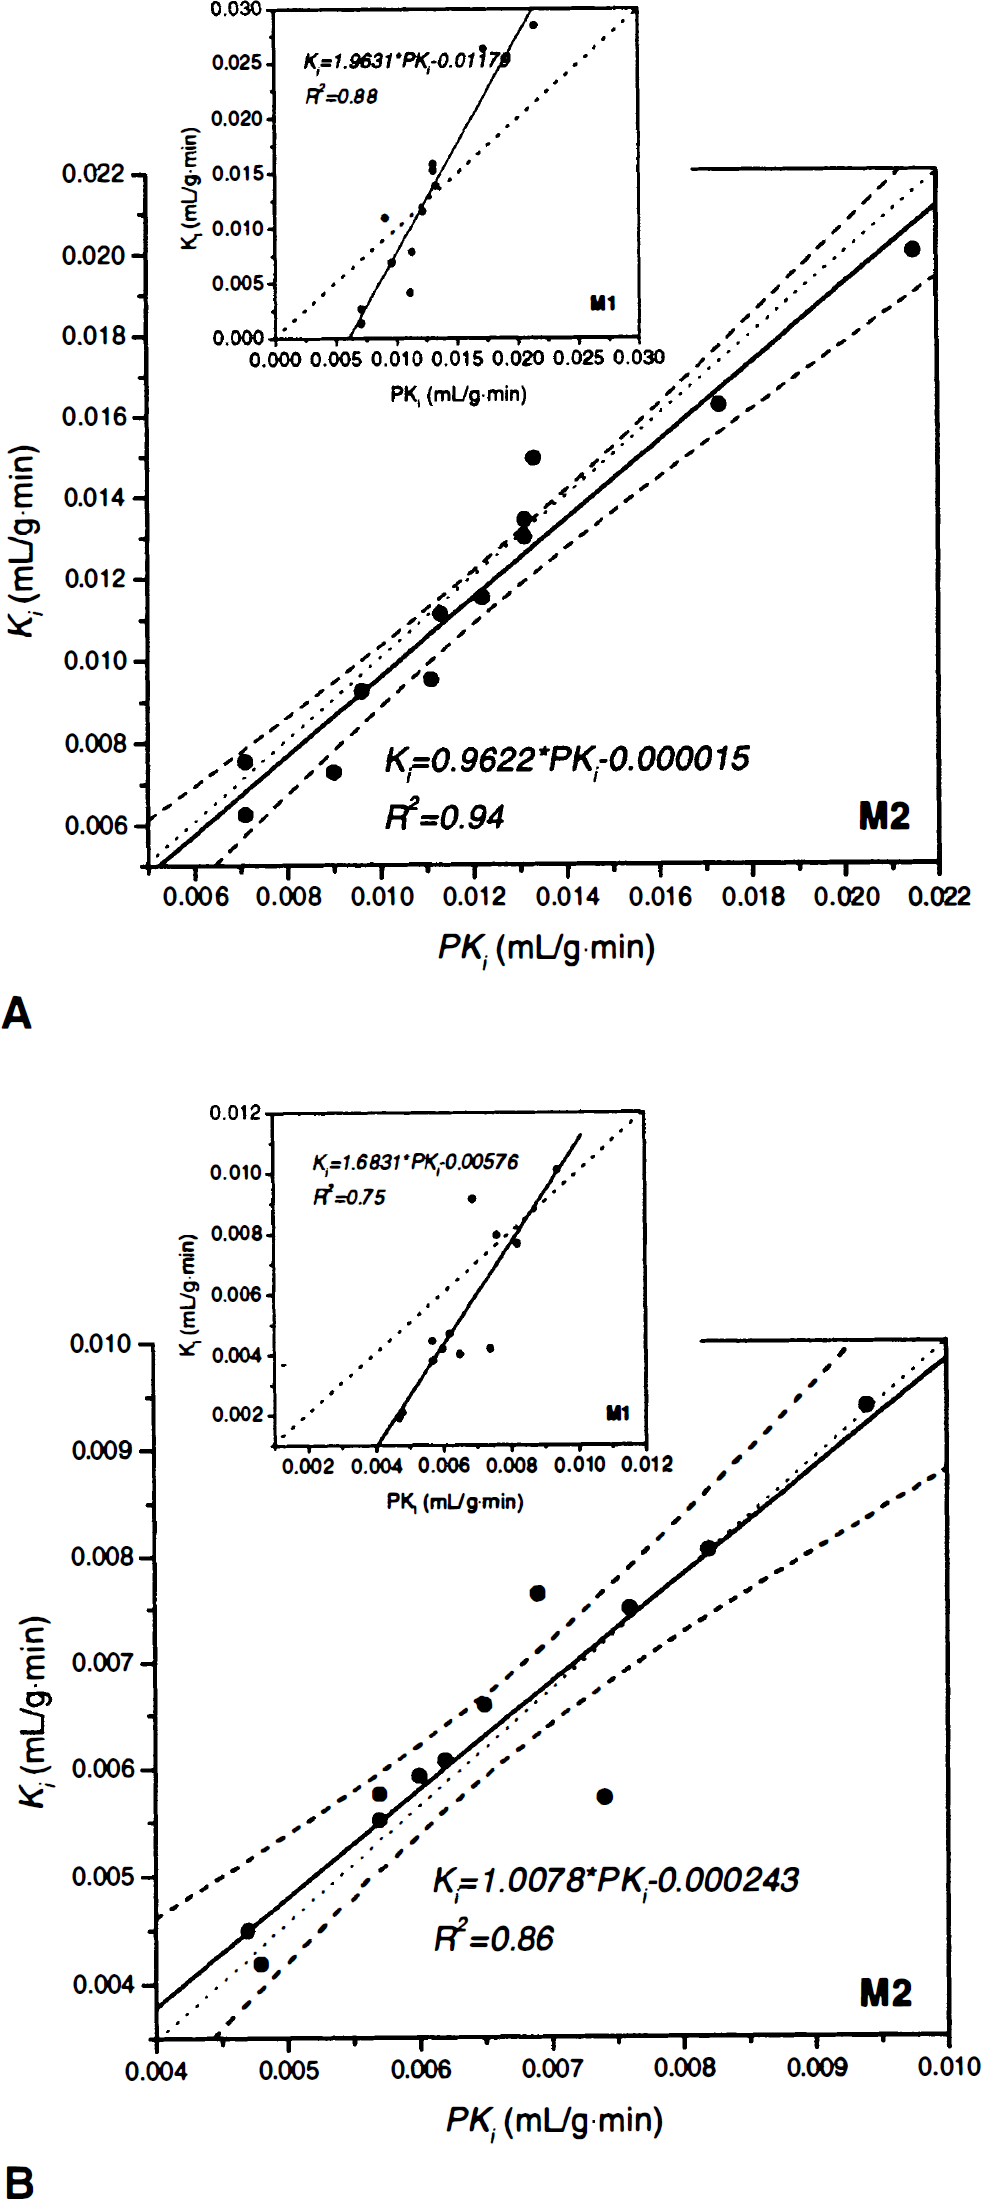
Correlation between the compartmental uptake estimate (Ki) and the graphical uptake estimate (PKi) for squirrel monkeys
Comparison between cerebellum and striatum
In Table 3A, average value of KC1 = 0.00551 ± 0.0147 mL · g−1·min−1 is significantly (P < 0.0001) higher than the average value of KS1 = 0.0409 ± 0.0113 mL · g−1·min−1. Average value of kC2 = 0.0678 ± 0.0124 min−1 is significantly (P < 0.0001) higher than the average value of kS2 = 0.0259 ± 0.0062 min−1. In addition, average striatal DV of FDOPA (1.18 ± 0.43 mL· g−1) is significantly (P < 0.0001) higher than the average cerebellar DV of FDOPA (0.84 ± 0.30 mL · g−1). The above features were also apparent in studies involving vervet monkeys and are summarized in Table 3B.
DISCUSSION
Comparing column E of Tables 2A and 2B (cerebellum-to-plasma ratio, Cb/Cp) with the cerebellar DV of 3OMFD (DVC3OMFD of Tables 3A and3B, respectively) discloses an inspiring result. Because at 120 minutes post-FDOPA administration plasma and cerebellar radioactivity is primarily due to 3OMFD, Cb/Cp should portray the cerebellar DV of 3OMFD at late time points (Huang et al, 1998; Stout et al., 1998a). Indeed, Fig. 5 supports this conjecture. In addition, Fig. 6 shows that DVC3OMFD is inversely related to plasma LNAA levels, which is consistent with arguments presented in Theory. Average DVC3OMFD is approximately unity (1.05 ± 0.39 mL/g−1) for squirrel monkeys, and 0.80 ± 0.17 mL/g−1 for vervet monkeys. However, large intersubject (and interstudy) variations in DV3OMFD impel the introduction of an unbiased constraint on the striatal DV of 3OMFD. Based on arguments presented in Theory and recent reports establishing the cerebellar and striatal DV of 3OMFD as approximately equal (Stout et al., 1999), the striatal DV of 3OMFD can be constrained to that of the cerebellum (constraint StrM2), or even to Cb/Cp.
For several studies (two from each group), fitting the striatal model with constraint StrM1 resulted in a lower RSS than with constraint StrM2. Assuming that the forward transport rate-constant of 3OMFD relative to FDOPA in crossing the BBB is, indeed, unity, then a plot of the maximum likelihood profile (RSS profile) as a function of the striatal DV of 3OMFD (KS5/kS6) furnishes a confidence interval for KS5/kS6. In this particular case, the RSS with constraint StrM1 is RSSStrM1 = 87.5 and the RSS with constraint StrM2 is RSSStrM2 = 93.8. Based on the maximum likelihood profile, the 95% confidence interval for the striatal DV of 3OMFD is 0.065 < KS5/kS6 < 4.75, which encompassed the corresponding values of both RSSM1 and RSSM2. This rather large confidence interval implies that in using a least square algorithm, striatal kinetics do not provide specific information about DV of 3OMFD. A cerebellar-derived DV for 3OMFD is thus critically useful.
An argument could be made that because the cerebellum lacks significant AAAD activity (Melega et al., 1990a; Melega et al., 1991b; Baker et al., 1991; Sims et al., 1973; Loyd et al., 1972) the cerebellar DV of FDOPA could also be formulated in the form of Eq. 4. This, in turn, entails that the DVs of FDOPA and 3OMFD should be comparable (model CbM1 with KC1/kC2 = KC5/kC6). Fitting the cerebellum with the foregoing constraint resulted in a poor fit, as described earlier. Tables 3A and 3B indicate that cerebellum does not retain FDOPA as readily as 3OMFD because kC2 is significantly higher than kC6. In addition, Tables 3A and 3B reveal that the cerebellar DV of 3OMFD is significantly higher than that of FDOPA. This is a rather puzzling observation; however, there have been reports suggesting that 3OMFD is more permeable across cellular membranes. For example, Floud and Fhan (1981) reported 3OMFD to be more permeable across membranes of human blood cells than FDOPA. In addition, cellular mechanisms in the cerebellum may be more permeable to 3OMFD than to FDOPA. Further inquiry is required to verify the apparent higher DV of 3OMFD compared with FDOPA in the cerebellum.
One of the characteristics of our model is that when the striatal DV of 3OMFD is constrained to that of the cerebellum, the correlation between the graphical uptake estimate, PKi, and the corresponding compartmental uptake estimate, Ki, is enhanced (Fig. 7). This is not surprising because the graphical method, by definition, accounts for the presence of 3OMFD in striatal tissue by subtracting cerebellar activity at each time point. In this sense, the assumptions under the graphical method are matched by the assumptions of constraint M2, that is, the DV of 3OMFD is equal in both regions. However, the observation that striatal k2 is significantly lower than cerebellar k2 (Table 3) is rather intriguing. Kuwabara et al. (1993) recently reported a compartmental model for the quantification of FDOPA kinetics that constrained the striatal partition coefficient (the ratio of forward to reverse transport rate-constant of radiotracer) of FDOPA and 3OMFD to that of the frontal cortex. Our findings indicate that there are significant differences in the partition coefficient of FDOPA between the cerebellum and striatum. We were unable to obtain frontal ROIs, partially because of physical constrains such as the small brain size of squirrel monkeys; however, Dhawan et al. (1996) reported that the striatal partition coefficient of FDOPA is approximately 20% to 30% higher than that of the frontal cortex. Interestingly, Jordan et al. (1997) found that the reverse transport (k2) of 6-[18F]Fluoro-L-m-tyrosine in the frontal cortex is more than twice that in the caudate and putamen, which is again consistent with our observations with FDOPA when compared with the cerebellum.
The discrepancy in partition coefficients between the cerebellum and striatum has implications to reference region models. Reference region models offer the advantage of circumventing blood sampling. However, in practice, several assumptions are placed on the models. These assumptions usually involve constraining the partition coefficient of the target region to that of the reference region (Cunningham et al., 1991; Lammertsma and Hume, 1996a, Lammertsma et al., 1996b; Gunn et al., 1997, Patlak and Blasberg, 1985). Based on our findings, these assumptions may be unwarranted; however, they may vary from tracer to tracer. As a precaution, reference region models should first be validated against the gold standard (that is plasma input models) for the tracer at hand.
The significance of the discrepancy between kS2 and kC2 remains elusive in light of reports indicating that tissue LNAA levels in both striatum and cerebellum are approximately equal (Stout et al., 1999). Multiple pools for dopamine have been previously suggested (Deep et al., 1997; Groppetti et al. 1977; Doteuchi et al., 1974). This observation raises the possibility that multiple pools of L-Dopa with different kinetics may exist‥ Arai et al. (1996) showed that the serotonergic fibers of the rat striatum contain AAAD, which may act on L-Dopa to produce dopamine. This observation suggests the existence of a L-Dopa pool specific for the system, not precluding the existence of multiple pools within a given system that is dopaminergic and serotonergic (Tison et al., 1989; Kitahama et al., 1988; Mons et al., 1988; Okamura et al., 1988). In addition, because in question here is the distribution and kinetics of exogenously synthesized FDOPA in relation to the endogenously synthesized L-Dopa (Barrio et al. 1997), another possibility for the discrepancy may be related to the formulation of the compartmental model. Compartmental models offer a simplified version of existing mechanisms and as such, aberration is possible. For example, recent work by Yee et al. (2000) suggests the existence of an intraneuronal transport system for the transport of FDOPA across the neuronal membrane. Present models do not account for its presence. Clearly, further work is necessary to address these points.
Interspecies differences in the transport rate-constant of 3OMFD relative to FDOPA have been suggested in other studies. In a previous report (Huang et al., 1991a), the authors constrained the ratio K5/K1 = 1.7 based on the observation that at 1.7 a minimal RSS was obtained for humans. In this report, the cerebellar RSS profiles are minimized with 0.75 < KC5/KC1 < 1 for squirrel monkeys, and 0.75 < KC5/KC1 < 3.25 for vervet monkeys, with a rather large confidence interval. Reith et al. (1990) suggest that the transport rate-constant is 2.3 as seen in experiments done on rats. Recently, Wahl and Nahmias (1996) and Dhawan et al. (1996) performed dual FDOPA-3OMFD experiments and argued that the ratio is approximately unity in humans. In addition, Cumming et al. (1994) argue that the ratio is approximately unity in rats. However, from a biochemical standpoint the forward transport rate of 3OMFD relative to FDOPA is expected to be larger than unity, considering that the transport rate-constant of aromatic LNAAs decreases with aryl-hydroxylation. For example, the brain uptake index (BUI) of phenylalanine (P) has been reported to be BUIP = 55 ± 5, whereas that of thyrosine (Y) is BUIY = 50 ± 2 (Oldendorf, 1971). The BUI of L-DOPA (a 3,4-dihydroxy r-phenylalanine derivative), however, is BUILDOPA = 20 ± 1.4 (Oldendorf, 1971), which is 2.5-fold lower than the BUI of tyrosine and approximately threefold lower than the BUI of phenylalanine. The BUI of 3OMFD has not been reported; however, it is expected to be in the range limited by BUIY and BUILDOPA. Because of the insensitivity of tissue kinetics to the ratio and because of partial volume and spillover effects, the issue can not be resolved using the present kinetic measurement. The effect of this ratio on the values of the other parameters, however, is useful in assessing the reliability of the parameter estimates.
One question that arose was how a larger value for the K5/K1 ratio might affect the findings of the current report. Figure 2 illustrates that the difference between the cerebellar DV of FDOPA and 3OMFD becomes more significant with higher values for the ratio. Also, the agreement between the cerebellar DV of 3OMFD and the cerebellum-to-plasma ratio remains in effect (in the sense that the regression line does not fit significantly better than the identity line) up to K5/K1 = 1.75 for squirrel monkeys, and up to K5/K1 = 2 for vervet monkeys (data not shown). Finally, the discrepancy between kS2 and kC2 is also upheld up to K5/K1 = 3 (the highest value we tested). The sensitivity of striatal parameter estimates to the ratio of K5/K1 has been reported previously (Huang et al., 1991a).
Compartmental models explicitly account for the biologic processes underway—transport and metabolism, for example. However, the presence of a peripherally born metabolite, which crosses the BBB, complicated FDOPA-PET data analysis. To account for the presence of 3OMFD in cerebral tissue, we constrained the striatal DV of 3OMFD to that of the cerebellum. By invoking the said constraints, we arrived at four findings. First, we report a strong linear correlation between the graphical and compartmental uptake rate-consants. Second, by invoking constraint M2 and correcting for intersubject (and interstudy) differences in plasma LNAA concentration, the variance of parameter estimates are significantly reduced. This is expected to improve evaluation of dopaminergic integrity in studies involving Parkinson's disease patients and animal models of Parkinson's disease (Yee et al., 2000). Third, the cerebellar reverse transport rate-constant of FDOPA is significantly higher than that of 3OMFD; and as a corollary, the cerebellar DV of FDOPA is significantly lower than that of 3OMFD. Finally, the striatal reverse transport rate-constant of FDOPA is significantly lower than the cerebellar reverse transport rate-constant of FDOPA. Understanding these findings may potentially answer relevant issues concerning Parkinson's disease progression and therapeutic agents.
Footnotes
Acknowledgments
The authors thank the cyclotron staff, Ron Sumida, B. Morelos, Judy Edwards, W. Lando, and P. Chan for their dedication, expertise, and technical support.