
Abstract
Pathophysiologic parameters of the functional neovasculature and the blood-brain barrier of 9L-glioma in rat brain were measured noninvasively by dynamic 1H magnetic resonance imaging studies of gadolinium (Gd)-DTPA uptake. Changes of apparent [Gd-DTPA] uptake in time (CT[t]) were analyzed in a slice through the center of 10 9L-gliomas using fast T1 measurements. The distribution of the contrast agent was spatially correlated with the distribution of perfused microvessels as determined by immunohistochemical analysis. This method permits a distinction between perfused and nonperfused microvessels with a disrupted blood-brain barrier. In transverse slices of the whole tumor, a spatial correlation was observed between CT maps and the two-dimensional distribution of perfused microvessels. In the next step, Gd-DTPA uptake rates were spatially related to the perfused microvessel density (Np) or vascular surface area (Sp). In tumor voxels with perfused microvessels, a linear correlation was found between Gd-DTPA uptake rate constants (k values) and Np or Sp. No correlation was observed between k values and the total microvessel density. These are the first data that show a relation between Gd-DTPA uptake rates and parameters of the functional neovasculature in 9L-glioma growing in rat brain. Now that Gd-DTPA uptake studies can be related to parameters of the functional neovasculature, they may be used more efficiently as a prognostic tool before or during therapy.
Keywords
In malignant glioma, the disruption of the blood-brain barrier (BBB) has been ascribed to a high degree of neovascularity with abnormal endothelium (Schmiedl et al., 1992). In the context of therapy, information on these pathophysiologic features plays an important role. For instance, blood perfusion and BBB permeability are of major importance for the delivery of anticancer agents during chemotherapy. Moreover, an important factor in the outcome of radiation therapy is the local oxygen tension in tissue, which is determined by the microvascular blood supply (Denekamp, 1993; Jain, 1987, 1988). In most tumors, only 20% to 80% of the microvessels are perfused at a given time (Bernsen et al., 1995), which results in considerable spatial and temporal heterogeneity of microcirculation. Therefore, techniques that reveal the spatial and temporal heterogeneity of the tumor microcirculation will help in the development of new treatment strategies and may predict treatment outcome.
Fast dynamic 1H magnetic resonance imaging (MRI) studies of the uptake of the clinical contrast agent gadolinium (Gd)-DTPA have the potential to measure features of the perfused microvascular architecture with a high spatial and temporal resolution. Most microvessels in high-grade gliomas, which are derived from angiogenesis, are permeable to this low-molecular-weight contrast agent (Mw = 583). Hence, tumor regions with dense neovasculature are expected to enhance rapidly in MR images after its administration. The uptake rate of Gd-DTPA in tumor tissue has been related to the permeability surface area product (Larsson et al., 1990; Tofts and Kermode, 1991). Further, different groups have tried to validate Gd-DTPA-enhanced 1H-MRI as a method of assessing microvessel density in tumors, but in most reports poor correlations were found (Buadu et al., 1996; Buckley et al.; 1997, Hulka et al., 1995, 1997). Several factors may contribute to this mismatch. First, it was not possible to correlate microvessel density spatially with Gd-DTPA uptake rates, because Gd-DTPA-enhanced MRI was not used to guide the biopsy of surgical specimens. Second, the applied microvessel density technique (Weidner et al., 1991) evaluates all microvessels, whereas dynamic Gd-DTPA-enhanced MRI senses only functional microvessels.
To improve correlation studies between the spatial distribution of Gd-DTPA in tumor slices or the uptake rate of Gd-DTPA monitored by 1H-MRI and parameters of the functional microvascular architecture, we have developed an immunohistochemical method that permits us to distinguish between perfused and nonperfused microvessels (Bernsen et al., 1995; Rijken et al., 1995; van der Sanden et al., 1997). This is crucial in tumors where only a small percentage of the microvessels are perfused at a given time (Bernsen et al., 1995). The aim of this study is to examine whether a spatial correlation exists between local Gd-DTPA levels and the two-dimensional distribution of perfused microvessels, and between Gd-DTPA uptake rates and morphometric parameters of the perfused vascular architecture, such as the perfused microvessel density (Np) and vascular surface area (Sp). The perfused vascular surface area has been suggested to determine Gd-DTPA uptake rates in perfused tumor regions together with other physiologic parameters, such as tumor blood perfusion (TBP) and microvessel permeability (Larsson et al., 1990; Tofts and Kermode, 1991).
As a brain tumor model, we used 9L-gliomas growing in rat brain. The changes of the apparent Gd-DTPA concentration in tumor tissue as a function of time (CT[t]) were determined using a fast dynamic MRI T1-weighted sequence (Rozijn et al., 1998). Next, pharmacokinetic models were fitted to CT(t) curves to estimate Gd-DTPA uptake rates or k values or per voxel (k map) (Larsson et al., 1990; Rozijn et al., 1998; Tofts and Kermode, 1991). The distribution of apparent Gd-DTPA concentrations in MR slices and k maps was spatially correlated with immunohistochemical images showing the two-dimensional distribution of perfused microvessels, the total vascular bed, chronically hypoxic cells (Kennedy et al., 1997), and necrotic regions in whole tumor sections at comparable locations to the MR slices. In MR voxels containing functional microvessels, the morphometric parameters of the perfused vascular architecture were related to Gd-DTPA uptake rates.
METHODS
Animal model
Ten days before the MR experiments, 9L-glioma cells (kindly provided by Dr. Jeffrey A. Coderre, Brookhaven National Laboratory, Upton, NY, U.S.A.) were injected into the brains of 10 Fischer rats (CDF [F-344]/CrlBr; Charles River Laboratories, Sulzfeld, Germany). Cannulas (Insyte, 0.7/19 mm, 24G; Becton Dickinson, Erembodegem, Belgium) were inserted in a tail vein for the administration of Gd-DTPA (Magnevist; Schering AG, Berlin, Germany) solution in saline (dose 0.2 mmol/kg, duration of bolus injection 2 seconds). Rats were anesthetized by subcutaneous injection of 0.1 mL of an atropine solution (Atropini Sulfas; Pharmachemie B.V., Haarlem, The Netherlands) followed by exposure to 1.5% enflurane in an oxygen/nitrous oxide (30% O2) mixture applied through a nose cone. Body temperature was monitored with a rectal probe (3.5 mm, Hewlett-Packard, Amstelkeen, The Netherlands) and maintained at 36.5°C to 37°C by a warm-water blanket with a feedback system. The local ethical committee for animal use approved the experimental procedures.
MR measurements
MR experiments were performed on a home-built spectrometer (6.3 T) using a single tuned 1H-resonator with a diameter of 3 cm, well adapted to the rat head. Before the start of Gd-DTPA uptake measurements, the tumor location and size were determined in coronal, sagittal, and transverse slices using a SNAPSHOT T1 method (Deichmann and Haase, 1992) with an interleaved EPI imaging sequence (Rozijn et al., 1998). One SNAPSHOT T1 experiment consisted of 12 images obtained in 300 milliseconds, each with a flip angle of 5°, a time resolution of 3.6 seconds, repetition time = 20 milliseconds (per interleaf), TE = 7 milliseconds, field of view = 30 × 30 mm, resolution 90 × 90 pixels (6 echoes, 15 interleaves), and slice thickness = 2 mm. In this study, the T1 relaxation times of water 1H-spins in tumor regions were longer than in normal brain tissue: thus, tumor regions were clearly delineated in T1 maps in transverse slices through the whole brain. Next, in a transverse slice through the center of the tumor, the homogeneity of the local Bo-field was optimized. The uptake of Gd-DTPA was measured in this slice using the SNAPSHOT T1 method mentioned above. An effective T1 value (T1*) is obtained using this sequence (Deichmann and Haase, 1992). The Gd-DTPA uptake experiment involved 15 T1* maps before the bolus injection (T10*) and 40 T1* maps after the bolus injection (Rozijn et al., 1998).
Measurements of Gd-DTPA uptake rates are also possible with T1-weighted fast MRI sequences (Barentsz et al., 1996; Furman-Haran et al., 1997; Hittmair et al., 1994), but these results are less accurate than those obtained with the fast T1 method. For instance, changes of signal intensities in T1-weighted fast MR images depend on the pulse angle α (and thus on radio frequency inhomogeneity), the MR sequence (repetition time, radio frequency spoiling), and the T1, T2, and T2* relaxation times. In reference experiments, the T2 and T2* relaxation times differed from those in the experiments after the Gd-DTPA injection, based on the time after injection. However, the calculation of apparent Gd-DTPA concentration changes using T1 maps before and after tracer administration is independent of the previous acquisition parameters and T2 and T2* relaxation times (Rozijn, 1998).
MR data analysis
Gd-DTPA uptake rate constants (k, sec−1) per voxel (k map) were obtained by the following three steps (Rozijn et al., 1998). First, 15 effective T1 experiments before the bolus injection were averaged to obtain a high signal-to-noise T10* measurement. For each voxel, a monoexponential three-parameter model function (see Eq. 1 below) was fitted to 12 phase-corrected 1H-MR signals of a relaxation curve (M[t]) using the Marguardt least-squares nonlinear fitting algorithm (Bevington, 1969) (IDL Software 5.1; Creaso GmbH, Gilching, Germany). In this way, a T10* map was generated (Deichmann and Haase, 1992). In Eq. 1, Mb is the magnetization directly after inversion and M0* is the effective equilibrium magnetization in the repeated fast T1 experiment:
T1* relaxation maps after bolus injection were obtained in a similar way. The linear relation between changes in the effective T1 relaxation rates and the average Gd-DTPA concentration in the extravascular volume of tumor tissue was used to calculate apparent Gd-DTPA concentration (CT) maps: CT = 1/T1* − 1/T10*. The constant r1 or relaxivity ([mM · s]−1) depends on different tissue parameters (Rozijn et al., 1999; Strich et al., 1985). These tissue parameters were unknown; thus, only apparent Gd-DTPA concentration maps could be calculated, which was sufficient in this study.
Finally, a k map was obtained after fitting the pharmacokinetic model of Larsson (Larsson et al., 1990; Rozijn et al., 1998) to CT(t) curves per voxel (see Appendix). The Powell minimization method was used for the least-squares nonlinear fitting (Press et al., 1992). For an estimate of k values, the arterial input function (Cp[t]) must be determined (see Appendix). Cp(t) describes the changes of the [Gd-DTPA] in plasma of the carotid artery during the Gd-DTPA uptake experiment. For measurements of arterial tracer concentrations, the carotid arteries of three rats were cannulated and 20 blood samples of 60 μL per rat were taken at 7-second intervals, directly after bolus injection of Gd-DTPA through the tail vein. Directly after sampling, blood samples were diluted in 10 μL heparin and 10 mL saline. Next, absolute Gd-DTPA concentrations were determined using inductively coupled plasma-emission spectrometry (IL Plasma-200; Instrumentation Laboratory Benelux, IJs-selstein, The Netherlands). The following parameters for the Cp(t) function of Appendix Eq. 2 were found: λ1 = 0.015 sec−1 ± 0.004 (standard deviation [SD]) and λ2 = 0.00117 sec−1 ± 3 × 10⁻⁴ (SD) and A1/A2 = 2.35 ± 0.2 (SD). Comparable values for the parameters of the arterial input function in the carotid artery of rats were found by Wedeking and associates (1990) for six rats, indicating that these parameters are constant within acceptable margins for different rats.
In the study of Rozijn and colleagues (1998), the effect of the bolus passage on estimates of uptake rate constants was analyzed. A mean bolus passage was measured in a transverse slice through normal rat brain at a comparable location to the 9L-gliomas in this study. When the bolus passage was included in the Cp(t) function, estimates of tracer uptake rate constants became inaccurate. These constants were not significantly different from estimates of k values when the bolus passage was not included. Therefore, the first data points of the CT(t) curves that coincided with the bolus passage were omitted before fitting the curves.
Fluorescence microscopy
In complete transverse tumor sections, morphometric analysis of the total vascular bed, perfused microvessels, hypoxic and necrotic areas, and the extracellular volume in viable regions was performed using a computer-controlled digital image analysis system connected to a fluorescence microscope.
One day after the MR measurements, markers for the detection of hypoxic cells (pimonidazole, 20 mg in 0.1 mL saline, kindly provided by Prof. J. Raleigh, Dept. of Radiation Oncology and Toxicology, University of North Carolina School of Medicine, Chapel Hill, NC, U.S.A.) and perfused microvessels (Hoechst 33342, 3 mg in 0.1 mL saline; Sigma, St. Louis, MO, U.S.A.) were injected through a lateral tail vein 60 minutes and 1 minute, respectively, before the rats were killed. One minute after injection of the Hoechst fluorescent perfusion marker, rats were killed by cervical dislocation. After excision of the brain, the right hemisphere of the brain that did not contain tumor tissue in all cases was removed. Next, a transverse section was made that contained the entire tumor. T1* maps after Gd-DTPA injection were used to localize the tumor in the brain. The tissue section was horizontally placed on the bottom of a box with the caudal side up to preserve the tissue orientation; this box was then frozen in liquid nitrogen. The tumor diameter was measured in sagittal images, thus 10 frozen-tissue sections could be cut halfway the tumor and mounted on glass slides. During cutting, the order and the distance between the sections were measured and noted. Tissue sections were homogeneously sampled throughout a 2-mm slice comparable with the MR slice. During cutting and mounting, the orientation of the tissue was maintained, with help of the visibility of the corpus callosum. Five sections, homogeneously distributed throughout the 2-mm slice of the MR measurements, were used for quantitative immunohistochemical analysis of the two-dimensional distribution of the total vascular bed, perfused microvessels (Hoechst), and hypoxic areas (pimonidazole).
The endothelium of all microvessels (total vascular bed) was visualized with goat anticollagen intravenous (Southern Biotechnology Associates, Birmingham, AL, U.S.A.) followed by a second antibody, TRITC-labeled donkey antigoat (Jackson ImmunoResearch Laboratories Inc., West Grove, PA, U.S.A.). For the staining of hypoxic areas (Bussink et al., 2000), sections were incubated with rabbit antipimo (kindly provided by Prof. J. Raleigh, Dept. of Radiation Oncology and Toxicology, University of North Carolina School of Medicine, Chapel Hill, NC, U.S.A.) followed by incubation with FITC-labeled donkey antirabbit immunoglobulin (Jackson ImmunoResearch Laboratories).
Three tumor sections between the previous five sections were used for conventional staining with eosin (cytoplasm) and hematoxylin (nuclei). Finally, NADH-diaphorase in the whole cytoplasm of cells was labeled in the remaining two sections using NADH and nitro-blue-tetrazolium (Sigma, St. Louis, MO, U.S.A.). Previous stainings were used to distinguish viable tumor regions from necrotic areas and to estimate the extracellular volume in viable regions.
Tumor tissue sections were processed in three steps. First, the perfused microvessels (Hoechst) were analyzed, followed by immunohistochemical staining of hypoxic areas and the endothelium of all microvessels. The distribution of necrotic areas and extracellular volume were evaluated separately. After each staining step, sections were scanned using an extended version of the digital image analysis system as described by Rijken and colleagues (1995). After processing all fields of each scan, a composite image was reconstructed from the individually processed fields, revealing the different structures. If the composite images of the tumor sections obtained after each step were combined, then the new matched image showed the two-dimensional distribution of perfused microvessels, hypoxic areas, and the total vascular bed simultaneously.
Finally, the fluorescent rim of the Hoechst dye around perfused microvessels resulting from diffusion into adjacent tissue was deleted by image processing. Thus, the perfused surface area of microvessels was not overestimated.
Data analysis
Matching of C T maps with immunohistochemical images. For each tumor, a representative immunohistochemical image showing the two-dimensional distribution of perfused microvessel and hypoxic cells approximately halfway the 2-mm MR slice was used for matching with a CT map obtained 1 minute after bolus injection. This particular map was used because rats were killed 1 minute after injection of the Hoechst fluorescent perfusion marker. During the interactive matching (shifting and rotating of the CT maps relative to the immunohistochemical images) using IDL software, prior knowledge of the orientations of both the CT maps obtained in Gd-DTPA uptake studies and the tumor sections during histochemical processing was used.
For further analysis, an MR lattice was generated consisting of voxels with a spatial resolution four times lower than in original CT maps using IDL software (the new voxel volume was approximately 1 mm3). In a further study, the two-dimensional distribution of the [Gd-DTPA] in tumor slices will be spatially correlated with the distribution of metabolites as measured by spectroscopic imaging; therefore, the spatial resolution of both experiments was tuned. In addition, the spatial correlation between k values and morphometric parameters in large voxels was less sensitive to a mismatch than in small voxels.
Subsequently, each voxel of the MR lattice was labeled. With help from the representative immunohistochemical images, different categories of voxels were assigned, as follows:
Pr: voxels with perfused microvessels at the rim of the tumor P: voxels with perfused microvessels inside the tumor PH: voxels with perfused microvessels and hypoxic areas inside the tumor HN: voxels with hypoxic and necrotic areas only.
The distribution of perfused microvessels and hypoxic cells may differ slightly between the representative tumor section of the MR slice and the four other sections homogeneously distributed throughout the MR slice. For instance, an MR voxel of category P, as assigned with use of the representative section, may contain hypoxic cells in the other sections. All five tumor sections were used for estimates of morphometric parameters of the perfused vessel. For each voxel of category P and PH, correlations between these morphometric parameters and Gd-DTPA uptake rate constants (k map) were analyzed. The latter is important because CT(t) curves were fitted to pharmacokinetic models with parameters such as TBP and the permeability × Sp product, which are defined only in voxels with perfused microvessels. Voxels of category Pr were not included because a large-volume fraction in these voxels coincided with “normal” brain tissue.
Estimates of perfused microvessel density, perfused microvessel length density, and total perfused surface area. For each voxel of category P and PH, the following four morphometric parameters were estimated:
Perfused microvessel density (Np, number per mm2) Total microvessel density (density of perfused and nonperfused microvessels [N, number per mm2]) Perfused microvessel length density (Lp, mm/mm3) Total perfused surface area density (Sp, cm2/mm3).
The microvessel density parameters Np and N were defined as the mean of the perfused and total microvessel density per five tumor sections homogeneously distributed throughout a voxel. Lp and Sp were estimated using a stereologic algorithm (Adair et al., 1994). Briefly, for an estimate of Lp per voxel, the sum of the major axis (a) divided by the minor axis (b) (eccentricity of ellipse) of all cross-sectional areas of perfused microvessels in all five tumor sections was divided by the total sum of areas per section in which microvessels were analyzed (At): Lp = (Σa/b)/(Σ At). Five whole-tumor sections were used for the calculations of Lp because pilot studies revealed that the values of the latter were not significantly different when 10 or 20 tumor sections were taken. Further, a model was developed to test the stereologic algorithm for the estimate of Lp on our digital image analysis system. The SD in the estimate of Lp was approximately ±15%. In addition, analysis of Lp in different regions of the normal rat brain were comparable to estimates of Lp in previous studies (Honig, 1971).
Next, the value of Sp was estimated after determination of the median radius (r) of all perfused microvessels per five tumor sections (median of minor axis b divided by 2): Sp = (2πrLp)/100. The perfused microvessels were approached as cylinders with uniform dimensions. For each voxel of category P and PH, the relation between Np or Sp and kLarsson values was analyzed using Graphpad software (Graphpad PRISM version 2, San Diego, CA, U.S.A.).
Estimates of the extracellular volume in perfused tumor regions. The following three steps resulted in an estimated distribution volume of Gd-DTPA (Vd) in perfused voxels. First, the extracellular regions were segmented from the cells stained by NADH-diaphorase applying a threshold operation in digitized images. Second, the extracellular volume (Ve) was estimated in perfused voxels using the equation Ve ≈ 1 − (surface area cells/sample area). Finally, per perfused voxel, the extracellular volume was corrected for the vascular volume (Vv) using the parameters defined in the previous paragraph (vascular volume per voxel volume is approximately Vv ≈ πr2Lp). Vd = Ve − Vv and is assumed to be a maximum estimate of the Gd-DTPA distribution volume in in vivo studies because some cell shrinkage may occur during the quick-freeze of tumors.
RESULTS
Matching of CT maps with immunohistochemical images
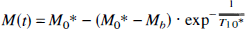
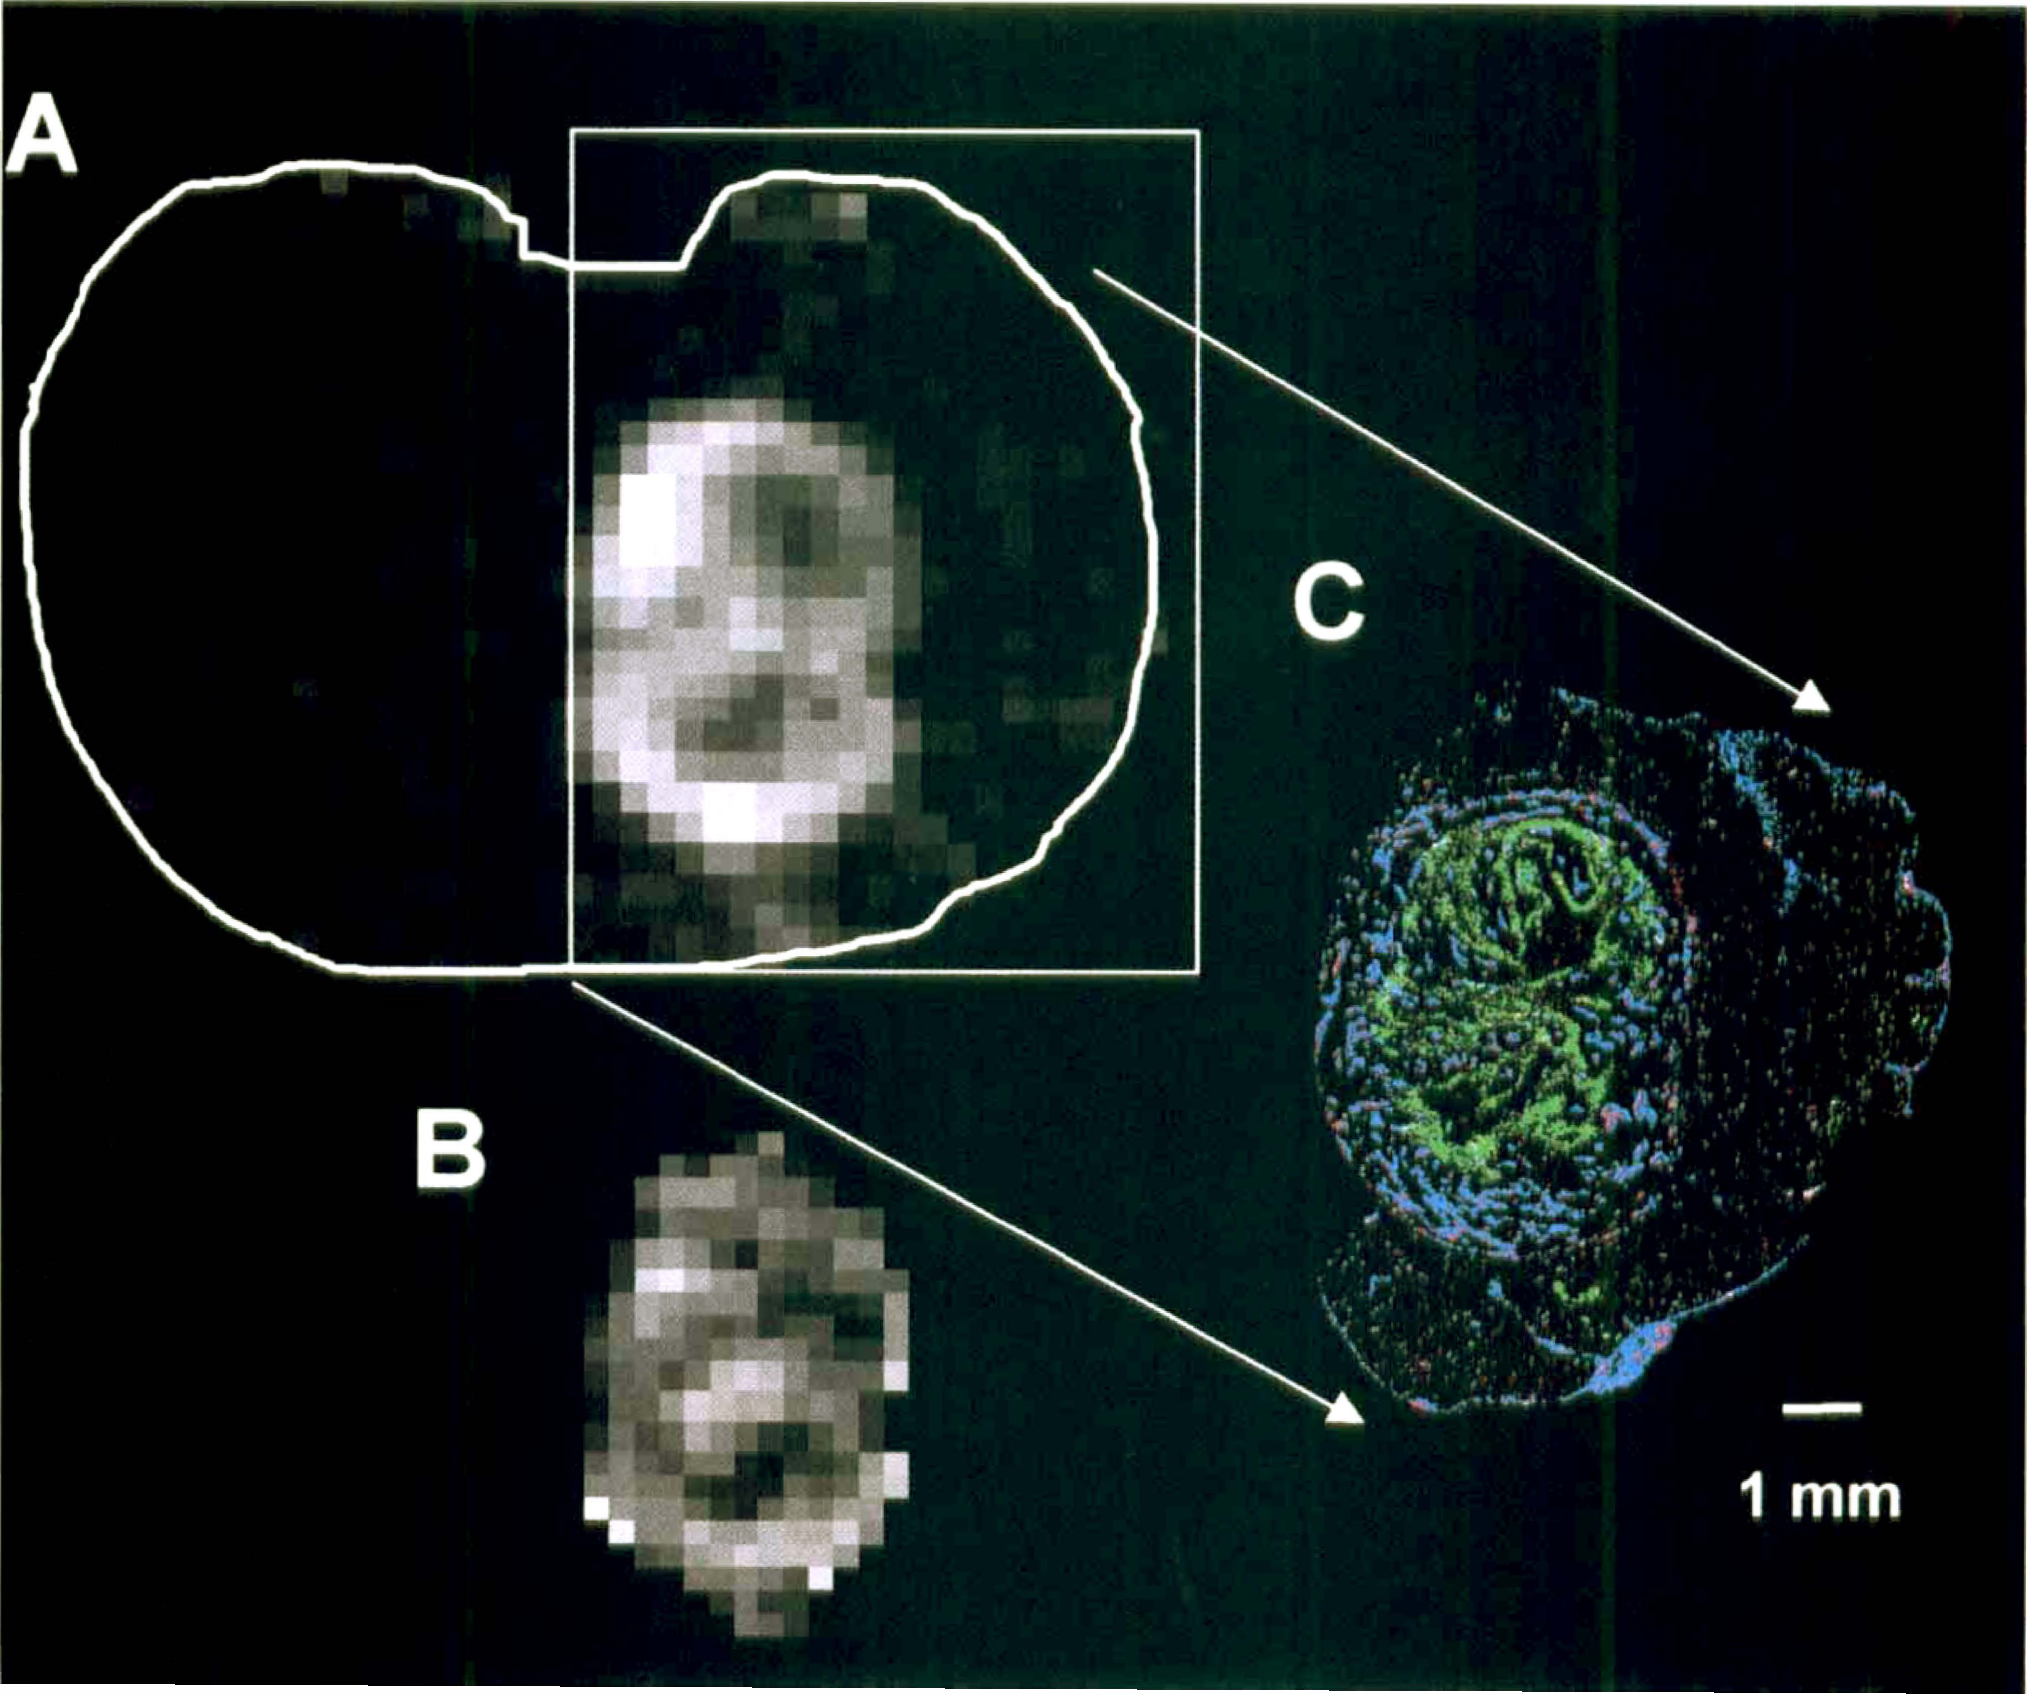
An example of this matching for a tumor is shown in Fig. 1. The CT maps obtained 1 minute after bolus injection of Gd-DTPA were matched with an immunohistochemical image showing the two-dimensional distribution of perfused tumor microvessels, the total microvessel bed, and hypoxic regions. In all tumors a positive correlation was observed between the distribution of the apparent Gd-DTPA concentration and the perfused microvessel distribution. Tumor regions with no Gd-DTPA uptake appeared to be chronically hypoxic or necrotic. Necrotic areas were found in regions enclosed by hypoxic cells. In Fig. 2, details of conventional staining with eosin (cytoplasm) and hematoxylin (nuclei) are shown, as well as immunohistochemical stainings. Different cell structures and tumor regions were clearly distinguished. At a certain distance from a perfused microvessel, chronically hypoxic cells appeared, and beyond these hypoxic cells the onset of necrosis was observed.
Histologic details of the tumor in Fig. 1.
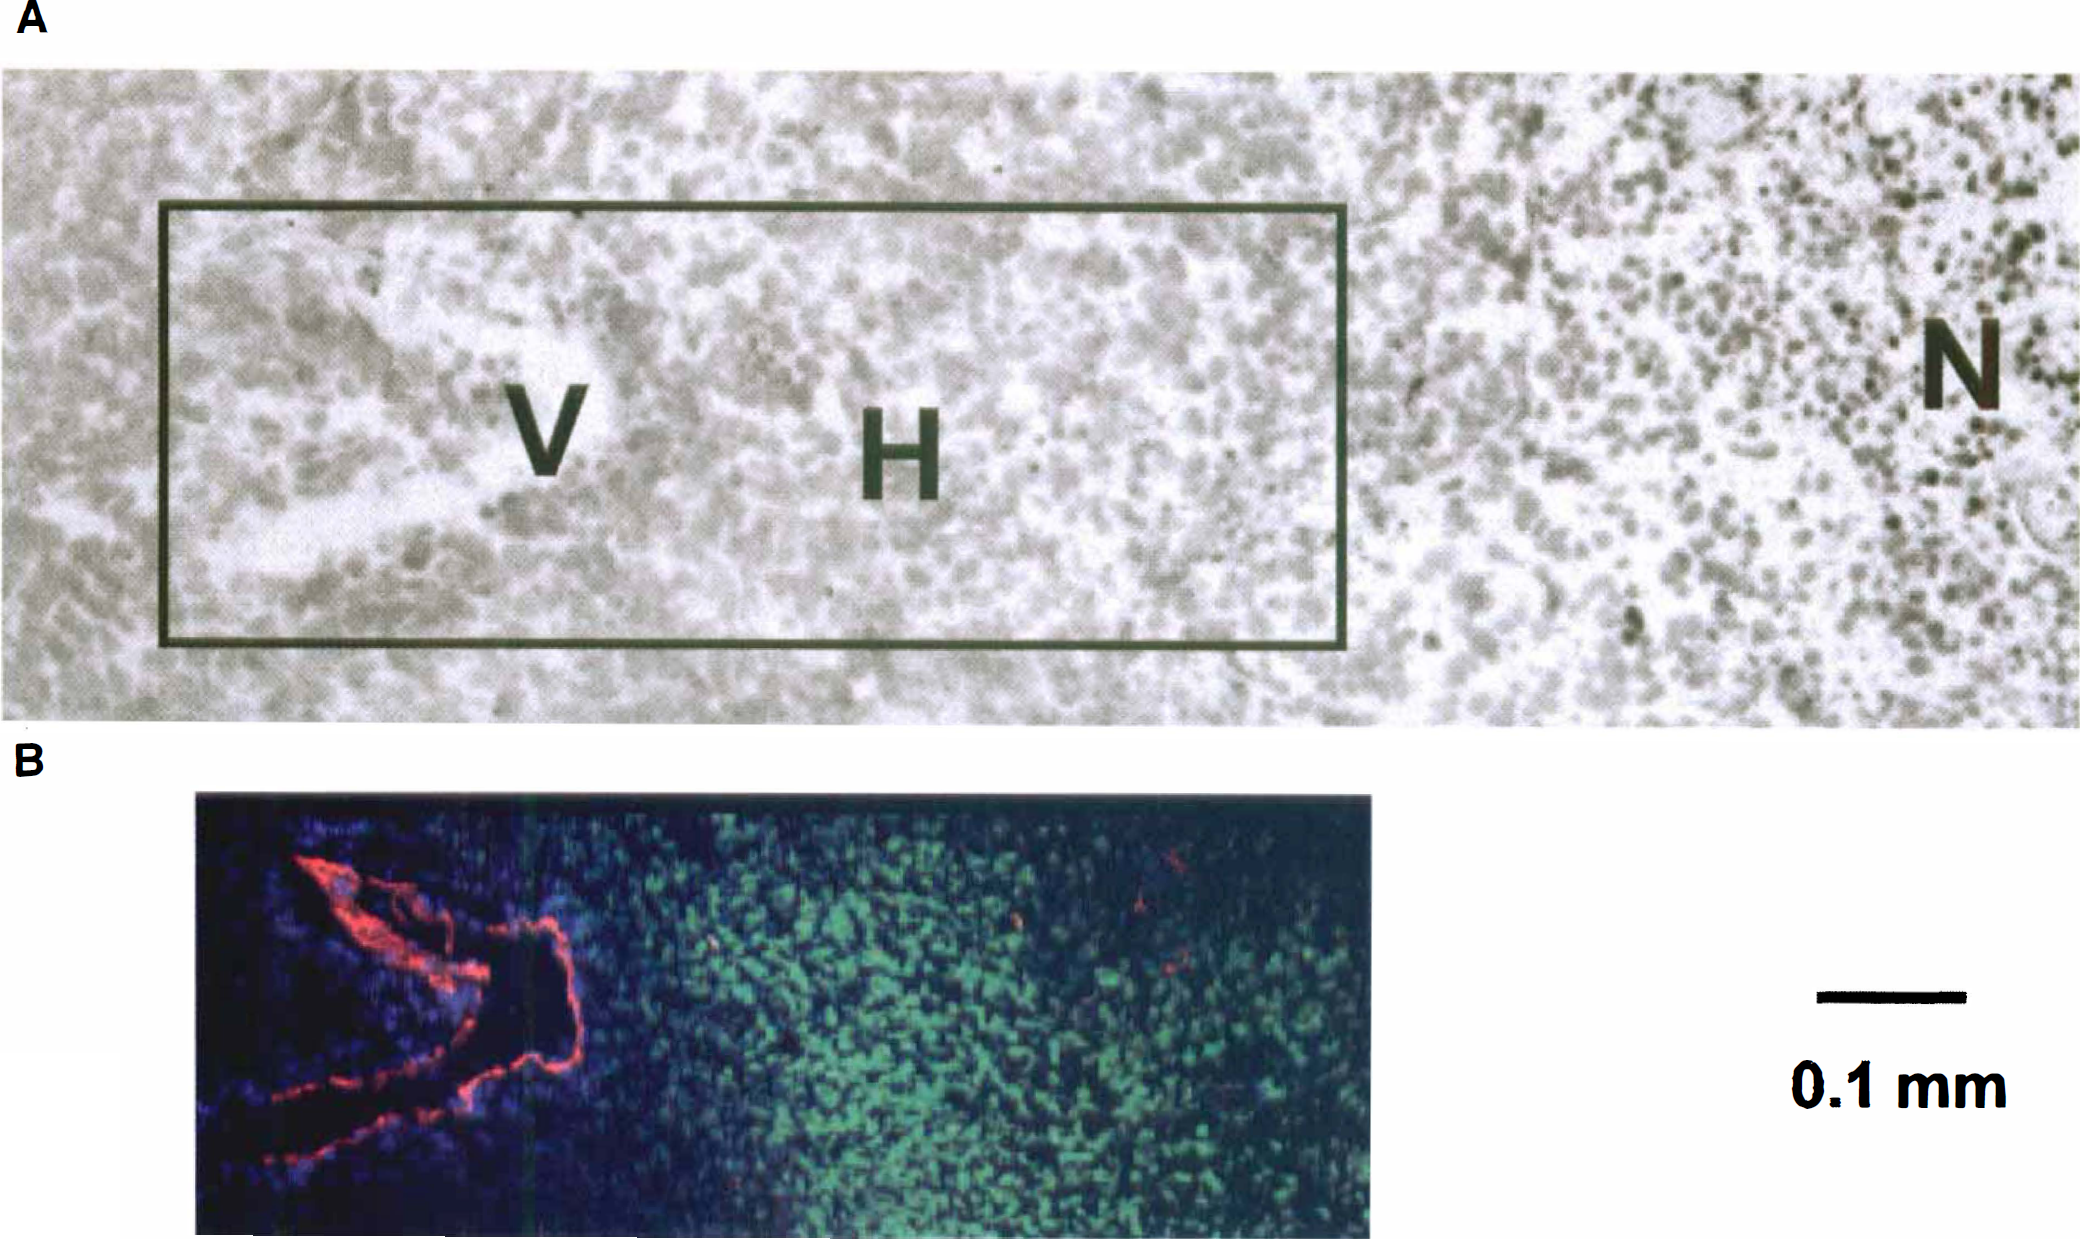
Immunohistochemical images were used to assign different voxel categories. Fig. 3A is a detail of an immunohistochemical image that was overlaid with an MR lattice as determined after matching with a CT map. All voxel categories are represented. Next, a pharmacokinetic model proposed by Larsson and associates (1990) was fitted to a CT(t) curve in voxels with perfused microvessels, resulting in a k map (see Fig. 1B). Fig. 3B is an example a fitted CT(t) curve as measured in a well-perfused voxel of category P.
Correlations between Gd-DTPA uptake rates and parameters of the perfused vascular architecture
With the help of immunohistochemical images, only voxels containing perfused microvessels (categories P and PH) were selected for a comparative study between kLarsson values and parameters of the perfused vascular architecture (Figs. 4 and 5). In previous studies, Gd-DTPA uptake rates were related to the microvessel density (Hulka et al., 1995, 1997)). In our study, it appeared that Gd-DTPA uptake rates or kLarsson values (sec−1) have no clear relation with the microvessel density (perfused and nonperfused vessels, N) in voxels of category P and PH in transverse slices through the center of 10 9L-gliomas (see Fig. 4A). However, a linear relation was found between kLarsson values and the density of all perfused microvessels (Np) (see Fig. 4B).
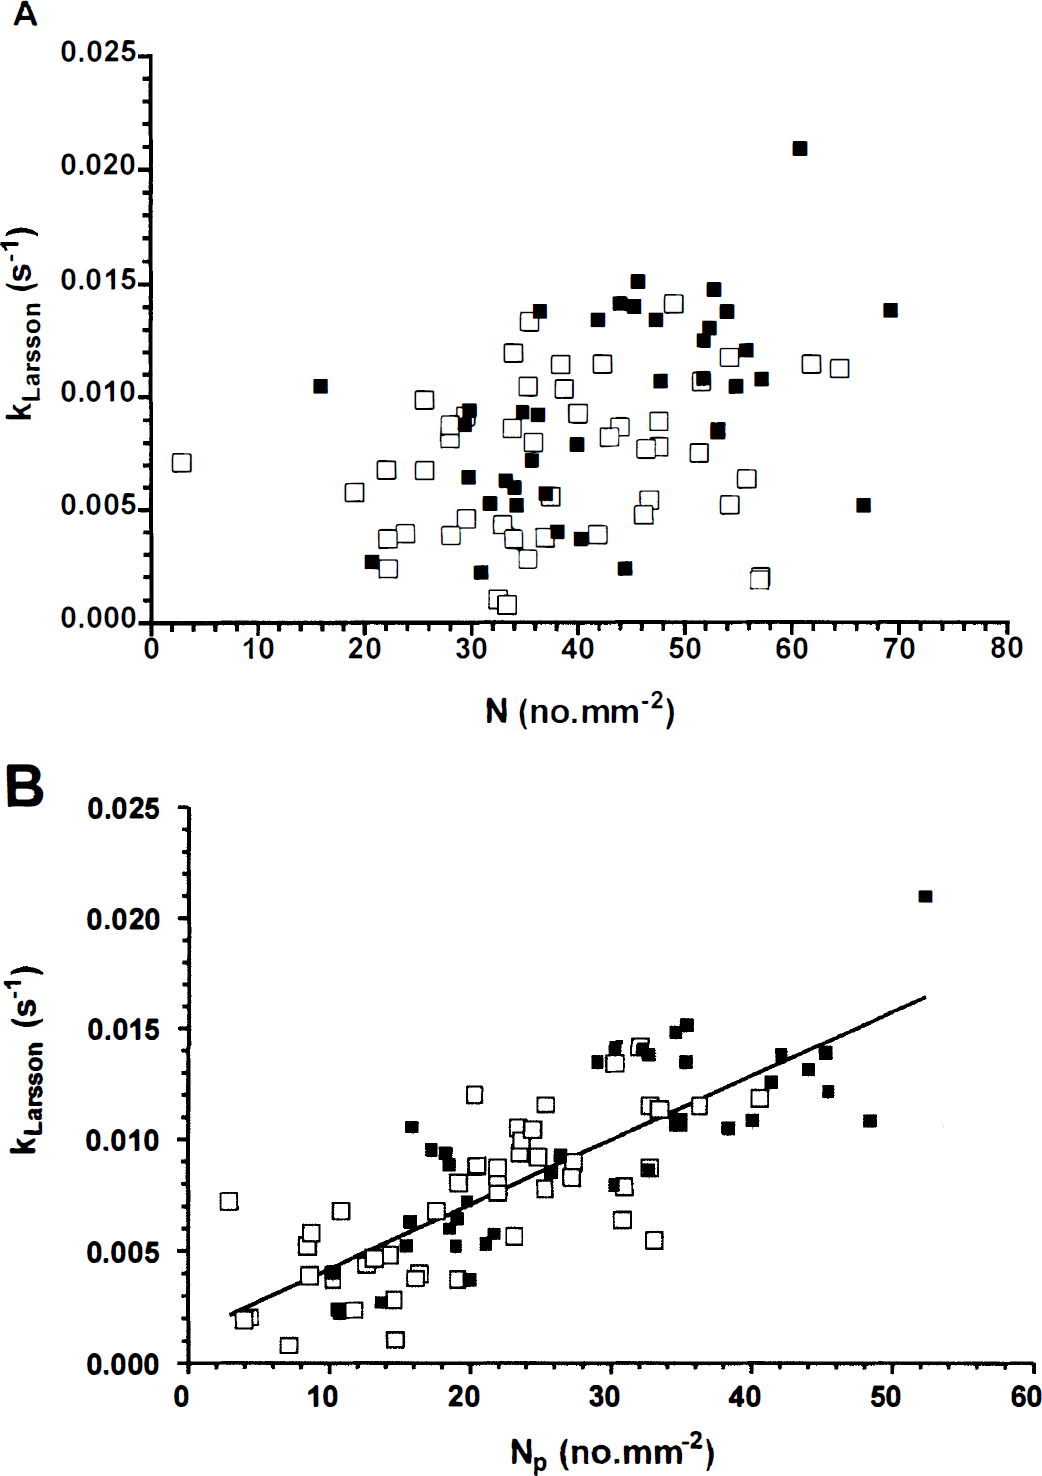
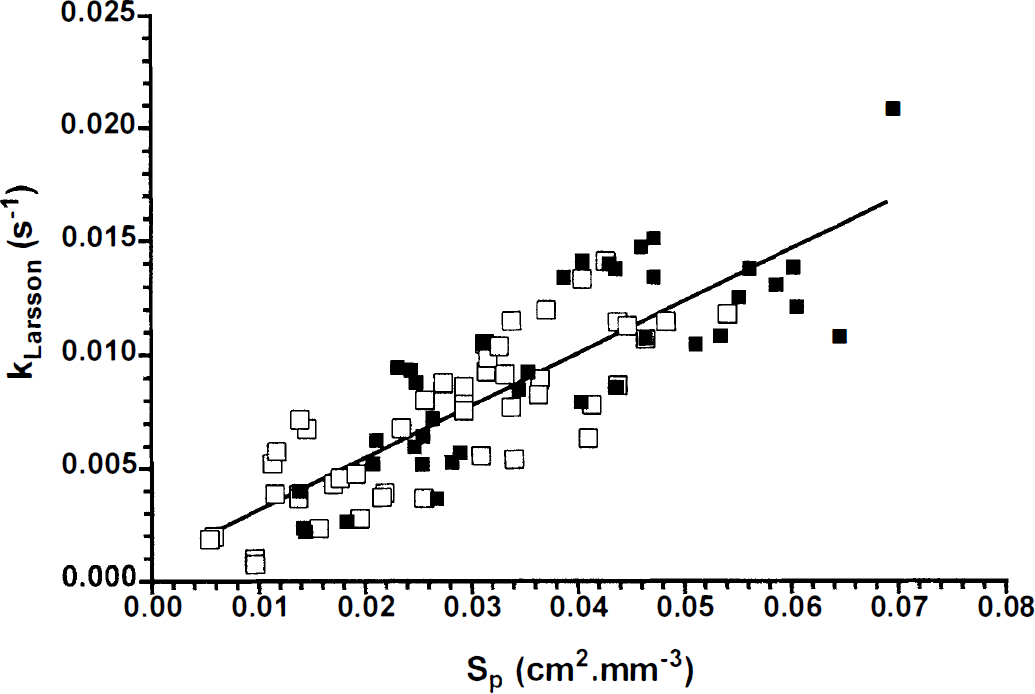
Correlation between kLarsson values (sec−1) (y-axis) and the perfused vascular surface area (Sp, cm2/mm3) per voxel of categories P (▪) and PH (□) (see Fig. 3A) in 10 9L-gliomas. The solid line indicates the results of the least-squares linear regression analysis of the data (n = 86, R2 = 0.72): kLarsson (sec−1) = (0.23 ± 0.02) × Sp.
In the next step, analysis of the perfused vascular density was extended to estimates of the perfused vascular surface area per voxel (Sp). The latter parameter is expected to have a stronger correlation with Gd-DTPA uptake rates, when TBP is much larger than the PSp product (see definition of kTofts in Appendix). Before Sp can be calculated, the length density (Lp, mm/mm3) per voxel was estimated using a stereologic algorithm (Adair et al., 1994). The length density is comparable to the perfused microvessel density Np when microvessels are arranged parallel to each other and perpendicular to cross-sectional areas of the voxels (Adair et al., 1994). If the microvessels are bent and twisted throughout the voxel volume, then Lp is always larger than Np. In tumor voxels of category P and PH of all 9L-gliomas, the following linear correlation was found after least-squares regression analysis (n = 86, R2 = 0.95): Lp = (4.6 ± 0.3 [SD]) × Np. The large slope value (>1) indicates that perfused microvessels were tortuous in the different voxels.
Finally, the perfused length density (Lp) and a median radius of all perfused microvessels (r) in the five tumor sections per MR voxel were used to estimate the perfused vascular surface area density (Sp) in P and PH voxels. The kLarsson values were found to be linearly related to the estimated perfused surface area density (Sp) (see Fig. 5). This correlation was slightly better than the correlation between Gd-DTPA uptake rates and the perfused microvessel density (Np), as shown in Fig. 4B (see goodness of fit [R2 values] in legends of Figs. 4 and 5). The median radii, which were used for the estimates of Sp, varied from 3.6 to 6.5 μm. The distribution of the perfused microvessel radii was not homogeneous, but the percentage of radii more than twice the median radius did not exceed 5%. Thus, significant groups of large microvessel radii were not observed and are not expected to influence the Sp estimates considerably.
DISCUSSION
Many forms of anticancer therapy are influenced by the poor functional vasculature in solid tumors (Denekamp, 1993). Therefore, noninvasive measurements of the physiologic and morphologic parameters of the functional neovascular architecture is important in tumor prognosis (Bosari et al., 1992; Gasparini and Harris, 1995; Weidner et al., 1996) and the evaluation of treatment efficacy (Barentsz et al., 1998; Furman-Haran et al., 1996; Kennedy et al., 1994). Fast dynamic 1H MRI studies of the uptake of the contrast agent Gd-DTPA in tumor tissue have the potential to provide insights into the distribution of perfused microvessels in tumor tissue, the perfused vessel density, and the vascular surface area. Before dynamic Gd-DTPA-enhanced MRI can be recognized as a valid noninvasive technique for the analysis of functional microvessels, however, it needs extensive comparison with other techniques.
In the present study, Gd-DTPA uptake rate constants were compared with immunohistochemical analysis of the morphometric parameters of the perfused vascular architecture. The immunohistochemical analysis, which was applied after the MR experiments, seemed to detect nearly all functional microvessels, because in nonperfused regions chronically hypoxic cells (diffusion-limited oxygen supply) and necrotic areas were detected. Therefore, the immunohistochemical method allows a proper evaluation of the functional aspects of tumor microcirculation. Further, whole-tumor sections were analyzed using a computer-controlled image-processing system connected to a fluorescence microscope (Rijken et al., 1995). In this way, the reproducibility of the immunohistochemical analysis was improved and the quantification of morphologic parameters was independent of the pathologist's choice of tumor region.
The distribution of apparent Gd-DTPA concentrations in whole transverse tumor slices was found to be spatially correlated with the two-dimensional perfused microvessel distribution in a representative tumor section of that slice. This indicates that most microvessels had a disrupted BBB, which allowed Gd-DTPA and the Hoechst fluorescent perfusion marker to diffuse across the neovascular endothelium. Gd-DTPA uptake rates were found to be linearly related to the perfused microvessel density and the perfused microvessel surface area in voxels containing perfused microvessels. The linear relation between Gd-DTPA uptake rates and the perfused vascular surface area indicates that the Gd-DTPA uptake rate is not affected by variations in vascular permeability or TBP. In the present study, the molecular weight of Gd-DTPA was probably not large enough to discriminate between tumor microvessels with a more-or-less leaky BBB; the BBB of all microvessels was highly permeable to Gd-DTPA. The heterogeneity of the BBB permeability may be assessed by contrast agents with a molecular weight larger than 20 kD (Artemov and Bhujwalla, 1997; Demsar et al., 1997; Su et al., 1995).
In previous fast dynamic MRI studies of the Gd-DTPA uptake, two different pharmacokinetic models were used to analyze changes in the apparent Gd-DTPA concentration in time: the multicompartment model of Tofts and Kermode (1991) and the single-capillary model of Larsson and associates (1990). If the tumor blood perfusion is much larger than the diffusive transport across the BBB, then the kLarsson may be approached by the Gd-DTPA uptake rate constant, as defined by Tofts and Kermode (kTofts) (Larsson and Tofts, 1992; Degani et al., 1997). The uptake rate constant kTofts has a linear relation with tracer transport across the vascular endothelium (PSp product) and an inverse relation with the distribution volume of the tracer in the volume of interest. In such a case, the slope of the line in Fig. 5 equals the apparent vascular permeability (P) divided by the distribution volume of the tracer per voxel (Vd). The use of the term “apparent vascular permeability” is preferable because Gd-DTPA uptake rates were obtained from homogeneously and heterogeneously perfused voxels. In heterogeneously perfused voxels, the tracer may have arrived simultaneously from nearby capillaries and by diffusion through the extracellular volume from more distant perfused microvessels, which overestimates the vascular permeability. The distribution volume (Vd) of Gd-DTPA in perfused voxels was approximately 25 ± 1.5% and equals the extracellular volume corrected for the vascular volume, which varied from 1.5% to 2.4%. Consequently, the cellular volume fraction is close to 73%, which is comparable to mean values found by Donahue and colleagues (1995) in a mammary adenocarcinoma model. Using the estimated Vd value and the slope of the line in Fig. 5, the apparent microvessel permeability (P) in voxel categories P and PH can be calculated as 6 × 10⁻⁵ cm/sec.
The vascular permeability or the PSp product for Gd-DTPA was measured previously in gliomas growing in the rat brain (Kenney et al., 1992; Schmiedl et al., 1992). However, the values found in these studies cannot be compared directly to estimates of the vascular permeability or PSp product in the present study because the PSp product was estimated using a simple graphic method by Patlak and associates (1983). The latter method assumes that the reflux of Gd-DTPA from the tumor interstitium back into the microvessels can be neglected (unidirectional two-compartment model). However, in our study, CT(t) curves were not linear, which means that the reflux of Gd-DTPA from the tumor interstitium back into the microvessels should be taken into account (Larsson et al., 1990; Tofts and Kermode, 1991). In studies on the quantitation of BBB permeability in patients with multiple sclerosis lesions using a comparable MR method and pharmacokinetic model as in this study, permeability constants in the range of 0.4 to 1.7 × 105 cm/sec were found (Tofts and Kermode, 1991). These values are smaller than our estimates of the BBB permeability in 9L-gliomas, which may be explained by differences in pathology and disruption of the BBB.
The linear relation between Gd-DTPA uptake rates and the perfused vascular surface area indicates that Gd-DTPA uptake rates are not affected by variations in TBP. It would be of interest to know which range of TBP values could affect this linear relation. For that purpose, the relations between Gd-DTPA uptake rates, PSp product, and TBP are simulated using the single-capillary model of Larsson and colleagues (1990). Estimates of the vascular permeability in this paper and the tracer distribution volume in voxels of vital tumor regions permit simulations of these relations (Fig. 6). In these simulations, TBP varied from zero to four times the maximum PSp product found in this study (i.e., product of the apparent vascular permeability and the maximum Sp value). In addition, information on the range of kLarsson values was used because kLarsson values larger than 0.021 sec−1 were not detected in perfused voxels. Fig. 6 shows that the relation between kLarsson and the PSp product slowly becomes linear when TBP exceeds the PSp product. Hence, the linear relation between kLarsson and Sp can be explained only when TBP is larger than the PSp product in the different voxels (diffusion-limited Gd-DTPA uptake). This is true for TBP values of more than 1.5 × 10⁻⁵ cm3/sec (see Fig. 6). The relation between kLarsson values and Sp would have been exponential in Fig. 6, when the PSp product becomes larger than TBP (perfusion-limited Gd-DTPA uptake).
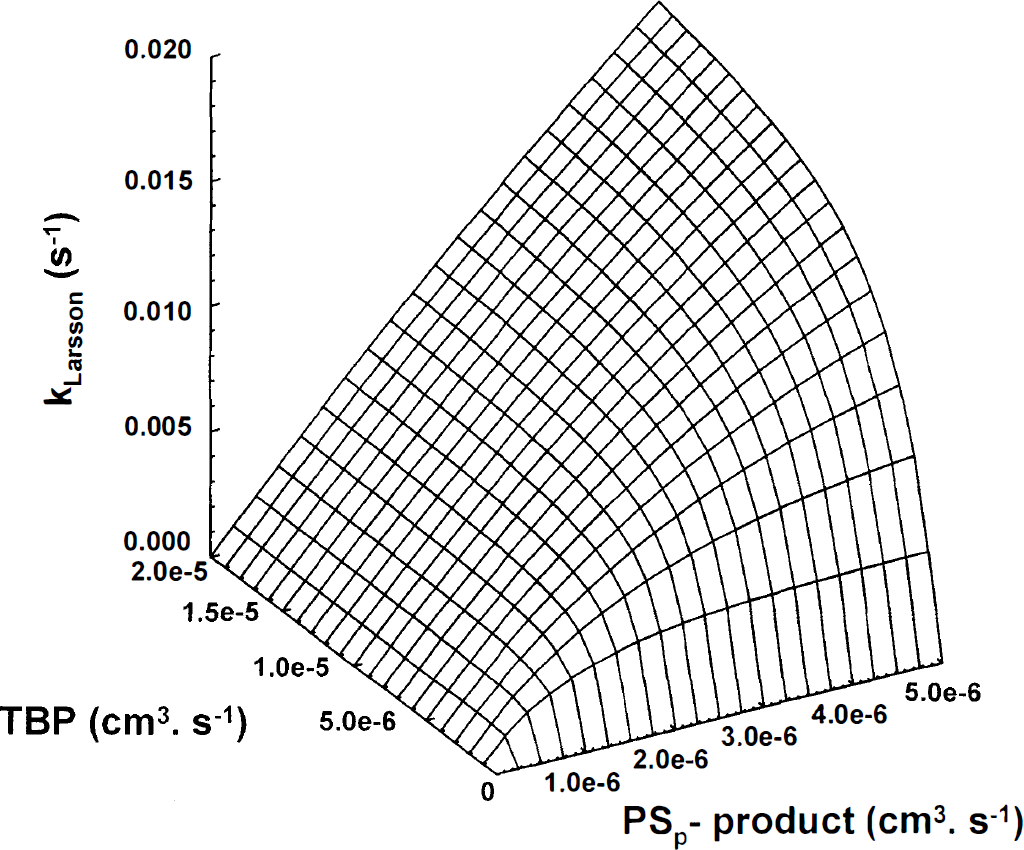
Surface plot of correlations between the permeability surface area product (PSp product, x-axis), tumor blood perfusion (TBP, y-axis), and Gd-DTPA uptake rate constants (kLarsson, z-axis) using the definition of the rate constant k as proposed by Larsson and associates (1990): kLarsson = E·TBP/Vd. The distribution volume (Vd) of the tracer in the extracellular volume of perfused voxels (1 mm3) was 25% in these simulations. The range of k values is comparable to the range in Fig. 5.
If Gd-DTPA uptake rates in voxels with perfused microvessels are governed by the perfused vascular surface area or indirectly by the perfused vascular density, then quantification of these Gd-DTPA uptake rate constants may help to monitor noninvasively the effect of an antiangiogenic therapy (Brasch et al., 1997; Pass et al., 1997). The latter therapy should not decrease the TBP in such a way that it becomes equal to or less than the PSp product, but it should affect only the number of perfused microvessels or vascular surface area. Further, the early enhancement of Gd-DTPA in CT maps was found to correlate spatially with the perfused microvessel distribution. This information may be used in the prediction phase before radiation therapy or chemotherapy because both treatments depend on the delivery of oxygen and drugs by means of functional microvessels. Areas that are enhanced on CT maps are more sensitive to radiation therapy or chemotherapy than nonenhanced areas, which depend on a less efficient supply of drugs and oxygen by diffusion.
In conclusion, in whole-tumor sections through the center of 9L-glioma in the rat brain, a spatial correlation was found between the apparent Gd-DTPA concentration and the two-dimensional distribution of perfused microvessels. In voxels containing perfused microvessels, the Gd-DTPA uptake rates were linearly related to the perfused microvessel density and vascular surface area. Now that Gd-DTPA uptake rates can be related to these parameters of the functional neovasculature, they can be used more efficiently as a prognostic tool before or during therapy.
Footnotes
Acknowledgments
The authors thank Rob M. W. de Waal, PhD, and Jelle O. Barentsz, MD, PhD, for critical reading of this manuscript; Joris H. N. Creyghton, Henny Borsboom, and Hans Overvest for technical assistance during the MR measurements; and A. Hanssen and colleagues for animal care.
Appendix
Changes of the apparent Gd-DTPA concentration in the extravascular volume of a tissue of interest are generally given by Eq. A1 with a scaling factor S (Rozijn et al., 1998):
In this equation, the uptake rate constant k (sec−1), as proposed by Larsson and colleagues (1990), is defined as kLarsson = TBP·E/Vd. TBP is the tumor blood perfusion (mL/sec), E (−) is the extraction fraction of the amount of tracer during bolus passage (E = 1 − exp [-PSp/TBP]), and Vd is the distribution volume (mL) of the tracer, which equals the extracellular volume in the case of Gd-DTPA. In the extraction term (E), P is the permeability of the microvessel endothelium for the tracer (cm/sec) and Sp is the total perfused microvessel surface area (cm2) in the volume of interest. If TBP is much larger than the PSp product, then k approaches the uptake rate constant, as proposed by Tofts and Kermode (1991)(Larsson and Tofts, 1992): kTofts = PSp/Vd.
In Eq. A1, r1[Gd]0 is the apparent Gd-DTPA concentration at t = 0; A1, A2, and λ1, λ2 are amplitudes (mM) and rate constants (sec−1), respectively, of the arterial input function Cp(t), which describes the biexponential decay of the Gd-DTPA concentration in plasma (p) in a carotid artery during the Gd-DTPA uptake experiment:
The fast phase of this biexponential decay (λ1) is governed by Gd-DTPA exchange with the extravascular volumes in the rest of body, and the slow phase (λ2) is determined by the Gd-DTPA clearance by means of the kidneys (Tofts and Kermode, 1991).