
Abstract
In the α-chloralose-anesthetized rat during single forepaw stimulation, a spatially localized 1H[13C] nuclear magnetic resonance spectroscopic method was used to measure the rate of cerebral [C4]-glutamate isotopic turnover from infused [1,6-13C]glucose. The glutamate turnover data were analyzed using a mathematical model of cerebral glucose metabolism to evaluate the tricarboxylic acid (TCA) cycle flux (VTCA). During stimulation the value of VTCA in the sensorimotor region increased from 0.47 ± 0.06 (at rest) to 1.44 ± 0.41 μmol·g−1 min−1 (P < 0.01) in the contralateral hemispheric compartment (24 mm3) and to 0.65 ± 0.10 μmol·g−1min−1 (P < 0.03) in the ipsilateral side. Each VTCA value was converted to the cerebral metabolic rates of glucose oxidation (oxidative-CMRglC) and oxygen consumption (CMRO2). These rates were corrected for partial-volume based on activation maps obtained by blood oxygenation level-dependent (BOLD) functional magnetic resonance imaging (fMRI). The percent increase and the absolute value of oxidative-CMRglc in the activated regions are similar to values reported previously for total-CMRglc using the same activation paradigm. This indicates that the large majority of energy required for brain activation, in going from the resting to an activated state, is supplied by glucose oxidation. The level of activity during stimulation is relevant to awake animals because the oxidative-CMRglc (1.05 ± 0.28 μmol·g−1·min−1; current study) is in the range of total-CMRglc previously reported for awake rats undergoing physiologic activation (0.7–1.4 μmol·g−1 min−1). It is concluded that oxidative glycolysis is the main source of energy for increased brain activity and a positive BOLD fMRI signal-change occurs in conjunction with a large increase in CMRO2.
Keywords
Positron emission tomography studies on the human visual cortex (Fox et al., 1988) and autoradiography studies of the rat optic tectum (Ackermann and Lear, 1989) have reported that visual stimulation results in an increase in glucose consumption with a negligible increase in oxidative consumption. An increase in nonoxidative glucose consumption is supported by 1H nuclear magnetic resonance studies of human visual cortex (Prichard et al., 1991; Sappey-Marinier et al., 1992; Frahm et al., 1996) that found a small increase in lactate during sensory stimulation. However, Prichard et al. (1991) showed that the small lactate increase cannot quantitatively account for the sustained increase in nonoxidative glucose consumption reported using positron emission tomography and autoradiography. Positron emission tomography studies on the human somatosensory cortex (Fox and Raichle, 1986; Seitz and Roland, 1992) and autoradiography studies on the rat sensorimotor cortex (Ueki et al., 1988) have also supported the possibility of stoichiometric uncoupling between rates of glucose and oxygen consumption.
The in vivo cerebral metabolic rates of glucose oxidation (oxidative-CMRglc) and oxygen consumption (CMRO2) can be determined by 1H-observed 13C-edited (POCE) nuclear magnetic resonance spectroscopy. The POCE method measures the rate of conversion of 13C label from [C1]-glucose to [C4]-glutamate (Rothman et al., 1985; 1992; Fitzpatrick et al., 1990), from which the tricarboxylic acid (TCA) cycle flux (VTCA) may be calculated. Values of oxidative-CMRglc and CMRO2 may then be derived from the stoichiometry between the TCA cycle and glucose oxidation. We previously reported that a large increase in CMRO2 accompanied activation of the α-chloralose-anesthetized rat sensorimotor cortex during sustained forepaw stimulation (Hyder et al., 1996a). The percentage increase and absolute value of CMRO2 agreed well with previously published values of total-CMRglc under the same stimulation paradigm (Hyder et al., 1996a, Ueki et al., 1988). These findings indicate that, under these conditions, the majority of the energy required for increased cortical activation is supplied by glucose oxidation.
Our cerebral metabolic studies of the rat forepaw stimulation model follow our earlier functional magnetic resonance imaging (fMRI) studies using the blood oxygenation level-dependent (BOLD) image contrast (Hyder et al., 1994, 1995). The current understanding of the BOLD image contrast (Ogawa et al., 1993) is that the fractional change in perfusion slightly exceeds the fractional change in oxidative metabolism. For this model we had previously shown that the BOLD signal increase and area of activated tissue, after stimulus onset, are constant even for an hour-long stimulation period (Hyder et al., 1996a). The temporal behavior of the BOLD signal-change (AS/S) in this model was almost instantaneous after stimulation onset, and within 15 seconds reached a value that remained stable (coinciding with the laser-Doppler flowmetry signal) throughout long periods of stimulation (Hyder et al., 1995). Given that the changes in blood volume are small and occur in less than 3 seconds after stimulation onset (Narayan et al., 1995), we conclude that the constant BOLD signal during the hour-long stimulation represents a case of hemodynamic and metabolic steady-state, and validates the use of the POCE method to determine VTCA over this period, and the use of BOLD activation maps for partial-volume corrections. To ensure that we were measuring during the steady-state period of functional activation, the POCE measurement commenced several minutes after stimulation onset.
Previously the maximum metabolic rate for activated tissue was not determined because measurements were made without partial-volume corrections to account for nonactivated tissue. Under α-chloralose anesthesia the nonactivated tissue in the rat cortex has a metabolic rate considerably lower than in the awake animal (Dudley et al., 1982). Therefore, the value of oxidative-CMRglc previously reported may be a substantial underestimate of the rate in activated cortex. In this study improved POCE nuclear magnetic resonance sensitivity using [1,6-13C]-glucose and adiabatic pulses has allowed measurements to be made with 4D-image selected in vivo spectroscopy (4D-ISIS, Ordidge et al., 1988) from bilateral cortical hemispheric compartments (24 mm3). Intra-animal comparisons of ipsilateral and contralateral metabolic fluxes within the sensorimotor area of the rat cortex during single forepaw stimulation are presented. Metabolic fluxes from the contralateral compartment were corrected for partial volume of nonactivated tissue using fMRI. An unanticipated finding was the presence of elevated oxidative glucose consumption and activated fMRI pixels in the ipsilateral side. Preliminary accounts of this work have been presented (Hyder et al., 1996b).
MATERIALS AND METHODS
Animal preparation
Sprague-Dawley rats (adult; male; 150–220 g; fasted 24 hours) underwent a tracheotomy and were ventilated with a mixture of N2O/O2 (70/30) under α-chloralose anesthesia administered intraperitoneally (20 mg·kg−1·30 min−1), and paralyzed with d-tubocurarine-Cl (3 mg/kg). A femoral artery and vein were cannulated for periodic blood sampling (for measurement of blood gases, pH, pressure, and glucose) and glucose infusion, respectively. Physiologic variables were maintained within normal limits (Pa
Nuclear magnetic resonance spectroscopy
All in vivo nuclear magnetic resonance data were acquired on a modified 7 tesla Bruker Biospec I horizontal-bore spectrometer (Bruker, Billerica, MA, U.S.A.), operating at 300.7 and 75.1 MHz for 1H and 13C, respectively, with a double-concentric circular radio-frequency surface coil (diameter = 10 mm, 1H; 20 mm, 13C). The static magnetic field homogeneity of the localized volume was optimized using automated shimming (Gruetter, 1993) before data acquisition. Commonly, the linewidth at half height for the water signal obtained from the localized volume was between 14 and 16 Hz. The POCE data was localized to a volume of tissue that encompassed the bilateral sensorimotor area of the cortex, and was acquired during a steady-state infusion of [1,6-13C]glucose. The POCE experiments were carried out under resting (n = 2) and stimulated (n = 5) conditions. The experimental details of the localized POCE experiment have been described earlier (see Hyder et al., 1996a). Briefly, the sequence included inversion-recovery water suppression, 4D-ISIS volume selection of bilateral compartments (x, y, z. = 5, 1.6, 3 mm3), and surface lipid suppression before the 13C editing pulse sequence. The 4D-ISIS volume selection of bilateral compartments in the x dimension (i.e., coronal in rat brain) was achieved in the following manner: first, a 3D-ISIS data set from a rectangular volume (x, y, z = 10, 1.6, 3 mm3) was acquired, where the contiguous bilateral compartments in x can be viewed as “+ +”; second, another 3D-ISIS data from the same rectangular volume was acquired, but in this case one of the compartments in x was inverted whereas the other remained the same as before (i.e., “+ –”); addition and subtraction of the two types of 3D-ISIS data completed the 4D-ISIS volume selection of the bilateral compartments (see Ordidge et al., 1988). All additions and subtractions of data were carried in the-time domain, after which the data were zero-filled to 8 K, and exponentially line-broadened (10 Hz). Each POCE difference-spectrum was phase-corrected between 4.0 and 0.5 parts per million (ppm) (zero- and first-order phase corrections). The POCE difference-spectra were baseline-corrected (zero- and first-order) between the 4.0- and 0.5-ppm region and the peak height at 2.35 ppm ([C4]-glutamate) was measured.
The surface lipid suppression was achieved by application of slice selection followed by orthogonal dephasing gradients (see Rothman et al., 1992). The POCE segment of the sequence consisted of a spin-echo using solvent suppressive adiabatic pulses (SSAP, Ross et al., 1992), where an SSAP 1H-90° pulse was followed by an SSAP 1H-180° pulse. Each SSAP pulse was 2 milliseconds in duration with a bandwidth of ±3.5 ppm in 1H chemical-shift, and performed adiabatic plane-rotations over a fourfold range in B1 power. The spin-echo delay time was 20 milliseconds, and two balanced crusher gradients (each 2 milliseconds in duration) were used in each half of the spin-echo sequence to eliminate nonrefocusing magnetization. A 13C-180° phase-cycled pulse (θXθ±x; 50 microseconds), centered at 1/2J (4 milliseconds; J ≈ 125 Hz) from the SSAP 1H-90° pulse, resulted in 95% inversion over a bandwidth of ±2.5 ppm (in 1H chemical-shift). Each free-induction decay was acquired in the presence of a broadband (±20 ppm) 13C-decoupling composite pulse decoupling (WALTZ 16, θX = 300 microseconds) during the acquisition time (204.8 milliseconds). The recycle time for each scan was 2 seconds, and these parameters corresponded to a duty cycle of 7% with ∼2 W of power deposited (see Hyder et al., 1996a).
Functional magnetic resonance (fMRI)
Multi-slice fMRI experiments (Hyder et al., 1994; 1996a; Yang et al., 1996), with BOLD image contrast (Ogawa et al., 1993), were carried out on each animal before the POCE experiment to localize activated regions during forepaw stimulation. Four coronal slices (slice thickness = 500 μm; in-plane resolution (x, y) = 300 × 300 μm), positioned at +2.5, +1.5, +0.5, and −0.5 mm with respect to the bregma, spanned the region along the z axis to encompass the bilateral sensorimotor cortex of rat brain. The fMRI stimulation period lasted 5 minutes. A 30-minute metabolic/perfusion recovery delay was maintained before the start of the POCE experiment. During this delay, an ISIS image (slice thickness = 3 mm), which represented the two bilateral compartments from which POCE data were acquired, was obtained. Three adjacent slices, encompassing the same region as in the ISIS image, were added. A BOLD fMRI activation map was created by paired Student's t-test analysis (i.e., t-map) and overlaid on the ISIS image. A threshold value of P < 0.01 was used for each t-map for the partial-volume correction (see Partial-volume correction of V TCA ). Other details of fMRI data acquisition and analysis have been described earlier (Hyder et al., 1994; 1996a; Yang et al., 1996).
Brain and plasma extracts
The rat brain was frozen in liquid nitrogen after the completion of each in vivo POCE experiment. Each brain was removed from the skull and identical regions of the cortex as in the in vivo study (see above) were sliced (30 mg). Amino acids were extracted (Behar et al., 1986) to determine the 13C fractional enrichment of [C4]-glutamate (Behar et al., 1986). Plasma samples (50 μL) were drawn every 15 minutes for quantitation (Behar et al., 1986) of the concentration and 13C fractional enrichment of [1,6-13C]glucose (Hyder et al., 1996a).
Metabolic modeling
The details of the metabolic modeling have been described previously (Mason et al., 1992; Hyder et al., 1996a). However, the 4D-ISIS POCE acquisition method results in some spatial overlap between the two adjacent compartments, which was determined on each rat from x ISIS profiles of the two compartments. The uncorrected POCE turnover data from each compartment were first corrected for this overlap,


where S(uncorr) is the observed POCE signal measured including spatial contamination from the adjacent compartment, S(corr) is the POCE signal after removal of the contamination, and a is the fraction of spatial contamination from the adjacent compartment (subscripts i and c represent the ipsilateral and contralateral compartments).
For each rat, best-fits of the metabolic model (Mason et al., 1992; Hyder et al., 1996a) to the corrected POCE data were used to obtain the VTCA values for each compartment. Theoretical relationships of oxidative-CMRglc and CMRO2 for oxidative glycolysis are determined by the stoichiometry where


The primary assumption in the modeling is that all of the 13C label flowing into the TCA cycle from acetyl-CoA enters [C4]-glutamate because of fast exchange with mitochondrial α-ketoglutarate. If the exchange between glutamate and α-ketoglutarate is not fast relative to the TCA cycle flux, then the calculated value of VTCA will be an underestimate of the actual rate (Mason et al., 1992). Loss of label to glutamine and variation in pool sizes of glycolytic and TCA cycle intermediates will have minimal effect on the calculated rates (Mason et al., 1992). The conversion of VTCA to oxidative-CMRglc (see Eq. 2b) depends on the source of approximately 25% dilution of label measured in the [C4]-glutamate pool relative to the plasma glucose precursor (Hyder et al., 1996a). The values of oxidative-CMRglc and CMRO2 were calculated assuming that the dilution was related to blood–brain exchange of pyruvate and lactate. Alternatively the dilution may have come from either net uptake of ketone bodies or loss of glucose label as a result of the pentose phosphate shunt (Mason et al., 1992). The possibility of ketone bodies contributing significantly is unlikely because of the very low plasma levels under conditions of extended hyperglycemia (KL Behar, unpublished results). If the dilution were entirely related to ketone bodies, the values of oxidative-CMRglc could be reduced by 25% and the value of CMRO2 by 9% because of the difference in oxygen to carbon stoichiometry from this source. If the dilution was a result of the pentose phosphate shunt, the values of oxidative-CMRglc and CMRO2 would not be effected because glucose would still be the only net carbon source beyond acetyl CoA (Mason et al., 1992). The value of oxidative-CMRglc calculated by Eq. 2b represents the oxidative portion of total-CMRglc, which is given by,

Values of total-CMRglc have been obtained using the same rat model by Ueki et al. (1988) by autoradiography. A comparison of our value of oxidative-CMRglc with their report puts limits on the nonoxidative-CMRglc (see Discussion). Another basis for estimating nonoxidative-CMRglc comes from the measured brain lactate transport by Lear and Kasliwal (1991) (see Discussion).
Partial-volume correction of VTCA
The presence of nonactivated tissue in the ISIS volume leads to an underestimate of VTCA for activated tissue. Therefore, the BOLD fMRI activation maps were used, in a binary fashion (i.e., region either activated or not), to correct for nonactivated regions. The partial-volume correction depends on the fraction of the compartment that is considered to be activated (i.e., threshold of the t-map), and there are no well-established criteria for setting thresholds in fMRI data. A value of P < 0.01 of statistical threshold was chosen for each activation map to determine f, the fractional volume activated in a compartment. The partial-volume correction for the contralateral compartment is given by
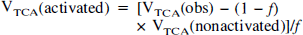
where VTCA(obs) is the observed value of VTCA obtained after removal of the spatial contamination of the adjacent compartment (see Metabolic modeling). The value of VTCA for nonactivated tissue was measured to be 0.49 μmol·g−1·min−1 (Hyder et al., 1996a), and the value of VTCA for activated tissue was calculated. All data are presented as mean ± SD.
RESULTS
Figure 1 shows serial POCE difference-spectra of [C4]-glutamate obtained from bilateral hemispherical compartments (24 mm3 each) during forepaw stimulation. The [C4]-glutamate signal increased more rapidly in the contralateral side (Fig. 1B) than on the ipsilateral side (Fig. 1A), indicating a faster contralateral TCA cycle flux. The present POCE data represent more than fourfold enhancement in sensitivity over our previous study (Hyder et al., 1996a) because of the use of (1) [1,6-13C]glucose, instead of singly labeled glucose, which doubles the 13C fractional enrichment of [C4]-glutamate (data not shown), (2) adiabatic pulses to double the 1H sensitivity (data not shown), and (3) better radio-frequency surface coil design. The subtraction errors arising from scalp lipids, occasionally observed in the 1- to 1.5-ppm region, were less in this study compared with our previous study (Hyder et al., 1996a) and did not interfere with the [C4]-glutamate measurement. An elevated plasma glucose concentration (from 6 to 12 mmol/L) and 13C fractional enrichment of ∼50% of [1,6-13]glucose was achieved within 5 minutes from the start of infusion and maintained throughout the infusion period (data not shown). The effects of elevated plasma glucose on the concentrations of brain metabolites other than glucose were negligible (data not shown), as shown in our earlier study (Hyder et al., 1996a).
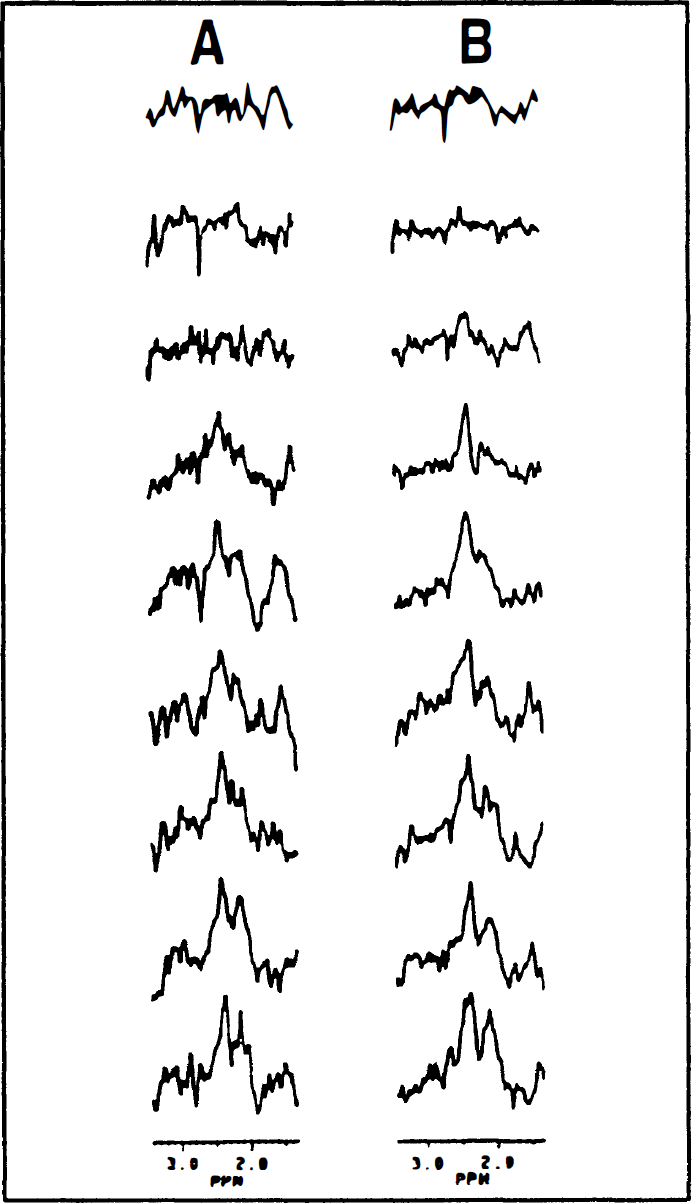
Typical proton-observed carbon-13 edited (POCE) difference-spectra from the sensorimotor area of the rat cortex during single forepaw stimulation showing the time courses of [C4]-glutamate signal during [1,6-13C]glucose infusion for
The best-fits of the metabolic model to the corrected POCE data (see Eq. 1) for rat 1 (Table 1) are shown in Fig. 2. The comparison of the two fits in Fig. 2 shows that VTCA is significantly increased in the contralateral side during forepaw stimulation. In columns 2 and 3 of Table 1, the best-fits of the metabolic model to the correct POCE data (the mean value of a in Eq. 1 was 0.18 ± 0.01) are listed. The contralateral side VTCA was increased by 119% relative to the ipsilateral side (1.44 ± 0.41 vs. 0.65 ± 0.10 μmol·g−1·min−1; P < 0.01).
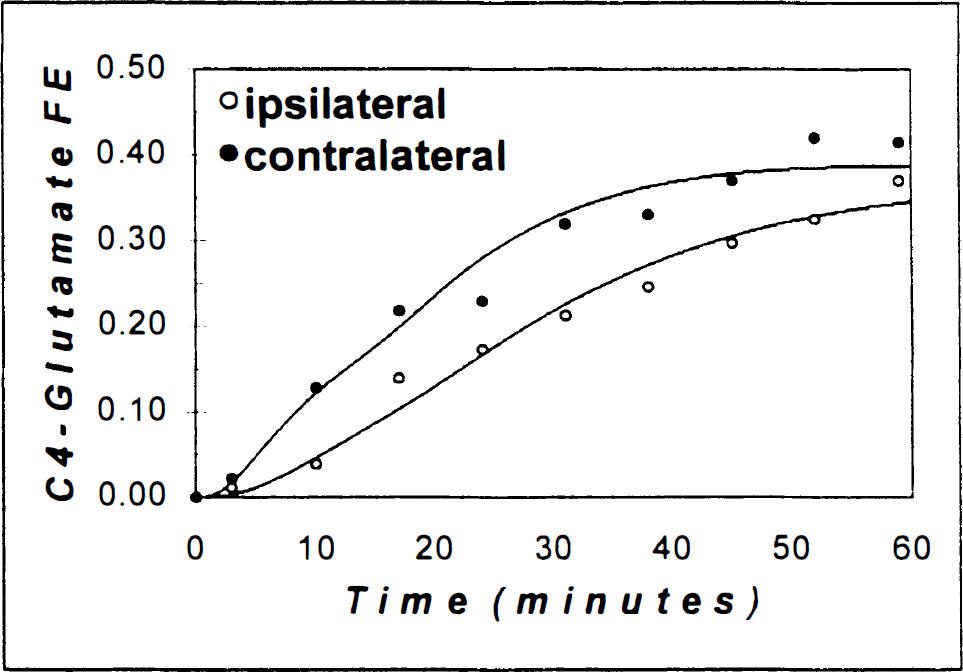
The [C4]-glutamate time courses obtained from corrected POCE data, as in Eq. 1 (filled circles, contralateral; open circles, ipsilateral), and the best-fits of the metabolic model to the data (line). The vertical axis is the [C4]-giutamate 13C fractional enrichment in the brain and the horizontal axis is the time after [1,6−13C]glucose infusion began. For the ipsilateral side, the value of the TCA cycle flux (VTCA) was 0.61 ± 0.09 μmol·g−1·min−1, and for the contralateral side the value of VTCA was 1.60 ± 0.16 μmol·g−1·min−1, during single forepaw stimulation. VTCA was significantly increased in the contralateral side in comparison to the ipsilateral side. See Results and Table 1 for more details.
Summary of results (values of VTCA in units of μmol/g/min)
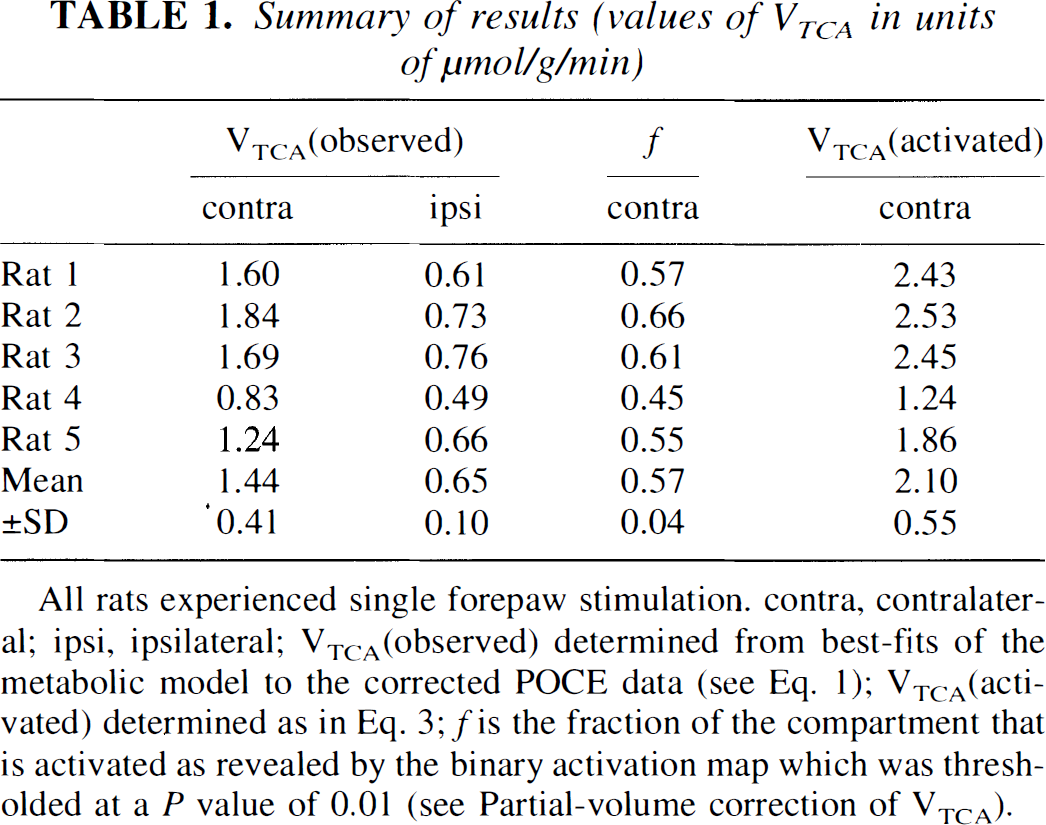
All rats experienced single forepaw stimulation. contra, contralateral; ipsi, ipsilateral; VTCA(observed) determined from best-fits of the metabolic model to the corrected POCE data (see Eq. 1); VTCA(activated) determined as in Eq. 3; f is the fraction of the compartment that is activated as revealed by the binary activation map which was thresholded at a P value of 0.01 (see Partial-volume correction of VTCA).
VTCA on the ipsilateral side was higher than we previously found in nonstimulated animals (0.49 ± 0.03 μmol-g−1·min−1; Hyder et al., 1996a). The cause may be activation on the ipsilateral side because in all but one experiment of this study (rat 4 in Table 1) the fMRI results showed ∼8% of the ipsilateral pixels to be activated at threshold of P < 0.01 for t-maps (Table 1), which is well above noise. The higher VTCA is linked to stimulation because two rats without stimulation had VTCA values in both hemispheres similar to our previous study (0.47 ± 0.06 μmol·g−1·min−1). Because the ipsilateral side was partially activated, the resting VTCA rate in the somatosensory cortex from our previous study was used for partial-volume correction of the contralateral VTCA values (Eq. 3).
The partial-volume corrected values of VTCA for the contralateral side (see Eq. 3) are listed in Table 1. The mean value was 2.10 ± 0.55 μmol·g−1·min−1. The mean value of the partial-volume fraction in the contralateral side (f in Eq. 3) was 0.57 ± 0.04 (Fig. 3). The VTCA in the activated regions represents a 329% increase from the nonactivated rate. The percent increases and the absolute values of activated oxidative-CMRglc and CMRO2 are given in Table 2.
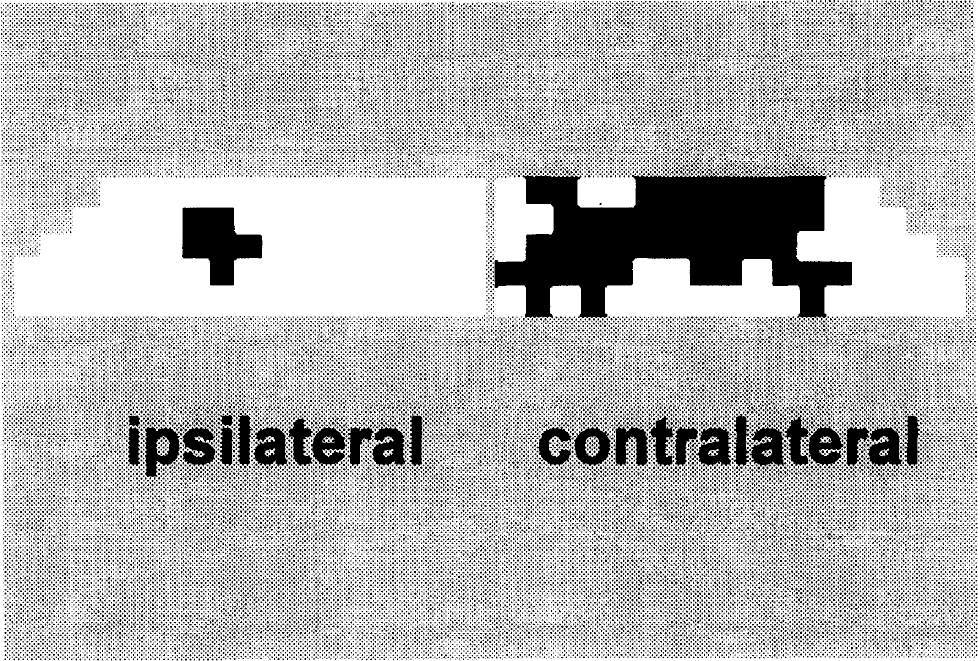
Binary activation map (black) of the ipsilateral and contralateral sides during single forepaw stimulation overlaid on the image-selected in vivo spectroscopy image (white). Given the value of f, the fraction of the compartment that is activated (see Materials and Methods), VTCA(activated) was calculated as in Eq. 3. See Results, Table 1, and Discussion for more details.
Activated metabolic fluxes (values of contralateral VTCA, oxidative-CMRglc, CMRO2 in units of μmol/g/min)
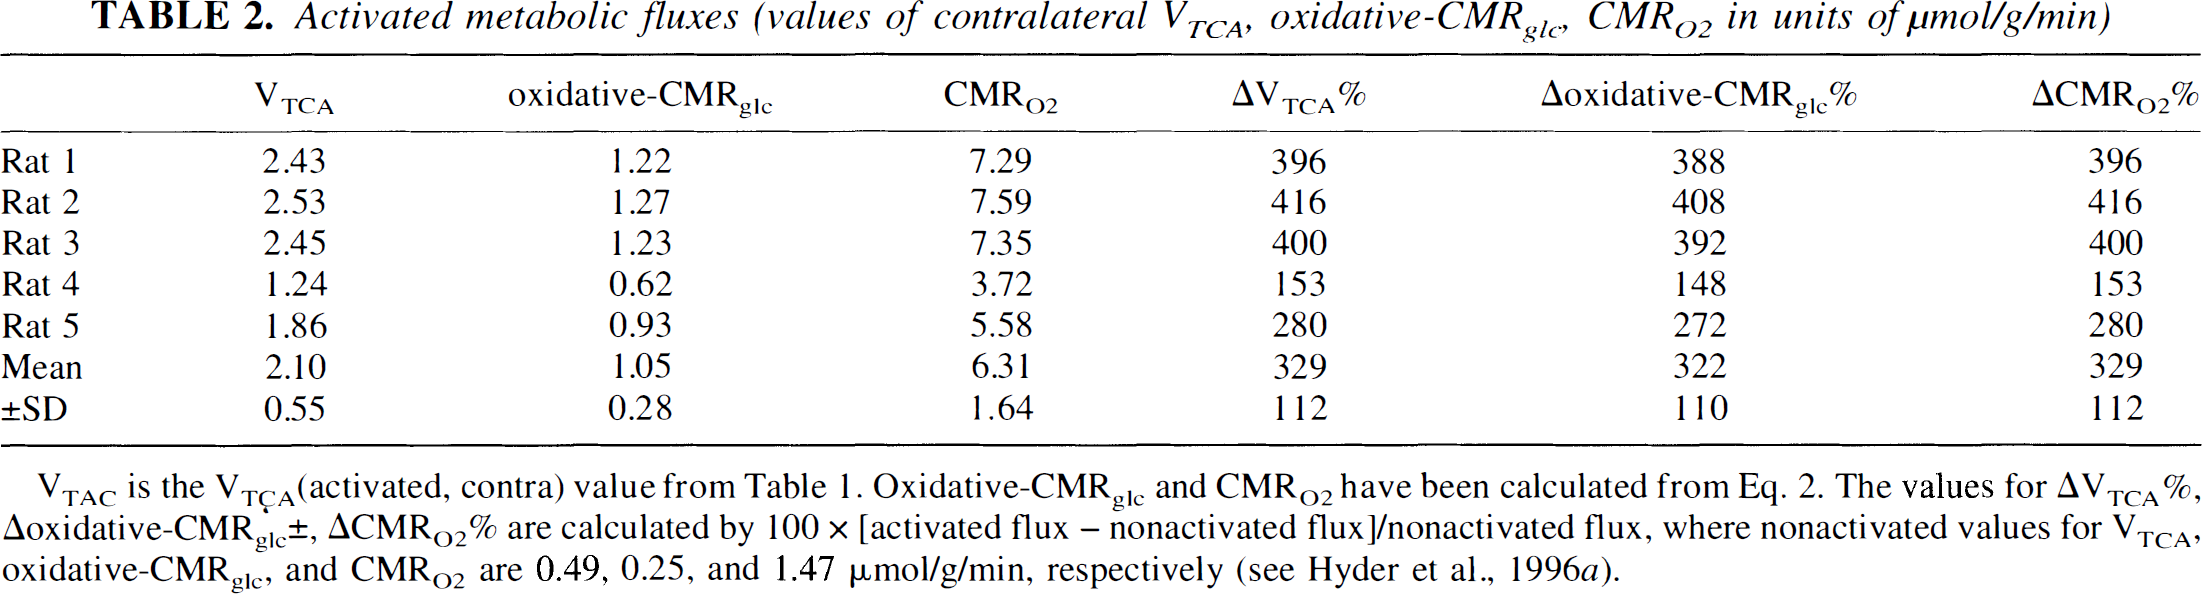
VTAC is the VTÇA(activated, contra) value from Table 1. Oxidative-CMRglc and CMRO2 have been calculated from Eq. 2. The values for ΔVTCA%, Aoxidative-CMRglc±, ACMRO2% are calculated by 100 × [activated flux – nonactivated flux]/nonactivated flux, where nonactivated values for VTCA, oxidative-CMRglc, and CMRO2 are 0.49, 0.25, and 1.47 μmol/g/min, respectively (see Hyder et al., 1996a).
DISCUSSION
The BOLD fMRI measurements of the percent activated tissue in the sensorimotor cortex were used for partial-volume corrections of VTCA to obtain estimates of oxidative-CMRglc and CMRO2 in locally activated cortex (Fig. 3 and Table 2). We made conservative partial-volume corrections to avoid underestimation of the fraction of activated tissue and overestimation of VTCA in activated regions. The fMRI threshold used in the current study is near the minimum currently accepted in the assignment of significant activations in fMRI (Hyder et al., 1994, 1996a; Gyngell et al., 1996; Yang et al., 1996). A higher threshold would result in a higher rate of oxidative metabolism in the activated regions. All pixels assigned by the BOLD fMRI activation map to have significant activation were assumed to have the same metabolic rate and heterogeneity in metabolic rate within the activated regions.
To assess the nonoxidative fraction of glucose consumption the values of oxidative-CMRglc reported here may be compared with measurements of total-CMRglc by Ueki et al. (1988) using the same stimulation paradigm and anesthesia conditions. The value of total-CMRglc reported by Ueki et al. (1988) is the average for the entire contralateral somatosensory cortex. Correcting this value for the region measured in the present study gives a total-CMRglc between 0.7 and 1.3 μmol·g−1·min−1. The contralateral oxidative-CMRglc of 1.05 ± 0.28 μmol·g−1·min−1 (Table 2) is similar to the value we obtained using double forepaw stimulation in our previous study (0.74 ± 0.41 μmol·g−1·min−1; Hyder et al., 1996a). Although quantitative comparison is complicated by the difference in measurement volumes, it is clear that a large fraction of the increase in glucose consumption is oxidized. Given the 16 times greater efficiency in ATP production for oxidative glucose consumption versus nonoxidative consumption, the great majority of additional energy required for the increased activity is supplied by glucose oxidation.
The POCE nuclear magnetic resonance observation of 13C turnover of glutamate, which is a direct measure of VTCA, allows the in vivo determination of CMRO2 and oxidative-CMRglc at steady-state. The value of nonoxidative-CMRglc, which cannot be measured by this method, can be estimated by comparison of steady-state values of oxidative- and total-CMRglc. For this rat model, resting and stimulated values for oxidative- and total-CMRglc are available under similar conditions, albeit from different laboratories (current study; Ueki et al., 1988). Comparison of these values during resting conditions for α-chloralose-anesthetized rats shows that nonoxidative-CMRglc is a very small fraction of total-CMRglc (Hyder et al., 1996a). However, comparison of the stimulated values of oxidative- and total-CMRglc are complicated by the need for partial-volume correction. The uncertainties in correcting the data of Ueki et al. (1988) for partial-volume differences allow that there may be some regions in the cortex in which the increase in total-CMRglc is substantially greater than in oxidative-CMRglc. If this were true the partial-volume corrected percent increase in oxidative-CMRglc would have to be substantially less than the maximum percent increase of total-CMRg]c reported in the autoradiography maps presented by Ueki et al. (1988). The mean value of VTCA for activated tissue is 2.10 ± 0.55 μmol·g−1·min−1, which corresponds to an increase of 322% and 329% in oxidative-CMRglc and CMRO2, respectively (Table 2). The large increase in oxidative-CMRglc is similar to maximum increases of total-CMRglc from 200% to 400% (Ueki et al., 1988). This indicates that nonoxidative-CMRglc could account for 0 to 18% of total-CMRglc during stimulation, similar to the contribution at rest (Hyder et al., 1996a). This comparison also suggests that oxidative-CMRglc accounts for the majority of the increase in energy production.
The conclusion that oxidative-CMRglc accounts for the majority of increased glucose consumption is further supported by the low rate of lactate efflux expected under these conditions. A maximum estimate of nonoxidative-CMRglc can be made by assuming that lactate efflux is equal to the maximum unidirectional rate of lactate transport in rat cortex (Lear and Kasliwal, 1991). Assuming a resting cortical lactate concentration of 1.2 μmol/mL (F. Hyder, unpublished results) that increases to 1.6 μmol/mL during cortical activation, as reported by Ueki et al. (1988), a value of 0.22 μmol·g−1·min−1 is calculated for the maximum unidirectional rate of lactate transport (0.14 mL·g−1·min−1 × 1.6 μmol/mL; Lear and Kasliwal, 1991). This value of lactate efflux corresponds to a nonoxidative-CMRglc of 0.11 μmol·g−1·min−1. This estimate of the maximum nonoxidative component is only 11% of the measured rate of oxidative-CMRglc of 1.05 ± 0.28 μmol·g−1·min−1.
The large percentage increase in oxidative-CMRglc and CMRO2 is probably caused by the concomitant depression of resting metabolism by α-chloralose because the activated values are similar to total-CMRglc in the awake rat undergoing physiologic stimulation. In specific layers of the occipital cortex, total-CMRglc ranges from approximately 0.7 μmol·g−1·min−1 in darkness to about 1.4 μmol·g−1·min−1 with maximum visual stimulation in the awake rat (Miyaoka et al., 1979; Sokoloff, 1981). The value of total-CMRglc in the sensorimotor cortex has been reported to be in the range of 0.9 μmol·g−1·min−1 for an awake animal allowed to freely move its forepaws (Savaki et al., 1983). The measured rate of oxidative-CMRglc of 1.05 ± 0.28 μmol·g−1·min−1 is within this range of values. The measured increase in oxidative-CMRglc in the current study is well within the capacity of cortical tissue, because Evans and Meldrum (1984) reported maximum value of total-CMRglc of 1.67 ± 0.10 μmol·g−1·min−1 for rats experiencing seizures induced by bicuculline.
An unanticipated finding in this study was an increase in metabolism in the ipsilateral side of the cortex. The elevated value of VTCA on the ipsilateral side of 0.65 ± 0.10 μmol·g−1·min−1 vs. 0.49 ± 0.03 μmol·g−1·min−1 in nonactivated tissue (from Hyder et al., 1996a) may have been the result of partial activation on the ipsilateral side as a consequence of the forepaw stimulation. This possibility is supported by finding that, in all but one experiment, the fMRI results showed ∼8% of the pixels in the ipsilateral side to be activated (see Results and Table 1), although only 1% of the pixels would be expected to be activated by chance based on the statistical threshold. A higher fMRI threshold, e.g., P < 0.005, would have removed the activated pixels in the ipsilateral side but would have resulted in the activated tissue flux to be increased by >>400% (data not shown) and the calculated value of oxidative-CMRglc in activated cortex would be far greater than the range of total-CMRglc reported for physiologic activation in awake rats (Miyaoka et al., 1979; Sokoloff, 1981). Although use of such a high fMRI threshold would not be completely unjustified, because the calculated value of oxidative-CMRglc in activated tissue would be still less than the total-CMRglc reported for rats experiencing seizures (Evans and Meldrum, 1984), we believe that the moderate fMRI threshold of P < 0.01 is a more appropriate one to apply for partial-volume correction under normal physiologic conditions. Partial-volume corrected values of activated tissue were obtained from ipsilateral and contralateral sides at different levels of threshold (range of P values from 0.030 to 0.005 in increments of 0.005; data not shown). If it is assumed that the pixels revealed in a BOLD map at a certain threshold correspond to activated pixels, then the partial-volume corrected values of activated tissue from ipsilateral and contralateral sides should correspond, approximately, within margins of experimental error. The closest correspondence between the partial-volume corrected values of activated tissue from the two compartments were found at the threshold of P < 0.01 (activated tissue VTCA of 2.29 ± 0.79 vs. 2.10 ± 0.55 μmol·g−1·min−1 for ipsilateral and contralateral sides, respectively; data not shown). Partial activation of the ipsilateral side may arise from stimulus-initiated motions of opposite or other limbs, or whiskers, none of which were controlled for in this study. In our previous functional metabolic study, we had demonstrated that the increase in metabolism during forepaw stimulation is localized in the sensorimotor cortex of the brain (i.e., occipital cortex was unaffected), and these results were consistent with the fMRI data (Hyder et al., 1996a). Therefore, we believe that the increased metabolic flux and BOLD activation in the ipsilateral side is not a global effect of the stimulus, but rather a focal one. However, the possibility of interhemispheric connectivity (Wise and Jones, 1978; McKenna et al., 1981) cannot be excluded.
Quantitative interpretations of a positive BOLD fMRI signal change, AS/S, observed in human brain fMRI studies have assumed a negligible increase in CMRO2 and a significant increase in CBF (Ogawa et al., 1993; Menon et al., 1995) based on the earlier positron emission tomography findings (Fox and Raichle, 1986; Fox et al., 1988). For the BOLD mechanism to result in a positive AS/S, the fractional increases in perfusion (i.e., ACBF/CBF) must be greater than those in oxidative metabolism (i.e., ACMRO2/CMRO2),

given that ΔR2* = R2* × (A / B − 1), where A = (1 + ACMRO2/CMRO2), B = (1 + ACBF/CBF), R2* is the apparent transverse relaxation rate for brain water, and TE is the BOLD fMRI gradient-echo time. Equation 4 has been derived based on the observation of a linear and direct relationship between R2* and degree of blood deoxygenation in rat brain at a magnetic field strength of 7 Tesla (Ogawa et al., 1993). For this rat model, our highest estimate of ACMRO2/CMRO2 is 3.3, and the values of R2* and ΔR2* are 35 and −2.3 seconds−1, respectively, with an average ΔS/S value of 0.05 at TE of 20 milliseconds (F Hyder, unpublished results). Based on Eq. 4, during steady-state the maximum estimate of ΔCBF/CBF is 3.6. Because the measured increase in CBF for rats experiencing seizures induced by bicuculline is in the range of 6 mL·g−1·min−1 (Meldrum and Nilsson, 1976), which is almost sevenfold the value of resting α-chloralose anesthetized rats, the ACBF/CBF predicted is well within the physiologic capacity of the brain.
In summary, we have demonstrated that intra-animal comparisons of ipsilateral and contralateral TCA cycle fluxes within the sensorimotor area of the rat cortex during single forepaw stimulation show an increased oxidative glucose metabolism in the contralateral side. Activation maps obtained by BOLD fMRI were used to make partial-volume corrections and thereby determine the maximum increase in metabolism in activated cortex. Comparisons with previous measures of total glucose consumption and lactate efflux in activated tissue indicate that, within our accuracy, the increase in glucose consumption is almost entirely oxidative. The results conservatively suggest that oxidative-CMRglc in the activated cortex is similar to values for total/-CMRglc in activated cortex of awake rats, which supports the relevance of the present findings to functional metabolism in the awake state. An elevated rate of oxidative-CMRglc and activated regions were also observed on the ipsilateral side, which may indicate interhemispheric connectivity. The results also indicate that in activated regions, BOLD signal increases in conjunction with a large increase in CMRO2.