
Abstract
Results of recent studies suggest that the glutamate–glutamine neurotransmitter cycle between neurons and astrocytes plays a major role in the generation of the functional imaging signal. In the current study, the authors tested the hypothesis that activation of voltage-dependent Na+ channels is involved in the blood oxygenation level-dependent (BOLD) functional magnetic resonance imaging (fMRI) responses during somatosensory activation. The BOLD fMRI and cerebral blood flow (CBF) experiments were performed at 7 Tesla on α-chloralose–anesthetized rats undergoing forepaw stimulation before and for successive times after application of lamotrigine, a neuronal voltage-dependent Na+ channel blocker and glutamate release inhibitor. The BOLD fMRI signal changes in response to forepaw stimulation decreased in a time-dependent manner from 6.7% ± 0.7% before lamotrigine injection to 3.0% ± 2.5% between 60 and 105 minutes after lamotrigine treatment. After lamotrigine treatment, the fractional increase in CBF during forepaw stimulation was an order of magnitude less than that observed before the treatment. Lamotrigine had no effect on baseline CBF in the somatosensory cortex in the absence of stimulation. These results strongly suggest that activation of voltage-dependent Na+ channels is involved in the BOLD fMRI responses during somatosensory activation of the rat cortex.
Keywords
In recent years, functional magnetic resonance imaging (fMRI) based on blood oxygenation level-dependent (BOLD) image contrast has been used extensively in mapping the functional anatomy of sensory and cognitive systems (McCarthy et al., 1996; Ogawa et al., 1992). The physiologic basis of BOLD image contrast during brain activation is due to local changes in paramagnetic deoxyhemoglobin in response to adjustments in cerebral blood flow (CBF), blood volume, and the tissue oxygen consumption (CMRO2) (Kida et al., 2000). The positive signal increase in BOLD fMRI resulting from physiologic activation is well correlated with the increase in CBF (Silva et al., 1999) and CMRO2 (Hyder et al., 1996, 1997). Although much discussion has arisen over the relative magnitudes of the changes in these parameters during neuronal activation (Hyder et al., 1998), the use of fMRI and BOLD image contrast to infer neuronal activation is well accepted. BOLD fMRI, however, is not a direct measurement of neuronal events, such as neurotransmitter release or synaptic electrical potentials; thus, it is of fundamental importance to characterize the molecular mechanisms linking the observed BOLD signal change to neurophysiology at the cellular level.
Under physiologic conditions, Ca2+-dependent vesicular release of neurotransmitters (for example, excitatory amino acids, biogenic amines) occurs in response to the depolarization resulting from the influx of Na+ ions through presynaptic voltage-dependent Na+ channels (Leach et al., 1986). Inhibitors of these channels and the Na+ current they mediate suppress neuronal excitability and neurotransmitter release. Thus, Na+ channel blockers have found an important application in the treatment of epilepsy and as potential new therapies for neurodegenerative diseases where excessive release of excitatory amino acid neurotransmitters (primarily glutamate) is believed to contribute to neuronal injury (Choi et al., 1987; Taylor and Narasimhan, 1997). The results of recent studies suggest that glutamate synapses play a major role in functional glucose utilization (Pellerin and Magistretti, 1994; Sibson et al., 1998; Sokoloff et al., 1996). Thus, voltage-dependent Na+ channels can be viewed as the initial trigger step in synaptic activation and release of neurotransmitters.
In the current study, the authors tested the hypothesis that activation of voltage-dependent Na+ channels is a required step in the neurochemical pathway leading to the BOLD fMRI and CBF responses during somatosensory activation. The authors investigated the effects of the antiepileptic agent lamotrigine [6-(2,3-dichlorophenyl)-1,2,4-triazine-3,5-diamine], a very well-studied neuronal voltage-dependent Na+ channel blocker and glutamate release inhibitor (Leach et al., 1986), on the time course of BOLD signal activation in α-chloralose–anesthetized rats during forepaw stimulation.
MATERIALS AND METHODS
Animal preparation
Male Sprague-Dawley rats weighing 220 to 280 g (n = 16) and fed ad libitum were anesthetized with 1% to 1.5% halothane in 70%/30% N2O/O2. They were tracheotomized and artificially ventilated. A femoral artery was cannulated to obtain blood samples for blood gas measurement and to monitor blood pressure. Intraperitoneal catheters were placed for the administration of drugs. Ventilation was adjusted to maintain arterial blood gas tension in the physiologic range. After surgery, animals were placed prone in a plastic cradle and covered with a warm recirculated water pad to maintain core body temperature near 37°C. The head was secured to the probe using a bite bar and foam cushions were placed to minimize gross head movement. The radiofrequency surface coil was placed directly over the skull and centered over bregma. The rat was placed into the magnet and the head was positioned at the magnet isocenter. After positioning, α-chloralose (initial 80 mg/kg; supplemental 20 mg/kg per 30 minutes; intraperitoneally) was administered and halothane use was discontinued. Rats were immobilized with d-tubocurarine chloride (initial 0.5 mg/kg; supplemental 0.25 mg/kg per 30 minutes; intraperitoneally) during the experiment.
Magnetic resonance imaging
All in vivo experiments were performed on a modified horizontal-bore 7-Tesla NMR spectrometer (Bruker AVANCE, Billerica, MA, U.S.A.). Coronal slice shimming was performed automatically and manually to obtain half height line-widths of the water signal less than 20 Hz for a 5-mm-thick coronal slice. Functional MRI was performed using a multislice, fast low-angle single-shot (FLASH) gradient-echo imaging sequence with a 10-mm-diameter radiofrequency surface coil. The imaging parameters were as follows: acquired data matrix size, 64 × 64; field of view, 2.0 cm2; in-plane resolution, 312 × 312 μm2; slice thickness, 500 μm; repetition delay, 560 milliseconds for 8 slices; echo time, 15 milliseconds. In each experiment, 16 dummy scans were used to establish a steady-state magnetization before data acquisition. High-resolution FLASH anatomic images were obtained to determine the slice positions in the sensorimotor area of the rat cortex. Imaging parameters were as follows: image matrix size, 256 × 256; field of view, 2.0 cm2, in-plane resolution, 78 × 78 μm2, slice thickness, 500 μm; repetition delay, 560 milliseconds for 8 slices; echo time, 10 milliseconds.
Measurements of CBF were made in a single coronal slice (2-mm thickness) using slice-selective and nonslice-selective, gradient-echo, echo-planar imaging (EPI) with inversion-recovery weighting. For these measurements, a 1H resonator coil (8-cm diameter) was used for homogeneous radiofrequency transmission and a 1H surface coil (10-mm diameter) was used for local reception. The EPI parameters were as follows: acquired data matrix size, 64 × 32; field of view, 2.0 cm2; slice thickness, 2 mm; repetition delay, 5 seconds; echo time, 15 milliseconds; inversion-recovery time, 0.2 to 1.4 seconds. Details of the determination of absolute CBF have been described previously (Hyder et al., 2000; Kida et al., 2000).
Stimulation protocols
A pair of needle electrodes was inserted subcutaneously in the left forepaw and electrical stimulation was provided with pulses of ∼5 V in intensity and 0.5 milliseconds in duration at a frequency of 3 Hz using an electrical stimulator (Harvard Apparatus, Holliston, MA, U.S.A.). An fMRI experiment required 15.6 minutes: a prestimulation rest period (4.8 minutes) followed by forepaw stimulation (4.8 minutes) and a poststimulation rest period (6 minutes). The interval between successive stimulations was ∼10 minutes. Three fMRI experiments were performed before the injection of lamotrigine. Thus, each rat served as its own control. The same fMRI experiments were performed approximately every 15 minutes in the interval from 30 to 135 minutes after administration of lamotrigine. Measurements of CBF consisted of both slice-selective and nonslice-selective inversion-recovery EPI images and required 5 minutes each. Maps of CBF were obtained during the prestimulation and stimulation periods. Measurements of CBF were performed before and after lamotrigine treatment from 60 to 105 minutes. Lamotrigine (25 mg/kg) was dissolved in a solution of 0.2% methylcellulose and injected as a bolus of 0.2 to 0.3 mL through an indwelling intraperitoneal catheter.
Data processing
The fMRI data were processed off-line using a workstation running MATLAB software and algorithms written in-house (MATLAB, Natick, MA, U.S.A.). For each rat experiment, t-statistic and BOLD signal change (ΔS/S) maps were created on a pixel-by-pixel basis from the images in the prestimulation and stimulation periods. Head movement artifacts were identified by a center-of-mass analysis (Hyder et al., 1994). If the center-of-mass deviation was greater than 25% of a pixel size in the x or y direction for each experiment, the images were discarded from further analysis. To locate the activated region in the sensory cortex, each t-map was linearly interpolated to a 256 × 256 image matrix and overlaid onto the corresponding anatomic image. Activated regions were defined as pixels that revealed a statistically significant response at a level of P < 0.01. Details of data processing have been described previously (Hyder et al., 1994).
RESULTS
Physiologic variables were maintained within normal limits for all animals in this study. No significant differences (P > 0.24, n = 12) were observed after lamotrigine treatment (pH 7.33 ± 0.03; Pco2 36.9 ± 3.6 mm Hg; Po2 136 ± 24 mm Hg) versus the pretreatment period (pH 7.32 ± 0.03; Pco2 35.7 ± 3.7 mm Hg; Po2 134 ± 26 mm Hg). Because lamotrigine has been reported to decrease arterial blood pressure at high doses, the effects on mean arterial blood pressure were investigated for 2 different doses, 50 and 25 mg/kg. The mean arterial blood pressure was significantly reduced at the higher dose (treated, 69 ± 12 mm Hg; pretreatment, 97 ± 17 mm Hg;P < 0.02, n = 4), as observed by others (Smith and Meldrum, 1995), but not at the lower dose (treated, 89 ± 7 mm Hg; pretreatment, 93 ± 9 mm Hg;P > 0.23, n = 12). Thus, functional imaging studies were conducted on animals receiving the lower dose.
Figure 1 shows multislice BOLD fMRI activation maps obtained during stimulation of the left forepaw in the period before and 60 minutes after administration of lamotrigine. As shown in the images of the pretreated controls, the most significant changes (P < 1 × 10⁻⁶) during stimulation were detected in the forepaw somatosensory area of the right hemisphere (near bregma and 3.5 to 4.5 mm from midline) contralateral to the side of stimulation. No significant changes were detected in the ipsilateral somatosensory area, even when image thresholding was reduced (P > 0.2). The region of activation observed is consistent with electrophysiology (Chapin and Lin, 1984), 2-deoxyglucose autoradiography (Ueki et al., 1988), and previous fMRI studies reported by others (Silva et al., 1999) and the current authors (Hyder et al., 1994) for this animal model.
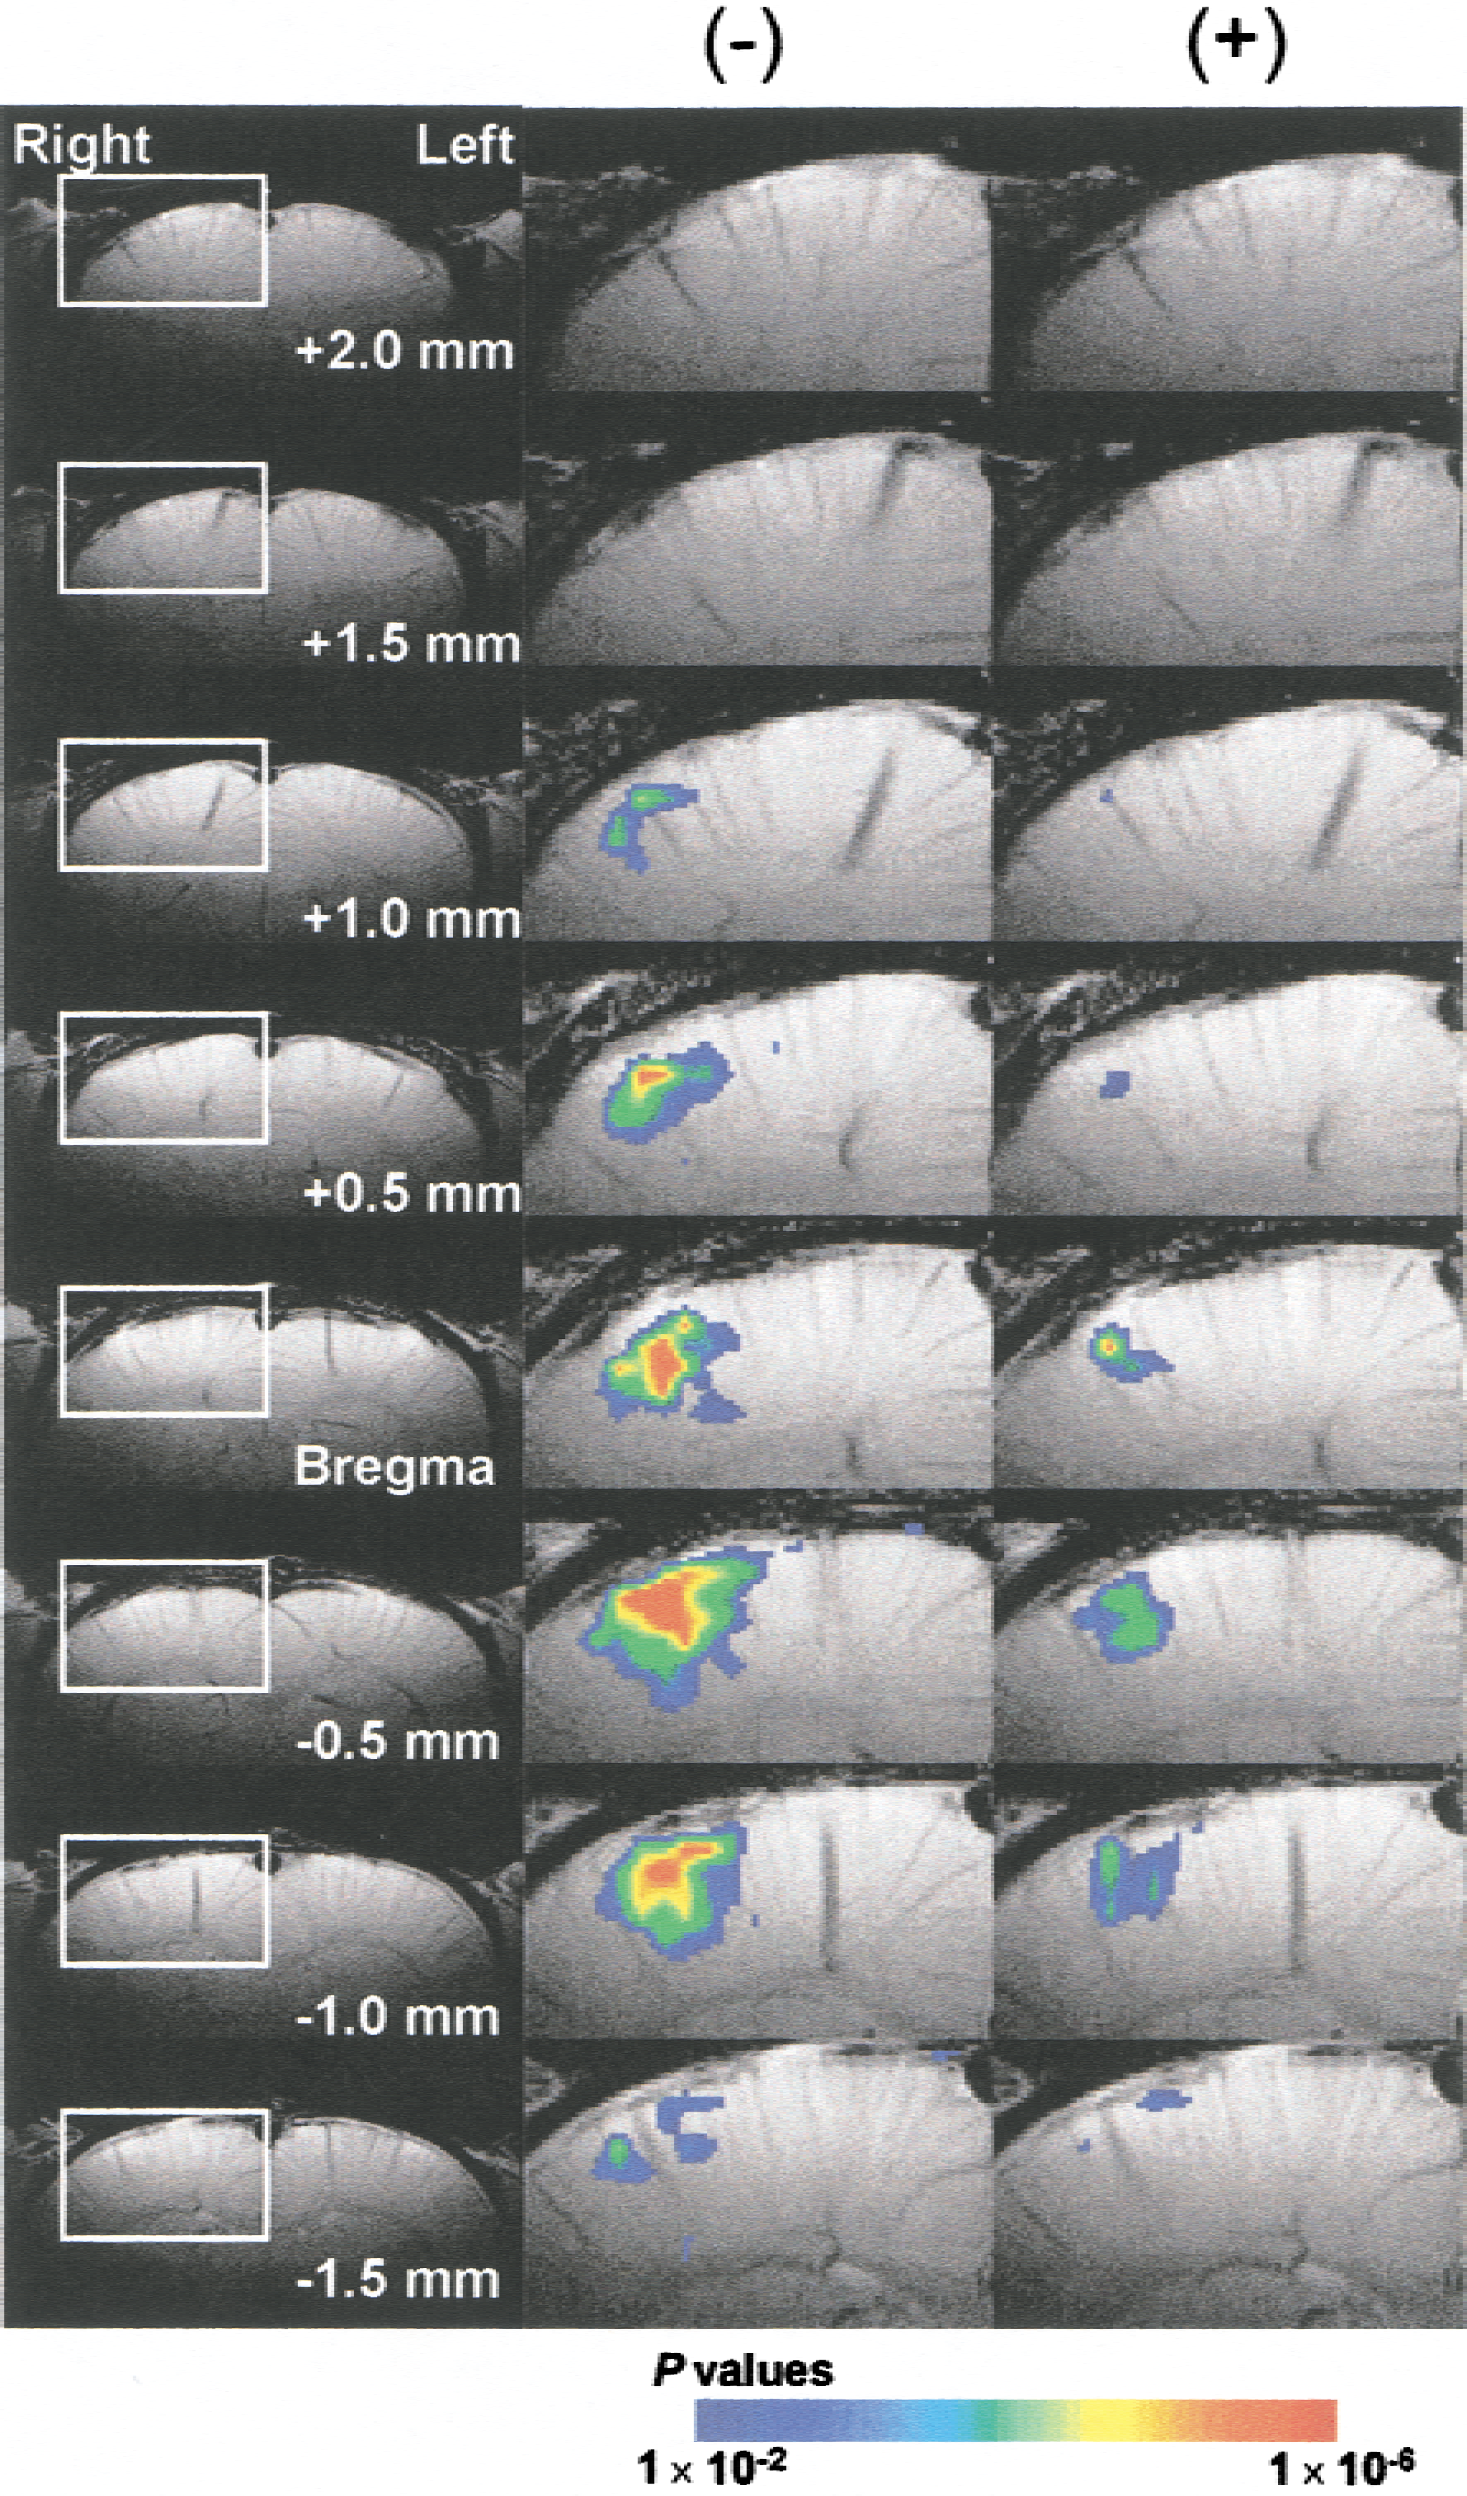
BOLD fMRI activation maps of rat cortex during left forepaw stimulation before (−) and after (+) lamotrigine treatment (25 mg/kg). The left column shows high-resolution FLASH anatomic images from each coronal level. The middle and right columns show the expanded functional images from the white rectangular region depicted in column one. Activated pixels in the sensory cortex of the right hemisphere, which is contralateral to the stimulation, are indicated by a color scale of P values for each pixel superimposed on the corresponding anatomic image.
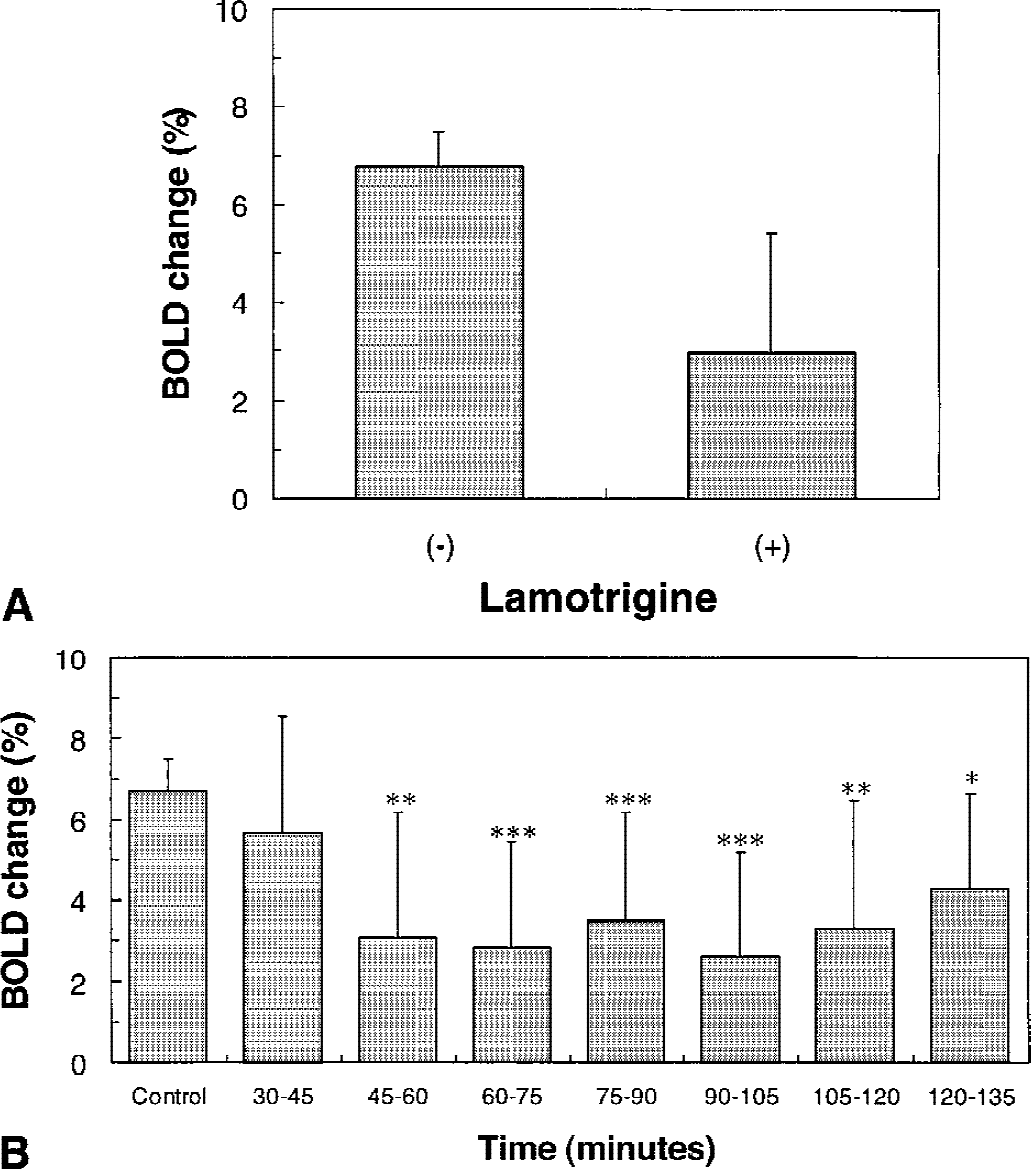
Lamotrigine treatment led to a significant reduction in the number and intensity of pixels in the activated area (Fig. 1). To assess the effects of lamotrigine on the BOLD signal change during forepaw stimulation from a consistently sampled area, 4 image slices, representing a total slice thickness of 2 mm, around bregma were evaluated by averaging pixels that represented significant changes in the t-maps of images before lamotrigine treatment. Time courses were determined for ΔS/S as a function of posttreatment time (Fig. 2). Before lamotrigine treatment, ΔS/S remained elevated throughout the stimulation period in all animals tested. Lamotrigine treatment led to the complete or partial attenuation of the BOLD signal enhancement observed during forepaw stimulation. The enhancement of ΔS/S decreased significantly from 6.7% ± 0.7% before lamotrigine to 3.0% ± 2.5% (n = 6, P = 0.0023) after lamotrigine in the period between 60 and 105 minutes after treatment. The time course of the effects of lamotrigine on the change in ΔS/S during forepaw stimulation is plotted in Fig. 3. The value of ΔS/S decreased significantly (P < 0.01) between 60 and 105 minutes after lamotrigine treatment.
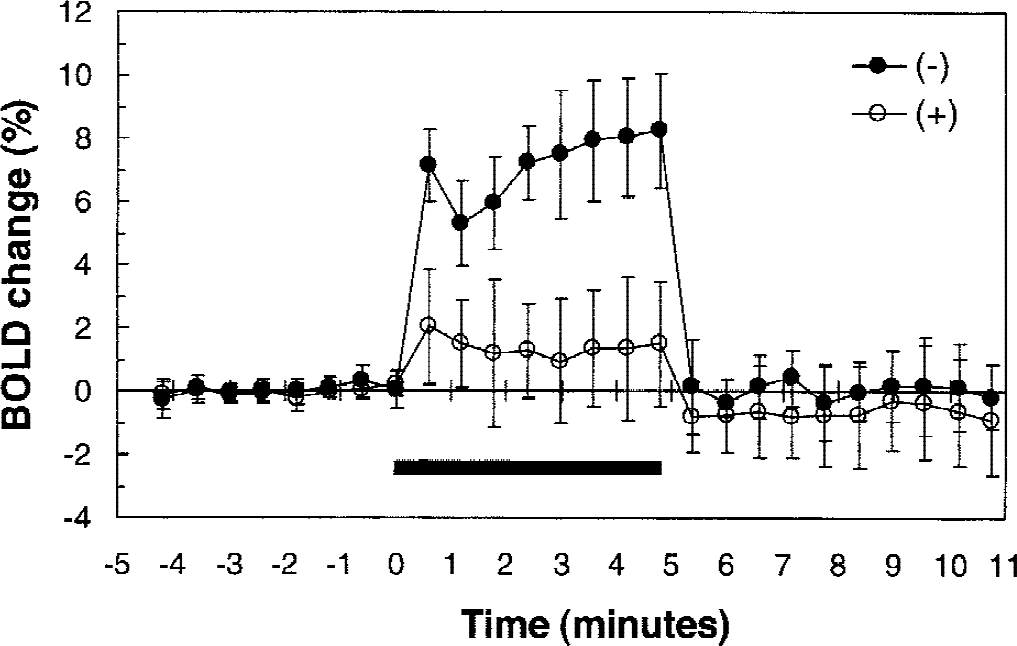
Effects of lamotrigine treatment on the time course of the BOLD signal change in somatosensory cortex during rat forepaw stimulation. Values of ΔS/S were averaged pixels representing significant changes in the t-map of images before lamotrigine treatment in four image slices around bregma. Closed circles show values of ΔS/S before administration of lamotrigine and open circles show it after lamotrigine treatment. Black bar represents the stimulation period. Values represent mean ± SD of six animals.
In the somatosensory cortex, the effects of lamotrigine on baseline and stimulated CBF were assessed. Lamotrigine treatment had no measurable affect on the baseline CBF in the somatosensory cortex; however, the CBF response during forepaw stimulation was significantly diminished (90%) between 60 and 105 minutes after lamotrigine treatment (Fig. 4; n = 6, P = 0.0008).
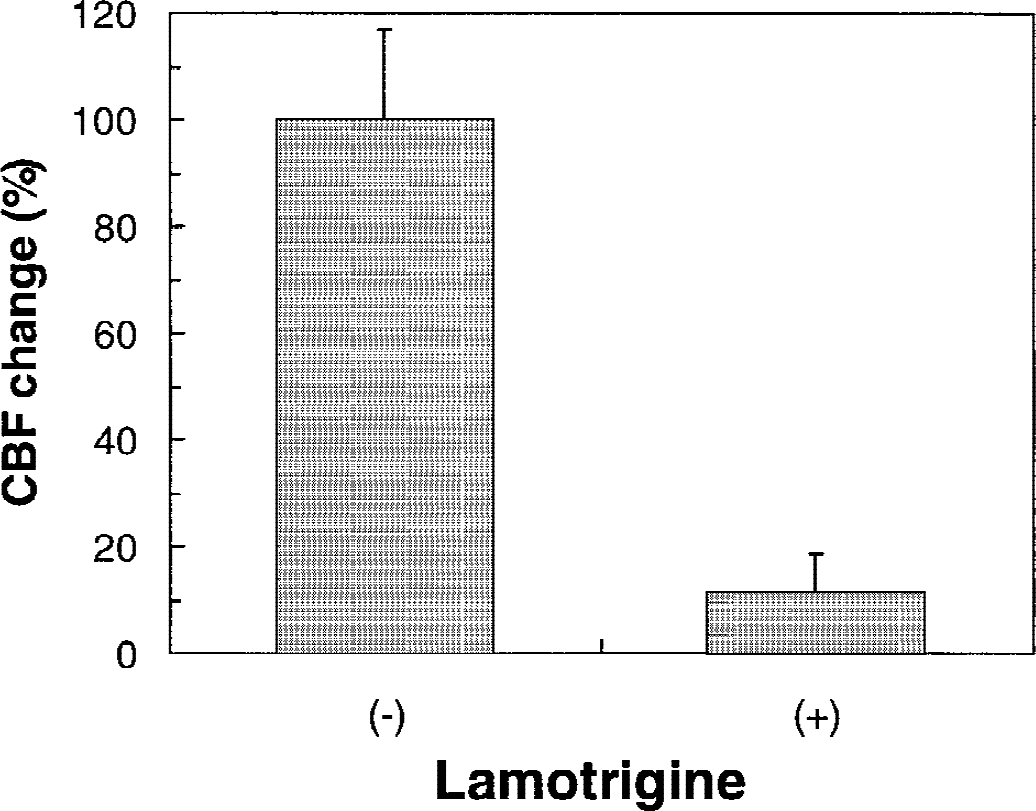
Effect of lamotrigine on cerebral blood flow (CBF) change in somatosensory cortex during rat forepaw stimulation. CBF changes are normalized to the response observed before lamotrigine treatment (−). Values of CBF change after lamotrigine treatment (+) represent the mean ± SD of 6 animals between 60 and 105 minutes. Significance of differences is defined relative to the pretreatment values (P = 0.0008).
DISCUSSION
Lamotrigine reduced the positive BOLD fMRI signal and local CBF during forepaw stimulation in a manner consistent with decreased neuronal activation and the known action of lamotrigine to block neuronal voltage-dependent Na+ channels in a use-dependent manner (Leach et al., 1986; Lizasoain et al., 1995). The positive BOLD fMRI signal during forepaw stimulation is dependent on the difference in vascular concentration of paramagnetic deoxyhemoglobin before and during stimulation (Ogawa et al., 1993), which itself is determined predominantly by changes in CBF and CMRO2 (Kida et al., 2000). Under normal physiologic conditions, CBF and CMRO2 are tightly linked (Siesjö, 1978), which indicates that local neuronal activity is coupled to microvascular blood flow and metabolism. A linear relationship is observed between CBF and CMRO2 over a substantial range of neuronal activity (Hyder et al., 1998, 2000). In vitro studies in brain slices showed that lamotrigine greatly diminished the evoked potential (Cheung et al., 1992; Siniscalchi et al., 1998). Therefore, it is reasonable to assume that the lamotrigine-induced attenuation of the BOLD signal reflects the reduced neuronal electrical activity. The results of recent studies have shown that the amplitude of the somatosensory evoked potential (SEP), a measure of average neuronal activity, is correlated with the BOLD fMRI response in rat cortex (Brinker et al., 1999; Ogawa et al., 2000). However, SEP and BOLD signals have different spatial origins, and the time scales of SEP and BOLD responses are different by several orders of magnitude.
In the current study, the lamotrigine-induced attenuation of the BOLD fMRI signal is most likely due to suppression of the CBF response. However, lamotrigine-induced attenuation of the CMRO2 response may also be a factor for the decrease in the BOLD fMRI signal, although CMRO2 was not measured independently in the current study. An alternative possibility is that the decrease in CBF was completely compensated by an increase in CMRO2, such that the respective negative and positive BOLD fMRI signals cancel each other. However, this is highly unlikely, considering the known effects of lamotrigine in decreasing neuronal excitability and the tight coupling shown between CBF and CMRO2 under physiologic conditions.
Lamotrigine inhibits voltage-dependent Na+ channels by stabilizing the inactivated state of the channel after depolarization (Kuo and Lu, 1997). Lamotrigine inhibits veratridine (but not K+-induced) depolarization and excitatory amino acid release in a dose-dependent manner (Leach et al., 1986; Lizasoain et al., 1995). At relatively high concentrations, however, lamotrigine has been reported to block voltage-dependent Ca2+ channels (von Wegerer et al., 1997) and reduce uptake of 5-hydroxytryptamine, noradrenalin, and dopamine in synaptosomes (Southam et al., 1998), although the significance of these effects at the doses used in vivo is currently unknown. Reduced dopamine synthesis and dopamine levels have been reported in the striatum of mice with lamotrigine (Vriend and Alexiuk, 1997).
The results of in vitro studies show that lamotrigine reduces neuronal excitability by decreasing the frequency of action potentials and release of excitatory amino acid neurotransmitters (for example, glutamate and aspartate) in response to depolarization (Cheung et al., 1992; Conroy et al., 1999; Leach et al., 1986; Smith et al., 1993). In contrast, spontaneous or basal release of excitatory amino acids is not affected (Leach et al., 1986). Thus, the reduced magnitude of somatosensory activation in lamotrigine-treated animals, as represented by the reduced BOLD and CBF responses in the current study, suggest that stimulated neuronal activity is suppressed.
Whereas reduced neuronal excitability would be expected to attenuate energy demand in neurons, reduced rates of excitatory amino acid release (primarily glutamate) and uptake into astrocytes would be expected to reduce the rate of glucose utilization in these cells as well. As reported by Pellerin and Magistretti (1994) and Sokoloff et al. (1996), the stimulation of Na+/K+ ATPase by Na+ cotransported with glutamate into astrocytes stimulates glucose utilization, and such a mechanism is consistent with the ∼1:1 stoichiometry measured in vivo between the glutamate–glutamine cycle flux and glucose oxidation (Rothman et al., 1999; Sibson et al., 1998). Cholet et al. (1999) reported that knockdown of the astroglial glutamate transporter (GLAST) substantially suppresses [14C]-2-deoxyglucose accumulation and glucose utilization in response to somatosensory stimulation in the rat. Both CBF and CMRO2 are sensitive to changes in extracellular glutamate levels (Lu et al., 1997). Cerebral blood flow correlates positively with interstitial glutamate levels when cortical activity is increased after application of picrotoxin, a GABAA receptor antagonist (Forman et al., 1998). Thus, there is significant evidence in the literature to suggest that the activation of glutamatergic neuronal pathways during somatosensory stimulation is an important component of functional glucose utilization and blood flow. However, although the current experimental results are consistent with a reduction in neuronal excitability and a coupled reduction in blood flow after Na+ channel blockade, this study did not address the role of specific neurotransmitters in this process.
Further progress to define the role of neurotransmitters, particularly glutamate and the glutamate–glutamine cycle, in the formation of the BOLD fMRI signal, in terms of specific ion channels, enzymes, transporters, and diffusible modulators (for example, nitric oxide) involved in this process, should take advantage of the large number of selective pharmacologic agents now available to modulate glutamate neurotransmitter function.
In summary, the authors tested the hypothesis that activation of voltage-dependent Na+ channels underlies fMRI BOLD signal and CBF responses during somatosensory activation. In the pretreated group, the localized BOLD and CBF responses were in agreement with previous studies of the same rat model. After lamotrigine treatment, the significant depression of the localized BOLD and CBF responses imply that voltage-dependent Na+ channels are involved in the BOLD fMRI response during somatosensory activation of the rat cortex. Further studies are required to determine the extent to which glutamate release or other neurotransmitters and modulators are involved in the generation of the neuroimaging signal.
Footnotes
Acknowledgments:
The authors thank P. Brown, S. McIntyre, and T. Nixon for their care and skill in maintaining the spectrometer, and Drs. D. L. Rothman and R. G. Shulman for helpful discussions.