
Abstract
The aim of the present study was to evaluate the use of the endogenous neuronal compound N-acetylaspartate (NAA) as a marker of neuronal damage after focal cerebral ischemia in mice. After occlusion of the middle cerebral artery (MCAO) the ischemic cortex was sampled, guided by 2,3,5-triphenyltetrazolium chloride (TTC) staining, and the NAA concentration was measured by high-pressure liquid chromatography (HPLC). Conventional histology and immunohistological methods using antibodies against neuron-specific enolase (NSE), neurofilaments (NF), synaptophysin, glial fibrillary acidic protein (GFAP), and carbodiamide-linked NAA and N-acetylaspartylglutamate (NAAG). The level of NAA rapidly declined to 50% and 20% of control levels in infarcted tissue after 6 hours and 24 hours, respectively. No further decrease was observed during the observation period of 1 week. Within the first 6 hours the number of normal-appearing neurons in the infarcted cortical tissue decreased to 70% of control, of which the majority were eosinophilic. After 24 hours almost no normal-appearing neurons were seen. The number of eosinophilic neurons decreased steadily to virtually zero after 7 days. The number of immunopositive cells in the NSE, NF, and synaptophysin staining within the infarct was progressively reduced, and after 3 to 7 days the immunoreactions were confined to discrete granulomatous structures in the center of the infarct, which otherwise was infested with macrophages. This granulomatous material also stained positive for NAA. The number of cells with positive GFAP immunoreactions progressively increased in the circumference of the infarct. They also showed increased immunoreaction against NAA and NSE. The study shows that the level of NAA 7 days after ischemia does not decline to zero but remains at 10% to 20% of control values. The fact NAA is trapped in cell debris and NAA immunoreactivity is observed in the peri-infarct areas restricts its use as a marker of neuronal density.
Keywords
In contrast to other markers of degenerative brain damage, i.e., lactate dehydrogenase, superoxide dismutase (Lampl et al., 1990; Strand and Marklund, 1992), and neuron-specific enolase (NSE)(Schaarschmidt et al., 1994; Steinberg et al. 1984), the level of N-acetylaspartate (NAA) can be readily measured noninvasively in situ with a high spatial and temporal resolution by proton magnetic resonance spectroscopy (1H-MRS). Thus in several neurodegenerative disorders a reduced level of NAA in brain has been measured (for review see Tsai and Coyle, 1995). Because NAA, in the mature brain, is considered to be confined to neurons (Nadler and Cooper, 1972; Simmons et al., 1991; Urenjak et al., 1992, Urenjak et al., 1993), a reduced NAA level ([NAA]) in brain should reflect a decrease in the neuronal density, as seen in global brain ischemia (Higuchi et al., 1997; Ebisu et al., 1994, Ebisu et al., 1996; Nakano et al., 1998). However, the relation between [NAA] decline and neuronal survival in focal brain ischemia is not fully clarified.
Studies on the temporal changes in the brain [NAA] during focal ischemia (Sager et al., 1995, Sager et al., 1999; Gyngell et al., 1995; van der Toorn et al., 1994; Dreher et al., 1998), have shown that [NAA] within the infarct only is reduced by 20% to 30% after 3 to 4 hours of ischemia. This finding would suggest that approximately 70% to 80% of the neurons have survived this duration of ischemia, which is unlikely. Hence, tissue [NAA] yields an underestimation of the extent of neuronal damage. This is most likely because of hindered interstitial removal of released NAA combined with NAA accumulation within dead or dying neurons (Gyngell et al., 1995; Sager et al., 1999) and we envisage that it is important to consider the rate at which the cells die (i.e., progression of damage) and the extent of damage (volume) when using NAA as a neuronal marker. Experimental investigations on the NAA level and histology in focal brain ischemia have focused on the changes within the initial 24 hours. In this study we investigated the temporal changes in the [NAA] up to 7 days after middle cerebral artery occlusion (MCAO) in mice combined with conventional histology analysis as well as immunohistochemical staining against NAA and other neuron and glia markers.
MATERIALS AND METHODS
Animal surgery
Male mice (NMRI strain, 25 to 30 g) were anesthetized with Avertin (tribromoethanol dissolved in amylene hydrate), 400 mg/kg, in a volume of 10 mL/kg intraperitoneally and the skin was disinfected with 96% alcohol. A 1-cm incision of the skin was made on the left side between the ear and the orbit. The underlying temporalis muscle was loosened and displaced downward. The middle cerebral artery (MCA) was visible through the pellucid skull. A craniotomy was made by dental drill to expose the MCA. The MCA was severed at the point where it crosses the upper level of the zygomatic arch by bipolar electrocoagulation with forceps. This procedure produces infarct in the frontoparietal cortex and the lateral portion of the striatum. In sham-operated rats the forceps were only placed around the artery without electrocoagulation. Subsequently the muscle was repositioned and the skin incision closed by silk sutures. The mice were placed on a heated plate for approximately 1 hour until they started to move. They were then placed in cages, five animals in each, at room temperature with free access to water and food pellets. All animal handling (surgical and postoperative) followed the guidelines of the local ethics committee for animals research.
Perfusion procedure
Mice were subjected to MCAO as described above. After 6 hours, 1 day, 2 days, 4 days, and 7 days, the mice were anesthetized using Avertin, the chests were opened, and the brains were perfused with a formalin buffer (pH 7, Lillie) through the aorta after the right atrium was opened. Sham-operated mice were processed 24 hours after the operation.
Tissue sampling for N-acetylaspartate extraction
Mice subjected to MCAO were anesthetized after 6 hours, 1 day, 2 days, 4 days, and 7 days and perfused with 1 mL of a 10% 2,3,5-triphenyltetrazolium chloride (TTC) in saline through the aorta (n = 5 for all groups, except sham, where n = 3). Because TTC is enzymatically converted to a red dye (formazan) only by the mitochondrial enzymes of viable cells, the dead cells remain white. TTC can be used to distinguish ischemic areas from nonischemic areas from 4 hours (Bederson et al., 1986; Hatfield, 1991; Liszczak et al., 1984). The brains were left in situ for 3 minutes, removed, and placed on dry ice and stored at −80°C until NAA measurements. We sampled only the white cortical areas that were easily distinguishable for NAA measurements (10-20 mg) and used as a reference the corresponding brain tissue on the contralateral hemisphere of each brain. The NAA content was extracted by 0.1 mol/L perchloric acid and measured by anion-exchange high-pressure liquid chromatography (HPLC) as described by Sager et al. (1995).
Immunohistochemistry and histology
Animals for histological and immunohistochemical examination (n = 3 for all groups), except the procedure for NAA immunostaining, were perfused with a formalin buffer solution (pH 7, Lillie). The brains were subsequently placed in the same formalin solution until further processing. The tissue was dehydrated through ethanol and xylene and embedded in paraffin at 56°C. Four-micrometer-thick coronal sections were stained with hematoxylin-eosin (HE) and processed immunohistochemically for neuron-specific enolase (NSE), glial fibrillary acidic protein (GFAP), neurofilaments (NF), synaptophysin, serum proteins, and endogenous peroxidase (endogen control) by peroxidase-antiperoxidase (PAP) or avidin-biotin complex (ABC) techniques. The immunohistochemically stained tissue sections were examined by light microscopy.
Hematoxylin-eosin staining. For HE staining (the Carazzi method), 4-μm-thick coronal sections were deparaffinated and stained for 15 min in 0.1% hematoxylin solution. After 10 minutes of washing in distilled water, the sections were stained for 5 minutes in a 1% eosin solution, washed and mounted, and subsequently examined by light microscopy.
Immunohistochemistry. The immunohistochemical procedure using polyclonal antibodies against serum proteins and GFAP was as follows. 1) Four-micrometer-thick sections were deparaffinated through xylene and ethanol. 2) Ten-minute incubation in 1.25% H2O2 in absolute ethanol. 3) One hour's incubation in 3% normal goat serum in 0.5-mol/L Tris buffer (pH 7.6). 4) Overnight incubation at 4°C in Tris buffer with 1% normal goat serum containing the primary antibody; rabbit anti-rat serum diluted 1:1600 (DAKO Z178), rabbit anti-human synaptophysin (DAKO-A010) diluted 1:50, or rabbit anti-cow GFAP (DAKO-Z0334) diluted 1:1600. 5) Wash with 0.1% Triton X-100 in Tris buffer twice for 5 minutes. 6) Thirty-minute incubation at 21°C in swine anti-rabbit IgG (DAKO Z113) diluted 1:50 in Tris buffer. 7) Wash with 0.1% Triton X-100 in Tris buffer twice for 5 minutes. 8) Incubation for 30 minutes in PAP-rabbit complex (DAKO-Z0113) diluted 1:80 in Tris buffer. 9) To visualize peroxidase reaction the sections were immersed in a 3-amino-9-ethylcarbazole (AEC) chromogen solution for 10 minutes: 10 mL 0.08% AEC, 50 mL acetic acid buffer (0.2 mol/L, pH. 5), 0.1 mL 35% H2O2, and 150 mL distilled water. The specificity of the immunocytochemical staining was controlled by substituting, in step 3, the primary antibody with an irrelevant antibody. In another control procedure, normal rabbit serum was used in step 3.
The procedure with monoclonal antibodies (NF and NSE) was as follows. 1) Four-micrometer-thick sections were deparaffinated through xylene, ethanol, and distilled water. 2) 0.1% protease was added to all sections for 10 minutes, which was followed by washing in distilled water. 3) Incubation for 10 minutes in 1.25% H2O2 in 99% ethanol, and then washing in distilled water. 4) Incubation with 0.1% bovine-albumin in Tris buffer for 10 minutes. 5) Overnight incubation at 5°C with primary antibody, mouse anti-human NF (DAKO NF, M762) diluted 1:400 in Tris buffer, or mouse anti-human NSE (DAKO-NSE, M873) diluted 1:100 in Tris buffer. 6) Wash with 0.1% Triton X-100 in Tris buffer twice for 5 minutes. 7) Incubation biotinylated secondary antibody (rabbit anti-mouse immunoglobulin (DAKO E354) diluted 1:400 in Tris buffer) for 30 minutes. 8) Wash twice for 5 minutes in 0.1% Triton X-100 in Tris buffer. 9) ABComplex-HRP (DAKO K355) solution was prepared by adding 1 drop of reagent A (containing Avidin) and B (containing biotinylated horseradish peroxidase) to 5 mL Tris buffer 30 minutes before use. The sections were incubated with ABComplex-HRP for 30 minutes and subsequently washed for 5 minutes in Tris buffer containing 0.1% Triton X-100 and washed in distilled water four times for 2 minutes. 10) The peroxidase reaction was visualized by use of AEC chromogens as for polyclonal antibodies, followed by 5 minutes of washing in water. 11) Finally the section were stained with Mayers hematoxylin (1 min), washed for 10 min, and mounted by use of glycergel.
N-Acetylaspartate immunohistochemistry. The immunohistochemical procedures for NAA staining have been developed and thoroughly described by (Moffett et al. 1991, Moffett et al. 1993 and Moffett et al. 1995). A perfusion solution consisting of 6% carbodiimidehydrochloride (EDAC, Sigma, St. Louis, MO), 6% dimethylsulfoxide, 1 mmol/L N-hydroxysuccinimide, dissolved in distilled H2O was filtered through a 0.8-μm millipore filter (Moffett et al. 1993). Mice subjected to MCAO were re-anesthetized after 6 hours, 1 day, 3 days, and 7 days (n = 4 in each group) and perfused with 60 mL of the perfusion solution through the aorta (15 mL/min, 37°C) by use of a perfusion pump. Sham-operated rats (n = 2) were perfusion-fixed immediately after surgery. The brains were removed and placed in a buffer (4% paraformaldehyde in 100 mmol/L phosphate-buffer, pH 8) for 48 hours and then stored at 4°C in a 30% sucrose solution until further processing. Blocking of endogenous peroxidase was performed with 1.25% H2O2 in water for 15 minutes. For pre-incubation 5% swine serum and 2% bovine serum-albumin in 0.3% Triton X-100, 2% swine serum, or 0.1% bovine serum-albumin were tested. Incubation periods from 24 to 96 hours were also evaluated. The ABC was compared with the ChemMate detection system (DAKO ChemMate Detection Kit; Copenhagen, Denmark). As chromogen AEC was evaluated against diaminobenzidine with nickel enhancement (Shu et al., 1988). Finally incubation with 2% goat serum was evaluated in the Techmate system (DAKO; Copenhagen, Denmark). The final solution was the one given below.
N-Acetylaspartate immunostaining was performed on free-floating 20-μm coronal frozen sections using an ABC horse-radish peroxidase method (ABComplex-HRP). 1) The sections were pre-incubated for 30 minutes in phosphate-buffered saline (PBS) buffer (pH 7.4) with 10% pig serum, 2% bovine serum albumin, and 0.3% Triton X-100. 2) Incubation with primary NAA (Moffett et al., 1993, (Moffett et al., 1992) diluted 1:100 in PBS buffer, performed at room temperature for 3 to 4 days. 3) The sections were washed three times for 10 minutes in PBS buffer containing 0.1% Triton X-100, and incubated with swine anti-rabbit biotinylated secondary antibody (DAKO, E353) diluted 1:300 in 0.1% Triton X-100 PBS buffer. 4) The sections were washed three times for 10 minutes in PBS buffer (see step 3). ABComplex-HRP (DAKO K355) was prepared 30 minutes before use by adding 1 drop of reagent A and B to 5 mL 0.1% Triton X-100 in PBS. 5) Incubation with ABComplex-HRP for 70 minutes and subsequent washing three times for 10 minutes in PBS buffer containing 0.1% Triton X-100. 6) The peroxidase complex reaction was visualized by AEC chromogens as in experiment 1, step 7). Sections were washed in distilled water for 5 minutes and mounted with glycergel.
Determination of cell numbers
The proportion of cells was estimated in the central infarct area and in the corresponding cortex in the contralateral hemisphere. All nuclear profiles were counted in an area of 0.112 mm2 on HE-stained sections at ×400 magnification using an Aristoplan light microscope (Leitz, Stuttgart, Germany) equipped with an eyepiece grid. The cells were classified as normal neurons, eosinophilic neurons, and other cells (i.e., glial cells, endothelial cells, macrophages, and polymorphonuclear granulocytes). The cells were counted in sham-operated rats and at 6 hours, 1 day, 2 days, 3 days, and 7 days after MCAO.
Correlation between 2,3,5-triphenyltetrazolium chloride and hematoxylin-eosin staining
In a separate study we examined the correlation between infarct sizes evaluated from TTC-stained tissue and from HE staining. Eight mice were subjected to MCAO and after 24 hours perfused with TTC (as described above). The brains were perfusion fixed in situ and cut coronally in 1-mm sections. The slices were captured using a color camera combined with a Macintosh computer (Apple, Cupertino, CA, U.S.A.). The areas of the infarcts were measured using the NIH Image software package (freeware) and the infarct volumes were calculated according to the Cavalieri principle (Gundersen et al., 1988). After measuring the infarct sizes from the TTC staining, the slices were HE stained, and the volumes of the infarcts were determined again.
Statistics
All numerical data are presented as means ± SD. We calculated the NAA content in the ipsilateral hemisphere as a percentage of the content in contralateral hemisphere (([NAA] contralateral − [NAA] ipsilateral)/[NAA] contralateral). To compare the relative metabolite changes during ischemia we used ANOVA with Dunnett's multiple comparison post-test. The correlation between the relative sizes of HE- and TTC-stained brain regions was performed by linear regression analysis, with the Pearson correlation test. Changes in cell counts were performed by un-paired Wilcoxon test with Dunnett's multiple comparison post-test.
RESULTS
Tissue sampling
The infarct areas determined either from TTC- or HE-stained brain slices were positively and linearly correlated with the size determined by HE (r2 = 0.930, P < .001). Although the TTC method produces a minor underestimation of infarct size (for infarcts < 10%-15% of hemispheric area as determined by HE), the findings show that TTC staining is a reliable method for distinguishing between ischemic and nonischemic tissue.
N-Acetylaspartate concentration in focal ischemic tissue
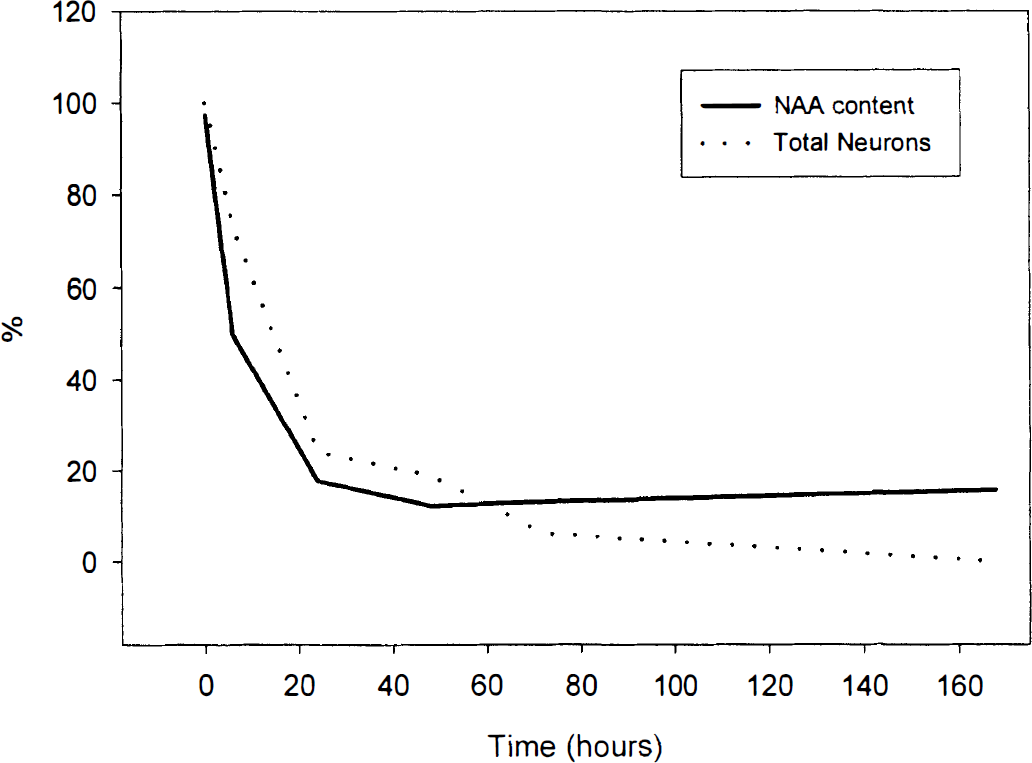
Figure 1 demonstrates that after MCAO there is a reduction of NAA levels ([NAA]) in ischemic tissue compared with sham-operated mice. After 6 hours of ischemia the level was reduced by 50%, and after 24 hours by 80% (P < .01). However, from 1 to 7 days after MCAO, [NAA] was between 13% and 20% of the contralateral side of the brain (P > .05 compared with the level after 1 day) and was never reduced to zero.
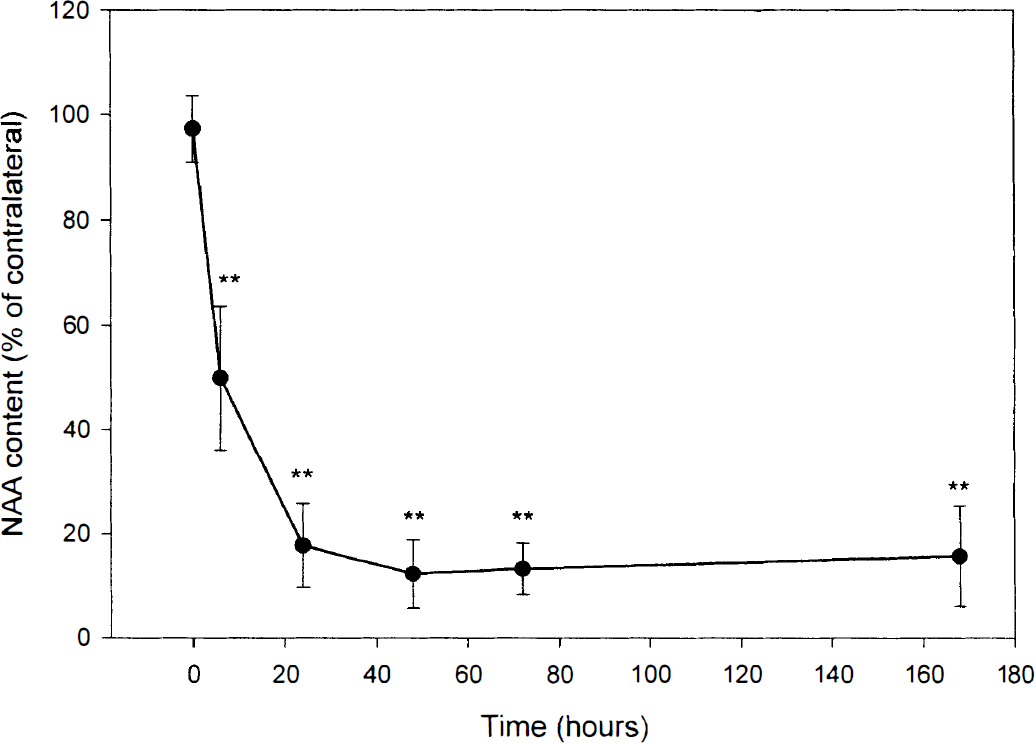
Time course of N-acetylaspartate (NAA) changes in focal ischemic tissue (n = 5 for all groups, except sham, where n = 3). Values are expressed in mean ± SD. Significant reduction compared with sham-operated mice (t = 0) was obtained after 6 hours and maintained throughout the time course (**P < 0.01, t = 0). From 1 to 7 days the [NAA] stabilized between 13% and 20% of the level in the contralateral side of the brain (P > 0.05 compared with the level after 1 day).
General histology and cell count
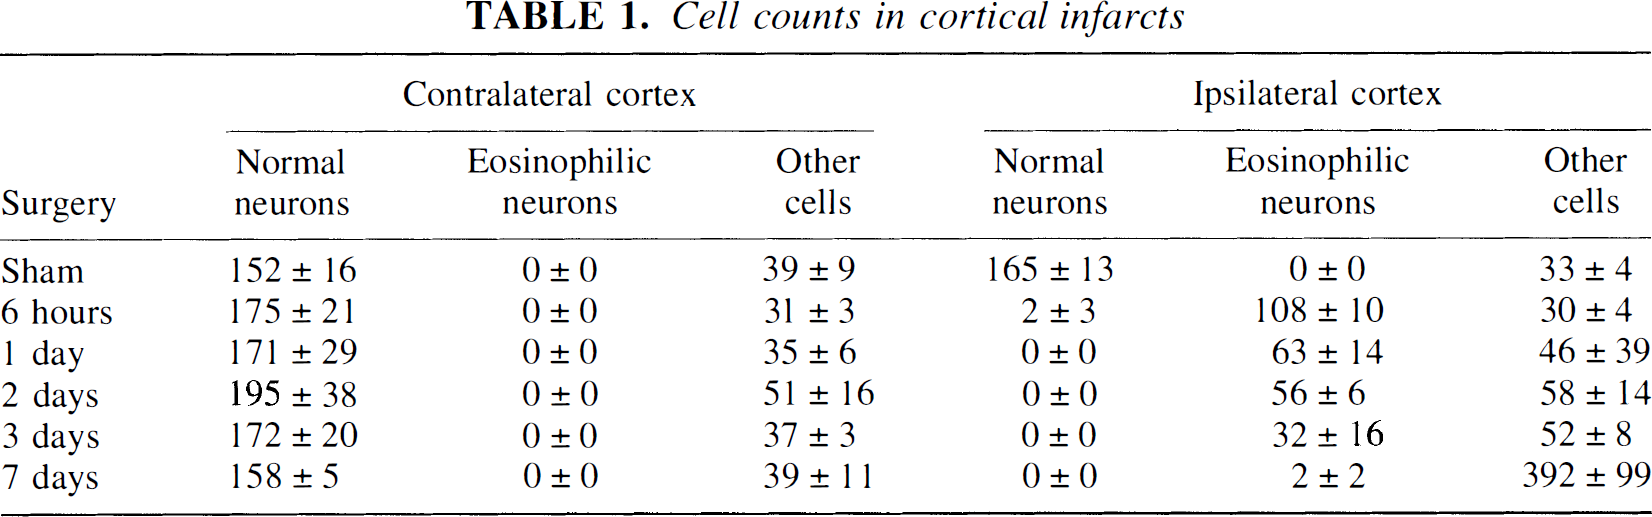
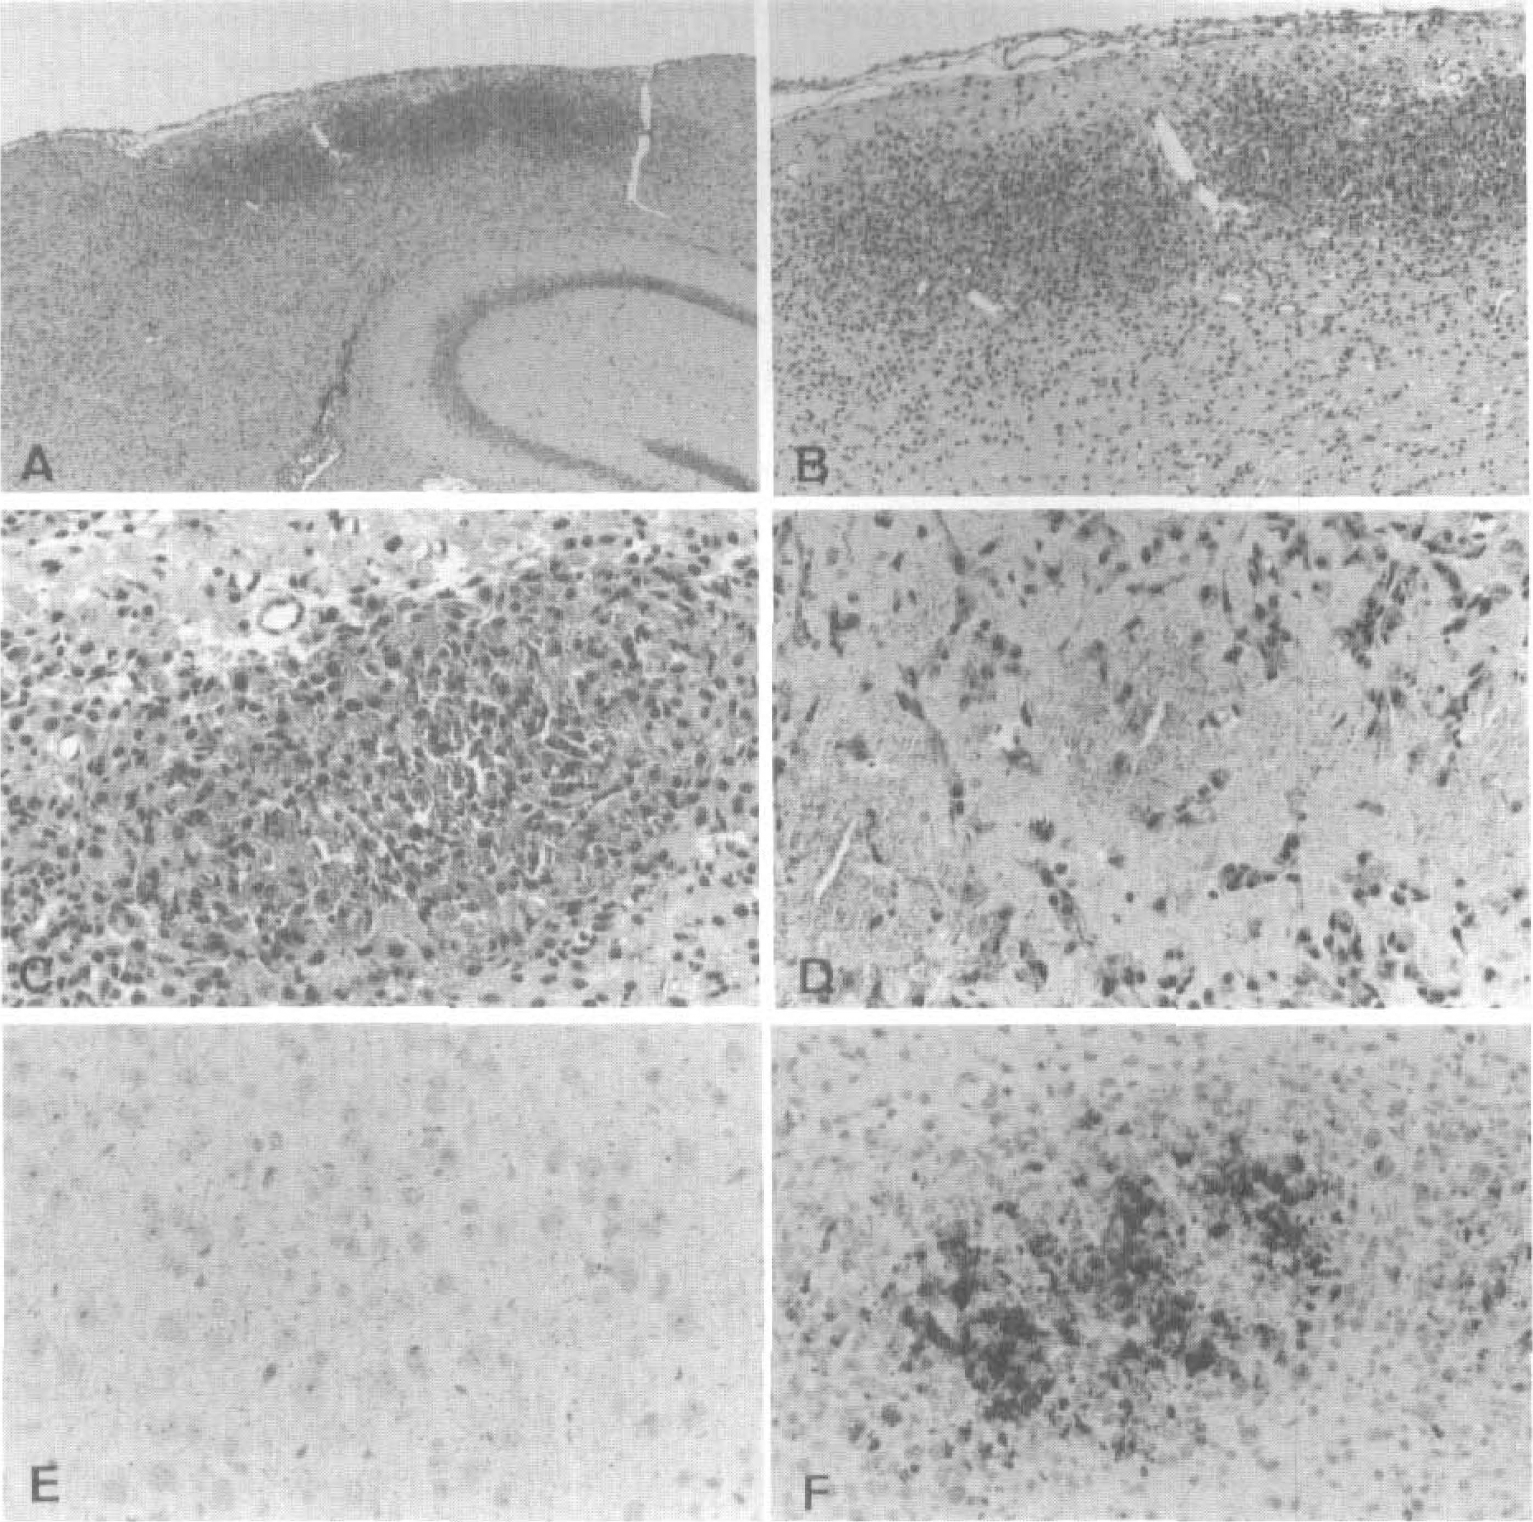
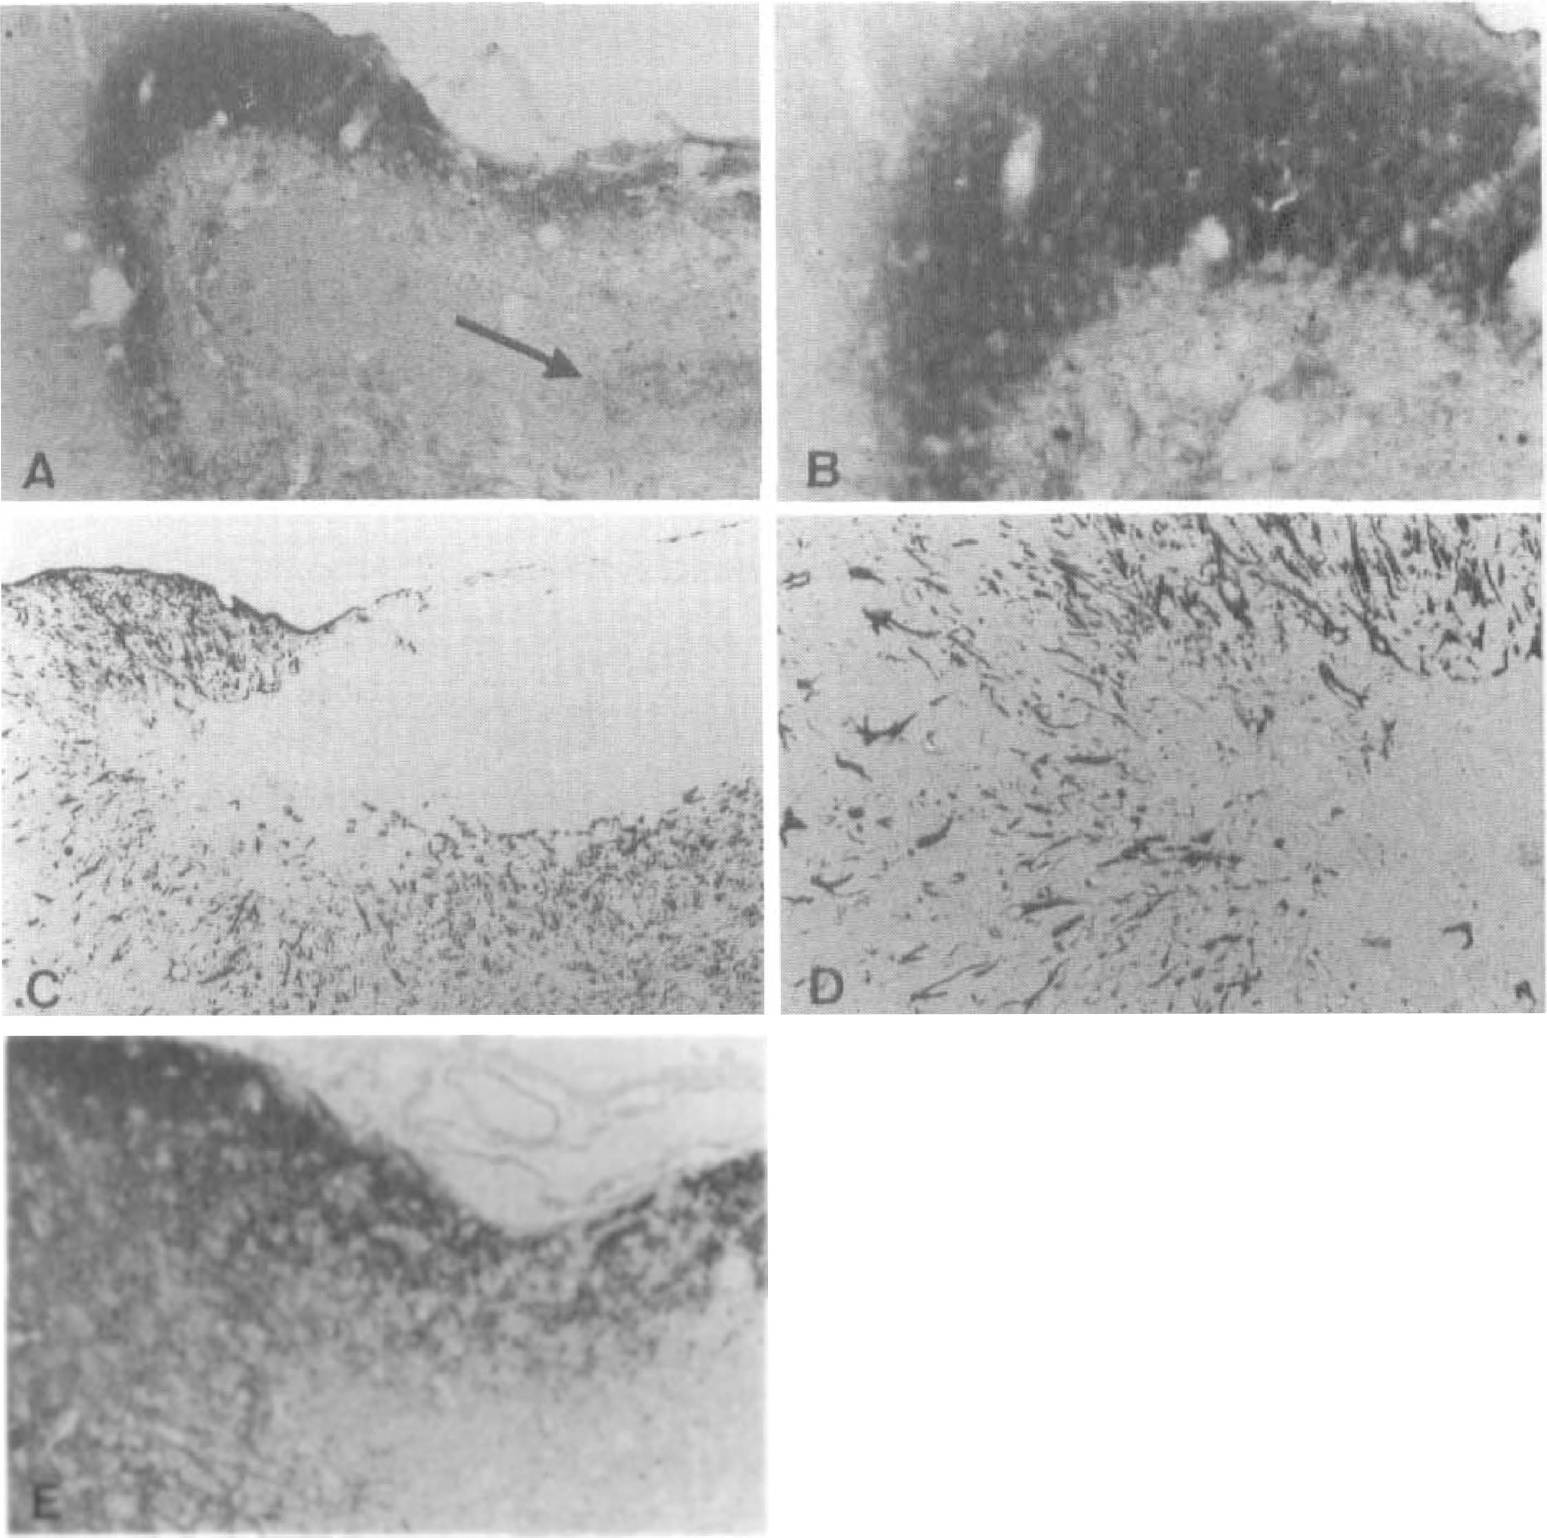
In the sham-operated animals the cortical cellular pattern was normal on both sides, displaying no eosinophilic cells or infarcts. Six hours after occlusion the infarct was apparently involving all layers in the parietal cortex. The overall cellular pattern was preserved and the infarct displayed spongiform changes in the neuropil. The neurons showed distorted outlines, cytoplasmic vacuolization, and often homogenized dark triangular nuclei. Compared with the control side, the neuronal numbers were unchanged (Table 1). After 24 hours the overall cellular pattern was beginning to disrupt. Most neurons showed eosinophilic cytoplasm and dark homogenized nuclei or in some cases karyorrhexis. Abundant infiltration of polymorphonuclear granulocytes was observed in one of three animals. After 2 days the neuronal density decreased further (Table 1). The neurons had either eosinophilic cytoplasm or the cytoplasm had disappeared, revealing a naked dark homogeneous nucleus. These nuclear remnants were not positively identified as neuronal, but their location was suggestive thereof. After 3 days only very few neurons were present and almost no cells with eosinophilic cytoplasm could be detected. A number of round dark nuclei were, as at 2 days, suspected of being neuronal, but also, macrophages were beginning to enter the tissue. After 7 days the surface of the cortex dimpled because of loss of tissue (Figs. 2A and 2B). The remaining cortex was completely packed, particularly in the center of the infarct, with macrophages and a granular material (Figs. 2C and 2D).
Cell counts in cortical infarcts
Immunohistochemistry for neuron-specific enolase, neurofilaments, glial fibrillary acidic protein, and synaptophysin
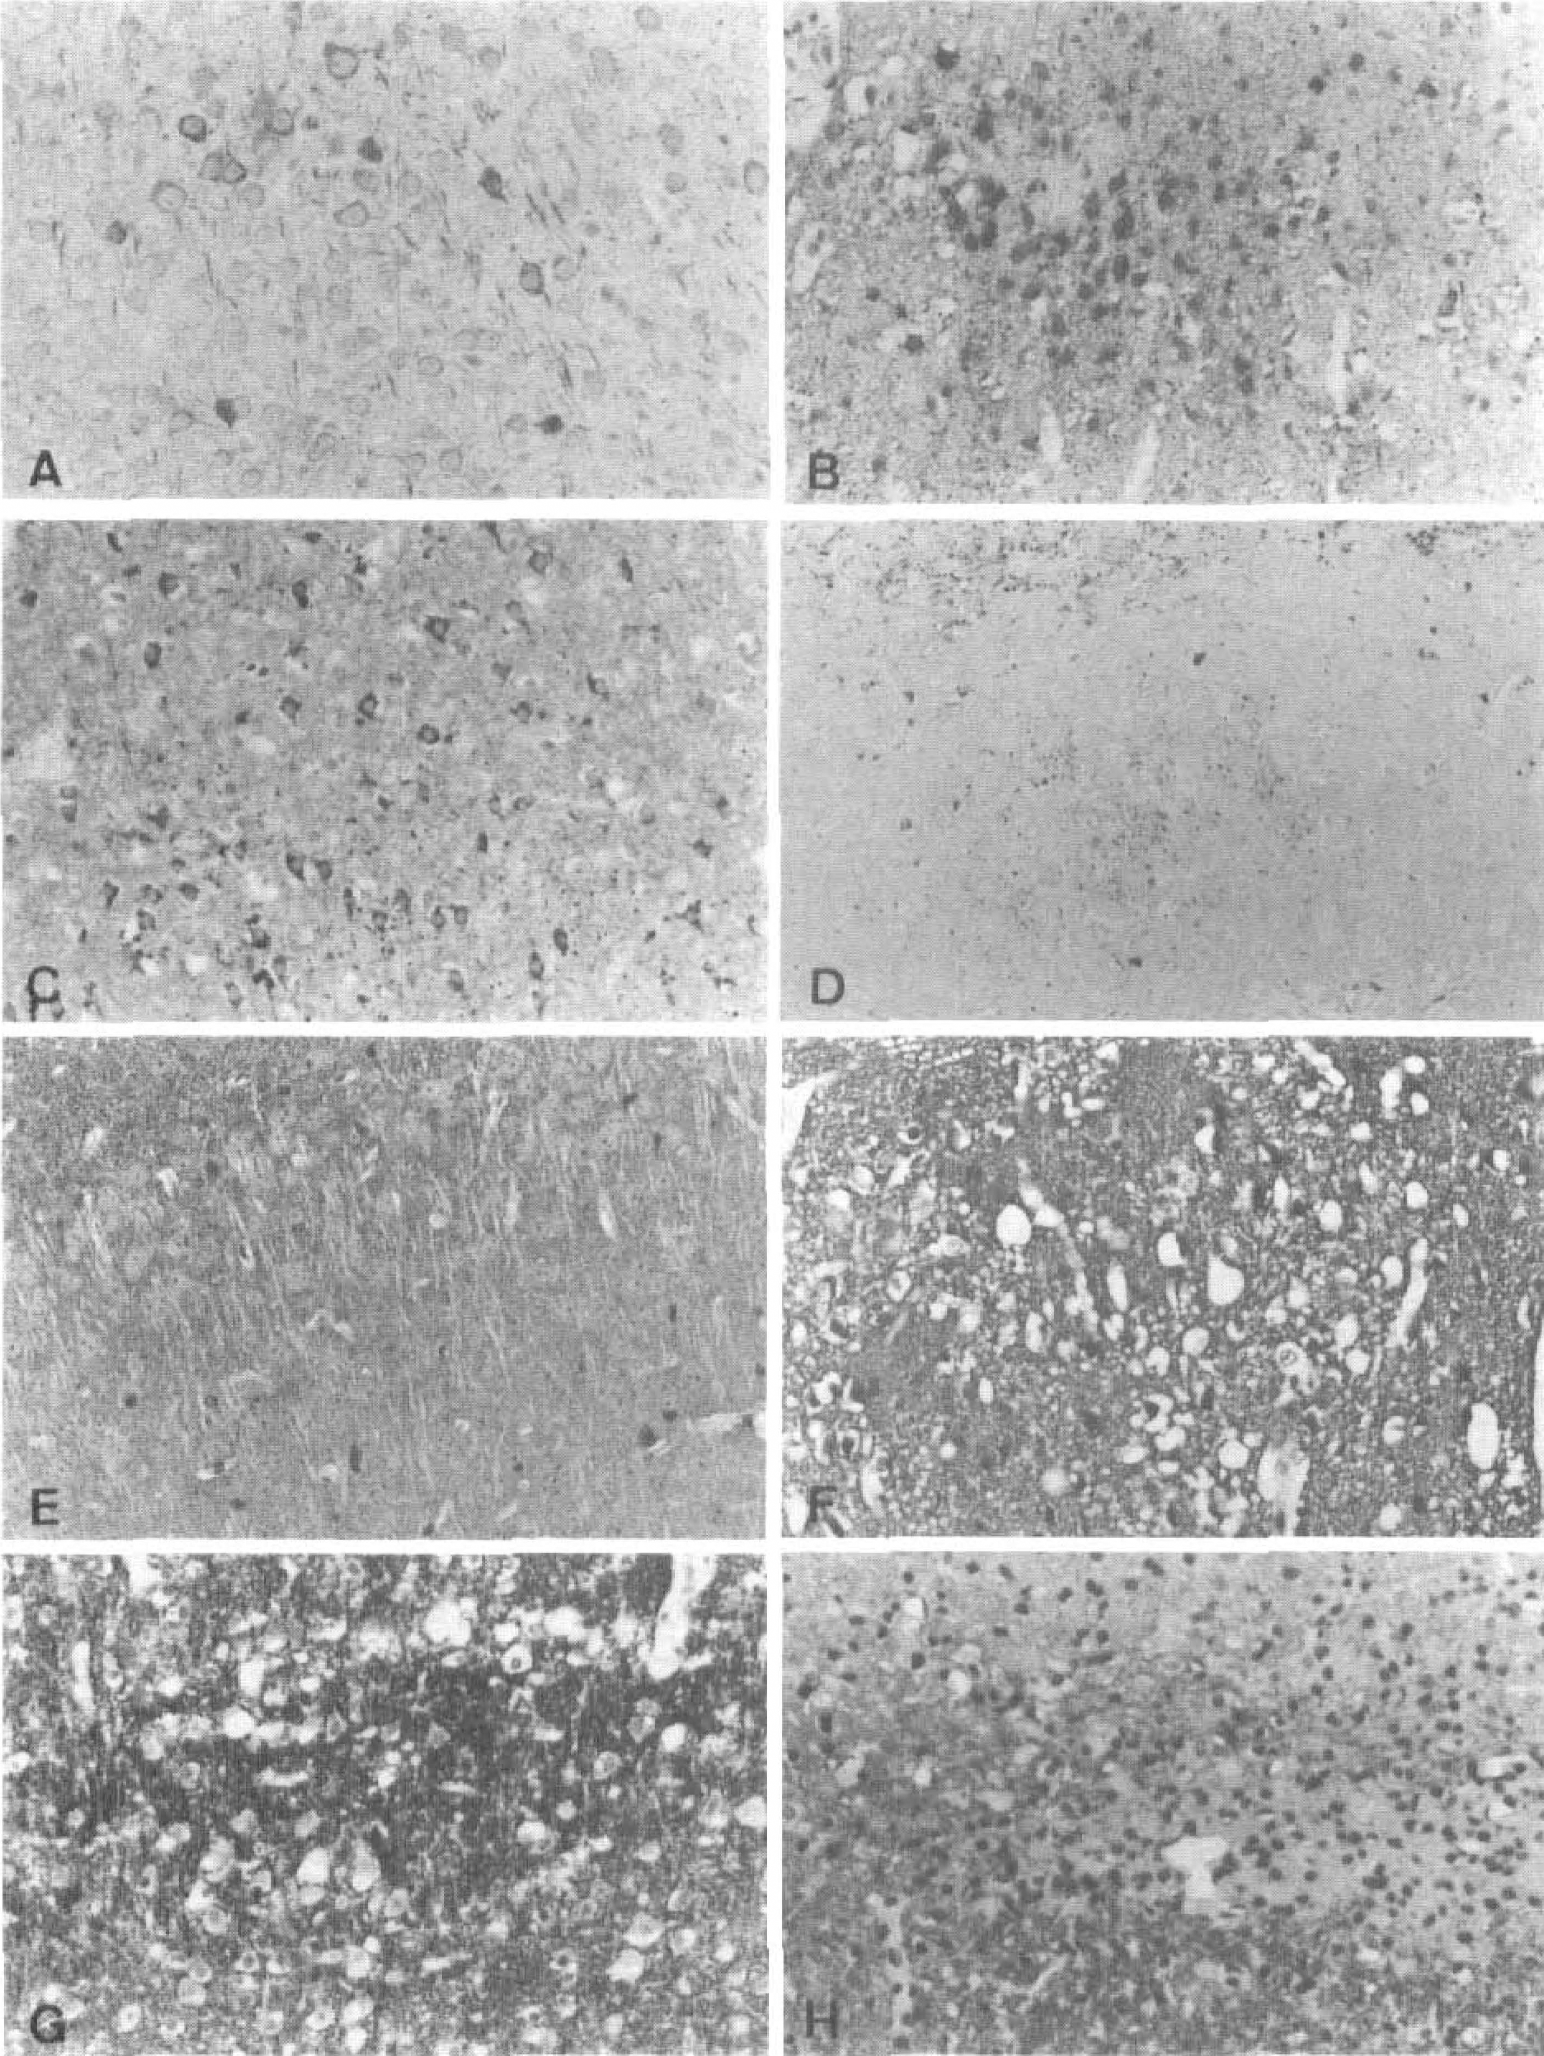
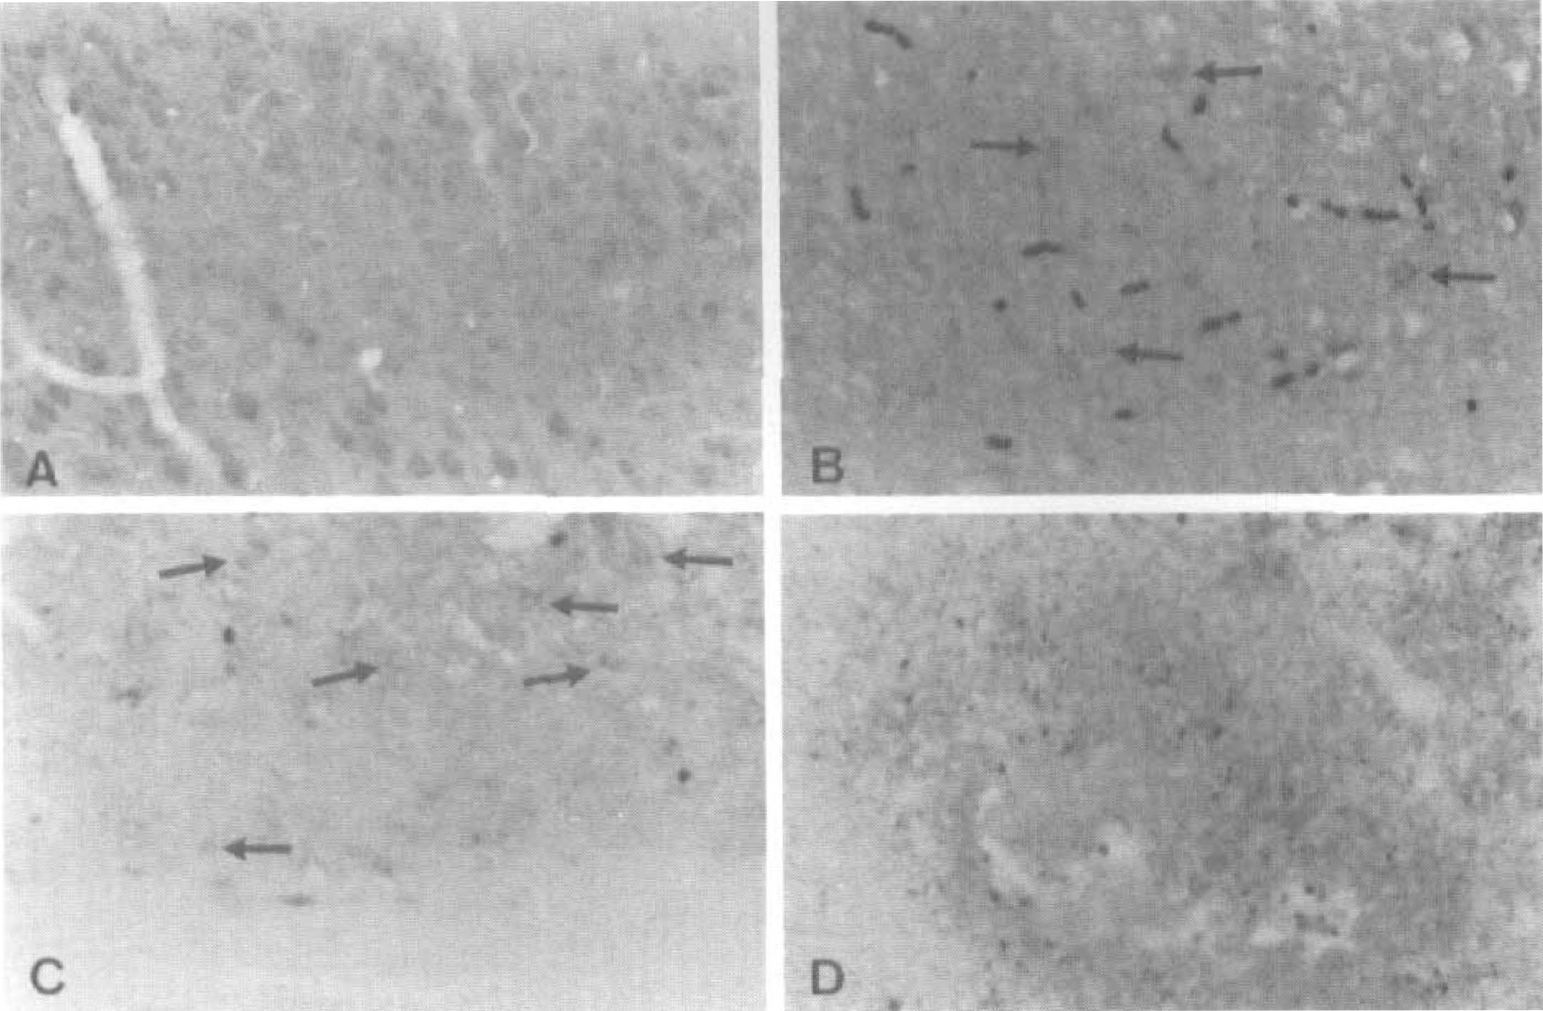
In the sham-operated animals and in the control side of MCAO mice, at any time after surgery, the NF staining showed only sparse reaction in a few axons (Fig. 2e) and NSE stained the perikaryon of neurons (Fig. 3A). The neuropil showed positive reaction for both NSE and synaptophysin (Figs. 3A and 3E). In the GFAP stain, very few slender astrocytic processes could be demonstrated in the grey matter. In the white matter more distinct fibrillary astrocytes were present. Six hours after surgery the neurons and the neuropil still reacted to NSE, synaptophysin, and NF staining (Figs. 3B and 3F). Also the astrocytic GFAP stain was relatively unchanged. After 24 hours the remnants of cells in the superficial cortical layers showed positive reaction in the NSE stain (Fig. 3C). There was a strong staining at the spongiform border at the sides and at the bottom of the infarcts. In the center of the lesion there was a homogeneous staining of the neuropil for both NSE and synaptophysin. The overall pictures for NF and GFAP staining were similar to those after 6 hours. After 2 days only few cells showed cytoplasmic NSE staining, but in the neuropil there was an increasing granularity and reaction to NSE and synaptophysin compared with the normal neuropil. In contrast very little reaction for NF was seen and there was no reaction for GFAP in the lesion. At the border of the lesion reactive astrocytosis evolved as revealed by the GFAP staining. After 3 days the staining for NSE showed very few positive cells. In the GFAP stain an increasing astrocytosis was seen spreading further into the ipsilateral hemisphere from the border of the lesion. Still, GFAP was not seen in the necrotic tissue.
In one of the animals there was a small hemorrhage. In the NF stain a peculiar granular accumulation of immunopositive material was now seen in the neuropil in the same pattern as seen for NSE and synaptophysin in the infarct.
After 7 days the stains for NF, synaptophysin, and NSE still showed strong reactions between the numerous macrophages (Fig. 2F, 3D, and 3H). The GFAP staining was, as before, confined to the borders and underneath the infarct (Figs. 5C and 5D).
N-Acetylaspartate immunoreactivity
The staining for NAA was evaluated in sham-operated rats and at 6 hours, 1 day, 3 days, and 7 days after occlusion. The staining proved difficult on the free-floating sections, but in the sham-operated rats and on the contralateral side the NAA immunoreactivity was confined to neurons as described by (Moffet et al. 1991, Moffet et al. 1993). All through the cortex, the cytoplasm of the neurons showed positive immunoreaction, whereas the neuronal nuclei were negative. Reaction product was not seen in other cells such as glial cells and endothelium. Little NAA immunoreactivity was seen after 6 hours of occlusion (Fig. 4B), but the reaction product was confined to preserved neurons. After 1 day some reaction could be seen at the border of the lesion, in few neurons in the central lesion (Fig. 4C), and also in the neuropil. After 3 days very few immunopositive neurons were seen in the center of the lesion, but the neuropil was still stained and so were the neurons at the border zone. After 7 days when the infarct was almost entirely populated by macrophages, most of the sections dissolved during incubation, but in one case it was possible to stain the central area of the infarct. In this section a granular reaction was seen between the accumulated macrophages (Figs. 4D and 5A). This pattern is in concordance with the staining pattern seen in the NSE, synaptophysin, and NF staining (Figs. 2F, 3D, and 3H). The most striking change in NAA immunoreactivity was the massive increase in reaction in the peri-infarct area (Figs. 5A and 5B). The region with increased NAA staining also showed increased reactive astrocytosis (Figs. 5C and 5D) as well as increased staining against NSE (Fig. 5E).
Staining in central area for N-acetylaspartate (NAA).
Border zone of infarction, 7 days after MCA occlusion.
DISCUSSION
We have studied the temporal histological evolution of neuronal damage in focal ischemic brain tissue, and the corresponding changes in [NAA]. Our results show that ischemic brain [NAA] decreased progressively within the first 24 hours but thereafter remained stable at a level of 15% to 20%. The low level of NAA is partially due to trapped NAA in neuronal debris, as shown by immunohistochemistry.
Tissue sampling
We employed the mouse distal MCAO model, which produces distinct transition between normal and infarct tissue, and the TTC staining procedure to delineate the extent of infarction. Like Park et al. (1988) and Hatfield et al. (1991), we showed that there is good correlation between the histopathology and TTC-determined infarct delineation. Liszczak et al. (1984) suggest that TTC in chronic infarcts can be converted to the red dye formazan by macrophages and other inflammatory cells. Although our histologic data showed that these cells were preferentially present within the infarct core, there was no discoloration of the white area. Great care was taken to sample only tissue without any red TTC staining. Thus contamination of nonischemic periinfarct tissue is minimal.
Loss of N-acetylaspartate from brain tissue
N-Acetylaspartate is a stable molecule that requires the activity of amidohydrolase II to be degraded in the brain (Sager et al. 1995). During normal conditions NAA is released after synthesis in the neuronal mitochondria (by unknown mechanisms) to the interstitial space and subsequently taken up by glia to be degraded by the enzyme amidohydrolase II (Sager et al., 1999). This process brings NAA in close vicinity to amidohydrolase II by these transport mechanisms. During control conditions the turnover of NAA is less than 1% per hour (Tyson and Sutherland, 1998; Sager et al., 1999), but initially in focal ischemia the rate of degradation is about 10% per hour (Sager et al., 1997). In concordance with previous observations on striatal [NAA] during global/focal ischemia using 1H-MRS (van der Toorn et al., 1994; Gyngell et al., 1995; Dreher et al., 1998; Sager et al., 1999), and HPLC (Sager et al., 1995, Sager et al., 1999), we observed a decline in cortical [NAA] shortly after induction of ischemia (van der Toorn et al., 1994; Sager et al., 1995, Sager et al., 1999; Higuchi et al., 1996; Nonaka et al., 1998). From 1 day after occlusion to the end of experiment at 7 days, the NAA level was surprisingly stable at 20% of the normal level (≈1.3 mmol/L). This observation is somewhat supported by Higuchi et al. (1996), who showed only a marginal decline in [NAA] in the central infarct from 1 day to 3 days after occlusion in rats.
Histologic examination of the infarct showed, in agreement with Dereski et al. (1993), that normal-appearing neurons were almost absent after 6 hours, and after 24 hours only eosinophilic (i.e., nonviable) neurons remained. These cells contained NAA, as revealed by the presence of NAA immunoreactivity (Figs. 4B and 4C). Between 1 and 3 days after occlusion the HE staining showed that 20% to 30% of the neurons could be outlined, still with an eosinophilic cytoplasma and a positive NAA staining. After 7 days neuronal cell bodies were absent from the core and NAA immunoreactivity was now present on granular material, as was the immunostaining for NSE, NF, and synaptophysin. NAAG did not show this granular accumulation (data not shown), probably because NAAG is degraded to NAA and glutamate by the extracellularly located enzyme NAALADase (Cassidy and Neale, 1993). The fact that NAA is trapped inside the neurons and later in neuronal debris is the main reason for the residual content in the infarct. It is unknown whether the trapped NAA represents a special compartment in the neurons or whether the ischemic condition promotes binding to certain cellular structures that prevents the diffusional movement of NAA. The possibility exists that the NAA present in the infarct could be produced by cells within or around the infarct. Non-neuronal cells, such as the oligodendrocytic precursor cell (O-2A) and the mast cell, contain high levels of NAA (Urenjak et al., 1992, Urenjak et al., 1993; Burlina et al., 1997). We found no mast cells in or around the infarct, but the fact that reactive astrocytes have the ability to express the fetal traits of progenitor cells, i.e., NSE, GABA, and MAP2 proteins (Lin et al., 1993; Lin and Matesic, 1994), suggests that they may also contain NAA. The GFAP immunohistochemical staining revealed a massive gliosis from day 2 to 3 along the border of the infarct but not in the infarct core. The peri-infarct gliosis had an increased NAA- and NSE-immunoreactivity and we speculate that the reactive astrocytes also have NAA and thus may constitute a source of NAA even though the O-2A precursor cells are GFAP-negative (Andersson et al., 1994).
Applicability of N-acetylaspartate as a neuronal marker
The selective death of neurons in hippocampus after global ischemia or kainate-induced lesions as well as slower progression of the damage, compared with focal brain damage, seems to favor the use of NAA as a marker of neuronal damage in this condition (Ebisu et al., 1994, Ebisu et al., 1996; Higuchi et al., 1997; Nakano et al., 1998). However, HPLC measurements of CA1 tissue extracts after global ischemia showed only a 50% decline in [NAA] after 7 days compared with a 90% decline in the neuronal density (Nakano et al., 1998).
During acute focal brain ischemia in rat and cat the rates of [NAA] decline have been measured with a high temporal resolution using 1H-MRS (van der Toorn et al., 1994; Gyngell et al., 1995; Higuchi et al., 1996; Dreher et al., 1998) and the obtained values correlate well to the [NAA] measured in brain extracts by HPLC (Sager et al., 1999). From the histological and immunohistochemical data in the present study, it is clear that NAA in the developing infarct is trapped within eosinophilic cells of the core. Although we did not use unbiased stereological procedures, our data indicate that the change in [NAA] correlates with the decline in the total number of neuronal profiles (normal and eosinophilic neurons) but not very well with the number of histologically normal-appearing neurons in the infarct (Table 1 and Fig. 6). Thus the NAA present in the eosinophilic (nonviable) neurons contributes significantly to the total NAA content within the first 24 hours, after which a small part of the NAA pool is trapped in neuronal debris. So the correlation between NAA and total neuronal count may have limited prognostic value, because all NAA after 6 hours in mice is located extracellularly or within eosinophilic (nonviable) neurons. The residual level of NAA in the chronic phase is not relevant in clinical settings because 1H-MRS cannot detect NAA at these low levels.
The use of NAA as a neuronal density marker requires that a steady state exist between number of viable neurons and the NAA level. Even when this prerequisite is obtained, the fact that NAA is trapped in neuronal debris distorts the applicability. However, from a clinical point of view the use of NAA as a neuronal marker in focal ischemia is still valuable if the pitfalls outlined here are taken into consideration. Despite the proven shortcomings of NAA as a neuronal marker, a recent study on stroke patients showed that the severe loss of NAA in the acute phase predicted the outcome (Pereira et al., 1999).
Footnotes
Acknowledgments
The authors thank Dr. John R. Moffett for donating the NAA and NAAG antibodies and for advising us with the NAA/NAAG immunohistochemistry procedures. The authors are also very thankful to Mr. Jan Lauritsen and Mrs. Nina Broholm for technical assistance.