
Abstract
Correlation of focal ischemia-induced brain damage evidenced by magnetic resonance imaging (MRI) and by staining with microtubule-associated protein 2 (MAP2) was studied in rats. Ischemia was produced by transient occlusion of the middle cerebral artery (MCAO). The damage was assessed at 6 to 8 hours after MCAO and 1 week later. The area of damage assessed by MRI agreed with that by MAP2 staining at 6 to 8 hours after MCAO, which was smaller (P < 0.001) than that defined by MAP2 staining 1 week after MCAO. Glial staining indicated that glial infiltration affected the signal intensity of MRI in the area of damage.
Keywords
Divergent views appear in comparative studies of the total size of ischemic lesion, measured either by magnetic resonance imaging (MRI) or histologic methods, in focal cerebral ischemia induced by middle cerebral artery occlusion (MCAO) in rats: some confirm a close correlation (Barone et al., 1991; Sauer et al., 1993), whereas others document an overestimation of necrotic tissue by MRI (Benveniste et al., 1991). In these studies, T2-weighted MRI and conventional histologic methods, such as cresyl violet staining, were used. An increase of signal intensity in T2-weighted MRI indicated an increase of water content within the damaged brain tissue (Kato et al., 1986; Naruse et al., 1986). The damaged tissue consisted of major cell components including neuron, astrocyte, oligodendrocyte, and microglia/macrophage, which were not uniform in water content. Conventional histologic methods do not differentiate these cell components. It is not determined how each cell component affects the signal intensity of the damaged brain tissue in MRI. Furthermore, the histologic makeup of cerebral ischemia is not stable but must be dynamic to change from a fresh necrotic tissue to a scar.
In the current study, using immunohistochemical staining, the prosperity and decline of major cell components and their correlation with the changes of signal intensity in MRI are investigated in focal cerebral ischemia in rats.
MATERIALS AND METHODS
Experimental protocol
The study was approved by the Animal Research Committee of Kyoto University, Faculty of Medicine. Experiments were performed on 16 adult male spontaneously hypertensive rats weighing 250 to 350 g and aged 14 to 18 weeks. The focal cerebral ischemia was induced using a method of intraluminal vascular occlusion (Longa et al., 1989). Briefly, a 3-0 surgical nylon suture was inserted from the right external carotid artery into the internal carotid artery until it blocked the origin of the middle cerebral artery, and it was withdrawn 2 hours later. The rats were divided into two groups: in one group (n = 8), the MRI study was performed at 6 to 8 hours after MCAO and then the rats were killed for immunohistochemical analysis; in the other group (n = 8), the same procedures were performed 1 week after the MCAO.
Magnetic resonance imaging
In each group, the brain MR images were obtained using a 2.0-T NMR spectrometer/imager (BRUKER, Fremont, CA, U.S.A.). The T1-weighted sagittal image was first obtained for positioning. Then, the coronal brain spin-echo T2-weighted images were obtained using a multislice spin-echo sequence (optimized parameters: repetition time of 2000 milliseconds; echo time of 80 milliseconds; spatial resolution in plain of about 0.14 × 0.14 mm; a slice thickness of 2 mm).
Immunohistochemistry and histochemistry
Immediately after the MRI study, after pentobarbital (80 mg/kg intraperitoneally), the rats were perfused through the ascending aorta with a fixative containing 4% paraformaldehyde, 0.2% pictate, and 0.35% glutaraldehyde in a 0.1 mol/L phosphate buffer. The brain then was removed and cut into coronal blocks, which were frozen with dry ice and cut into 20 μm thick sections using a cryostat. The immunohistochemical reactions were carried out on free-floating sections. The antibodies used in the study, at the appropriate dilutions, are listed in Table 1. Immunostaining was performed with the avidinbiotin-peroxidase complex method (Imam and Tökeés, 1981). Some untreated sections from each brain were stained directly with cresyl violet for standard histologic examination.
Antibodies used in the present study
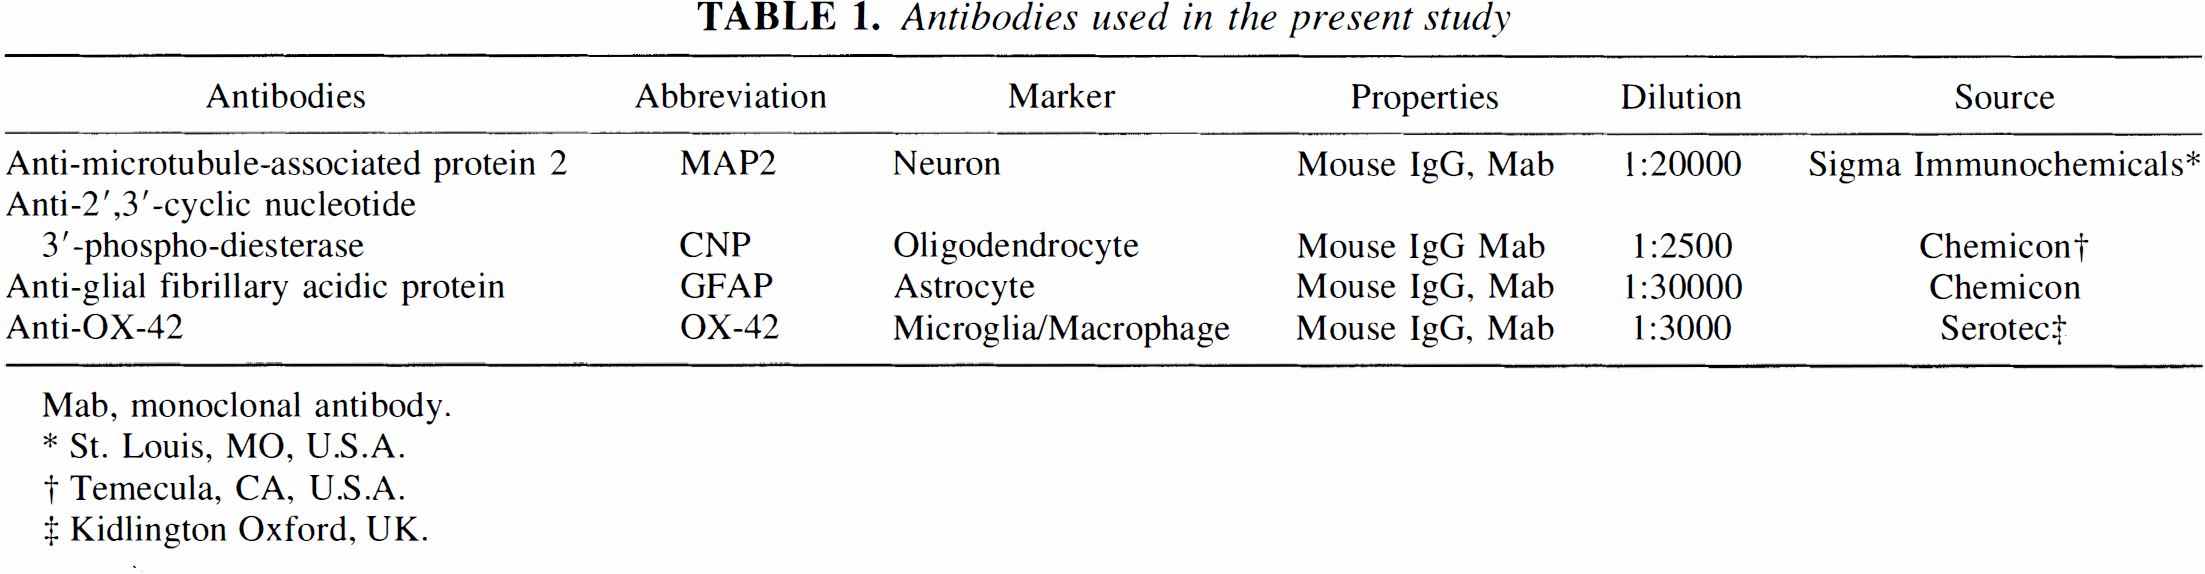
Mab, monoclonal antibody.
St. Louis, MO, U.S.A.
Temecula, CA, U.S.A.
Kidlington Oxford, UK.
Determination of lesions by magnetic resonance imaging and microtubule-associated protein 2
The MR image, which corresponded to the immunohistochemical stained sections, was selected to quantify the lesion. The lesion was determined by the 60% threshold point of the maximum signal intensity. The extent of the lesion was presented as a percentage of the total area.
The immunohistochemical sections stained with microtubule-associated protein 2 (MAP2) were used for evaluating the extent of neuronal damage. The damaged area was measured automatically using an image analyzer, and the extent of the lesion was presented as a percentage of the total area.
Data are shown as mean ± SD. Statistical comparisons of the size of ischemic lesion, measured by MRI and MAP2 staining, were made using Student's paired t test, and P < 0.05 was regarded as being statistically significant.
RESULTS
Magnetic resonance and histologic data at 6 to 8 hours after middle cerebral artery occlusion
A typical MR image and histologic sections obtained at 6 to 8 hours after MCAO are shown in Fig. 1. The focal ischemic lesion was shown as the area of uniformly increased signal intensity in the MRI. The section stained with MAP2 showed a large extent of neuronal damage in the insulted hemisphere. The sections stained with 2′,3′-cyclic nucleotide 3′-phosphodiesterase (CNP) and glial fibrillary acidic protein (GFAP) showed weak staining of oligodendrocyte and astrocyte along the margin of the neuronal damage, but the section stained with OX-42 did not show apparent staining of microglia/macrophage. The section stained with cresyl violet showed the damaged areas, which were slightly swollen and pale.
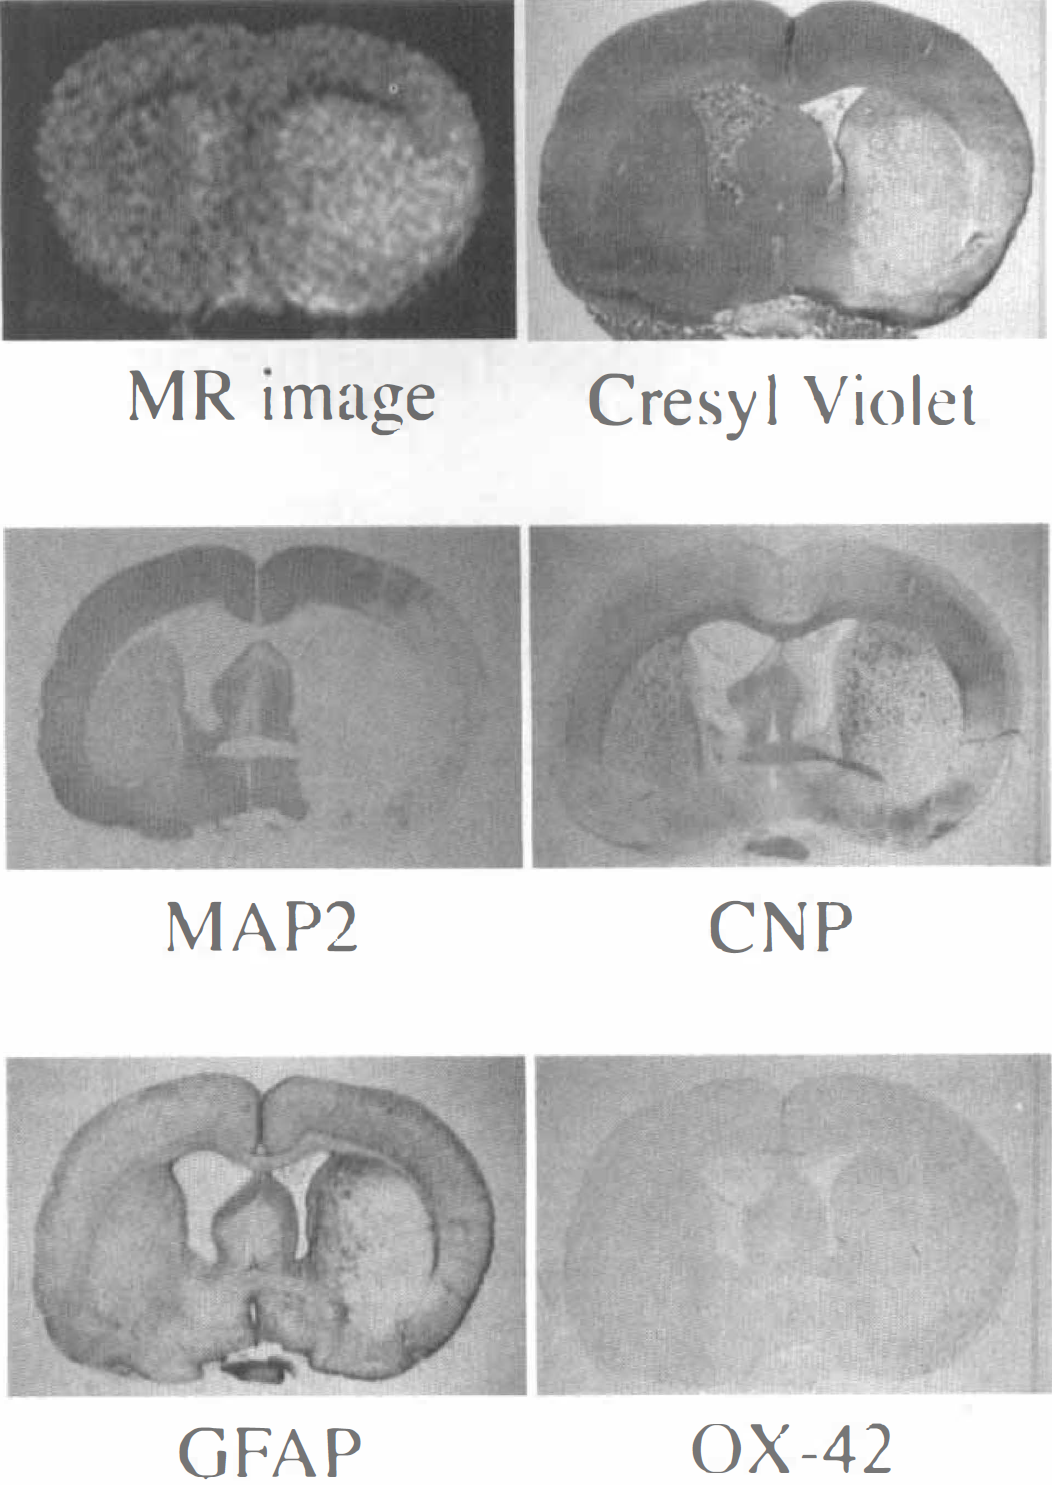
Representative magnetic resonance (MR) image and histologic sections of a rat brain at 6 to 8 hours after middle cerebral artery occlusion.
Magnetic resonance and histologic data 1 week after middle cerebral artery occlusion
A typical MR image and histologic sections obtained 1 week after the MCAO are shown in Fig. 2. The focal ischemic lesion was shown as the area of unequally increased signal intensity in the MR image. The section stained with MAP2 showed a large extent of neuronal damage. The sections stained with CNP and GFAP showed strong staining of oligodendrocyte and astrocyte along the periphery of the neuronal damage, and the section stained with OX-42 showed strong staining of microglia/macrophage in the core of the neuronal damage. The increase in staining in the core of neuronal damage also was observed in the section stained with cresyl violet.
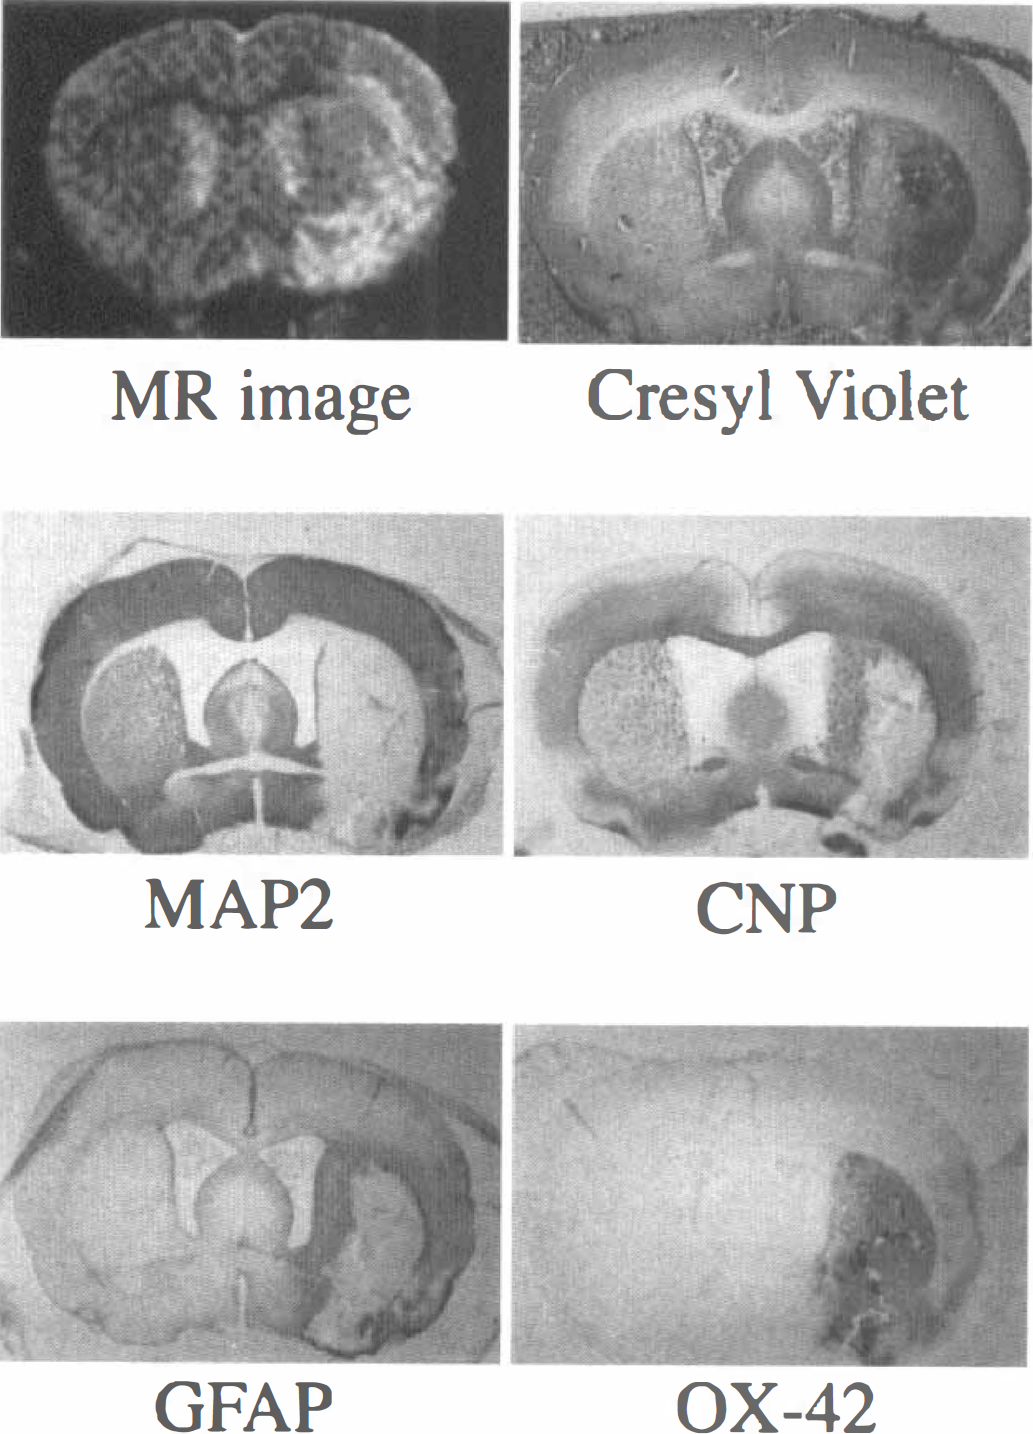
Representative magnetic resonance (MR) image and histologic sections of a rat brain 1 week after the middle cerebral artery occlusion.
Comparison of lesions shown by magnetic resonance imaging with those by microtubule-associated protein 2
The statistical analyses are summarized in Table 2. The values of the damaged area determined by MRI did not significantly differ from those defined by MAP2 staining at 6 to 8 hours after MCAO. However, 1 week after the MCAO, the area shown by MRI was significantly smaller than that shown by MAP2 staining (P < 0.001). The mean lesion area, as measured by MAP2 staining, did not significantly decrease between 6 and 8 hours after MCAO and 1 week after the MCAO.
The damaged area determined by MRI and MAP2-staining
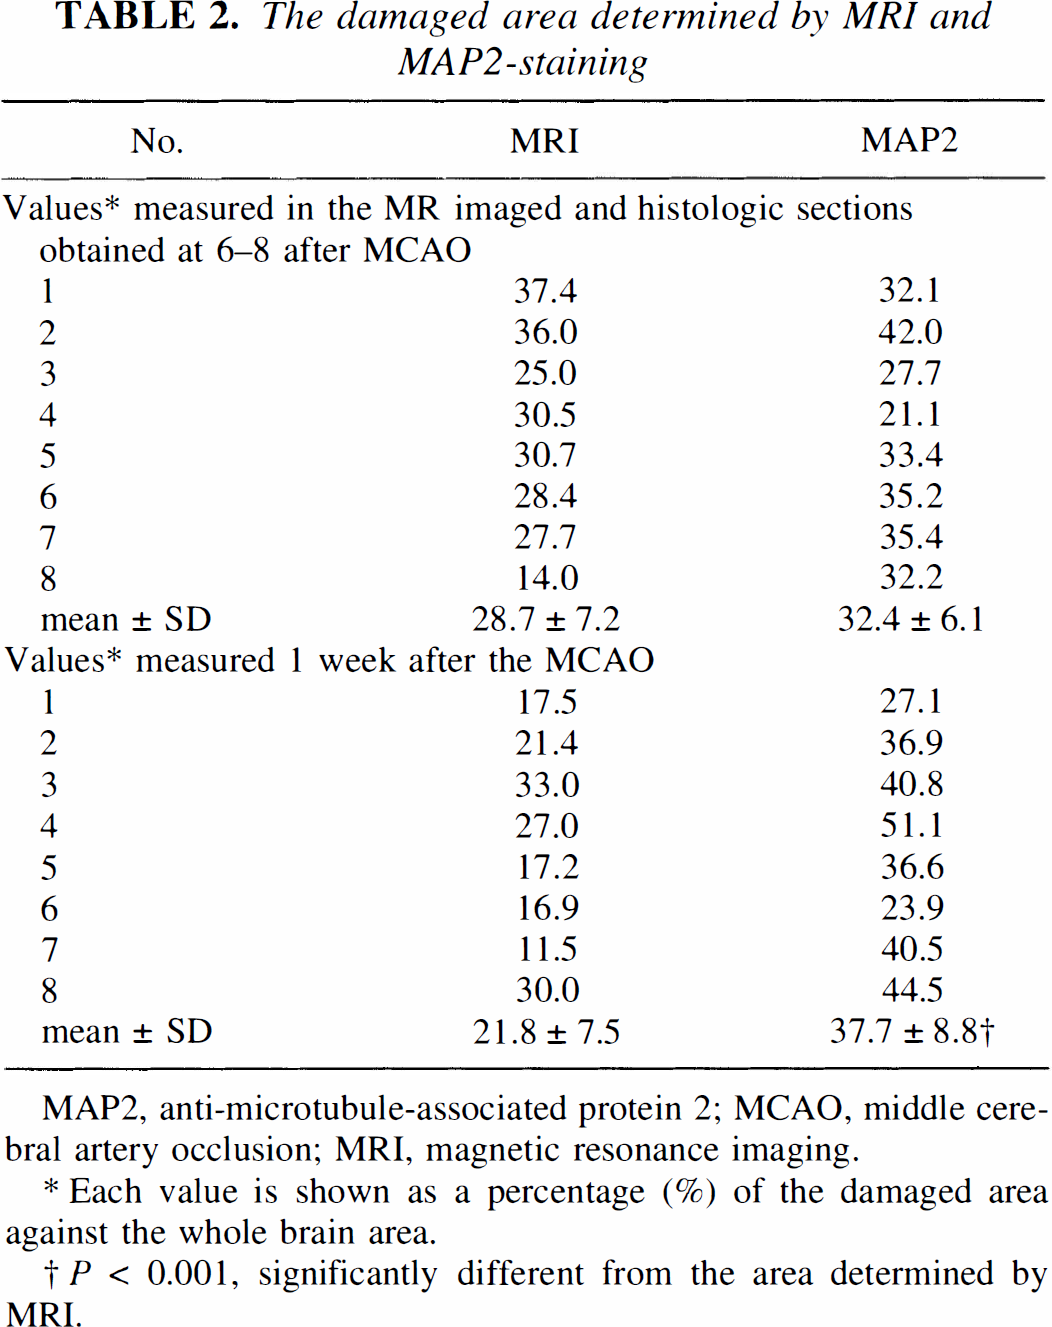
MAP2, anti-microtubule-associated protein 2; MCAO, middle cerebral artery occlusion; MRI, magnetic resonance imaging.
Each value is shown as a percentage (%) of the damaged area against the whole brain area.
P < 0.001, significantly different from the area determined by MRI.
DISCUSSION
The current study evidenced a coincidence in the area of MCAO-induced focal ischemic lesion detected by MAP2 staining and that by MRI at 6 to 8 hours after MCAO. The coincidence, however, disappeared in a week, making the lesion defined by MRI significantly smaller than the MAP2-stained lesion. Enhanced staining from glial infiltration was observed for CNP, GFAP, and OX-42 1 week after the MCAO, in the area of neuronal damage detected by MAP2 staining.
For the early detection of ischemic injury after MCAO, diffusion-weighted MRI is better than T2-weighted one (Mintrovitch et al., 1991; Moseley et al., 1990). Because we did not aim to study early detection but the comparison of MRI with immunohistochemical findings at different time points-at 6 to 8 hours after MCAO and 1 week after the MCAO-conventional T2-weighted MRI was used. In the MRI, the focal ischemic lesion was determined with a threshold at the point of 60%' of the maximum signal intensity in each MRI. This threshold was arbitrarily chosen, and the MRI accurately depicted the ischemic lesion with this threshold at 6 to 8 hours after MCAO. However, 1 week after the MCAO, the MRI underestimated the area of the ischemic neuronal damage when 60% was used as a threshold. If other values had been chosen as the threshold, the results would have been different. Whatever threshold value was chosen, the dissociation of ischemic lesion determined by MRI and MAP2 staining should occur in a week, because MRI and MAP2 staining evaluate different pathologic processes.
Barone et al. (1991) and Sauer et al. (1993) report that focal ischemic lesion determined by MRI at 2 days after MCAO correlated closely with that defined by standard histologic methods. These findings agree with those of the current study, in which the histologic study was made 2 days earlier, indicating that the glial infiltration requires more than 2 days' growth to affect the MRI. Benveniste et al. (1991), however, report that the focal ischemic lesion determined by MRI at 24 hours after the MCAO was larger than the area determined by histologic study. The current study unfortunately provides no explanation for the differences between our work and that of Benveniste et al.
We confirm that a large extent of neuronal death occurred immediately after ischemic insults and that glial infiltration into the area of neuronal damage progressed gradually. The gradual glial infiltration brought about changes in signal intensity in MRI, and consequently the inconsistency of the size of focal ischemic lesion determined by MRI and by MAP2 staining, which was negligible at first, became greater during a week.
The proliferation of astrocytes and oligodendrocytes along the periphery of the neuronal damage is likely to affect the signal intensity in MRI, and for animals with more pronounced cortical injury than the animal shown in Fig. 2, their proliferation in the cortex affected MRI in a similar way to striatal proliferation (data not shown). However, accumulation of microglia/macrophage in the core of the neuronal damage is not likely to affect signal intensity in MR imaging. The water content of microglia/macrophage may be higher than that of astrocyte/oligodendrocyte, which may be shown as the ischemic lesion by MRI. Further studies are needed determine the differential effects of different glial cells to the signal intensity in MRI.
In conclusion, MRI, within a couple of days after MCAO, reflects a lack of neurons, and MRI, 1 week later, reflects not only the lack of neurons but also the infiltration of glial cells, and the size of the neuronal damage may be underestimated.