
Abstract
The purpose of this study was to evaluate the temporal and spatial pathological alterations within ischemic tissue using serial magnetic resonance imaging (MRI) and to determine the extent and duration of functional impairment using objective behavioral tests after transient middle cerebral artery occlusion (tMCAO) in the rat. MRI signatures derived from specific anatomical regions of interest (ROI) were then appropriately correlated to the behavioral measures over the time course of the study (up to 28 days post-tMCAO). Sprague-Dawley rats (n = 12) were initially trained on the following behavioral tasks before surgery: bilateral sticky label test (for contralateral neglect); beam walking (for hindlimb coordination); staircase test (for skilled forelimb paw-reaching). Rats were then randomly assigned to receive either tMCAO (90 minutes, n = 6), by means of the intraluminal thread technique, or sham-control surgery (n = 6). Proton density, T2- and T2-diffusion-weighted MR images were acquired at 1, 7, 14, and 28 days post-tMCAO that were then smoothed into respective proton density, T2 relaxation, and apparent diffusion coefficient (ADC) maps. Apparent percent total lesion volume was assessed using T2W imaging. MR signatures were evaluated using the tissue maps by defining ROI for MCAO and sham-control groups, which corresponded to the caudate-putamen, forelimb, hindlimb, and lower parietal cortices both ipsilateral and contralateral to the occlusion site. Behavioral tests were undertaken daily from 1 to 28 days post-tMCAO. Results demonstrate that apparent percent lesion volume reduced from 1 to 7 days (P < 0.05) but then remained constant up to 28 days for the MCAO group. Pathological changes in the temporal profile of T2 and ADC tissue signatures were significantly altered in specific ROI across the time course of the study (P < 0.05 to < 0.001), reflecting the progression of edema to necrosis and cavitation. Both T2 and ADC measures of ischemic pathology correlated with parameters defined by each of the functional tests (r ≥0.5, P < 0.05) across the time course. The staircase test revealed bilateral impairments for the MCAO group (P < 0.001), which were best predicted by damage to the ipsilateral lower parietal cortex by means of hierarchical multiple regression analyses (R2 changes ≥0.21, P < 0.03). Behavioral recovery was apparent on the beam walking test at 14 to 28 days post-MCAO, which was mirrored by MRI signatures within the hindlimb cortex returning to sham-control levels. This long-term study is the first of its kind in tracing the dynamic pathologic and functional consequences of tMCAO in the rat. Both serial MRI and objective behavioral assessment provide highly suitable outcome measures that can be effectively used to evaluate promising new antiischemic agents targeted for the clinic.
In vivo magnetic resonance imaging (MRI) has become a key research tool to investigate the early and late manifestations of focal cerebral ischemia. MRI provides sensitive measures that relate to the amount and state of water in brain tissue, by means of spin-spin relaxation times (T2), proton spin density (PD), and the apparent diffusion coefficient of water (ADC). Numerous studies have documented quantitative changes in MRI parameters at “acute” time points after middle cerebral artery occlusion (MCAO) in the rat; however, few studies have attempted to delineate the dynamic changes across a “chronic” time course. An MR tissue signature model of ischemic histopathology has recently been devised to ascertain the state and evolution of cellular damage using absolute changes in T2 and ADC markers (Welch et al., 1995; Jiang et al., 1997). The model predicts tissue signature on the basis of a relationship between T2 and ADC which can range from normal cellular integrity to necrosis with the provision of potential recovery of perifocal tissue, according to the relative shifts in T2 and ADC over time. This tissue signature model has considerable clinical relevance (Welch et al., 1995), although to truly test the predictive validity of tissue signature attribution serial observations across an extended time course are also necessary to predict final infarct volume and outcome. However, no experimental work to date has quantified these absolute changes in MR parameters beyond 7 days after the intraluminal thread MCAO technique (transient [≥90 minutes] or permanent), because of the concerns of outcome severity and mortality with this surgical model.
Functional outcome, as well as histopathologic evaluation, is a necessary requirement to assess the consequences of stroke. Indeed it may be argued that the functional status of the individual is more important than quantifying the underlying pathology when making predictions about “quality of life.” There is an increasing body of literature examining functional outcome immediately after both permanent (pMCAO) and transient MCAO (tMCAO), such as grading neurologic function by means of the Bederson postural reflex scoring system (Bederson et al., 1986) which effectively assesses the “quality” of MCAO. However, few studies have attempted to extend behavioral assessment to determine the chronic consequences of tMCAO after the intraluminal thread technique in the rat. In those studies which have been extended, using alternative surgical procedures for both pMCAO and tMCAO, simple behavioral tests of somatosensory and motor function (postural reflex, bilateral sticky label test/tactile extinction, beam walking: Anderson et al., 1991; Markgraf et al., 1992, 1997) exhibit spontaneous recovery, whereas tests of skilled motor function (staircase test: Grabowski et al., 1993; Marston et al., 1995) appear to be affected over a longer time course. The staircase test has proved to be a reliable and stable task of skilled forelimb paw use, which objectively quantifies fine motor movement for retrieval and displacement of food reward pellets. Moreover, this task has demonstrated contralateral paw-reaching deficits during 3 months of testing after proximal pMCAO that are highly correlated with infarct size, determined at the end of the study, compared to that of a sensorimotor integration test that correlated only within the short term, i.e., 2 months (Grabowski et al., 1993). Therefore this test appears to be a sensitive and appropriate behavioral task that can assess a persistent ischemic deficit which models the impairment in finger dexterity seen in human stroke patients (Gowland, 1987).
No experimental studies to date have attempted to correlate performance on both simple and complex motor tasks with pathological changes visualized by MRI. Therefore, the purpose of the present study was to evaluate the temporal and spatial pathologic changes of ischemic tissue by T2, ADC, and PD markers after transient MCAO (tMCAO) in the rat across a chronic time course (up to 28 days after MCAO) and to correlate these changes with functional outcome. Measurements of lesion volume as well as absolute changes in MR signatures within specific regions of interest (ROI) were undertaken to provide evidence of lesion maturation and alterations in anatomic loci within the MCA territory. Functional assessment was performed throughout the time course to determine alterations in sensorimotor and skilled forelimb function. Behavioral profiles were then correlated with the appropriate ROI on the corresponding MR images to ascertain the relationship between function and spatial pathological changes over the time course of our study.
MATERIALS AND METHODS
All procedures used in this study were carried out in accordance with the U.K. Animals (Scientific Procedures) Act (1986). Twelve adult male Sprague-Dawley rats (Charles River, U.K., 320 to 350 g) were housed in groups of 2 and maintained under a natural 12-hour light/dark cycle with water ad libitum. Food was restricted during pretraining and at 7 days post-MCAO to facilitate performance on the staircase test which was an appetitively motivated task. The feeding regimen was controlled so that animals gained weight at a rate of 3 to 5 g/w maintaining animals at 85 to 90% of their free-feeding weight. Animals were provided with food ad libitum from 6 hours to 6 days post-MCAO to improve postoperative weight and recovery. Rats were initially trained on the following behavioral tasks before surgery: bilateral sticky label test, beam walking, and the staircase test.
Bilateral sticky label test
The bilateral sticky label test (Schallert and Upchurch, 1983) was used to quantify contralateral neglect/ipsilateral bias and models tactile extinction observed in human stroke patients (Rose et al., 1994). Bilateral stimulation of the radial aspect of the forearm was achieved by placing thin strips of brown parcel/packing tape (1.5 × 4 cm) firmly around each animal's wrists, so that they covered the hairless part of the forepaw. In instances when the sticky label came partially or completely off without the animal having attempted to remove the stimulus with its mouth, the trial was repeated again. Animals were given three bilateral stimulation trials daily, each lasting up to a maximum of 5 minutes, and the following parameters were recorded: latency to contact label on left and right forearm (in seconds); latency to remove left and right label on forearm (in seconds); order of contact (total number of times left and right forearms were contacted first); and order of removal (total number of times left and right label on forearms were removed first). Care was taken in each trial to apply each stimulus with equal pressure and to randomize the order of application (left versus right). Latency data were assessed on a daily basis, whereas order of contact and removal data were represented as the mean ± SEM of 2 consecutive days so that a bias analysis could be carried out, i.e., order of contact and removal can be determined according to the protocol of Marshall and Ridley (1996). Animals were trained on this task until a stable baseline for latency and order of contact was established over a period of a week. Final preoperative measurements were carried out over a period of another week before surgery, and there was no bias in order of contact or removal before surgery, indicating that both groups were matched for ability (handedness). This test was applied daily after surgery, i.e, from 1 to 28 days post-MCAO.
Beam walking
Beam walking (modified from De Ryck et al., 1989; Goldstein and Davis, 1990) was used as a measure of hindlimb coordination by means of distance travelled across an elevated 100 cm beam (2.3 cm in diameter, 48 cm off the floor). Rats were systematically trained to walk along the elevated beam from start to finish with the aim of completing the task in 3 minutes. A safe location, i.e, a flat box, was placed at the end of the beam so that the rat was motivated to complete the task. Each rat was trained twice daily for a maximum of 3 minutes per trial, and an acquisition curve demonstrated that rats randomly allocated to either sham-operated or MCAO groups learned the task by 5 days, i.e, a stable baseline was achieved before surgery (data not shown). Each data point represents the mean of two daily sessions. This task was instigated daily after surgery, i.e., from 1 to 28 days post-MCAO.
Staircase test
The staircase test (originally designed by Montoya et al., 1991 and modified by Marston et al., 1995) was used to measure skilled independent forelimb paw reaching, i.e, pellet recovery was only possible with the left paw from the left stair and with the right paw from the right stair. Pellet recovery was not performed under visual guidance but using tactile and possibly olfactory cues. Apart from the top two steps, of the six-step stairway, from which a few rats used their tongues in the early stages of training, retrieval of a food pellet was only possible with a coordinated grasping action using all digits of the paw. Animals were placed on a mild food-restricted diet during pretraining in order to provide motivation for food rewards. Animals were then introduced into a Perspex enclosure (300 × 67 × 95 mm long × wide × high) attached to a holding box. A central plinth (190 × 20 × 48 mm) was positioned between the entry aperture and the front wall. Two removable staircases were positioned, either side of the plinth, by insertion through the front wall. Each stair consisted of six steps; each measured 14 × 17 × 6 mm with a hemispheric cup (11.5 mm in diameter). Between the back stair and the entrance aperture a V-shaped barrier was positioned on the floor of the box, so food pellets displaced from the steps could be held without the animal getting hold of them, i.e, pellet recovery was only possible with the left paw from the left stair and with the right paw from the right stair. Animals were given two 5-minute sessions in the staircase testing box, approximately 10 minutes between tests, on a daily basis. Each step of the stairs was baited with one chocolate food pellet. Each animal had to retrieve as many pellets as possible (maximum of 6 pellets a side per session were available, i.e., a total of 12 pellets a side for any one day). At the end of the test period, the stairs were removed and the animals were returned to their home cage. Performance was scored as the number of pellets recovered from each stair and the number of pellets displaced but not recovered. Rats were trained over a period of 3 weeks on this task, with a criterion of at least 6 pellets recovered from each side and no more than 4 pellets displaced per side per day over 3 consecutive days. Each data point is represented in blocks, i.e., the mean of 3 daily sessions, from pre- to postoperative blocks, as used by Marston et al. (1995). Essentially, postoperative blocks 1 to 4 correspond to the following postoperative days, respectively: 7 to 9; 13 to 15; 20 to 22; and 26 to 28. This test was begun from 7 days post-MCAO in order to give the animals enough time for recovery before food restriction was reintroduced.
Surgical procedures
After successful training and an overnight fast rats were randomly assigned to receive either tMCAO (90 minutes, n = 6) by means of the intraluminal thread technique by adaption of the method originally described by Koizumi et al. (1986) or sham surgery (n = 6). Surgical procedures were performed under halothane (2% v/v O2) anesthesia. After exposure of the right common carotid artery through a midline cervical incision, a 3/0 nylon monofilament thread, its leading 5 mm end coated with silicone rubber (diameter of 0.30 to 0.32 mm), was introduced by means of a common carotid arteriotomy and carefully advanced along the internal carotid artery until its tip was positioned 1 mm beyond the origin of the right MCA (rMCA), as verified by a slight resistance. The rMCA was occluded for 90 minutes during which time the rat was allowed to recover from anesthesia. After 90 minutes each rat was briefly reanesthesized with halothane (2% in O2 v/v) and the thread withdrawn to the common carotid artery to permit retrograde blood flow to the rMCA through the complete circle of Willis. Sham surgery was achieved by introducing the thread into the internal carotid artery immediately followed by careful withdrawal to the common carotid artery. Throughout all surgical procedures, rectal temperature was monitored and maintained at 37 ± 1°C (mean ± SD) with a heated electrical blanket. Rectal temperature was recorded before occlusion, before reperfusion, and 15 minutes after reperfusion in MCAO animals. Arterial blood samples were obtained just before inserting the intraluminal thread in both MCAO and sham-operated control animals for assessment of blood gas status (pH, P
MRI methods
For MRI procedures anesthesia was induced and maintained with halothane (1% v/v O2). Rectal temperature was maintained at 37 ± 1°C using an electric heating pad with feedback rectal temperature probe. MRI was performed at 4.7 Tesla (200 MHz for 1H) using a SIS-200 imaging spectrometer (Spectroscopy Imaging Systems, Fremont, CA, U.S.A.) and a homemade 75-mm (outside diameter) 8-legged birdcage radiofrequency coil for signal transmission and reception. Proton-density, T2, and diffusion-weighted MR images were acquired, interleaved with each phase encode step (two averages, NEX = 2) using echo times (TE, in milliseconds)/repetition times (TR, in milliseconds) and diffusion weightings (b, 10−3 s/mm2) of 23/3000/0, 70/3000/0, and 70/3000/590, respectively. The diffusion weightings (b) of 0 and 590 × 10−3 s/mm2 were applied along the inferior to superior axis (y-direction) of the brain. Thirty-two contiguous slices starting at the level of the eyes, running rostral to caudal through the brain, were acquired using a 128- × 128-image matrix covering a field of view of 4 × 4 cm and yielding an in-plane resolution of approximately 0.3 mm × 0.3 mm. The slice thickness was 0.6 mm to increase the spatial resolution while the total imaging time was approximately 45 minutes in order to minimize the duration of anesthesia for recovery and to allow for subsequent serial measurements. Scanning was used at 1, 7, 14, and 28 days after insult.
MRI image analysis
To calculate MRI-derived lesion volume, a direct 2D Fourier transform (FT) of the raw time domain data was performed on all slices for all of the three differently weighted sets of images produced across the time course. T2-weighted (T2W) images were then used to calculate apparent percentage lesion volume by highlighting unilateral regions of hyperintensity on a slice-by-slice basis (in-house display software) to derive total lesion area and then brain volume by summing the total area of the cerebral hemispheres. The threshold for hyperintensity was set as a mean intensity value of the contralateral side + 2 SD as the minimum intensity value, taken from a single representative slice for each animal at each time-point. Images were also smoothed using a three-dimensional anisotropic diffusion filter (Perona and Malik, 1990), and PD, T2, and ADC maps were then produced. Fitting of the acquired data to monoexponentials was then performed on a pixel-by-pixel basis using 2-point exponential fitting routines. ROI (3 × 3 pixels) for MCAO and sham-operated groups both ipsilateral and contralateral to the occlusion site were then interrogated to obtain as much pixel information without extending beyond the perimeter of the defined area (Fig. 1). ROI from T2 and ADC maps were analyzed by measuring the average pixel intensity value in the following anatomically distinct regions: dorsolateral caudate putamen, forelimb cortex (FLC), lower parietal cortex (LPC) at approximately −0.3 mm from bregma, interaural (IA) 8.7 mm and the hindlimb cortex (HLC) at approximately −1.8 mm from bregma, and IA at 7.2 mm according to the rat stereotaxic atlas (Paxinos and Watson, 1986). ROI analysis for PD maps was achieved by using the signal intensity ratio (average pixel intensity ratio, i.e., SIR) between the ipsilateral and contralateral sides for each of the above ROI in both MCAO and sham-operated control groups. In order to confirm consistent average pixel intensity values for each of the specific ROI, we measured adjacent slices either side of the chosen slice for the MCAO group using T2 maps to provide a consecutive volumetric assessment (+1.8 mm, 3 slices) of pixel signal intensity on a slice-by-slice basis. For the caudate putamen (CPU), FLC, and LPC regions, average values were taken on all three slices both ipsilateral and contralateral to the occlusion site at approximately the following co-ordinates from bregma: (1) 0.30 mm; (2) −0.30 mm; (3) −0.90 mm. For the HLC region we acquired average values at the following coordinates from bregma: (1) −1.2 mm; (2) −1.8 mm; (3) −2.4 mm.
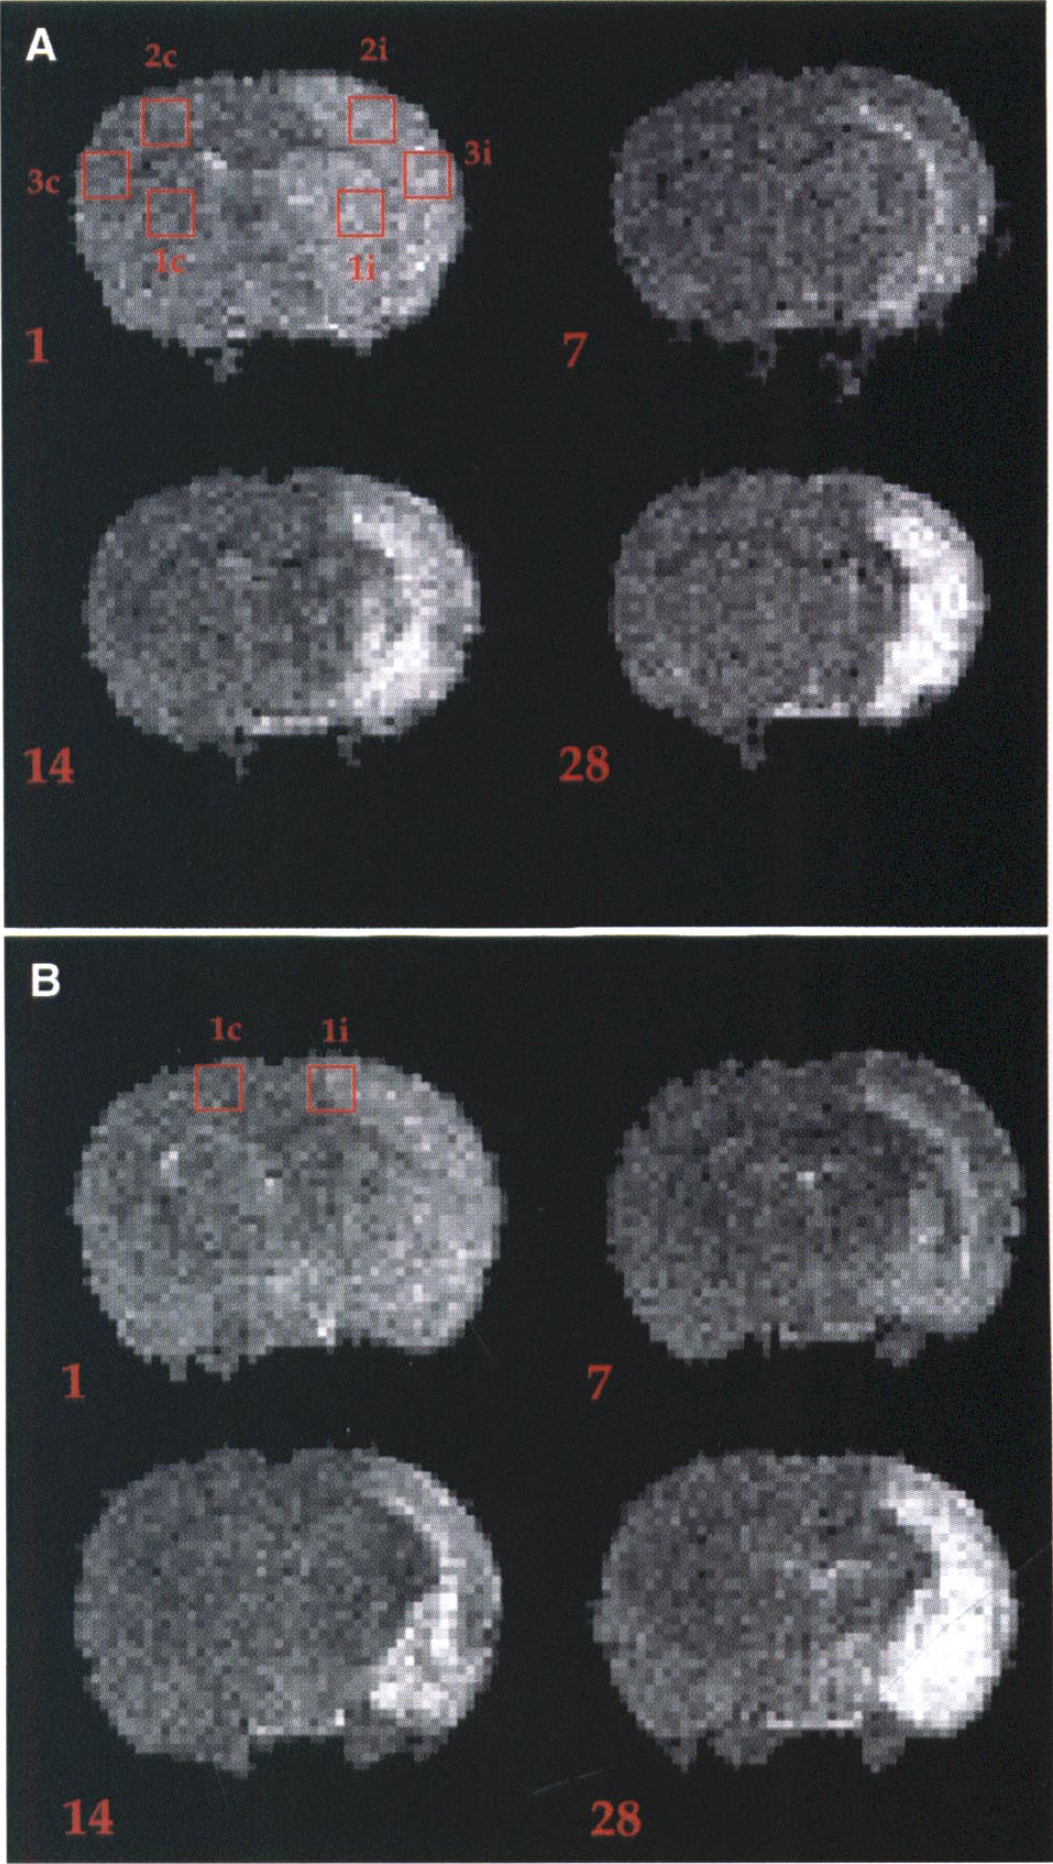
Representative T2W images, at approximately: (
Histologic procedures
At 28 days after insult, both MCAO and sham animals were terminally anesthetized and transcardially perfusion-fixed with 0.9% saline followed by 4% paraformaldehyde. Brains were then removed and stored in fixative for about 7 days. Each brain was then cut into 2-mm-thick coronal blocks for a total of 6 blocks per animal using a rat brain matrix. Blocks were then processed for paraffin embedding. Paraffin sections (10 μmthick) were cut and stained with cresyl violet (Nissl) and Lux ol fast blue to delineate regions of grey and white matter loss, respectively.
Statistical analysis
All statistical analysis was conducted using the SPSS for Windows 6.0 software package using parametric statistical tests, as the data were shown to be normally distributed, and the variances between the groups were not different after Levene's test for equality of variances. Assessment of blood gases and body/core temperature were analyzed by simple independent and paired t tests, respectively. Data from the MRI experiments were analyzed as follows: A repeated measures analysis of variance (ANOVA) was applied to calculate lesion volume as a percent of hemispheric volume using the T2W images across the time course (within-subject factor) between MCAO and Sham group (between-subject factor). Similarly, a repeated measures ANOVA was implemented for ROI analyses from T2 and ADC maps where the time course acted as the within-subject factor whereas group (MCAO and Sham) and side (ipsilateral and contralateral) acted as the between-subject factors. PD map ROI analysis was also performed by a repeated measures ANOVA across the time course, but group (MCAO and Sham) acted as the only between-subject factor. A volumetric assessment was performed on each of the ROI derived from T2 maps for the MCAO group using a repeated measures ANOVA, where slice number (1, 2, or 3) and side (ipsilateral and contralateral) acted as the between-subject factors across the time course (within-subject factor). Data derived from the bilateral sticky label test (mean ± SD; latency to contact and remove and order of contact and removal) and the staircase test (total pellets recovered and displaced) were analyzed by a repeated measures ANOVA across the time course (within-subject factor) where group (MCAO and Sham) and side (ipsilateral and contralateral) acted as between-subject factors. Beam walking (total distance travelled) and the Bederson neurological scoring system were also analyzed by a repeated measures ANOVA across the time course, but group (MCAO and Sham) acted as the only between-subject factor. When all tests proved significant, post-hoc Newman Keul's comparisons were implemented to determine differences between groups and sides where appropriate.
Correlational analyses using Pearson's r were then performed to determine relationships between appropriate MR ROI and specific behavioral profiles (reflecting a more continuous and parametric distribution) at the specific time points examined across the course of the study (1, 7, 14, and 28 days), i.e., ipsilateral CPU, FLC, and LPC with latency to contact and remove labels on the bilateral sticky label test and total number of pellets consumed on the staircase test. The HLC was correlated to total distance travelled during beam walking across the time course of the study. These behavioral measures were used in the correlational analyses because they reflect an objective and quantitative assessment rather than the grading of neurologic score which is essentially qualitative. Correlations between qualitative grading on the Bederson scoring system and quantitative MRI data were not performed, as both sham-operated controls and tMCAO animals demonstrated minimal variance when assessed on the Bederson neurologic score. Therefore, correlating quantitative behavioral changes with quantitative MRI changes is a more objective method of attempting to assess a relationship between functional outcome and neuropathology across an extended time course. A hierarchical multiple regression (“sequential regression” statistical model) was finally conducted to attempt to delineate which of the ROI (independent variables) best predicted the behavioral pattern (dependent variable) observed on the staircase test. The staircase test has been demonstrated to be a robust task for behavioral impairment, and a hypothesis was set for predicting which individual ROI best predicted the behavioral profile over and above the other independent variables from the data set. This hierarchical approach to multiple regression allows determination of whether the final predictor or set of predictors entered into the regression equation can explain a significant proportion of the variance in the dependent variable over and above that of which is attributable to earlier data sets. It thus represents a a conservative test of the effect of the variable(s) of interest in that variables first entered are maximized (McLeroy et al., 1984; Rose et al., 1994). An R2 change and an F change were reported to explain how much each individual ROI contributed to the variation in the dependent variable. Standardized regression coefficients (beta weightings) together with a significance level, determined by the t statistic, were also included in the analyses to ascertain the best predictor from the regression equation. In all analyses P < 0.05 was considered significant.
RESULTS
Blood gases, measured before insertion of the intraluminal thread, were not significantly different between MCAO and sham-operated control groups (independent t test), respectively (mean ± SD, n = 5-6: pH, 7.35 ± 0.03, 7.36 ± 0.01; P
MRI assessment
Lesion volume analysis. Apparent percent total lesion volume, as revealed by hyperintensity on T2W images, was initially shown to be high at 1 day post-MCAO, which subsequently decreased to a constant level (remaining hyperintense in comparison to the contralateral side) from 7 to 28 days for the MCAO group (group × time interaction: F(3, 27) = 4.35, P < 0.05). Selective post-hoc analyses from day 1 post-MCAO revealed significant reductions at day 7 (P < 0.05) and day 28 post-MCAO (P < 0.05) within the MCAO group (Fig. 2). However, there were no significant differences between lesion volumes obtained at 7, 14, and 28 days post-MCAO (P > 0.05, NS). The longitudinal extent of the lesion did not significantly change across the time course (mean ± SD of number of slices: 1 day = 16.3 ± 1.0; 7 days = 15.8 ± 0.8; 14 days = 14.2 ± 2.1; 28 days = 15.0 ± 1.7, P > 0.05, NS).
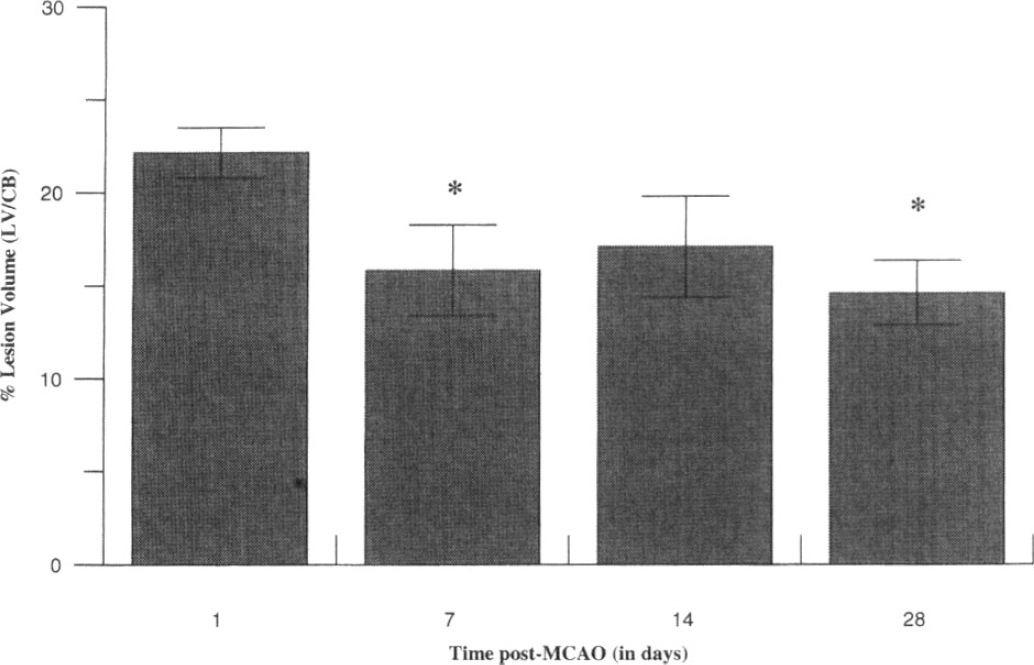
Apparent percent lesion volume (mean ± SD) assessed by T2W imaging in MCAO rats across an extended time course in days. (▪) MCAO. *P < 0.05, significantly different from day 1.
ROI analysis. ROI analysis using T2 maps demonstrated significant changes across the time course as verified by significant group × side interactions: CPU (F[1, 14] = 18.96, P < 0.01); FLC (F[1, 14] = 11.64, P < 0.01); LPC (F[1, 14] = 42.95, P < 0.001); HLC [F[1, 14] = 6.35, P < 0.05). Selective post-hoc analyses revealed increased relaxation times for ipsilateral CPU, FLC, and LPC at 1, 14, and 28 days post-MCAO, which significantly differed from the contralateral side and sham-operated group (Fig. 3). Elevated T2 values were also apparent for the ipsilateral HLC at 1 day post-MCAO with a significant decline to contralateral side and sham-operated control group control levels from 7 to 28 days post-MCAO (Fig. 3). Reduced T2 values were obtained at 7 days post-MCAO for each of the above ROI, but only the ipsilateral CPU, FLC, and LPC remained significantly different from the contralateral side and sham-operated group (Fig. 3). The only ROI that demonstrated a group × side × time interaction was the LPC (F[3, 42] = 6.79, P < 0.01) which showed a progressive increase in T2 values ipsilaterally, compared to the contralateral side and sham-operated control group. ROI analysis using ADC maps demonstrated significant changes across the time course as highlighted by significant group × side × time interactions: CPU (F[3, 42] = 8.82, P < 0.001); FLC (F[3, 42] = 13.61, P < 0.001); LPC (F[3, 42] = 14.01, P < 0.001). There was a trend for the ipsilateral HLC (F[3, 42] = 2.66, P = 0.06). Selective post-hoc analyses revealed significant reductions in ADC at 1 day after MCAO for ipsilateral CPU, FLC, and LPC and a subsequent progressive increase from 7 to 28 days post-MCAO compared to the contralateral side and sham group levels (Fig. 4). ADC values for the ipsilateral HLC were shown to initially decline at 1 day but subsequently increased to a level that did not differ from the contralateral side and sham controls from 7 to 28 days post-MCAO (Fig. 4). ROI analysis using PD maps only demonstrated significant changes in group main effects for the FLC (F[1, 7] = 6.00, P < 0.05) and the CPU (F[1, 7] = 14.94, P < 0.01). A trend was observed for the LPC (F[1, 7] = 4.51, P = 0.07) whereas no effect was shown for the HLC (F[1, 7] = 1.55, P > 0.24). No group × time interactions were observed for any of the above ROI. Restricted post-hoc analyses revealed significant elevations in SIR only within the CPU for the MCAO group at 14 and 28 days post-MCAO (mean ± SD: 14 days, MCAO, 1.12 ± 0.09, sham, 0.95 ± 0.04, P < 0.05; 28 days, MCAO, 1.15 ± 0.08, sham, 0.95 ± 0.04, P < 0.05) With reference to the volumetric analysis using T2 maps it was evident that there was no significant slice effects (P > 0.78) or slice × side × time interactions (P > 0.75) for each of the ROI, indicating that values taken from the initial slices were consistent with values taken longitudinally through those regions across the time course.
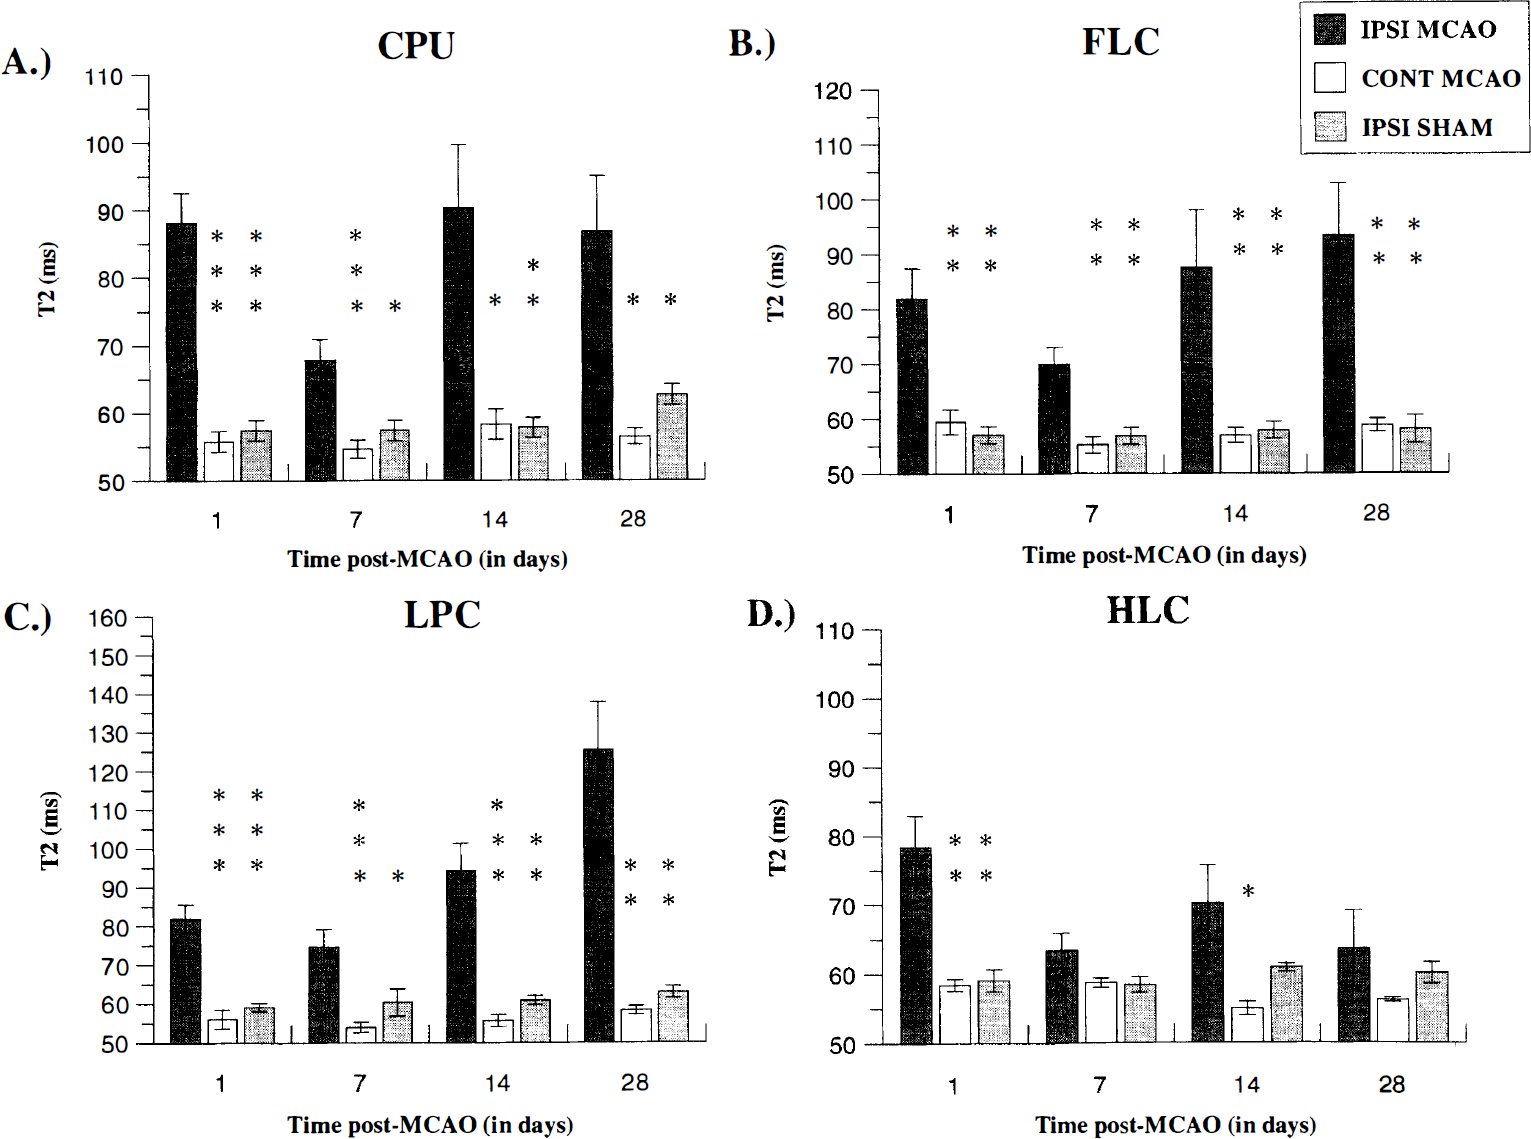
T2 values (mean ± SD) derived from T2 maps, measured across the time course for ROI: (
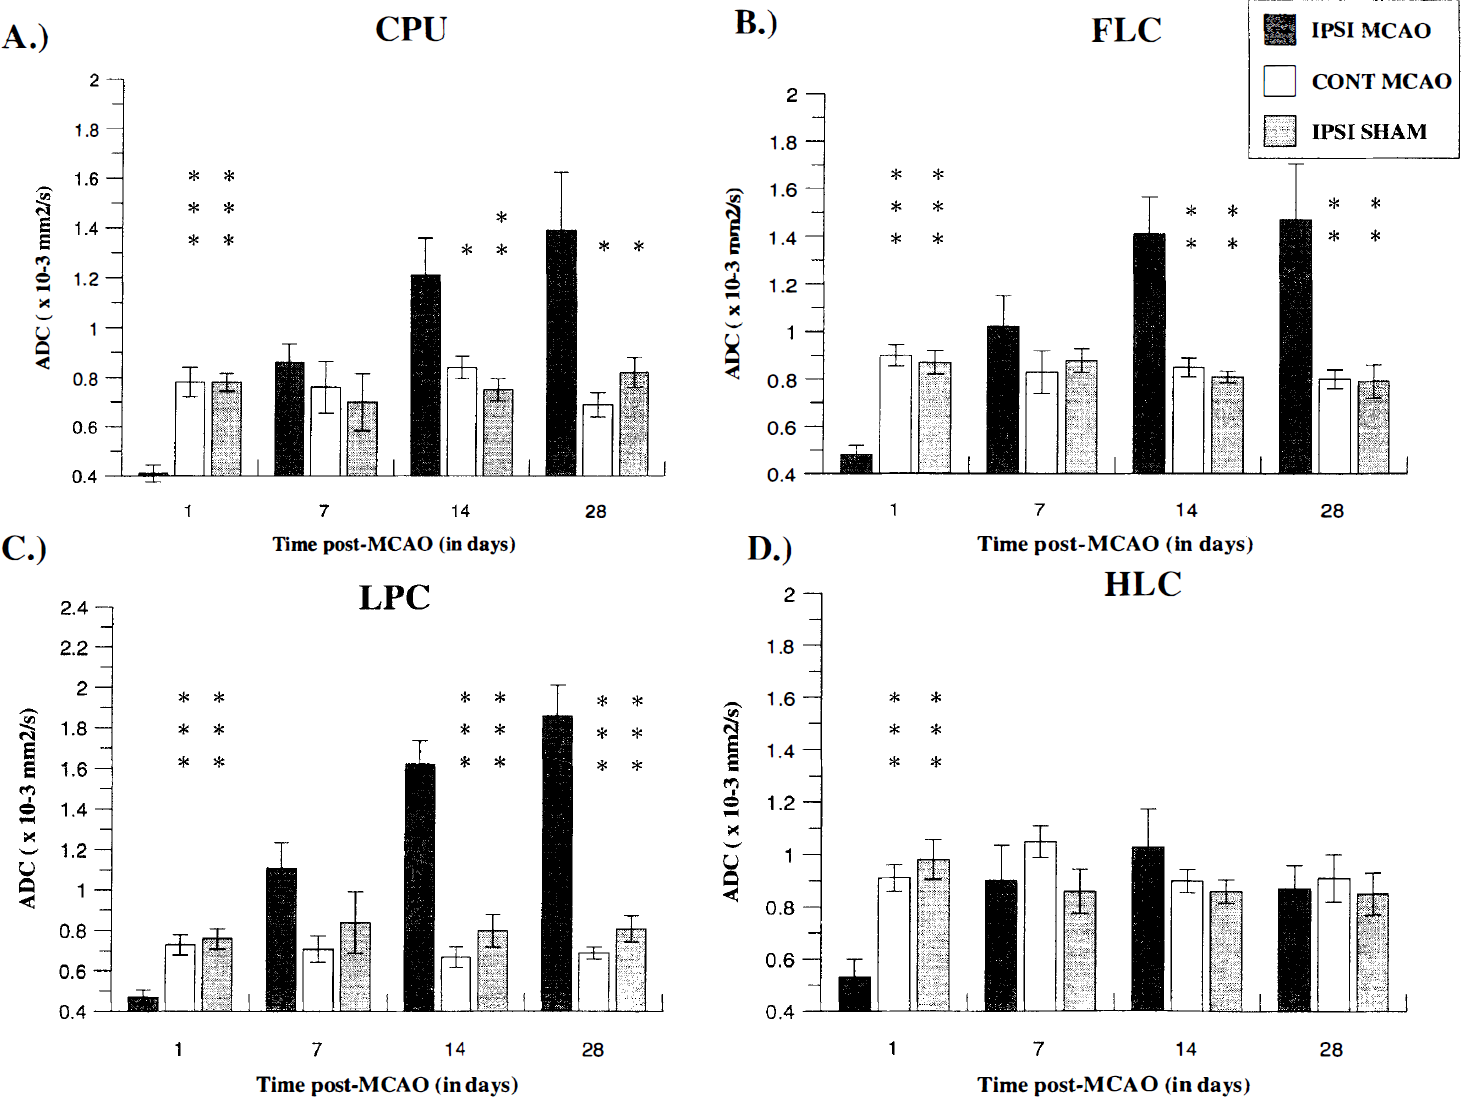
ADC values (mean ± SD) derived from ADC maps, measured across the time course for ROI: (
Behavioral assessment
The tMCAO and sham groups did not differ significantly in performance across the behavioral tasks before surgery, indicating that both groups were matched for functional ability (P > 0.05, NS). After surgery, results from the standard Bederson neurologic scoring system demonstrated a significant group × time interaction (F[7, 63] = 7.53, P < 0.001). Individual post-hoc comparisons revealed significant neurologic deficits throughout the time course for MCAO rats, relative to sham-operated controls which showed no deficits (MCAO, mean ± SD: 1 day, 2.5 ± 0.8, P < 0.001; 7 days, 1.3 ± 0.6, P < 0.001; 14 days, 0.9 ± 0.2, P < 0.001; 28 days, 0.8 ± 0.4, P < 0.01). The bilateral sticky label test revealed significant long-lasting deficits in latency to contact and remove labels from the contralateral forearm for the MCAO group across the time course. Significant group × side × time interactions were shown for latency to contact (F[6, 108] = 6.36, P < 0.001) and remove (F[6, 108] = 3.68, P < 0.01) sticky labels. Selective post-hoc analyses demonstrated an initially marked impairment followed by improvement in response times across the time course for MCAO animals but remained significantly higher from the preoperative baseline, ipsilateral forearm, and sham-operated control group animals (Fig. 5). A significant group × side × time interaction was also observed for order of contact (F[6, 108] = 19.96, P < 0.001) and removal (F[6, 108] = 9.12, P < 0.001) of sticky labels which further reflected a contralateral neglect and an ipsilateral bias to sensory stimuli for MCAO animals (Fig. 5, for post-hoc comparisons).
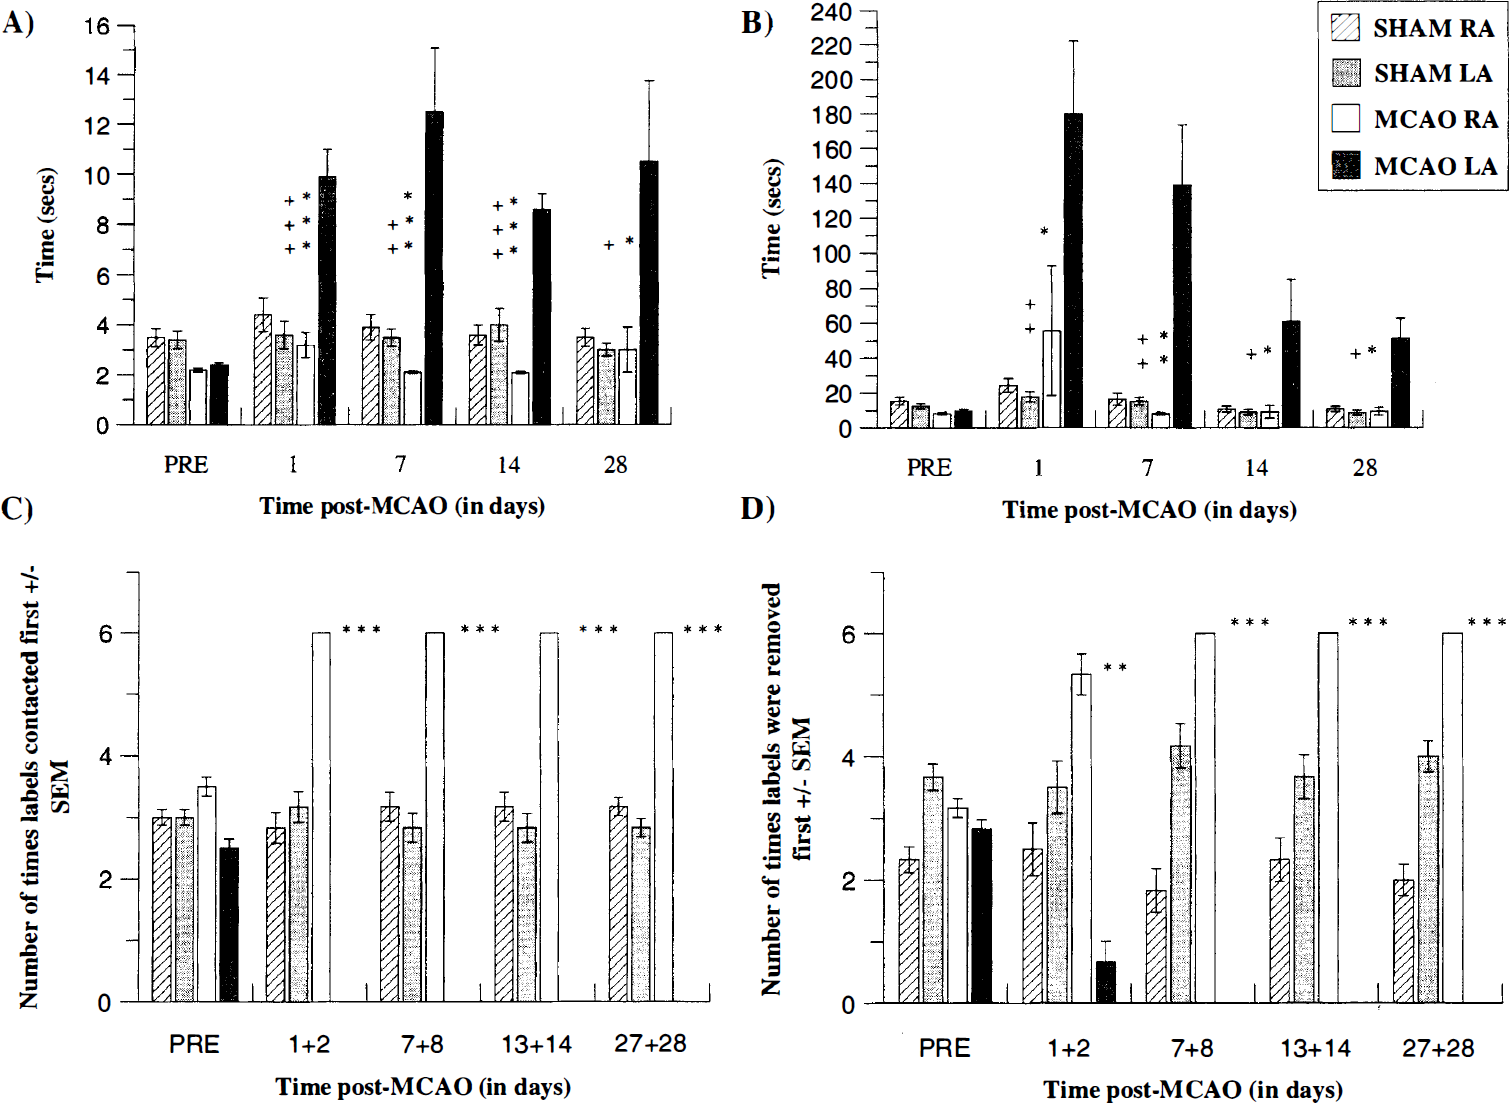
Mean latency (seconds ± SD) to contact (
On the beam walking task MCAO animals were shown to be initially impaired by a proprioceptive contralateral hindlimb placing deficit which gradually recovered, reflecting improved coordination. A significant group × time interaction was shown for total distance travelled (F[8, 72] = 23.56, P < 0.001). Individual post-hoc comparisons revealed a marked deficit in coordination from 1 to 7 days post-MCAO followed by a return to preoperative baseline and sham-operated control group performance from 14 to 28 days post-MCAO (Fig. 6).
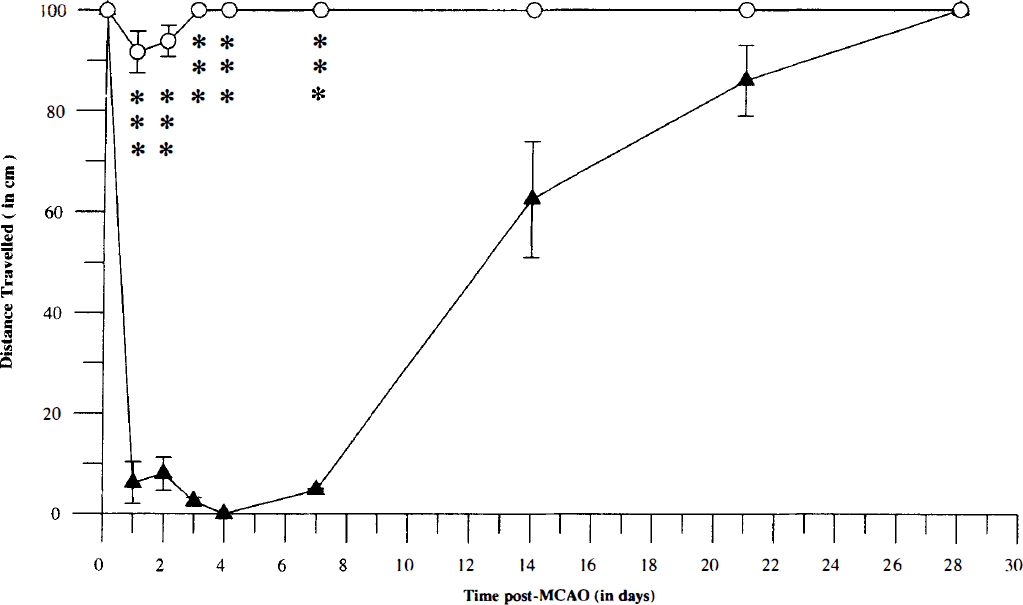
Mean distance (cm ± SD) travelled across a 100-cm elevated beam by tMCAO and sham control animals across the time course. P < 0.001, significantly different from sham control group. (▴) MCAO. (○) SHAM.
The staircase test demonstrated bilateral impairments in the total number of food pellets retrieved across the postoperative blocks by MCAO animals. A significant group × side × time interaction was found (F[4, 72] = 4.19, P < 0.005). Restricted post-hoc analyses indicated that the forelimb contralateral to the lesion exhibited a marked and prolonged impairment across the time course compared to preoperative baseline and sham group performance (Fig. 7). An ipsilateral impairment was also revealed, although not as marked as the contralateral forelimb. However values for ipsilateral paw-reaching food pellet retrieval significantly differed from preoperative baseline and sham group values (Fig. 7). No significant group × time × side interactions were found for total food pellet displacement across the postoperative blocks (F[4, 72] = 0.39, P > 0.8). Although MCAO animals tended to displace more food pellets from the stairs with their ipsilateral forepaw than the sham control group (Fig. 7). Therefore MCAO animals tended to possess long-lasting deficits in fine motor control and sensorimotor neglect across the time course of the study.
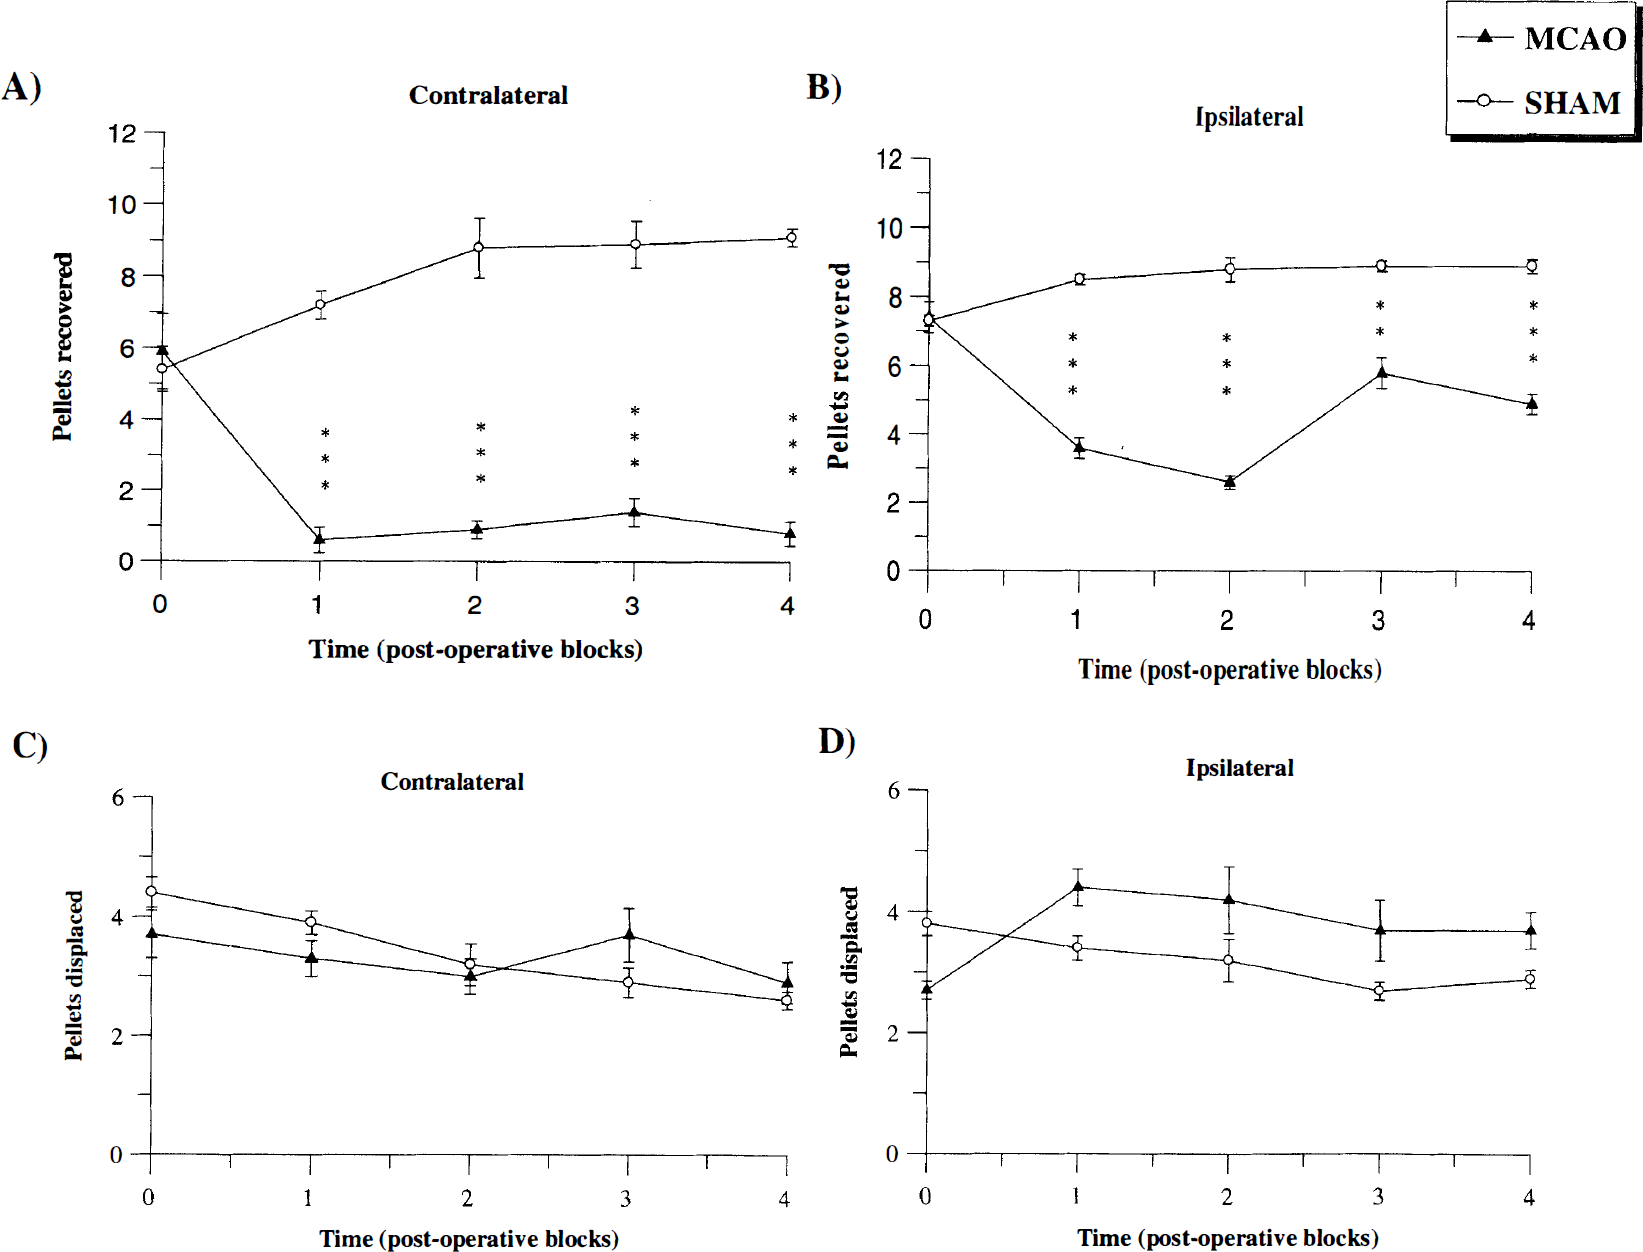
Total number of pellets recovered by contralateral (
Correlational analysis.
Correlations between T2 ROI and behavior across an extended time course
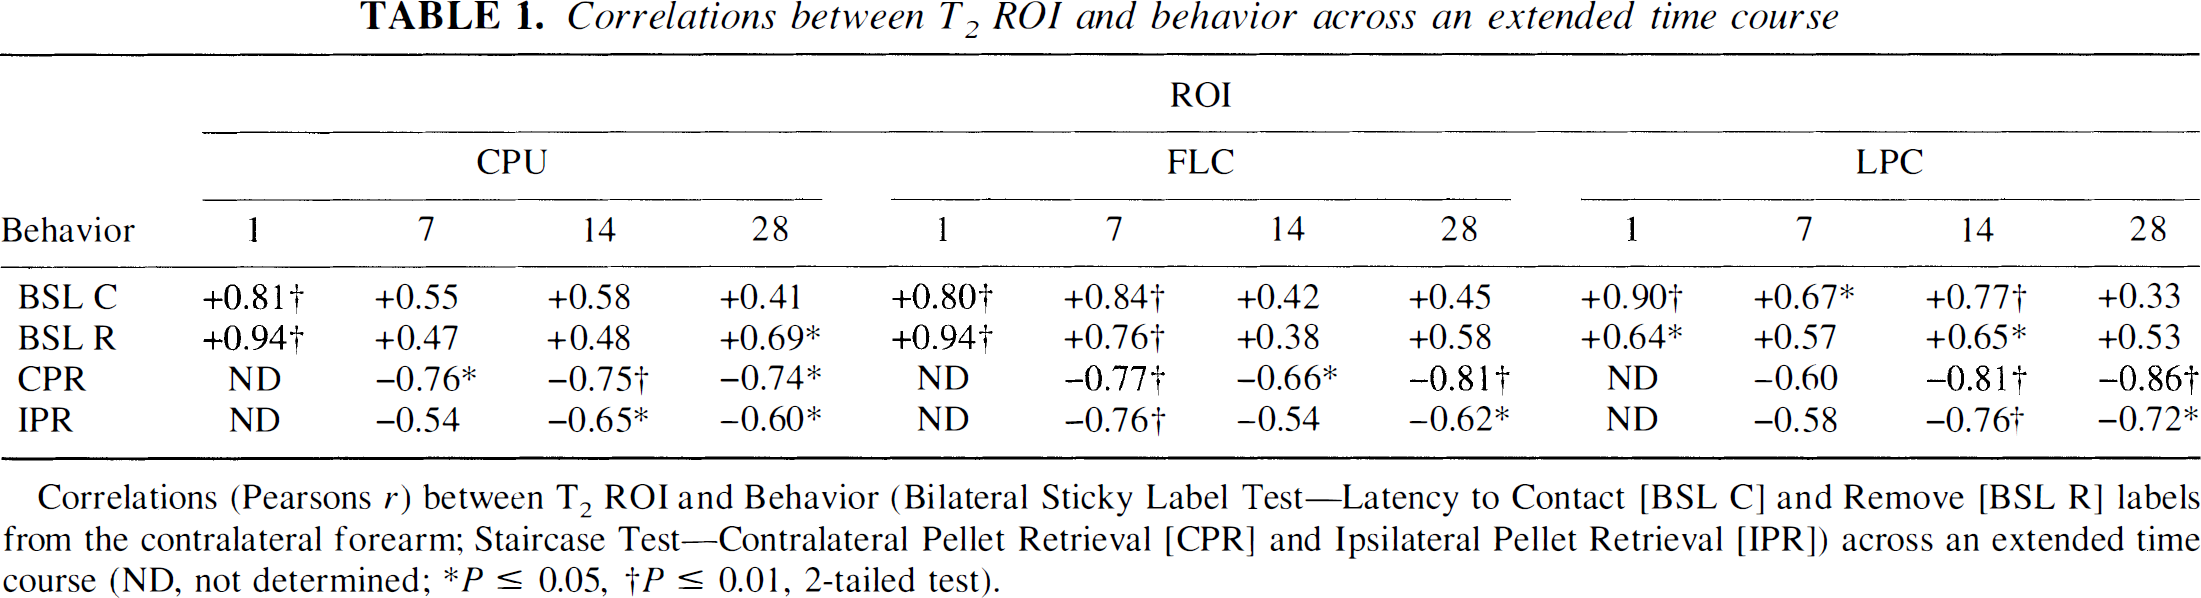
Correlations (Pearsons r) between T2 ROI and Behavior (Bilateral Sticky Label Test—Latency to Contact [BSL C] and Remove [BSL R] labels from the contralateral forearm; Staircase Test—Contralateral Pellet Retrieval [CPR] and Ipsilateral Pellet Retrieval [IPR]) across an extended time course (ND, not determined;
P ≤ 0.05,
P ≤ 0.01, 2-tailed test).
Correlations between ADC ROI and Behavior across an extended time course
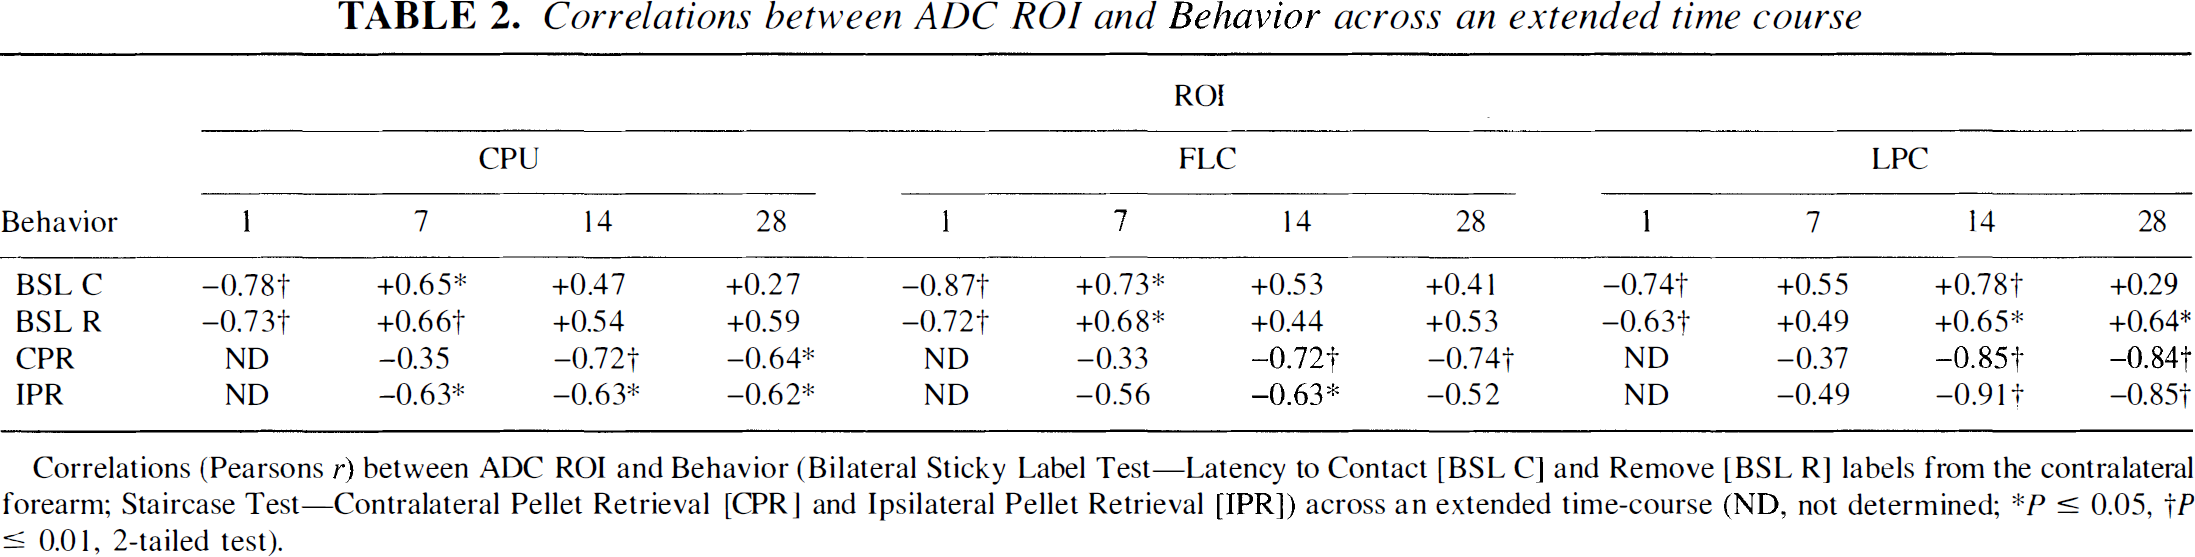
Correlations (Pearsons r) between T2 ROI and Behavior (Bilateral Sticky Label Test—Latency to Contact [BSL C] and Remove [BSL R] labels from the contralateral forearm; Staircase Test—Contralateral Pellet Retrieval [CPR] and Ipsilateral Pellet Retrieval [IPR]) across an extended time course (ND, not determined;
P≤ 0.05,
P≤0.01, 2-tailed test).
Correlations (Pearsons r) between HLC and beam walking (total distance traveled [DT]) using T2 and ADC values, across an extended time-course
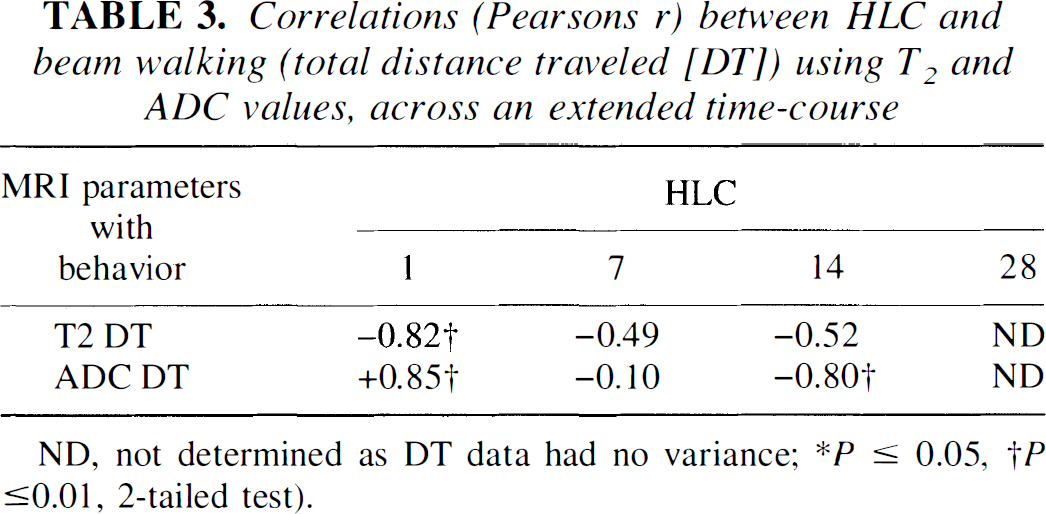
ND, not determined as DT data had no variance
P≤ 0.05
P ≤ 0.01, 2-tailed test).
Hierarchical multiple regression analysis.
Hierarchical regression analyses demonstrating the contribution made by the LPC from T2 and ADC maps in explaining the variance of contralateral pellet retrieval (CPR) and ipsilateral pellet retrieval (IPR) on the staircase test across the time-course
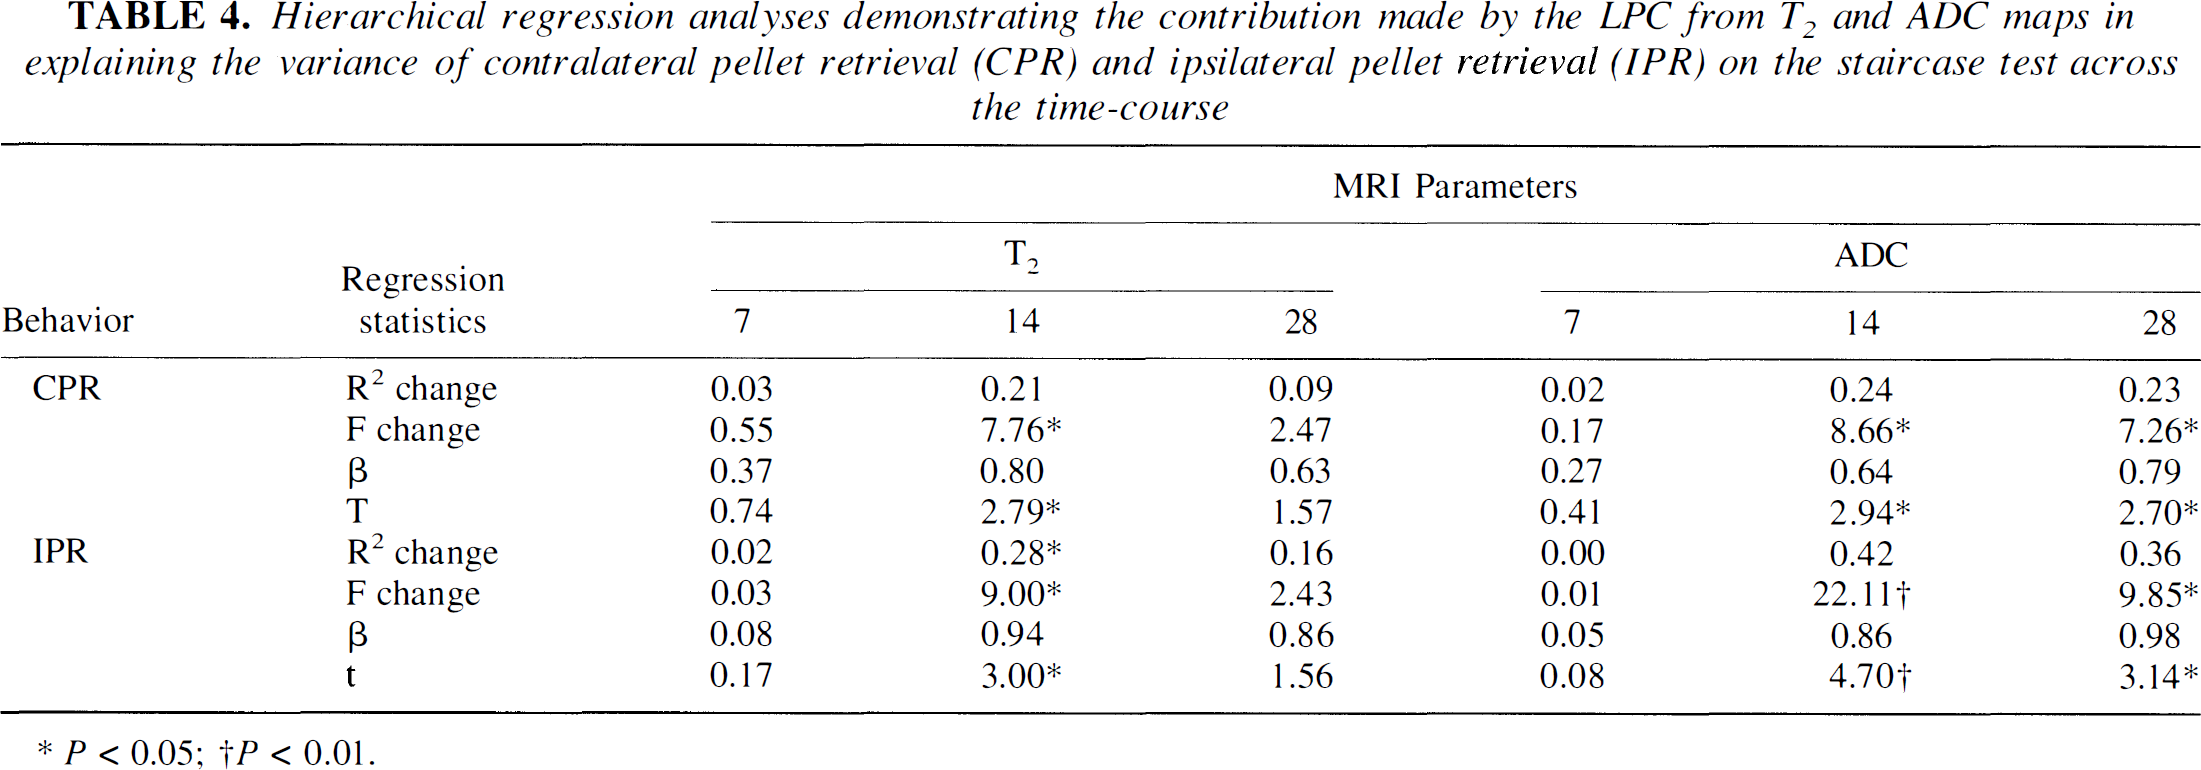
P≤ 0.05
P ≤ 0.01.
Histopathologic assessment
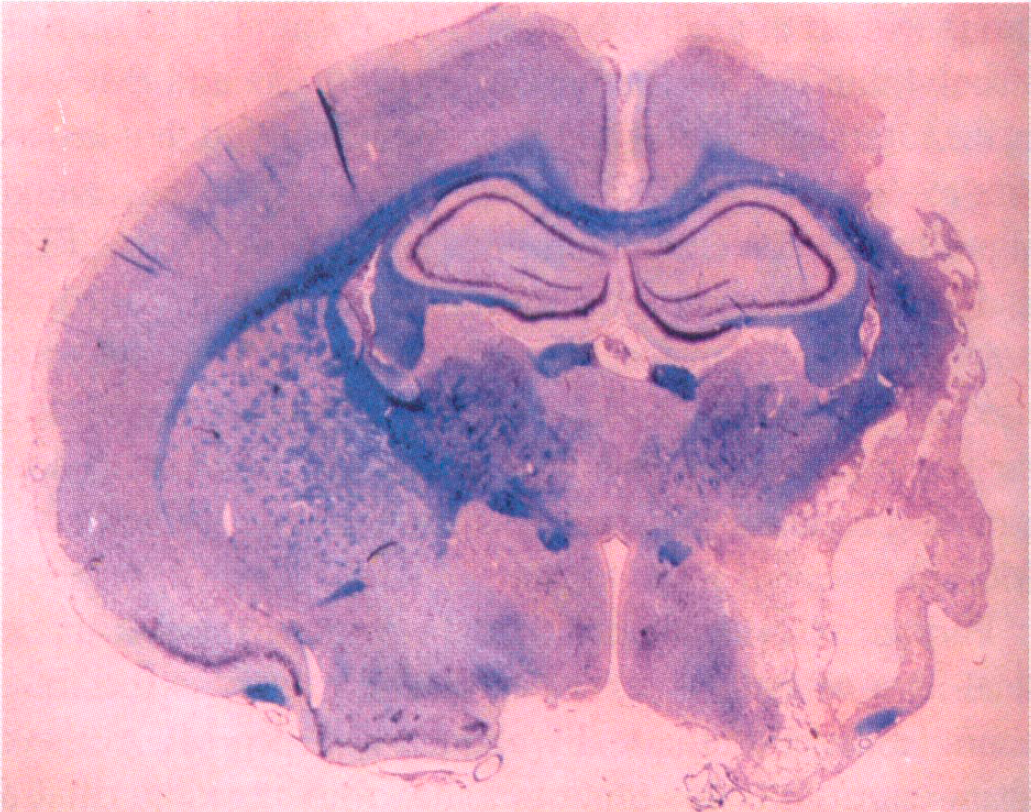
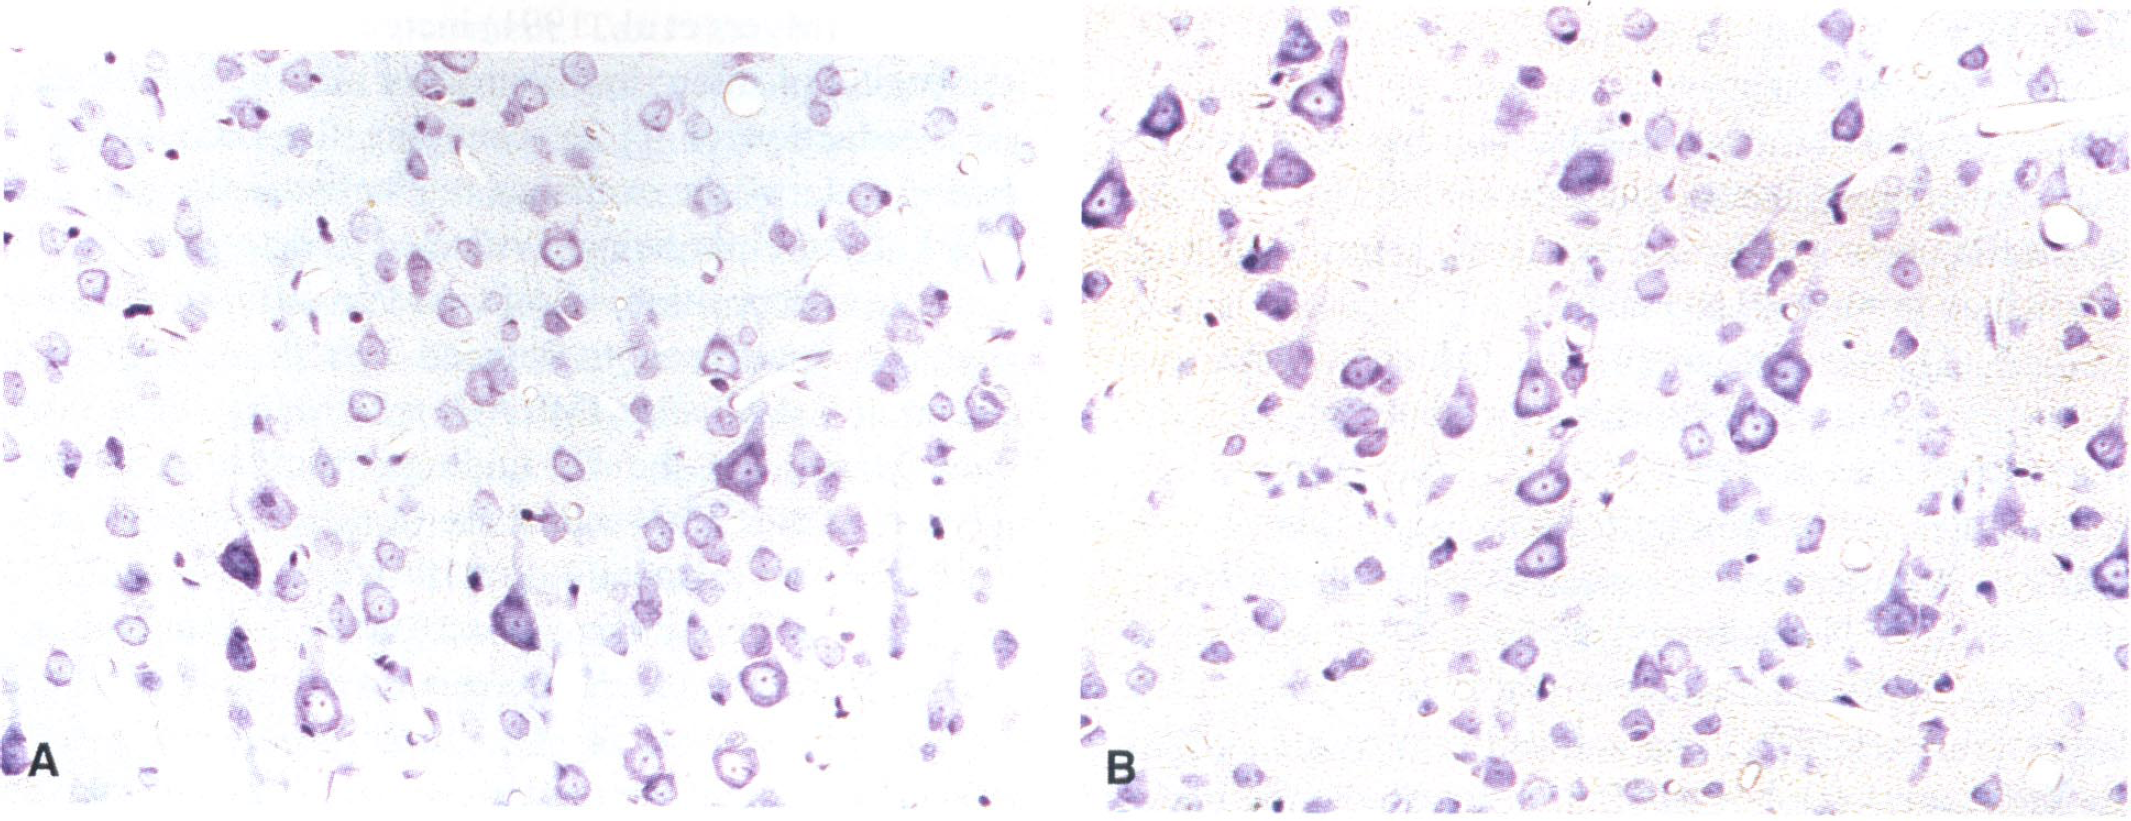
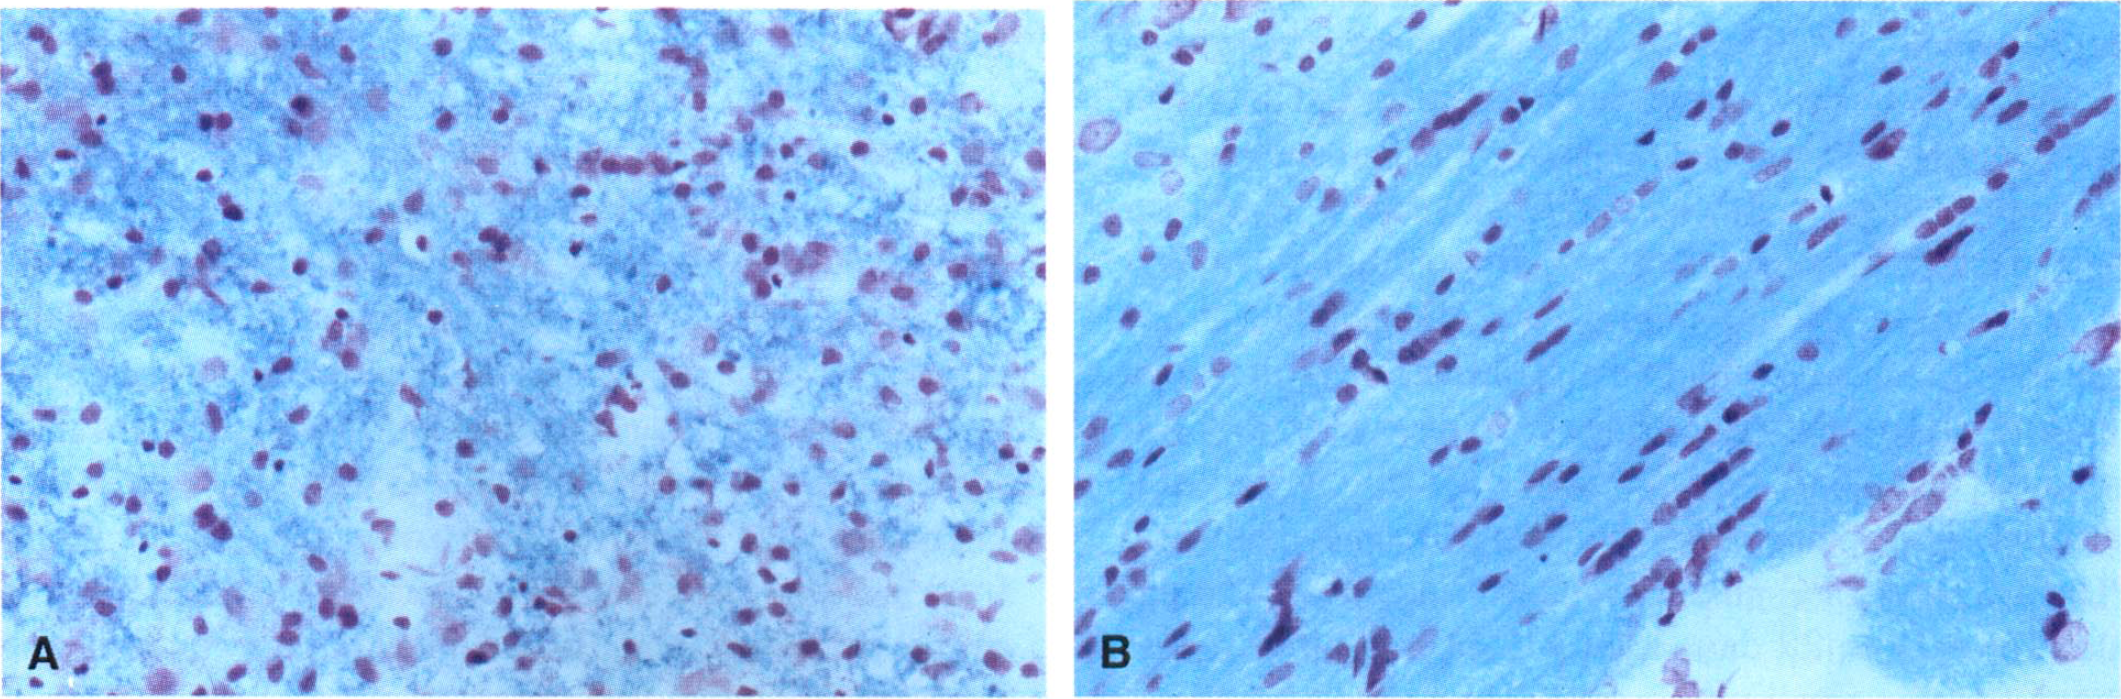
At 28 days post-MCAO, all MCAO animals demonstrated a large unilateral region of infarction that extended from the FLC to the lower regions of the parietal cortex (LPC) which encompassed the underlying striatum (CPU) (Fig. 8), as represented by scattered cells with pyknotic nuclei and eosinophilic-like cytosol. A large fluid-filled cyst had been formed, signifying cavitation, presumably occupying previously necrotic tissue, which was surrounded by a loose connective tissue matrix which aligned the superficial aspect of the lesion. This profile of damage was also apparent surrounding the ipsilateral HLC (Fig. 9), although the ipsilateral HLC itself was demonstrated to retain structural integrity at 28 days after insult and was visually indistinguishable from the contralateral HLC under higher magnification (× 20: Figs. 10A and 10B). Loss of Luxol-fast blue staining was noticeable within the subcortical white matter, relative to the contralateral side, indicative of disorganized myelinated fiber tracts (Fig. 8). This was also further highlighted in the corpus callosum where disrupted organization was apparent within the ipsilateral hemisphere (Fig. 11A) unlike the equivalent area in the contralateral hemisphere (Fig. 11B). No sham-operated control animals showed any evidence of lesion development at 28 days, corroborating the MRI findings.
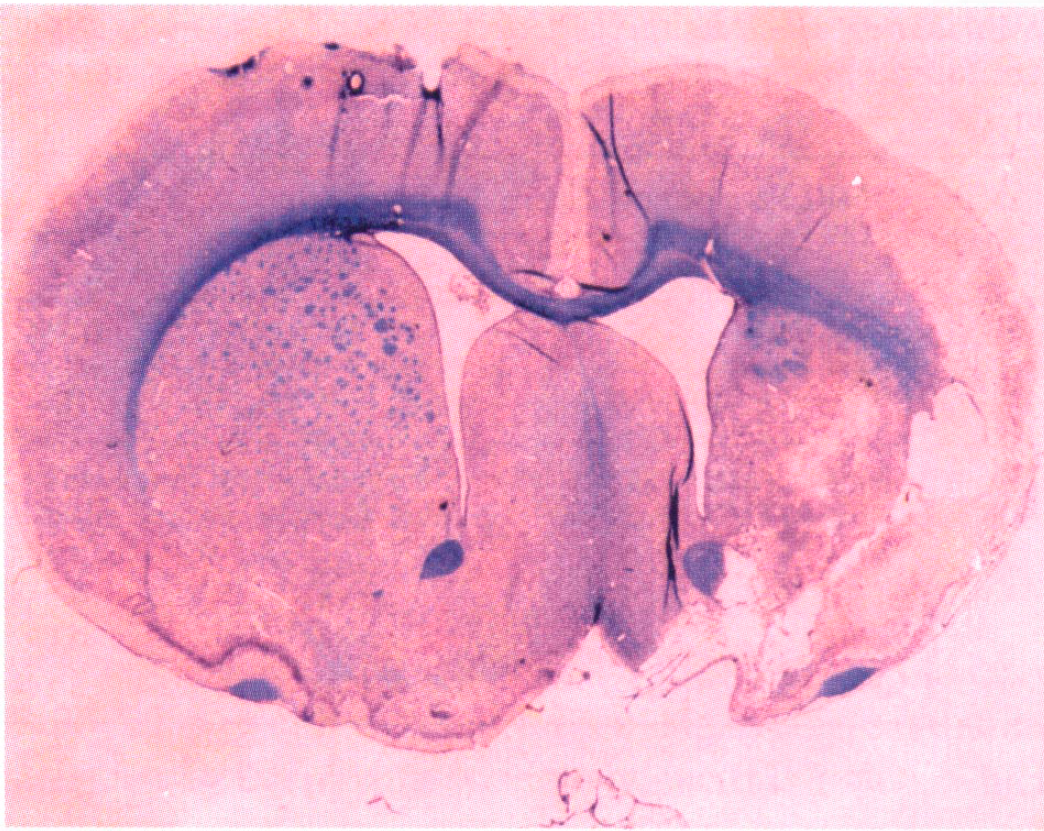
Photomicrograph of cavitation that extends from the ipsilateral dorsolateral cortex (FLC) to the LPC and underlying CPU, visualized by cresyl violet/Luxol fast blue staining. The level is at approximately −0.3mm from bregma, at 28 days after MCAO, in the representive MCAO rat used for the MR images in Fig. 1A (magnification, × 1).
Photomicrograph at the level of ipsilateral HLC, approximately −1.8 mm from bregma, visualized by cresyl violet/Luxol fast blue staining at 28 days after MCAO in the representative MCAO rat used for MR images in Fig. 1 (magnification, × 1). Notice the cavitation surrounding the edge of the ipsilateral HLC, which is depicted as hyperintensity on T2W images in Fig. 1B.
DISCUSSION
This long-term study has delineated dramatic changes in the temporal profile of absolute T2 and ADC MRI measures after transient MCAO in the rat. To date there have been few published reports that attempt to study extended survival time after the MCAO thread model in the rat, despite a growing interest in potential therapies based on enhancing recovery/regeneration (Jiang et al., 1996; Kawamata et al., 1997, 1998; Stroemer et al., 1998). This study is the first of its kind to address the issue of correlating specific regional areas delineated by MRI with functional outcome. This serial approach is essential for assessing the pathophysiologic and potential plastic events that ensue after stroke and in combination with functional outcome generates crucial information that can be extrapolated from the preclinical (animal model) to the clinical situation.
MRI changes
Our results demonstrate that the size of the lesion initially reduces from 1 to 7 days but remains constant in size from 7 to 28 days after MCAO using a strict threshold criterion. Sham-operated control rats showed no evidence of infarction on MR images (no hyperintense signal intensity on T2W images) from 1 to 28 days, and no pathology was revealed by cresyl violet/Luxol fast blue staining at 28 days (data not shown). Brain edema has been demonstrated to evolve from 6 hours to 7 days after ischemic insults (Hsu et al., 1989) and correlates with behavioral impairment (Tominaga and Ohnishi, 1989; Rogers et al., 1997) which may have enhanced the overall apparent percentage total lesion volume visualized by T2WI at 1 day. Lesion size did not significantly differ at 7, 14, and 28 days after tMCAO while the longitudinal extent of the lesion did not differ across the extended time course of the study, suggesting that total lesion maturation had developed by 7 days after tMCAO. In contrast to the results of this study, Persson et al. (1989) have demonstrated that the infarct area of rats subjected to pMCAO was larger during the first week and then subsequently decreased in size, as a percentage of the contralateral area, at 42 days after insult, using hematoxylin and eosin staining. Furthermore, Clark et al. (1993) have demonstrated that infarct size was maximal at day 1 post-pMCAO in spontaneously hypertensive rats and subsequently decreased in size at days 5, 15, and 30 postinsult, as a percentage of the contralateral hemisphere, using 2, 3, 5-Triphenyltetrazolium hydrochloride (TTT)-stained sections. However, our MRI assessment of lesion size reduction does correspond to that of Clark et al. (1993), in that a reduced total lesion size was demonstrated at 7 and 28 days when compared to 1 day after MCAO. The reduction in lesion size has been proposed by Clark et al., (1993) as a four-stage organizational matrix of tissue events from 1 to 30 days after pMCAO in which the lesion was characterized by a reduction of edema to resolution of ischemic tissue. Our study measured total lesion size on MR (T2-W) images as the total area of hyperintensity divided by the total area of the cerebral hemisphere on individual slices that encompassed the whole of the cerebrum, rather than a percentage of the contralateral hemisphere. In this respect taking into account the different surgical approaches (pMCAO versus tMCAO), models (electrocoagulation versus intraluminal thread), and obvious differences in severity and methods of quantifying lesion size, overall estimates of lesion size only differ among studies on the basis of magnitude and not in terms of the direction of change. Therefore, future studies should include comparisons between orthodox histopathologic staining techniques and MRI at the different time points that relate to the chronic phase of ischemia in order to verify the methods used for analysis. However, both Barone et al. (1991) and our group (Smart et al., 1996) have already published on this issue within the acute phase after pMCAO and tMCAO in the rat, respectively, and have demonstrated that lesion size evaluated by T2WI at 48 and 22 hours, respectively, significantly correlated with lesion size assessed by TTC and hematoxylin and eosin staining at the respective end points. We are therefore confident that the MRI methods used by our group for assessing lesion size are measuring the same pathology revealed by commonly used histopathologic staining methods within the acute period after MCAO.
Further assessment of our data demonstrated that the total area of both cerebral hemispheres across the time course did not dramatically change between MCAO and sham-control groups (data not shown), suggesting that a decrease in swelling may not have been the cause of a reduced lesion volume defined by T2W hyperintensity at 7 days. These results are in contrast to those of Persson et al. (1989) and Fujie et al. (1990) who demonstrated that the ipsilateral hemisphere (defined as tissue reduction area + infarct area) and ipsilateral thalamus were reduced relative to the percentage of the respective contralateral area using hematoxylin and eosin staining methods. In our total cerebral hemispheric area calculations we included the regions of ipsilateral hemisphere that were damaged as a result of MCAO, from 1 to 28 days, in order to make consistent comparisons between total hemispheric area of tMCAO and sham-operated control rats. An appropriate alternative that should be adopted in future studies would have been to acquire preoperative scans of these animals, which would provide a useful baseline “unaffected” measurement for total cerebral area that could be implemented for later determinations of lesion size and hemispheric swelling (by means of T2W hyperintensity) after insult. Several other factors should also be taken into account when trying to interpret the apparent reduction in lesion size and hence reduced T2-hyperintensity at 7 days after tMCAO. One important factor is the role of reperfusion in this model after 90 minutes of occlusion, as retrograde flow from the complete circle of Willis may have “salvaged” penumbral regions, particularly cortical areas at later time points, e.g., the HLC, as verified by absolute T2 and ADC map analysis. Indeed assessment of the critical threshold or duration for inducing irreversible ischemic injury after tMCAO, using the thread technique, was first demonstrated by Memezawa et al. (1992a, b ). Essentially they showed that if reperfusion was initiated early enough after MCAO (up to 90 minutes of MCAO) the penumbral areas were spared, whereas reperfusion initiated after 2 hours of ischemia failed to salvage ischemic tissue when assessed histopathologically, 7 days after MCAO. Clearly one must also consider interanimal differences in collateral blood supply, because variability in perfusion dynamics, as well as the “no-reflow” phenomenon, may ultimately determine regions that are more tolerant than others after reperfusion. In addition, when using the diagnostic modality of T2WI one must also take into account that a reduction in T2 may be explained by the paramagnetic influence of iron accumulation (Lang et al., 1994; Schwartz et al., 1996; Nakane et al., 1997), increased gliosis (Schwartz et al., 1996; Ishii et al., 1998), and a decrease in vasogenic edema (Welch et al., 1995). Indeed, a recent study by Ishii et al. (1998) compared changes in T2W imaging with microtubule-associated protein-2 (MAP2) and glial fibrillary acidic protein (GFAP) immunohistochemical staining for estimating lesion size at 6 to 8 hours and at 7 days after MCAO (rat tMCAO for 2 hours). It was demonstrated that at 7 days the lesion visualized by MRI reduced in conspicuity, confirming our results with T2W images, and this signal decay was attributable to an increase in glial infiltration around the periphery of the infarct. Attenuating T2 signal intensity may thus alter the true estimation of lesion size which can only be substantiated by a time series of histopathology in conjunction with immunocytochemical markers for neurons and glial cells, to determine the contribution of different cell types to the observed MRI signal intensity. The work by Ishii et al. (1998) also highlights the fact that assessing lesion size on the basis of hyperintensity by T2W imaging alone may partially underestimate the ensuing infarction at 7 days which implies ROI analysis using absolute values should be adopted to help resolve this issue. This is also apparent in the clinical situation, in which reduced T2 signal intensity from 5 to 12 days is observed in patients with MCAO territory infarction (Periera et al., 1997), suggesting that if MRI scans are performed for diagnostic purposes around 7 days, reliance on T2W imaging may result in the diagnosis of cerebral infarction being missed or the size of the infarct being underestimated.
Regional assessment of the severely damaged CPU using T2 maps demonstrated that absolute T2 relaxation times significantly increased across the time course, which has been traditionally considered the “core” of the infarct. This elevation suggests edema and cell necrosis within the acute period was followed by gliosis and cavitation during the subacute to chronic period. The T2 of tissue is dependent on tissue water, which is distributed between the intracellular and extracellular compartments, and in each compartment exists in either a bound or a free state (Lynch, 1983; Mathur-De Vr'e, 1994). Free water has a much higher T2 than bound water suggesting that an increase in T2 relaxation times is indicative of an increase of free water and a reduction in the exchange rate between free and bound protons, arising from the pathological sequelea of cerebral ischemia (Ordidge et al., 1991). Acute decreases in ADC were also demonstrated in the CPU consistent with a contribution from cytotoxic edema. The biophysical basis of reduced diffusion has been viewed as a decrease in extracellular space (Hasegawa et al., 1996) because of a buildup of intracellular water from membrane failure and cell swelling. Increased tortuosity of extracellular diffusion paths (Nicholson et al., 1993) has also been postulated, although reductions in intracellular diffusion by means of cytoplasmic streaming or alterations in the intracellular tortuosity may also play a part (Duong et al., 1998; Dijkhuizen et al., 1999). ADC reductions have also been interpreted as being attributable to the swelling of astrocytes, mainly involving their perivascular processes, as well as the narrowing of the microvascular lumen and shrinkage of the neuronal perikarya, suggesting a complex interplay between cellular compartments and the diffusion of water (Liu et al., 1999). ADC values were then shown to transiently normalize at 7 days (pseudo-normalization) followed by a progressive increase from 14 to 28 days after MCAO. Pseudonormalization of ADC has been considered to reflect the emergence of eosinophilic neurones and the start of neuronal necrosis when conducting end point histopathologic examinations (Garcia et al., 1993; Welch et al., 1995). The subsequent rise in ADC during the chronic phase has been postulated to indicate loss of membrane integrity and cell necrosis as the CPU progresses from edema to gliosis and then to cyst formation and cavitation, as revealed by light (Takahashi et al., 1993) and electron (Pierpaoli et al., 1993) microscopy. The histologic profile of cavitation was clear at 28 days after MCAO as illustrated by Nissl stained sections (Fig. 8).
Changes in T2 relaxation times and ADC were also apparent for the ipsilateral FLC and LPC across the time course reflecting a similar profile to the CPU. These regions traditionally viewed as penumbral or perifocal areas, adjacent to the core of the infarct, demonstrated progressive increases that were greater in magnitude than the CPU across the time course. These results suggest an accumulation of water within the extracellular space of the ipsilateral FLC and LPC, culminating in cavitation through the formation of a loose connective tissue matrix filled with necrotic debris (Chen et al., 1993; Clark et al., 1994). This was verified by Nissl-stained sections acquired at 28 days after MCAO (Fig. 8). Hence these regions were recruited to the lesion by the infarction process across the extended time course. The differences in magnitude between the CPU and other ROI may be explained by a heterogeneous mixture of grey and white matter within the CPU (particularly the striasomes) thus altering signal characteristics.
The HLC demonstrated high T2 relaxation times and reduced ADC values on day 1 after MCAO, suggesting an impending threat of edema. Conversely, T2 and ADC values normalized at 7 days and remained at contralateral and sham control levels up to 28 days after MCAO, implying that this region was potentially “salvaged.” A number of factors may account for this apparent “recovery” of challenged tissue, such as reperfusion and the role of collateral supply, particularly the anterior cerebral artery which perfuses this anatomic region in addition to the MCA. The neurons within the ipsilateral HLC are presumably “stunned,” perturbing metabolism, but some restorative process may then play its part (e.g., metabolic compensation or a trophic influence) to provide enough support to sustain viability. Indeed, histopathologic examination using Nissl-stained sections of the ipsilateral HLC suggests that it remained viable at 28 days after MCAO (Figs. 10 and 11A) and did not visually differ from the contralateral HLC (Fig. 11B). Recently, it has been demonstrated that there is no single threshold of ADC reduction that predicts irreversible ischemic injury after variable occlusion times for tMCAO (30, 60, and 90 minutes) in the rat (Mancuso et al., 1997). This suggests that although the reduced ADC occurs in regions that will eventually exhibit ischemic injury, the extent of the ADC reduction is not necessarily related to the likelihood of cell death. Therefore, ADC maps generated within the immediate acute period of ischemia may not be useful to quantitatively predict postreperfusion outcome based on only the magnitude of the ADC reduction. Furthermore, differences between acute changes in ADC, regional water content, and tissue ultrastructure have recently been defined in a cat MCAO model (Kuroiwa et al., 1998). Essentially, the authors found that a significant reduction in ADC was seldom associated with cell membrane disruption or nuclear clamping, which are direct indicators of irreversible injury, implying that the early determination of an ADC threshold value for irreversible ischemic injury is difficult. Alternatively, it may be postulated that ADC changes are useful in providing definitive information about the presence of cellular edema within the acute period, but if assessed serially and in combination with other MR signatures over time delineation of the dynamic changes of ischemic tissue can be optimally identified. Therefore, these results indicate that long-term regional assessment of changes using serial MRI and conventional histopathologic staining methods are necessary to predict irreversible ischemic injury and potentially salvageable tissue.
An important supplementary observation is that of a reduction in T2 relaxation times at 7 days after MCAO compared to 1 day after MCAO in each of the ROI evaluated. It is clear from the data that the ipsilateral CPU, FLC, and LPC all subsequently increased in magnitude from 14 to 28 days after MCAO. Again possible reasons for this apparent signal decline could be attributable to factors already explained, i.e., the role of iron deposition, gliosis, and/or reduced vasogenic edema. It is also possible that the infiltration of the infarct by macrophages (Myers et al., 1991) increases the cell density in the region of infarction (Petroff et al., 1992) that results in a reduction of T2 by changing the ratio of free to bound water or the exchange rate between the two states. Work is currently being conducted to determine whether ferric iron deposition, gliosis, and/or infiltration of macrophages contributes to reduced T2 relaxation times depicted at 7 days after tMCAO, which may have significant bearing on the T2 findings from stroke patients (Periera et al., 1997) indicative of a T2 “fogging” effect.
PD map assessment did not prove to be as valuable a marker of ischemic damage across the time course as T2 and ADC measures. PD images reveal the spatial distribution of a number of MR-visible proton nuclei in the tissue, and significant elevations in PD have only become apparent at 48 hours after pMCAO, which subsequently declined to normal levels at 7 days, particularly within the CPU and penumbral regions (Knight et al., 1991, 1994). Our study has demonstrated significant elevations within the CPU at 14 and 28 days after tMCAO but not consistently in other ROI, implying that although the different MR signatures have distinct temporal profiles (Knight et al., 1994), at later time points PD may be more representative of T2 and hence edema in severely damaged regions (such as the “core” or CPU). However, the reason that PD measurements did not prove valuable could be attributable to the fact that we were actually looking at very small-intensity ratio changes between the ipsilateral and contralateral hemispheres, and with a small group size statistical validation was proven to be too insensitive. In addition, a 2-point T2 curve fit was used to derive PD maps, so further values plotted on an exponential curve would provide a more representative signal intensity when evaluating the tissue maps.
Correlations with behaviour
Functional assessment involving the bilateral sticky label test demonstrated a marked disruption followed by a slight improvement in the latency to contact and remove sticky labels from the contralateral forearm, indicating contralateral neglect. In addition, when interpreting the order of contact and removal of labels it was clear that the ipsilateral stimulus was always contacted first throughout the time course of testing regardless of latency, suggesting a long-lasting impairment in ipsilateral bias and contralateral neglect. This test has been shown to be sensitive in detecting sensorimotor deficits in rats after permanent MCAO (pMCAO), although recovery in latencies have been found in some but not all animals from 20 days after MCAO (Markgraf et al., 1992). Recently, Marshall and Ridley (1996) have demonstrated recovery in latency to contact and remove labels from 3 to 8 weeks after pMCAO in the common marmoset. However, an ipsilateral bias/contralateral neglect was evident when analyzing the order of contact data, suggesting a persistent impairment. Tests that can be implemented easily in this manner enable cross-species comparisons to be made, and this is highlighted by the fact that a subpopulation of clinical stroke patients show tactile extinction from 1 to 6 months after MCAO, with varying degrees of recovery which can predict functional status. Indeed, the contralateral neglect observed on this behavioral task has striking similarities to the contralateral neglect syndrome arising from damage to the parietal cortex in humans (Heilman et al., 1985). Correlations between T2/ADC ROI and latencies to contact and remove labels suggest that the ipsilateral CPU, FLC, and LPC make significant contributions to the functional impairments observed across the time course in this study. This overlapping association is consistent with data derived from selective lesions to each of these areas on contralateral neglect and ipsilateral bias behavioral profiles (Cooper et al., 1979; Price and Fowler, 1981; Schallert et al., 1982; Jones and Schallert, 1992; McDaniel et al., 1995; Forgie et al., 1996) and further substantiates the concept of topographically organized striopetal connections from the cortex (Pisa, 1988; Pisa and Cyr, 1990).
Impairments demonstrated by MCAO rats on the staircase test were bilateral in nature, as both contralateral an ipsilateral paw reaching performance was disrupted. The contralateral deficit was more marked, although significant bilateral deficits suggest that there is possible dysfunction in interhemispheric communication (Marston et al., 1995). The fact that target location was severely impaired on the contralateral side is further corroborated by minimal pellet displacement suggesting a role for spatial neglect of contralateral stimuli as well as a deficit in olfactory/tactile sensing or tactuomotor control of fine motor movements. Indeed, pellets placed on the highest steps were often left untouched. Pellet displacement was more marked on the ipsilateral side suggesting that animals were motivated and preferred the use of the ipsilateral forearm in retrieving pellets yet were ineffective in grasping ability. Immunohistochemical analysis using GFAP and RCA-1 (riccinus communis agglutin-1) markers for astrocytes and microglia, respectively, have shown increased expression in both the ipsilateral contralateral corpus callosum indicative of gliosis and edema at 28 days after MCAO, which could partially explain the hypothesis of a deficit in interhemispheric communication (D. Virley, in preparation). Furthermore, Luxol fast blue staining demonstrated disrupted white matter cytoarchitecture for the striasomes and corpus callosum within the ipsilateral hemisphere, which can been corroborated as axonal injury that has been demonstrated within the acute period after focal cerebral ischemia (Dewar and Dawson, 1997; Yam et al., 1998). Recently impaired dexterity of the ipsilateral hand after stroke has been revealed within the first month for stroke patients who possessed lesions that encroached on the left or right parietal lobe, which was predicted by cognitive (ideomotor apraxia and visuospatial) deficits, affecting perception and control of action (Sunderland et al., 1999). However, ipsilateral sensorimotor loss as well as deficits at the higher cognitive level may be viewed to affect the execution of skilled-motor control of the ipsilateral hand by means of disruption of the ipsilateral motor pathway (Jones et al., 1989; Desroisiers et al., 1996).
Bilateral impairments on the staircase test have also been reported in an alternative transient MCAO model, the endothelin-1 surgical technique (Marston et al., 1995; Sharkey et al., 1996) as well as unilateral lesions of the nigrostriatal (Whishaw et al., 1986, 1992) and cortical (Price and Fowler, 1981; Montoya et al., 1991; Plumet et al., 1990) projections. A pMCAO model using spontaneously hypertensive rats has also demonstrated a marked impairment in contralateral paw reaching which was worse than the ipsilateral side, although comparisons with results obtained by Marston et al. (1995) have indicated differences in strain of rat as well as lesion size and surgical approach in determining performance on this task. Contralateral deficits have also been observed with pMCAO in the marmoset, both on a standard (“Hill”) and modified reverse (“Valley”) staircase, demonstrating a spatial and fine-motor impairment that was persistent throughout postoperative testing (Marshall and Ridley, 1996). Within the clinical context there is often significant recovery in gross larger limb movement although more fine control of finger movement is often persistently affected and leaves a lasting disability. Correlations between ipsilateral T2/ADC ROI and contralateral paw reaching, as well as ipsilateral paw reaching, again suggest that the ipsilateral CPU, FLC, and LPC all make significant contributions in predicting behavioral impairment on the staircase test. However, hierarchical regression analyses revealed the ipsilateral LPC to be most predictive of contralateral and ipsilateral paw reaching impairments. This result can be reconciled with the notion that unilateral cortical damage can produce bilateral deficits unlike unilateral striatal lesions which produce primarily unilateral (contralateral) deficits (Marston et al., 1995). The cortical output projections in rats, unlike humans, are not fully decussated (Tracey, 1995), implying that the data presented by this study is highly compatible with unilateral neocortical damage. Furthermore, the parietal cortex has recently been implicated as the control center for reaching movements, in that spatial representations of limb position, target locations, and the potential execution of motor actions are expressed as neural activity within this region (Kalaska et al., 1997).
Beam walking as defined by total distance travelled was severely impaired in MCAO rats from 1 to 7 days after MCAO. This was because of a contralateral hindlimb-placing deficit that prevented the animals from initiating movement across the narrow elevated beam. Indeed, MCAO animals tended to fall off the beam more readily, on average within 2 minutes over the first 2 days, but maintained balance from 3 days onwards (data not shown) although still hindered by the placing impairment. Photochemical damage to the sensorimotor cortex that encompasses the HLC of rats has been shown to produce selective and long-lasting deficits in tactile and proprioceptive limb placing (De Ryck et al., 1989, 1992; De Ryck, 1997) which is consistent with the results obtained from the acute to subacute period of this study. Contralateral hindlimb placement recovery was evident from 14 to 28 days after MCAO as total distance travelled improved to the sham-operated control level. De Ryck et al. (1992) has stated that rats with sensorimotor cortical damage will not demonstrate contralateral hindlimb-placing errors if they are engaged in bursts of rhythmic locomotor running without exploratory head scanning on narrow beams. However, tMCAO rats from 14 to 28 days in this study did not always run straight across the beam but also stopped halfway for exploratory activity and still maintained posture to complete the task. Some animals repeated the task from the safe location, actively exploring the exposed start-end of the beam before returning to finish-end of the beam. This is in direct contrast to De Rycks's observation of rats that show impairments on the beam after sensorimotor cortex lesions when locomotor automatism is interrupted. The recovery in beam walking mirrors the normalized T2 and ADC values acquired from the ipsilateral HLC at 14 to 28 days after MCAO relative to sham control values, suggesting that we are either witnessing reduced regional cell death or directly observing the salvaging of tissue with a preserved functional integrity. Histopathologic inspection of the ipsilateral HLC using Nissl-stained sections at 28 days after MCAO demonstrates normal cell viability, further implying that this region does recover (Fig. 10A). Indeed, correlations between beam-walking measures and MRI signatures were no longer apparent from day 7 to 28 after MCAO, implying that behavioral recovery was related to normalized MRI values within the ipsilateral HLC, other than at day 14 for ADC changes, suggesting that behavioral recovery was not quite complete in all animals and that ADC values for some animals were slightly higher. In addition, at 14 days T2 values within the contralateral HLC were significantly different from the ipsilateral side in MCAO animals, unlike the ipsilateral side in sham controls, tentatively suggesting that some physiologic changes were being elicited within this contralateral region at the start of behavioral recovery on this task. Hence, one must also consider the role of “plasticity” and structural reorganization of areas involved in contributing to functional restitution on this task.
The precise anatomical, cellular, and molecular mechanisms of functional recovery after stroke remain unknown. In both rodent and nonhuman primate studies, recovery of sensorimotor function after unilateral cortical injury or distal pMCAO is accompanied by new neuronal sprouting and synapse formation in adjacent or penumbral regions surrounding focal infarcts as well as in regions within the contralateral hemisphere (Jones and Schallert, 1992, 1994; Stroemer et al., 1995, 1998; Nudo et al., 1996). From a clinical perspective, functional imaging techniques (functional MRI and positron emission tomography) have demonstrated increased cerebral blood flow and metabolism in intact regions surrounding focal cerebral infarcts and within the contralateral hemisphere in parallel with functional recovery in stroke patients, most likely reflecting increased neuronal activity within these regions (Weiller et al., 1992, 1993; Cramer et al., 1997). This evidence suggests that changes within the ipsilateral penumbral regions of the focal infarct as well as in the corresponding contralateral regions play an influential role in improving the functional impairments that ensue after stroke. This study has demonstrated that the ipsilateral HLC is a penumbral region adjacent to the focal infarct, which recovers in terms of MRI signal characteristics (T2 relaxation times and ADC) and which contributes to the behavioral recovery on the beam-walking test. The contralateral hemisphere may have been involved with this recovery of hindlimb function, because in the rat the cortical output projections are not fully decussated (Tracey, 1995) suggesting that the intact contralateral cortex may have influenced recovery on this test. Furthermore, Johansson and Ohlsson (1996) have demonstrated improvement on the beam-walking task using a subjective grading scale, with spontaneously hypertensive rats subjected to proximal pMCAO and subsequently housed in an enriched environment. The actual compensatory mechanisms that may be stimulated by an enriched environment have not been examined in any great detail, although in our study the tMCAO rats tested on a daily basis may have experienced a stimulating environment to enhance mechanisms of plasticity in the brain (either ipsilateral or contralateral to the infarct) to improve hindlimb function. However, tMCAO rats persistently demonstrated a contralateral neglect/ipsilateral bias on the bilateral sticky label test and bilateral deficits in skilled forelimb paw reaching on the staircase test. This suggests that even if the daily testing schedule may have provided an enriched environment, contralateral neglect and skilled paw reaching were still severely impaired unlike beam walking. De Ryck et al. (1992) have demonstrated that after unilateral total destruction of the forelimb and parietal cortex, forelimb-placing deficits in the rat do not recover. These findings are consistent with damage to the FLC and LPC in our study, as assessed serially by MRI and terminally by histopathological staining, which were also predictive of forelimb functional deficits. Therefore, an enriched environment may have influenced recovery/compensatory mechanisms within the ipsilateral HLC as demonstrated by MRI and behavior on the beam-walking test, but it certainly did not alter performance on tests probing forelimb function.
More studies are now using functional assessments in conjunction with pathological assessment in permanent and transient MCAO models although correlating lesion size with the degree of impairment is not always clear-cut. Previous studies have assessed functional outcome after MCAO in the rat by incorporating the Bederson neurologic scoring system. We included this scoring system into our experimental design as a relative grade of neurologic deficit but found that more objective tests successfully detected transient or protracted impairments across the time course which are not readily accessible by this simple postural reflex test. Some studies have shown correlations between lesion volume and more objective behavioral tests (Rogers et al., 1997) although because there has also been a lack of correlation across studies we feel a more regional approach would be more sensitive at picking up structure to function relationships. Correlating total lesion size with functional impairment only makes the assumption that the degree or extent of damage associates with the behavioral deficit. In addition, this assumption does not attempt to identify specific structures that may fulfill the specific functions that are being probed by the behavioral task. The importance of selective lesion studies in animals has established the crucial relationship between specific or regional brain damage and specific impairments in behavioral performance. The behavioral tasks are designed to yield information concerning distinct components of behavior that are potentially disrupted by the experimental lesion. Furthermore, Gavrilescu and Kase (1995) have stated that depending on the location of the infarct, clinical syndromes vary in stroke patients, implying that functional impairment is a feature that is contingent on the degree of compromised flow within a particular portion of the vascular territory. Indeed, Gavrilescu and Kase (1995) also highlighted the role MRI and CT scans play in improving our understanding of correlations between the anatomic substrates recruited by the infarction process and the neurologic status of the individual stroke patient. Taking into account these perspectives, our study aims to follow these recommendations by using a regional approach to make sensitive relationships between brain structure and behavioral function. Therefore, this study highlights the fact that specific anatomical substrates recruited by the infarction process rather than lesion size per se may be the critical determinants of behavioral impairment after focal cerebral ischemia.
Recent work has identified anisotropic diffusion patterns within the CPU, FLC, LPC, and HLC to be indicative of fiber projections; hence quantitative assessment of both grey and white matter changes after MCAO in the rat by means of a combination of relaxation parameters and diffusion orientation may be warranted (Lythgoe et al., 1997). The ROI we studied are considered to primarily constitute grey matter, so we used single-axis measurement (isotropic diffusion) rather than diffusion tensor trace estimation (anisotropic diffusion) which can produce ADC maps in three orthogonal directions and consequently increases total scanning time. Indices of anisotropy are influenced primarily by the spatial distribution of barriers to diffusion and hence are inherently more sensitive to the integrity of the structure of tissue. This latter approach should provide a better understanding of lesion conspicuity and maturation, indicative of white matter damage observed in the clinical situation (Jones et al., 1999; Zelaya et al., 1999) which unquestionably contributes to the underlying functional deficits (Pendlebury et al., 1999; Sunderland et al., 1999) exhibited by stroke patients.
In conclusion our results suggest that lesion volume evaluated by T2W images initially reduces in size and then remains constant from 7 to 28 days and that the MR tissue signature model is appropriate for predicting long-term regional changes in cellular status up to 28 days after tMCAO in the rat. In addition specific behavioral parameters, particularly skilled forelimb paw reaching demonstrated by the staircase test, was profoundly affected throughout the course of the study and correlated highly with changes in T2 and ADC within ROI that encompass the MCA territory. The bilateral impairments revealed by this task were best predicted by damage to the ipsilateral LPC as revealed by hierarchical multiple regression analyses. One behavioral task, beam walking, that models proprioceptive hindlimb placement and coordination was shown to recover at later time points after tMCAO which was mirrored by a return of the T2 and ADC values in the ipsilateral HLC to control levels. Therefore this is the first study of its kind that has attempted to correlate long-term changes in cerebral infarction using MRI and functional outcome in an animal model of stroke. In essence, irreversible pathology as visualized by MRI has been associated with persistent functional impairment whereas reversible MRI changes have been shown to be related to recovery of function. It is the view of others (Corbett and Nurse, 1998) and our own group that animal studies that are extended into the chronic phase of ischemia, using both serial MRI and behavior for predicting drug efficacy, will be more predictive of therapeutic benefit within clinical trials.
Footnotes
Acknowledgments
The authors extend their gratitude to R. Crundwell and D. Bacon at Queen Maryland Westfield College, C. David and A. Tucker at SmithKline Beecham, Harlow, U.K., and A. Chadwick at Institute of Psychiatry, Denmark Hill, London, for providing graphics support The authors also thank P. Nelson at SmithKline Beecham and A. Riazi at the Institute of Neurology, Queens Square, London, for statistical advice.