
Abstract
Prediction of hemorrhagic transformation (HT) in patients treated by intravenous recombinant tissue-type plasminogen activator (rt-PA) is a challenging issue in acute stroke management. HT may be correlated with severe hypoperfusion. Signal changes may be observed at susceptibility-weighted magnetic resonance imaging (MRI) within large perfusion defects. A signal drop within cerebral veins at T2∗-weighted gradient-echo MRI may be expected in severe ischemia, and may indicate subsequent risk of HT. The authors prospectively searched for an abnormal visibility of transcerebral veins (AVV) within the ischemic area in patients with hemispheric ischemic stroke, before they were treated with intravenous rt-PA therapy. Any correlation between AVV and baseline clinical or MRI findings, or further HT, was noted. An AVV was present in 23 of 49 patients (obvious, n = 8; moderate, n = 15), and was supported by severe hemodynamic changes at baseline MRI. The AVV was correlated with the occurrence of parenchymal hematoma type 2 at computed tomography during the first week (r = 0.44, P = 0.002). Five of six type 2 parenchymal hematomas occurred in association with obvious AVV. At multiple regression analysis, two baseline MRI factors had an independent predictive value for HT risk during the first week: the AVV and the cerebral blood volume ratio (Nagelkerke R2 = 0.48).
Keywords
The identification of markers for hemorrhagic transformation (HT) might be helpful in improving the risk-to-benefit ratio of thrombolytic therapy (Larrue et al., 1997; NINDS Study Group, 1995; NINDS t-PA Study Group, 1997). Magnetic resonance imaging (MRI) methods may provide relevant information that would aid in detecting factors indicative of higher risk of HT. Lower apparent diffusion coefficient (ADC) values (Selim et al., 2002; Tong et al., 2000), contrast enhancement due to blood–brain barrier disruption at T1-weighted imaging after gadolinium-derived agent administration (Knight et al., 1998; Neumann-Haefelin et al., 2002), and old microbleeds at T2∗-weighted gradient-echo sequences (Kidwell et al., 2002) may indicate risk of HT. The severity of cerebral blood flow reduction has also been associated with a higher risk of HT (Alexandrov et al., 1997; Hanson et al., 1993; Ueda et al, 1994; Umemura et al., 2000).
Susceptibility-weighted sequences may allow an understanding of the pathophysiology of acute brain ischemia (Gröhn and Kauppinen, 2001; Lee et al., 2003; Roussel et al., 1995; Tamura et al., 2002). Deoxyhemoglobin may be considered an endogenous contrast agent due to its paramagnetic properties (Ogawa et al., 1990; Thulborn et al., 1982; Wright et al., 1991). An early increase in deoxyhemoglobin concentration and regional cerebral blood volume within large perfusion defects may lead to signal modifications at susceptibility-weighted imaging (De Crespigny et al., 1992; Lin et al., 1998; Roussel et al., 1995; Tamura et al., 2002). A signal drop within cerebral veins at T2∗-weighted gradient-echo MRI may be expected in severe ischemia. We hypothesized that signal changes within venous structures may be correlated with the severity of acute ischemia and further hemorrhagic transformation risk.
PATIENTS AND METHODS
Inclusion and exclusion criteria
Patients with symptoms of acute hemispheric stroke who were treated with rt-PA (Trouillas et al., 1998) were recruited for this prospective study. Inclusion criteria were acute cerebral ischemia involving the carotid artery territory; measurable clinical deficit (National Institutes of Health Stroke Scale [NIHSS] score > 4;Brott et al., 1989); absence of cerebral hemorrhage on baseline computed tomography (CT) scan; baseline MRI scan performed before therapy and within 6 hours of stroke onset; no contraindications to MRI or thrombolysis; and informed consent obtained from the patient or his/her relatives. Excluded from the study were patients with general contraindications to MRI, movement artifacts precluding MRI interpretation, and those who withdrew consent or could not adhere to the conditions of study.
Patients
Fifty-eight patients fulfilled the inclusion criteria. Nine patients were excluded because movement artifacts precluded interpretation of day 0 MRI scans. MRI data analysis involved 49 patients. Neurologic impairment was assessed using the NIHSS score at baseline, day 1, and day 7. A trained neurologist with no knowledge of the MRI results performed all clinical assessments. Stroke mechanism was assessed according to the Trial of Org 10172 in Acute Stroke Treatment (TOAST) classification (Adams et al., 1993).
Computed tomography and magnetic resonance imaging methods
All patients had both a plain CT scan and an MRI before therapy and at day 1. A careful attempt was made to achieve the same positioning during follow-up examinations as that of the day 0 slice position. The CT scan was repeated in case of clinical deterioration that was suggestive of HT. A follow-up CT was performed at day 7 to detect delayed HT. The local ethical committee for clinical investigations (CCPPRB Lyon B) approved this protocol.
Computed tomography. Baseline plain CT scan was performed with a fourth-generation CT (Elscint CT Twin, Haifa, Israel) at day 0. Five-millimeter-thick contiguous slices were obtained over the entire intracranial cavity.
Magnetic resonance imaging. Day 0 and day 1 MRI studies were obtained using a 1.5-T Magnetom Vision whole-body MR imager (Siemens, Erlangen, Germany). The mean delay between symptom onset and day 0 MRI was 221 ± 83 minutes. MRI sequences were performed in the same following order, with these parameters:
Time-of-flight magnetic resonance angiography (three-dimensional TOF turbo magnetic resonance angiography; repetition time: 35 milliseconds; echo time: 6.4 milliseconds; flip angle: 20 degrees; matrix: 160 × 512; field of view: 240 mm; one excitation; acquisition time: 6 minutes, 14 seconds). Three axial slabs (thickness: 31.9 mm; partitions: 24; distance factor: −0.38) were placed over the circle of Willis and covered the intracranial internal carotid artery, M1 to M3 (or M4) segments of the middle cerebral artery, and A1 and proximal A2 segments of the anterior cerebral arteries. T2∗-weighted gradient-echo sequence (repetition time: 800 milliseconds; echo time: 26 milliseconds; flip angle: 20 degrees; slice thickness: 5 mm; 20 axial slices; distance factor: 0.5 mm; matrix: 238 × 256; two acquisitions; acquisition time: 6 minutes, 23 seconds; field of view: 240 mm; pixel size: 0.94 × 1.01 mm; no flow compensation or radiofrequency spoiling). Diffusion-weighted imaging (DWI) using an isotropic echo-planar sequence (repetition time: 5,000 milliseconds; echo time: 137 milliseconds; 19 axial slices; thickness: 5 mm, interslice gap: 0.5 mm; matrix: 96 × 128; field of view: 240 mm; one excitation; acquisition time: 23 seconds). Three values of diffusion sensitization (b values = 50, 500, and 1,000 s/mm2), were used to calculate the ADC. Perfusion-weighted imaging (PWI) was performed with a T2∗-weighted gradient-echo echo-planar imaging sequence, using the bolus passage of contrast agent (repetition time: 2000 milliseconds; echo time: 60 milliseconds; seven slices; slice thickness: 5 mm; interslice gap: 0.5 mm; field of view: 240 mm; matrix 128 × 128 pixels; 30 measurements obtained at intervals of 2 seconds). The slice position was obtained from the DWI scan and was matched to the center of the diffusion lesion area. The contrast injection (15 mL of GD-DOTA [Guerbet, Aulnais-sous-Bois, France]) was performed at the start of the fourth scan, using a power injector at a rate of 5 mL/s via access through an antecubital vein; the bolus of contrast medium was followed by a 15-mL bolus of saline solution at the same injection rate.
Diagnostic criteria of abnormal visibility of transcerebral veins
The abnormal visibility of transcerebral veins (AVV) was defined at the baseline T2∗-weighted gradient-echo sequence as multiple hypointense linear and/or branching structures extending through the affected hemisphere, parallel or perpendicular to the outer wall of the lateral ventricles (Reichenbach et al., 2000) (Fig. 1 and Fig. 2). Other causes of signal loss at T2∗-weighted gradient-echo MRI, such as clots within intracranial arteries (Chalela et al., 2002; Flacke et al., 2000), calcifications, or distortion artifacts related to bony structures, were excluded. The diagnosis of AVV was performed by the consensual analysis of two senior neuroradiologists. The AVV was categorized as absent, moderate (Fig. 1), or obvious (Fig. 2).
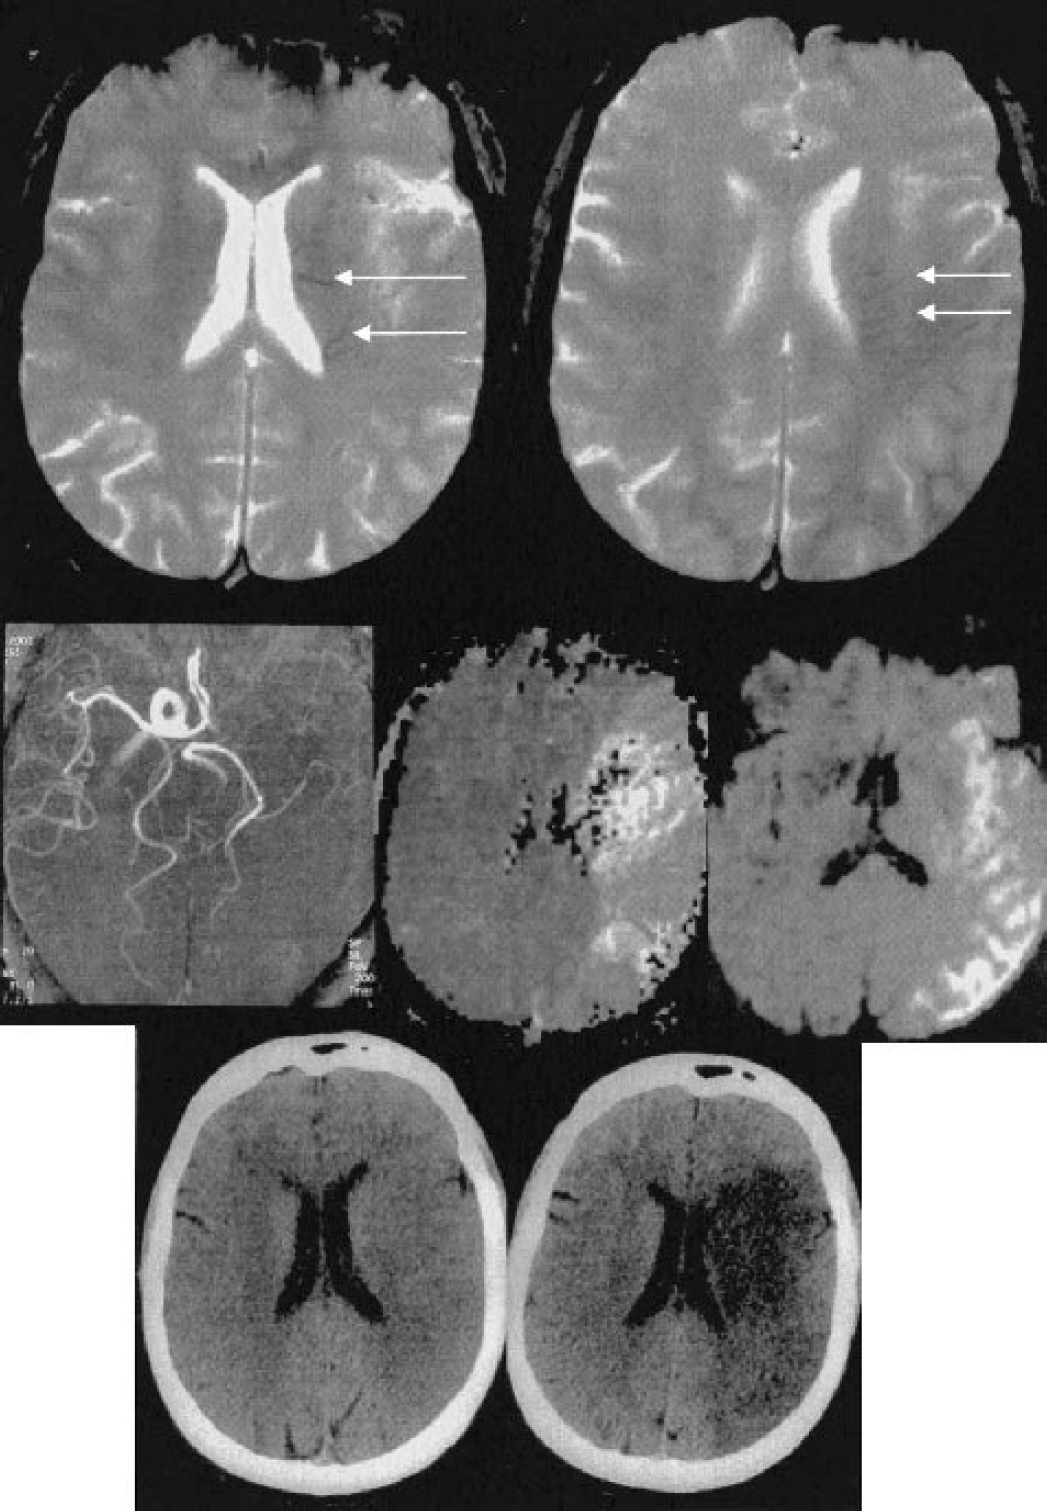
Moderate visibility of transcerebral veins in a 61-year-old woman admitted for right-sided hemiplegia and aphasia. The baseline NIHSS score was 24. The baseline MRI was performed 3 hours after symptom onset. (
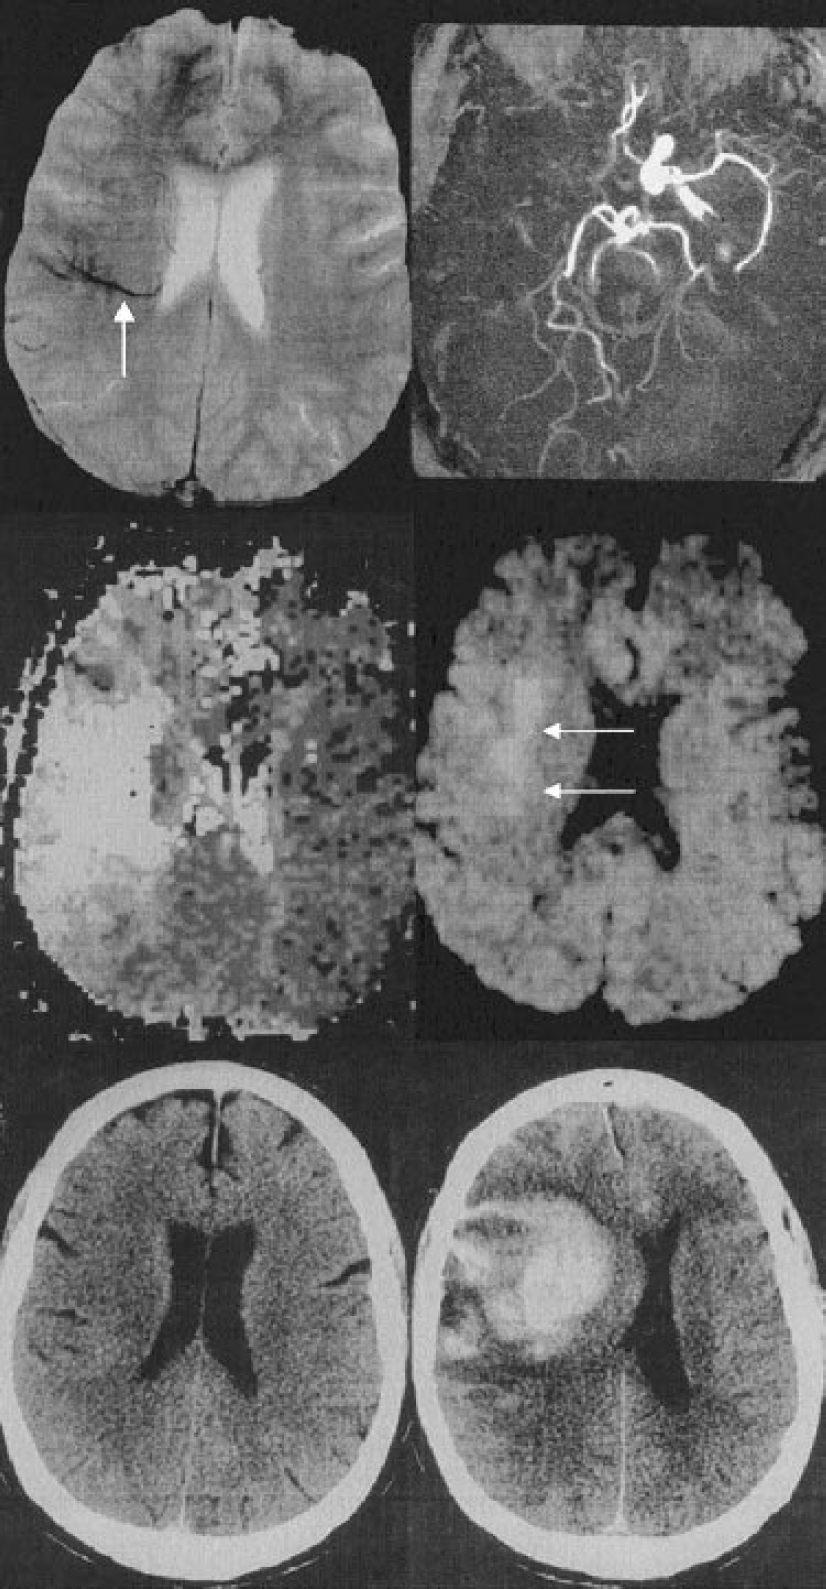
Obvious visibility of transcerebral veins prior to severe bleeding in a 67-year-old man with sudden onset of hemiplegia 2 hours before MRI. The baseline NIHSS score was 20. (
Diagnostic criteria of hemorrhagic transformation
Hemorrhagic transformation was evaluated on the day 1 and day 7 CT, according to the ECASS radiologic criteria (Fiorelli et al., 1999).
Diagnosis of arterial occlusion
Occlusion was categorized at magnetic resonance angiography as located at the internal carotid artery, confined to either the M1, M2, or distal segments of the middle cerebral artery, or located in the A1 and A2 segments of the anterior cerebral artery. Patients with internal carotid artery or M1 occlusions were considered to have a proximal occlusion. Patients with other occlusion sites were considered to have a distal occlusion.
Diffusion-weighted and perfusion-weighted imaging parameters
Postprocessing of MRI data was performed on a dedicated MR workstation by a trained senior neuroradiologist who was unaware of the clinical data. DWI and PWI parameters were measured by manually placing regions of interest within the lesion on DWI, the lesion on PWI, and the symmetrical contralateral areas when indicated. ROIs correlated with the abnormal area edges. The minimal regions of interest value was 2 cm2. To define initial DWI lesion volume, we used the trace images obtained at the highest b value (b = 1,000 s/mm2). The global lesion volume was determined by multiplying the area of diffusion hyperintensity by the sum of the slice thickness and the interslice gap thickness. ADC maps were generated by software using three values of b (50, 500, and 1,000 s/mm2). ADC values were obtained by placing regions of interest on ADC maps, with an attempt to exclude cerebrospinal fluid voxels. Perfusion maps were generated from the concentration time curves deduced from signal intensity curves assuming a monoexponential decrease of MR signal and a linear relationship between contrast medium concentration and transversal relaxation rate changes ΔR2∗. A γ variate fit was used on a pixel-by-pixel basis to compute relative parameter maps (Østergaard et al., 1996a). The PWI lesion volume was obtained from the absolute time-to-peak maps (Hermier et al., 2003; Marks et al., 1999). The assessment of hemodynamic status also included relative mean transit time (MTT, first moment of concentration–time curve), relative regional cerebral blood volume (CBV, area under concentration–time curve), and relative regional cerebral blood flow index (CBFi, ratio between CBV and MTT). The ratios between the hemodynamic parameters on the ischemic side and those on the contralateral region were calculated to determine normalized MTT (rMTT), normalized CBFi (rCBFi), and normalized CBV (rCBV).
Reproducibility measurement
Two independent experienced observers (M.H., F.C.) evaluated the presence of AVV on two occasions. The interobserver and intraobserver reliability was r > 0.9, with a mean deviation of less than 10% for intraobserver reproducibility.
Statistical analysis
Time intervals and the descriptive statistics of the NIHSS score and MRI characteristics are given as mean values with standard deviation (SD), or median and range. We used (χ2 tests to compare rates or proportions of discrete variables. The Spearman rank correlation coefficient was calculated to determine the correlation between AVV with NIHSS scores and baseline MRI parameters (DWI and PWI lesion volumes, mean ADC value within the DWI lesion; MTT, rMTT, rCBV and rCBFi values; and the site of occlusion), and between AVV and hemorrhagic transformation. Univariate and multivariate logistic regression analysis was performed in order to identify the independent MRI predictive factors of HT. The analysis was completed by a regression tree using the (χ2 automatic interaction detector method (Breiman et al., 1984; Loh and Shih, 1997) to identify the baseline MRI parameters supporting AVV. All statistical tests were two tailed; a P value less than 0.05 was considered statistically significant. Statistical analysis was performed with the SPSS 11.0 (SPSS Science, Chicago, IL, U.S.A) statistical software package for Windows.
RESULTS
Clinical observations
Twenty-five men and 24 women (mean age: 63 ± 14 years; median: 63 years; range: 32–94 years) underwent MRI before intravenous rt-PA therapy. Mean baseline NIHSS score was 14 ± 6. The median time from symptom onset to MRI was 205 minutes (range: 58–217 minutes). The median time from symptom onset to treatment was 247 minutes (range: 150–420 minutes). The mechanism of stroke was large vessel disease in 16 patients, cardioembolic event in 23 patients, small vessel disease in three patients, and unknown in seven patients. Clinical deterioration related to hemorrhagic transformation occurred in four patients, two of whom died during the first week.
Baseline MRI findings
Abnormal visibility of transcerebral veins was obvious at baseline MRI in 8 out of 49 patients and moderate in 15 patients. There was no corresponding intracerebral hyperdensity at baseline CT scan.
Mean baseline global DWI lesion volume was 50 ± 59 cm3 (range: 2–213). Mean baseline DWI lesion volume matched to PWI slices was 37 ± 38 cm3 (range: 2 to 153). Mean PWI lesion volume was 117 ± 56 cm3 (range: 2–239); mean MTT within the perfusion deficit was 14.5 ± 3.8 seconds (range: 6.5–23.3 seconds); mean rMTT was 1.46 ± 0.44 (range: 0.53 to 2.8); mean rCBV was 1.12 ± 0.37 (range: 0.37–1.99); and mean rCBFi was 0.78 ± 0.32 (range: 0.22–1.70).
Forty-five of 49 patients had an arterial occlusion at baseline magnetic resonance angiography. The site of arterial occlusion was the internal carotid artery in 13 patients; the M1 segment of the middle cerebral artery in 18 patients; the M2 segment in six patients; the distal middle cerebral artery in five patients; and the A2 segment of the anterior cerebral artery in three patients.
Hemorrhagic transformation
Hemorrhagic transformation was detected in 23 patients (HI1: n = 9 patients, HI2: n = 3, PH1: n = 5, PH2: n = 6). The distribution of HT subtypes according to the AVV is described in Table 1. Among the six patients with first-week PH2, obvious AVV at day 0 MRI was present in five (P < 0.001). All PH2s occurred in patients with proximal occlusions (internal carotid artery, n = 2; M1, n = 4).
Distribution of hemorrhagic transformation subtypes (diagnosed during the first week) according to the abnormal visibility of transcerebral veins (n = 49)
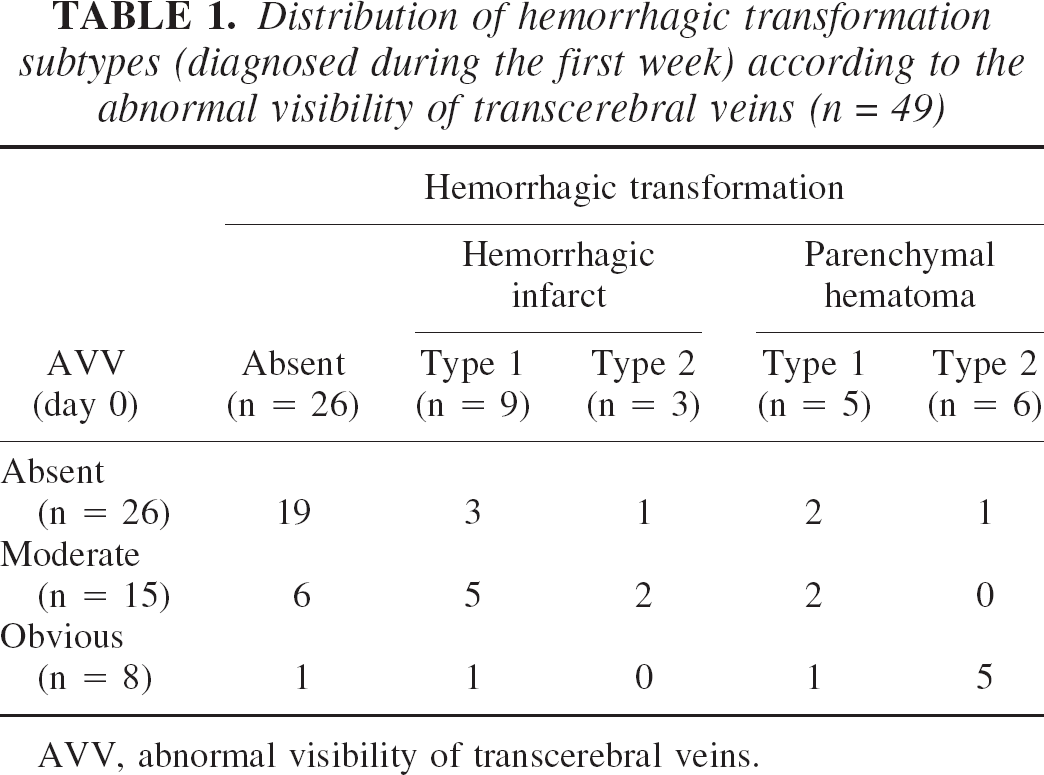
AVV, abnormal visibility of transcerebral veins.
Correlation analysis of AVV with clinical status and imaging findings
The correlation analysis of AVV with clinical data and baseline MRI parameters is described in Table 2. AVV was correlated with a higher baseline NIHSS score (r = 0.48, P < 0.001), and a worse outcome with regard to day 1 (r = 0.50, P < 0.001) and day 7 (r = 0.44, P = 0.004) NIHSS scores.
Correlation of the abnormal visibility of transcerebral veins at T2∗-weighted magnetic resonance imaging with clinical and imaging parameters
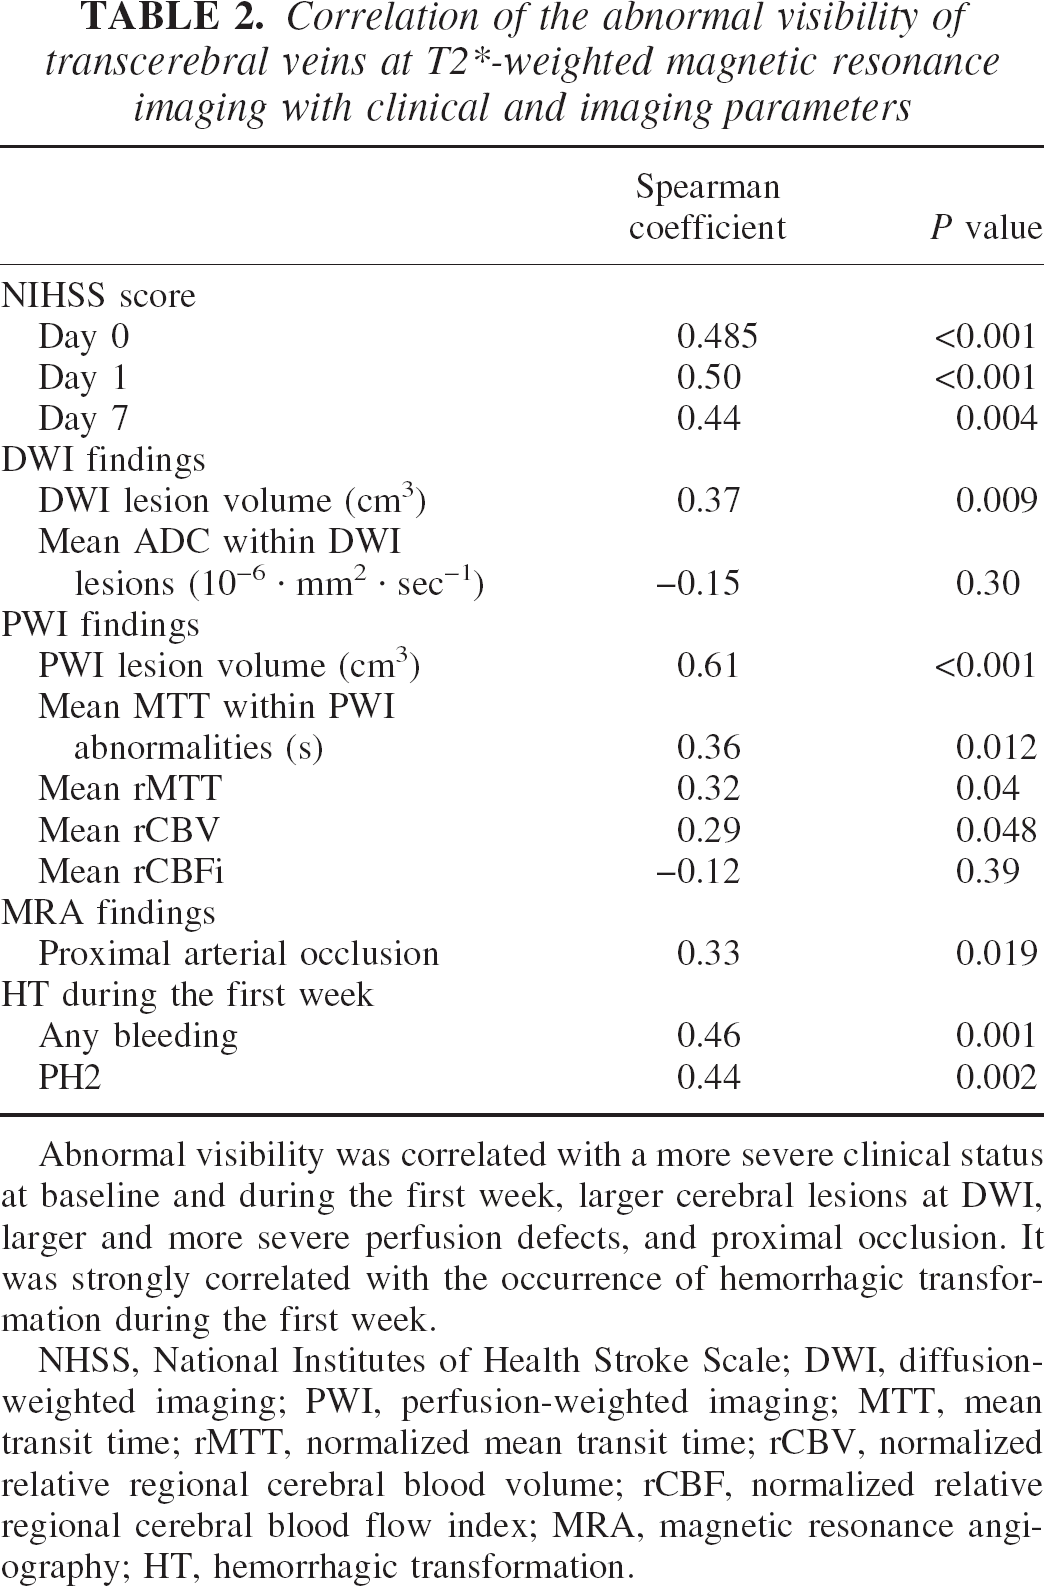
Abnormal visibility was correlated with a more severe clinical status at baseline and during the first week, larger cerebral lesions at DWI, larger and more severe perfusion defects, and proximal occlusion. It was strongly correlated with the occurrence of hemorrhagic transformation during the first week.
NHSS, National Institutes of Health Stroke Scale; DWI, diffusion-weighted imaging; PWI, perfusion-weighted imaging; MTT, mean transit time; rMTT, normalized mean transit time; rCBV, normalized relative regional cerebral blood volume; rCBF, normalized relative regional cerebral blood flow index; MRA, magnetic resonance angiography; HT, hemorrhagic transformation.
Abnormal visibility of transcerebral veins was correlated with a proximal occlusion site (r = 0.33, P = 0.019), a higher baseline DWI lesion volume (r = 0.39, P = 0.009) and at PWI, with a larger PWI defect (r = 0.61, P < 0.001), a more delayed MTT within it (r = 0.36, P = 0.012), a delayed rMTT (r = 0.32, P = 0.04), and an increased rCBV (r = 0.29, P = 0.048). AVV was highly correlated with the occurrence of intracranial hemorrhagic transformation at CT scan during the first week (r = 0.46, P = 0.001). It was significantly correlated with the occurrence of PH2 during the same period (r = 0.44, P = 0.002). Among the six patients with first-week PH2s, obvious AVV at day 0 MRI was present in five (P < 0.001) (Fig. 2). Other baseline parameters correlated with HT were a proximal occlusion site (r = 0.33, P = 0.02), larger perfusion deficit (r = 0.48, P < 0.001), longer MTT within the perfusion deficit (r = 0.44, P = 0.002), and a lower rCBV (r = −0.38, P = 0.012).
Factors predicting the abnormal visibility of transcerebral veins
Among all baseline clinical and MRI factors, a larger PWI lesion volume and a longer MTT within the perfusion defect had an influence on the AVV sign at multiple regression tree analysis (P < 0.0001 and P = 0.013, respectively; Fig. 3).
Factors predicting hemorrhagic transformation
Two independent factors had a predictive value for the occurrence of HT during the first week. The AVV was associated with an increased HT risk, whereas rCBV was associated with a mild decrease in bleeding risk (Nagelkerke R2 = 0.48) (Table 3).
Baseline MRI parameters influencing the abnormal visibility of transcerebral veins assessed with multiple regression tree (χ2 automatic interaction detector method, n = 49)
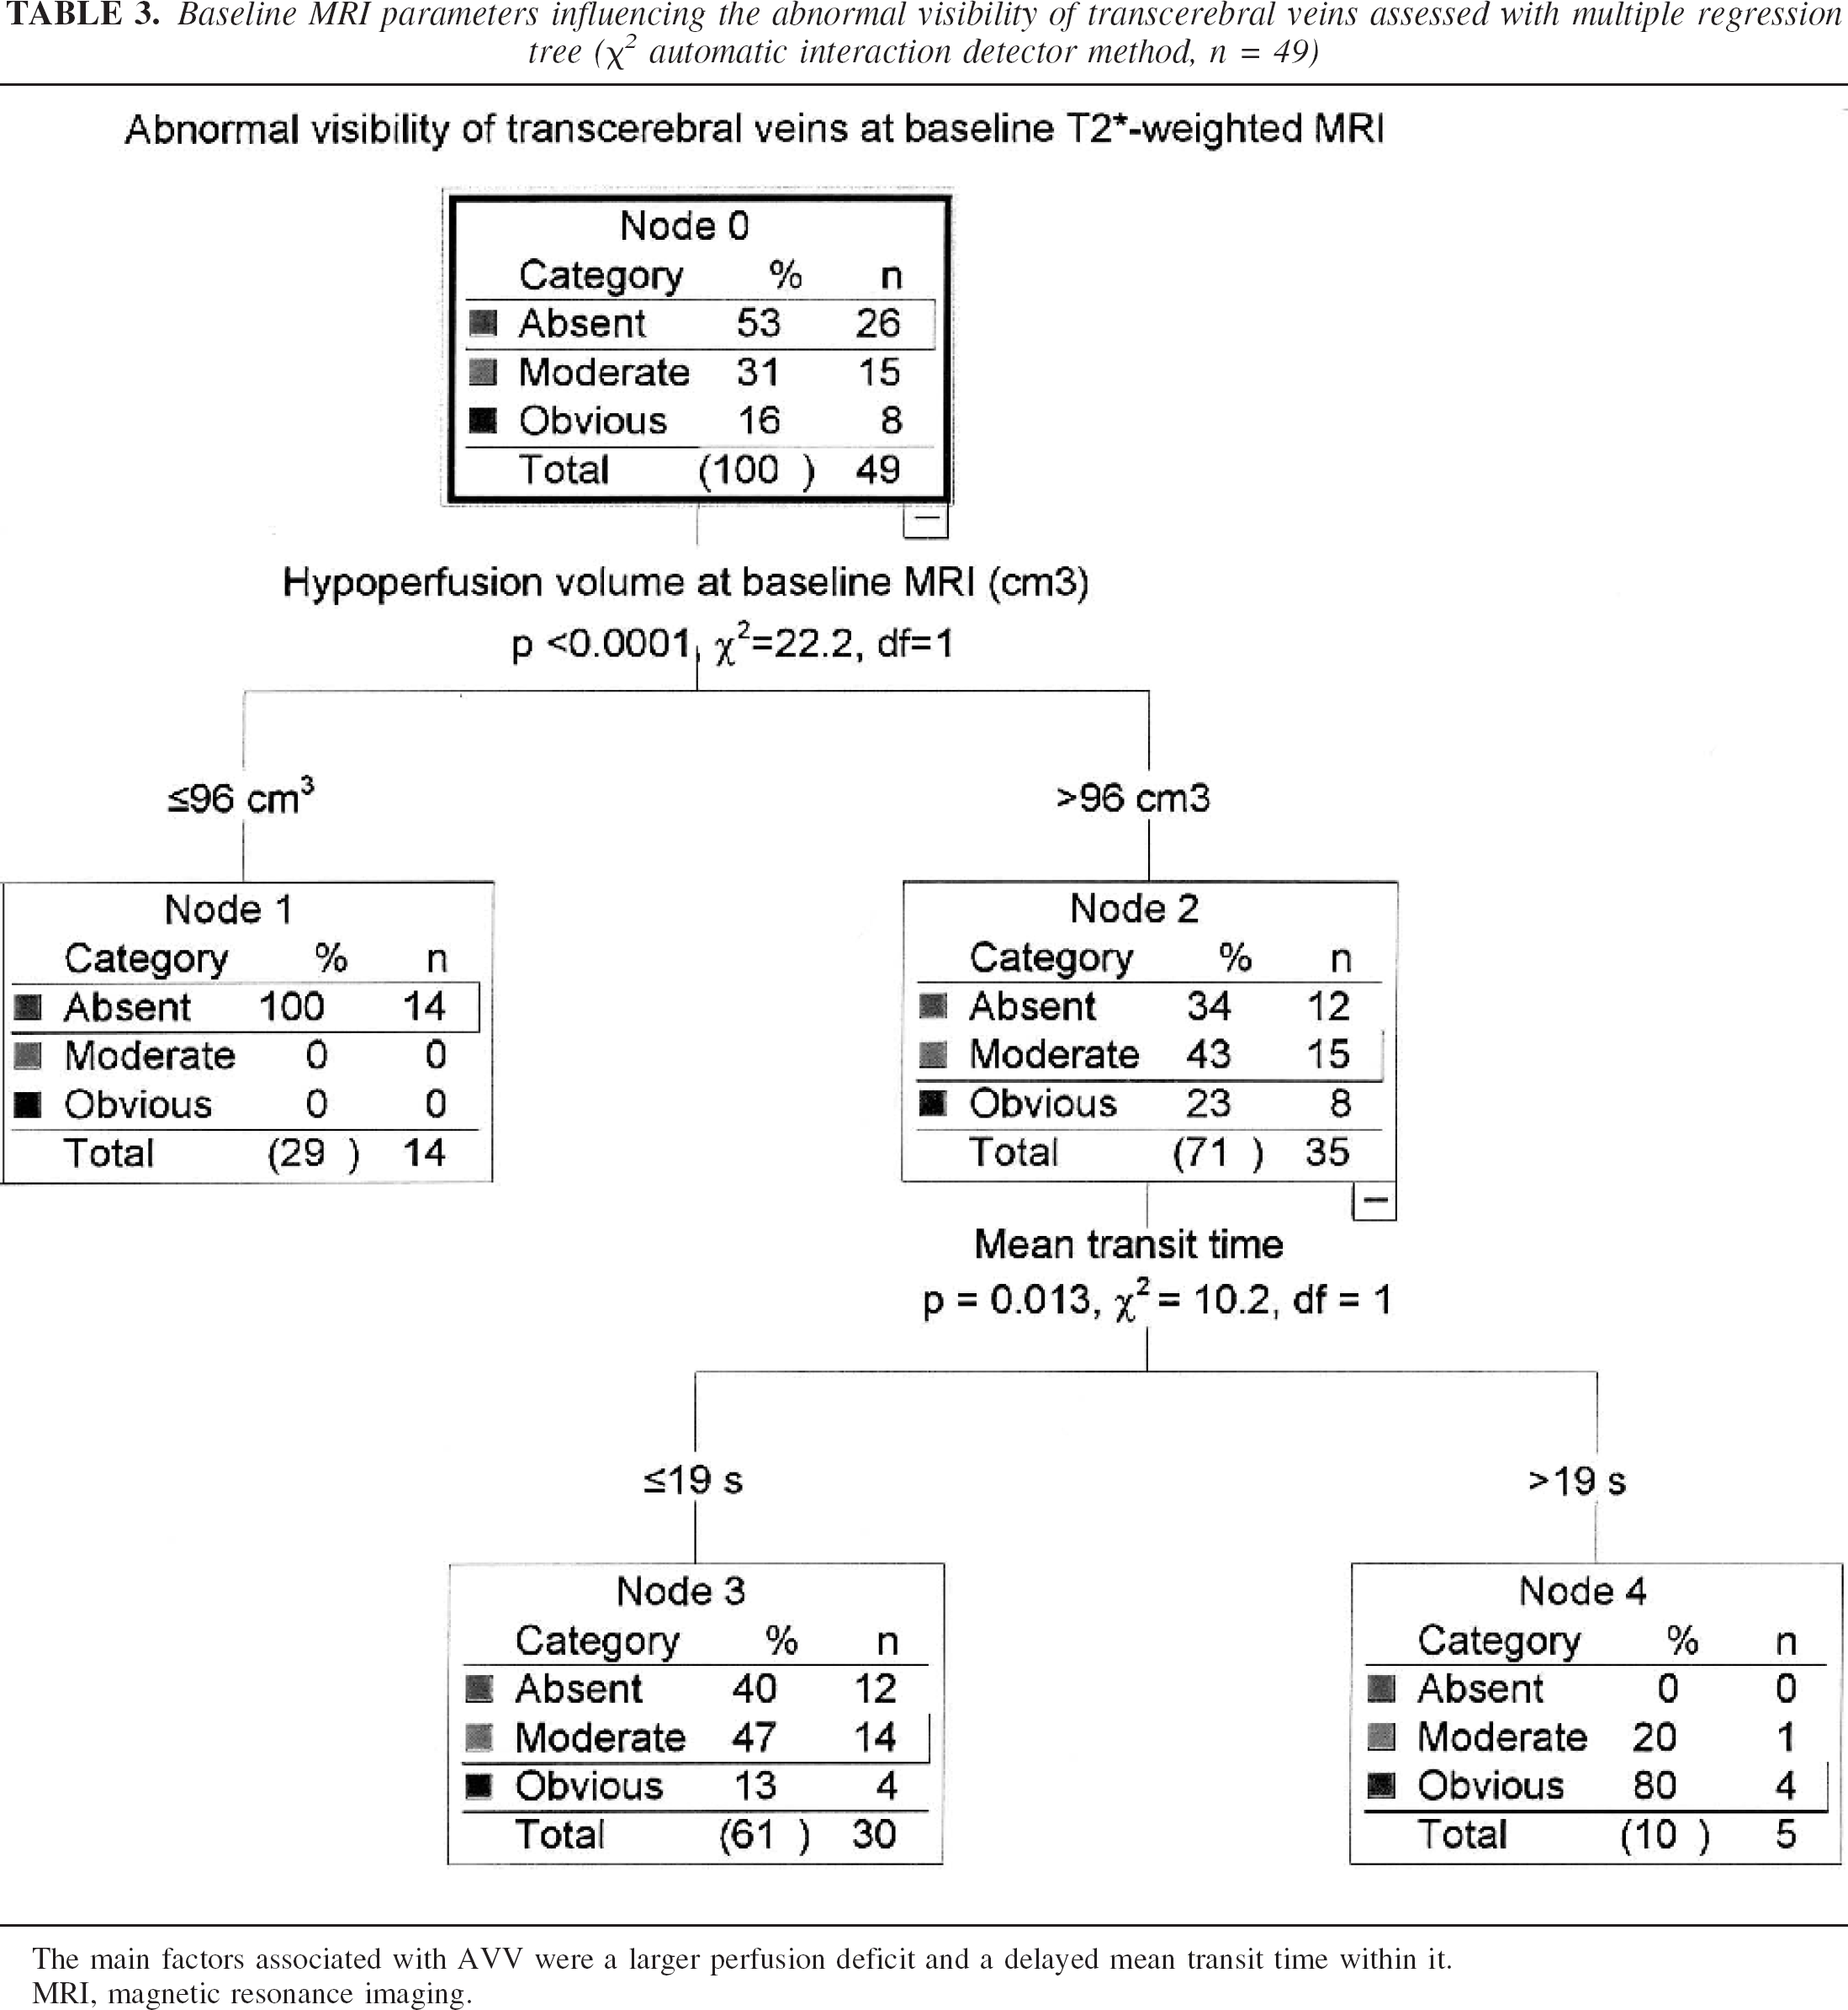
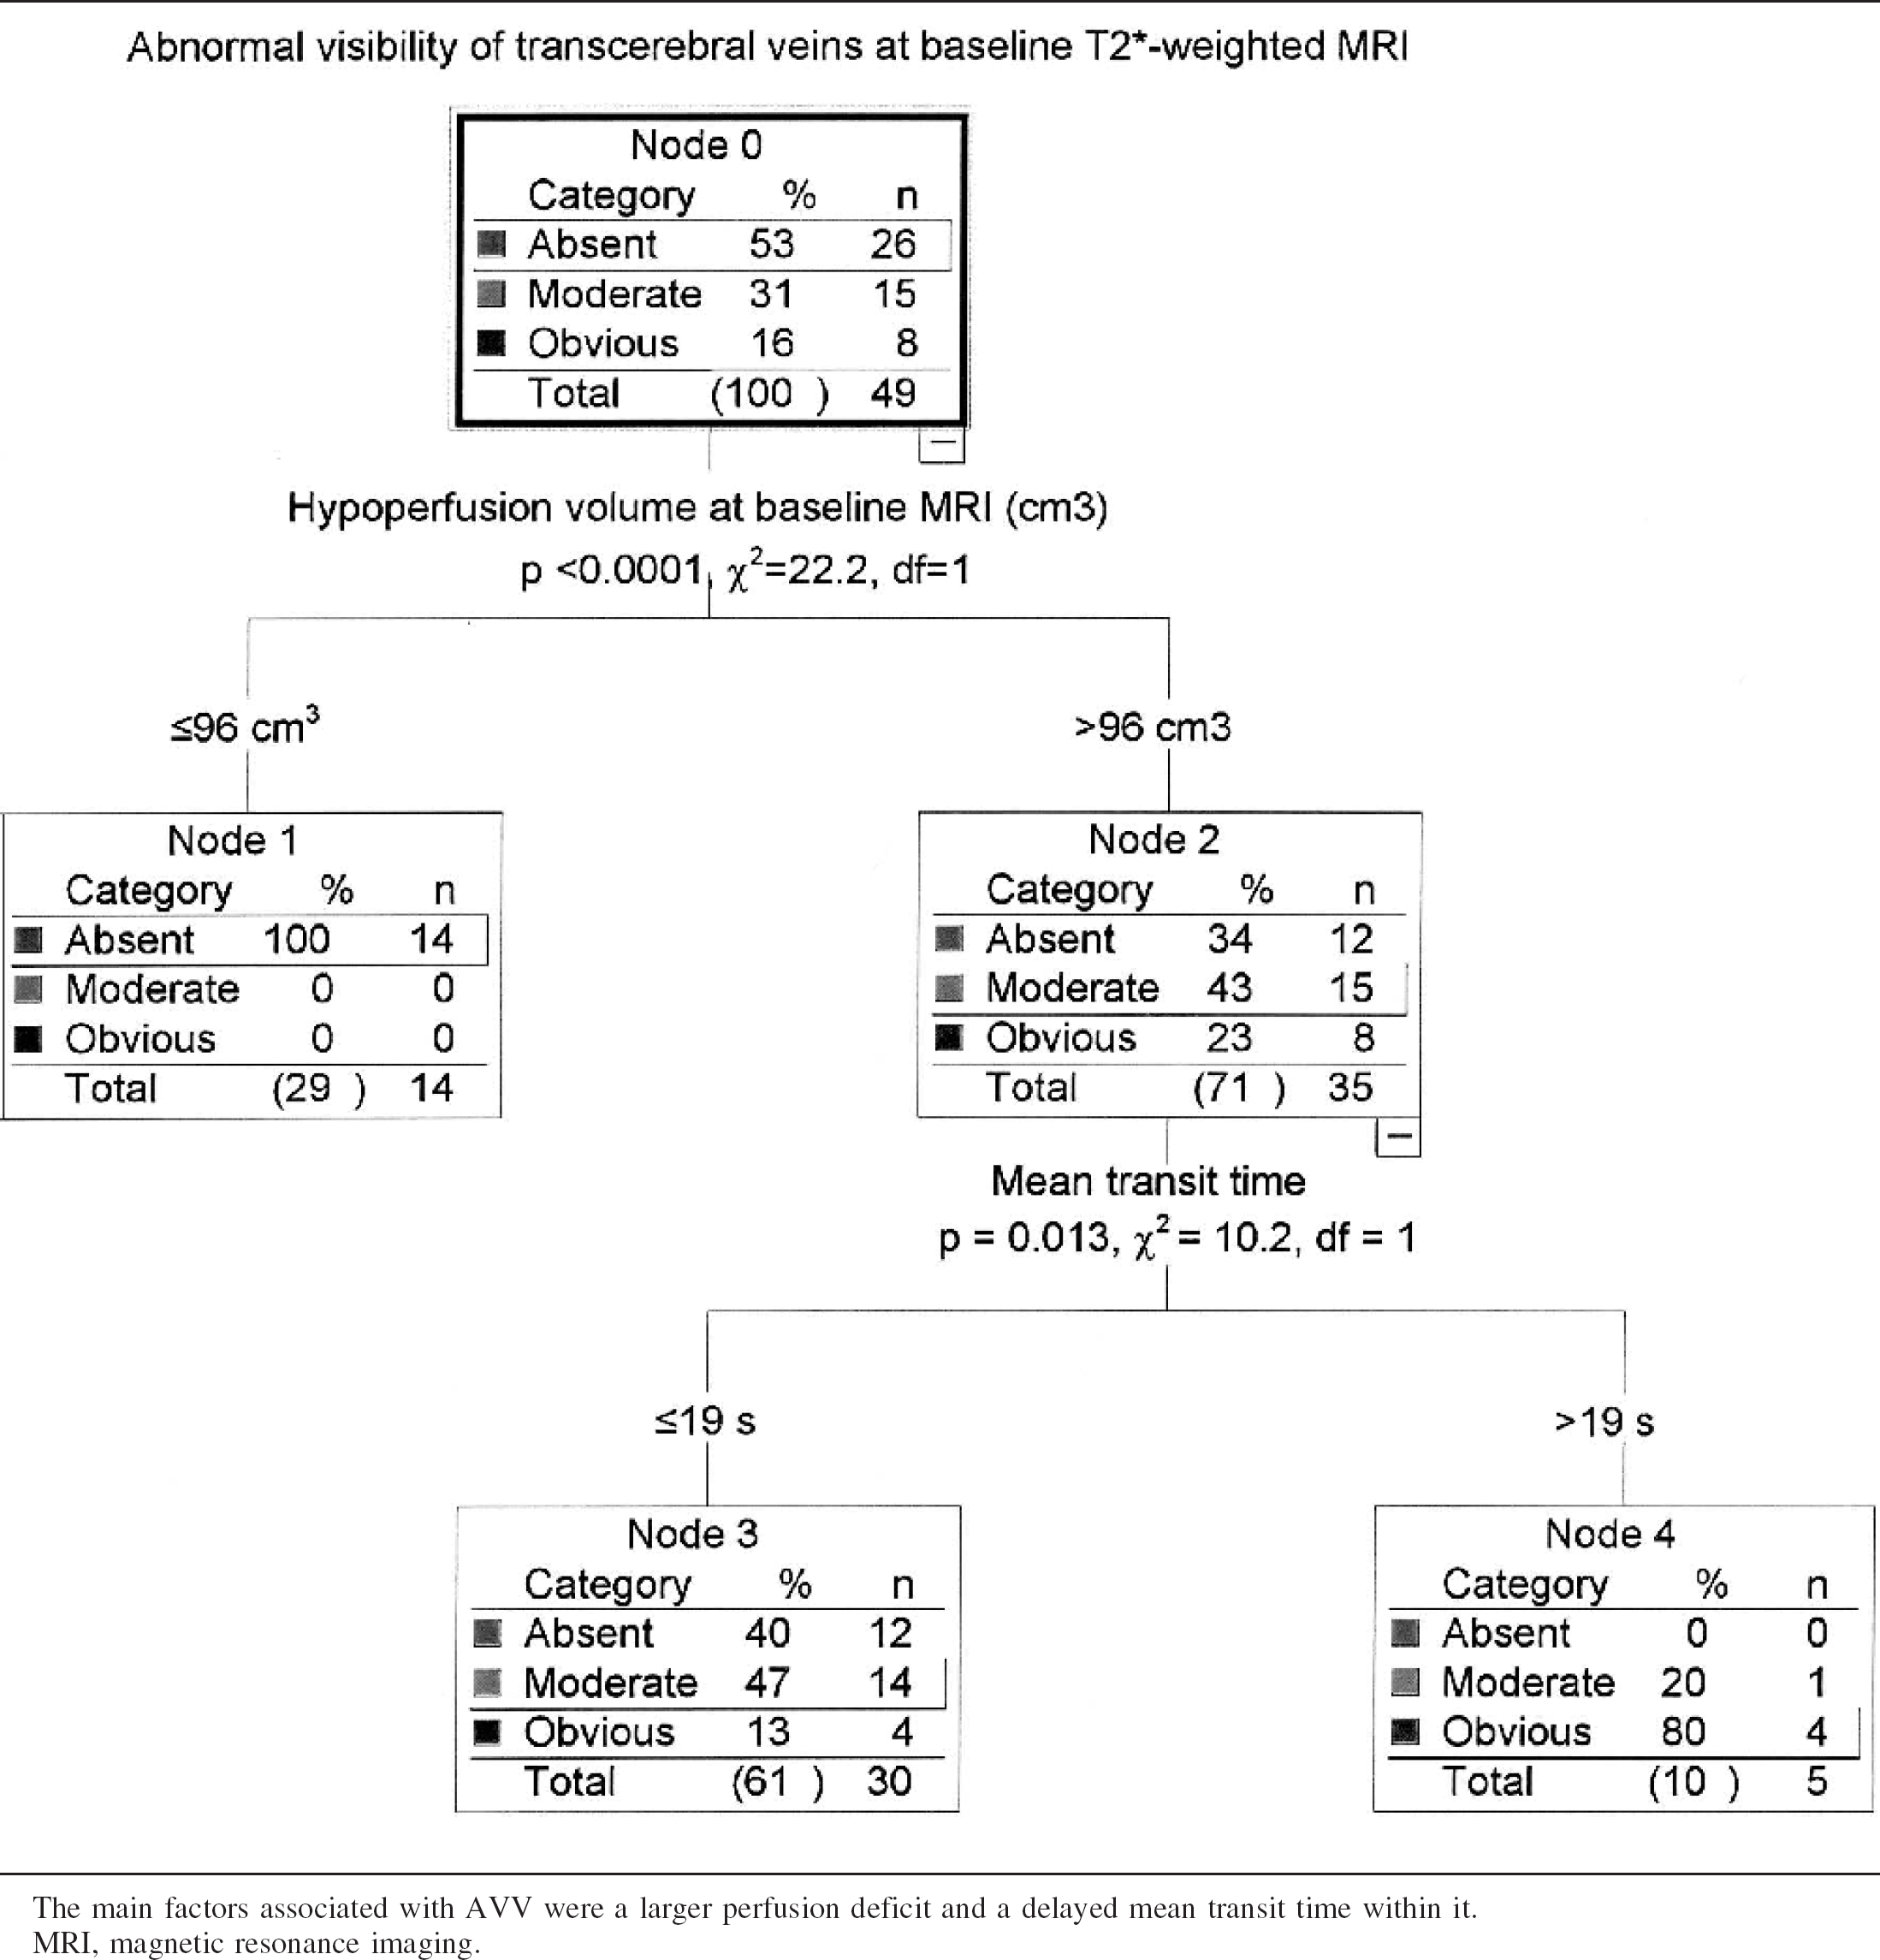
The main factors associated with AVV were a larger perfusion deficit and a delayed mean transit time within it.
MRI, magnetic resonance imaging.
Multivariate logistic regression analysis of baseline magnetic resonance imaging parameters predicting hemorrhagic transformation during the first week (n = 49)
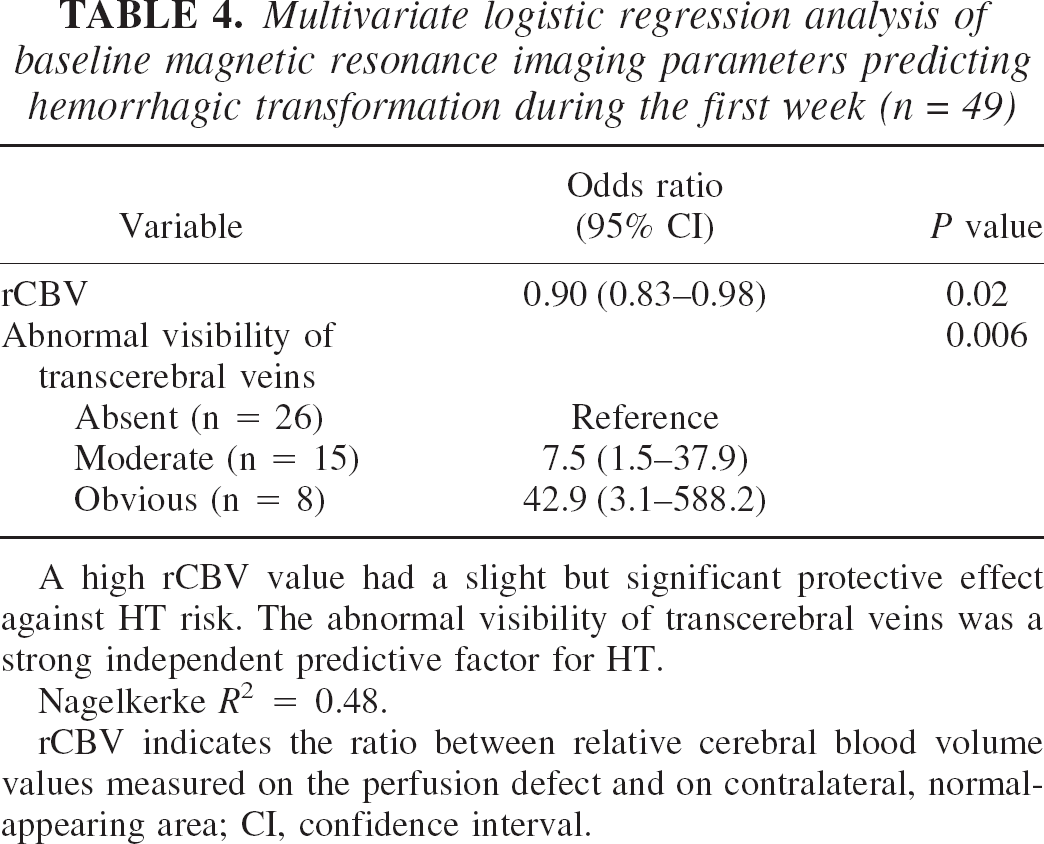
A high rCBV value had a slight but significant protective effect against HT risk. The abnormal visibility of transcerebral veins was a strong independent predictive factor for HT.
Nagelkerke R2 = 0.48.
rCBV indicates the ratio between relative cerebral blood volume values measured on the perfusion defect and on contralateral, normal-appearing area; CI, confidence interval.
DISCUSSION
A loss of signal within transcerebral veins at T2∗-weighted imaging in the early stage of cerebral ischemia was observed within the affected hemisphere in some patients with acute carotid artery territory ischemia. The AVV was supported by a severe hemodynamic impairment and was correlated with a higher risk of HT.
The hypointense images were considered to be of venous origin because of their MRI anatomical distribution, as described at high-field-strength MRI (Christoforidis et al. 1999; Reichenbach et al. 2000). The visualization of the transcerebral venous system at high field values depends on the blood oxygen level–dependent contrast effect (Christoforidis et al., 1999; Reichenbach et al., 2000). At low-to-intermediate field strengths used in routine clinical practice, transcerebral veins are usually not visible due to their small diameter. Signal changes attributed to hemoglobin oxygenation level have been detected at the acute stage of brain ischemia in animals with ipsilateral middle cerebral artery occlusion (Roussel et al., 1995) and in humans with large artery occlusions (Tamura et al., 2002). Because venous blood volume represents 70% to 80% of the total blood volume (Ito et al., 2001) and contains higher concentrations of deoxyhemoglobin, the gradient-echo imaging modifications may be mainly related to venous structures (Roussel et al., 1995). In addition, the maximal T2∗ signal lowering due to deoxyhemoglobin may be expected within venous structures that drain hypoperfused tissue.
The ratio of oxyhemoglobin to deoxyhemoglobin, measured by MRI in the capillary and venous compartments, reflects the oxygen extraction fraction (An and Lin, 2000) and the CMR
In the setting of acute ischemia, a slow-flow state may increase the susceptibility contrast due to intravascular deoxyhemoglobin (Kennan et al., 1994). The AVV was correlated with a delayed MTT consistent with slow flow, a large perfusion defect, and an increased rCBV. In some patients, BOLD changes in the T2∗-weighted gradient-echo MRI signal may be potentiated by an increase in rCBV. An increased CBV is associated with the recruitment of arterial collateral supply and the simultaneous dilatation of cerebral veins. In addition, brain acidosis secondary to severe ischemia (Kraig et al., 1998) may contribute to T2∗-weighted gradient-echo MRI abnormalities (Schilling et al., 2002).
Clinical implications
The AVV was indicative of significant ischemic damage and impaired hemodynamic status. The AVV was correlated with a larger DWI lesion volume and with a severe clinical status, both at baseline and at follow-up. The extent of ischemic damage (Dijkhuizen et al., 2001; Larrue et al., 2001; Selim et al., 2002; Tanne et al., 2002) and the severity of the perfusion deficit (Alexandrov et al., 1997; Berrouschot et al., 2000; Dijkhuizen et al., 2001; Ueda et al., 1994; Umemura et al., 2000) are both considered risk factors for HT.
A strong correlation between the AVV and subsequent occurrence of any HT, especially with severe bleeding, was observed. The AVV was an independent predictive factor for any hemorrhagic transformation during the first week. PH2 risk was associated with obvious AVV: among the six patients with first-week PH2s, obvious AVV at day 0 MRI was present in five (P < 0.001). In contrast with other HT subtypes (Molina et al., 2002), PH2s are associated with early neurologic deterioration (Berger et al., 2001; Fiorelli et al., 1999). HT risk was correlated with MRI parameters consistent with a severe perfusion defect: a proximal occlusion site, a larger perfusion deficit, and a longer MTT within the perfusion deficit. A higher mean rCBV had a mild protective effect against HT risk, suggesting that bleeding may be less frequent in stroke patients in whom the recruitment of collaterals and/or a maximal compensatory dilatation of brain vessels are efficient. HT might occur when compensatory mechanisms for severe ischemia are exhausted.
The increase in symptomatic hemorrhagic transformation beyond the three-hour therapeutic time window may negate somewhat the benefit of thrombolytic therapy (Clark et al., 2000). In this setting, MRI may allow better patient selection (Albers, 1999; Ringleb et al., 2002, Rohl et al., 2001; Schellinger et al., 2003). Although our sample size prevents any definitive conclusion, the use of t-PA should be considered with caution in patients with obvious AVV.
Limitations of the study and technical considerations
The small sample size may be considered a limitation for the significance of AVV as a predictor of hemorrhagic risk. Because the benefit of t-PA may outweigh the risk in selected patients, larger studies assessing the predictive value of AVV for HT risk are needed.
The analysis of AVV was made by visual inspection, and was easily obtained in the emergency stroke MRI setting. Signal changes might have been better evaluated by a more quantitative analysis. The respective role of hemodynamic and metabolic parameters in the genesis of signal loss along the course of transcerebral veins could not be quantified with the routine T2∗-weighted sequence. An analysis of the respective contribution of deoxyhemoglobin concentration, CBFi, and CBV is desirable, and could be better facilitated with multiecho gradient and spin-echo sequences (An and Lin, 2000; Oja et al., 1999; Scheffler et al., 1999; van Zijl et al., 1998). Subregion analysis within the global perfusion defect using absolute hemodynamic parameters (Liu et al., 2000) might provide relevant information on HT risk. The predictive analysis of HT with MRI should be enhanced by integration of clinical and biologic data.
Acquisition parameters (including field strength, gradient echo versus spin echo sequences, echoplanar imaging, flip angle, echo time, and, for gradient-echo, slice orientation with regard to vessel orientation) may contribute to the susceptibility contrast generated by intravascular changes in blood deoxygenation (Kennan et al., 1994; Silvennoinen et al., 2003). The signal changes described by Tamura et al. (2002) were more diffuse within the perfusion defect, and less visible along transcerebral veins than in our study. The predominant contribution of capillary instead of venous blood to T2∗ signal changes may be explained by differences in susceptibility-weighted imaging protocols (Silvennoinen et al., 2003). Conventional gradient-echo sequences used in our study were expected to be less prone to magnetic susceptibility and distortion artifacts than are echoplanar T2∗ sequences (Liang et al., 1999).
Because T2∗ MRI may be more sensitive than CT for the detection of minor intracerebral bleeding, the rate of HT at day 7 may have been underestimated by CT. However, CT scan remains the criterion standard for the detection of HT in clinical studies.
In conclusion, AVV at baseline gradient-echo T2∗-weighted gradient-echo MRI may be correlated with a severe clinical and hemodynamic condition, and may be predictive for subsequent HT in patients receiving thrombolytic therapy. Our data provide further evidence of the potential benefit of T2∗-weighted imaging in the evaluation of patients with acute ischemic stroke (Hermier et al., 2001; Kidwell et al., 2002; Linfante et al., 1999; Patel et al., 1996; Schellinger et al., 1999), and suggest that such sequences should be integrated in the multimodal pretherapeutic MRI evaluation of acute stroke patients in whom rt-PA therapy is considered.
Footnotes
Acknowledgments
The authors thank Pr. Risto Kauppinen for his helpful advice, the Hospices Civils de Lyon research office for supporting this work, the Siemens Company for providing the ADC and TTP processing software, and Michèle Canova for her help in collecting the data.