
Abstract
Previous studies have demonstrated the utility of [nC]dihydrotetrabenazine ([11C]DTBZ) as a ligand for in vivo imaging of the vesicular monoamine transporter system. The (+)-isomer has a high affinity (approximately 1 nmol/L) for the vesicular monoamine transporter (VMAT2) binding site, whereas the (–)-isomer has an extremely low affinity (approximately 2 μmol/L). Efforts to model dynamic (+)-[11C]DTBZ data demonstrate the difficulty in separating the specific binding component from the free plus nonspecific component of the total positron emission tomography (PET) measure. The authors' previous*** PET work, as well as in vitro studies, indicate that there is little specific VMAT2 binding in neocortical regions. However, precise determination of in vivo binding levels have not been made, leaving important questions unanswered. At one extreme, is there sufficient specific binding in cortex or other extrastriate regions to be estimated reliably with PET? At the other extreme, is there sufficiently little binding in cortex so that it can be used as a reference region representing nonsaturable tracer uptake? The authors address these questions using paired studies with both active (+) and inactive (–) stereoisomers of [11C]DTBZ. Six normal control subjects were scanned twice, 2 hours apart, after injections of 16 mCi of (+)- and (–)-[11C]DTBZ (order counter-balanced). Three-dimensional PET acquisition consisted of 15 frames over 60 minutes for each scan. Arterial samples were acquired throughout, plasma counted, and corrected for radiolabeled metabolites. Analysis of specific binding was assessed by comparison of total distribution volume measures from the (+)- and (–)-[11C]DTBZ scans. The authors' findings indicate that only approximately 5% of the cortical signal in (+)-[11C]DTBZ scans results from binding to VMAT2 sites. The strongest extrastriatal signal comes from the midbrain regions where approximately 30% of the PET measure results from specific binding. The authors conclude that (1) the density of VMAT2 binding sites in cortical regions is not high enough to be quantified reliably with DTBZ PET, and (2) binding does appear to be low enough so that cortex can be used as a free plus nonspecific reference region for striatum.
Keywords
[11C]Dihydrotetrabenazine ([11C]DTBZ) and related radioligands have been demonstrated as suitable for in vivo imaging of the vesicular monoamine transporter (VMAT2) (Henry and Scherman, 1989; DaSilva and Kilbourn, 1992; Vander Borght et al., 1995; Koeppe et al., 1996; Chan et al., 1999). This work better assesses the relative contributions of specifically bound and free plus nonspecifically bound ligand to the overall positron emission tomography (PET) signal through the use of both active (+) and inactive (−) stereoisomers of [11C]DTBZ. The (+)-isomer has a high affinity (Ki = 0.97 ± 0.45 nmol/L) for the VMAT2 binding site, whereas the (−)-isomer has an extremely low affinity (Ki = 2.2 ± 0.3 μmol/L) (Kilbourn et al., 1995). Efforts to apply compartmental analysis to (+)-[11C]DTBZ data demonstrate a difficulty in differentiating kinetically the specific binding component from the free plus nonspecific component because of the rapid association of DTBZ with the VMAT2 binding site (Koeppe et al., 1996). Thus, one conclusion from our previous work was that an estimate of the total volume of distribution, rather than one of specific binding alone, provides the most stable estimates and the greatest ability for detecting changes in VMAT2 binding density. An estimate of total binding, although more stable, has the limitation that it contains signal from free plus nonspecific binding in addition to the specific binding. Because of the difficulty in defining the relative magnitudes of the two components kinetically, the fraction of total [11C]DTBZ uptake caused by specific VMAT2 binding is known with limited precision. This is of particular concern in areas such as cortex, which have relatively few binding sites.
Both kinetic estimates (Koeppe et al., 1996) and in vitro studies (Henry and Scherman, 1989) suggest that specific binding in cortex is low. However, whether this level is negligible or possibly as high as 30% to 40% of the total [11C]DTBZ signal was uncertain, thus leaving several questions unanswered: (1) Is there sufficient specific binding in cortex to be estimated reliably with PET? (2) Is there sufficiently little binding in the cortex that it could be used as a reference region for free+nonspecific binding? (3) Does a single-tissue compartmental model configuration describe accurately the in vivo kinetics of (−)-[11C]DTBZ? (4) Is the level of free plus nonspecific binding uniform across the brain? (In particular, if question 2 can be answered affirmatively, is the free plus nonspecific distribution volume of the cortex the same as that of the striatum?) (5) If the free plus nonspecific distribution volume is not uniform, what magnitude error in striatal binding potential (BP) estimates occur when using a reference region analysis? and (6) If there is not significant specific binding in cortex, are there any extrastriate regions that have sufficient VMAT2 density to be quantified reliably with PET? In this study, we explore these questions using paired studies with both (+)-and (−)-stereoisomers of [11C]DTBZ.
METHODS
Six normal control subjects, aged 21 to 53 years (mean 35 ± 10) were scanned twice each, once after injection of 600 ± 60 MBq (16 ± 1.6 mCi) of (+)-DTBZ and once after injection of 600 ± 60 MBq (16 ± 1.6 mCi) of (−)-DTBZ. No-carrier-added (+)- or (−)-[11C]DTBZ (300 to 1000 Ci/mmol at time of injection) was prepared as reported by Jewett et al. (1997). The sequence of injection of the two radioligands was counterbalanced to avoid order effects. One half of the dose was administered as a 30-second duration bolus, whereas the remaining half was infused continuously over the following 59.5 minutes of the study. Data were acquired on a ECAT EXACT-47 scanner (CTI PET Systems, Knoxville, TN, U.S.A.) with interplane septa retracted (three-dimensional mode). Each scan consisted of a 15 frame sequence of four 30-second scans, three 1-minute scans, two 2.5-minute scans, two 5-minute scans, and four 10-minute scans. Images were reconstructed using a Hann filter with 0.5 cutoff, yielding images of approximately 9 mm full-width at half-maximum. Attenuation correction was performed using measured two-dimensional transmission scans. All scans were corrected for scattered events. Blood samples were withdrawn through a radial artery at 10-second intervals for the first 2 minutes and then at progressively longer intervals for the remainder of the studies. Plasma was separated from red cells and counted in a NaI well-counter. The plasma radioactivity time course was corrected for radiolabeled metabolites using a rapid Sep-Pak C18 cartridge (Waters, Milford, MA, U.S.A.) chromatographic technique similar to that reported for scopolamine and flumazenil (Frey et al., 1991, 1992). Automated registration procedures were used to align all frames of both the (+) and (−) scans to the 10- to 15-minute frame of the first scan. Data then were reoriented to stereotactic coordinates and nonlinearly warped to match a standardized brain (Minoshima et al., 1993, 1994).
A two-tissue compartment first-order kinetic model and nonlinear least-squares analysis (Bevington, 1969) was applied to regional volume-of-interest (VOI) time-activity curves (TAC) for estimation of K1, k2, k3, and k4. The free plus nonspecific distribution volume (DVf+ns = K1/k2, the specific distribution volume (DVsp = [K1/k2] × [k3/k4]), and the total distribution volume (DVtot = [K1/k2 × [1 + k3/k4]) were calculated from these individual estimates. Cerebral blood volume and the temporal shift between brain and radial arterial blood were estimated as additional model parameters. In addition to the compartmental least-squares analysis on VOI, pixel-by-pixel Logan plot analysis (Logan et al., 1990) and equilibrium analysis yielded functional images of K1 and DVtot for both (+) and (−) scans. Details of the implementation of these methods are given in Koeppe et al. (1996, 1997). Normalized specific distribution volume, also commonly termed BP, was calculated using (1) direct compartmental modeling estimates of the specific and free plus nonspecific binding ([DVtot(+) − DVf+ns(+)]/DVf+ns(+) ≡ DVsp(+)/DVf+ns(+) ≡ k3(+)/k4(+)); (2) (−)-[11C]DTBZ as a measure of free plus nonspecific binding ([DVtot(+) − DVtot(−)]/DVtot(−)); and (3) a reference region (rr) assumed to contain only free plus nonspecific binding ([DVtot(+) − DVrr(+)]/DVrr(+)). For this last approach, we selected occipital cortex as the reference region.
VOI were created for 22 brain regions: caudate nucleus (left and right [l and r]); putamen (l and r); thalamus (l and r); ventral diencephalic nuclei; cerebellar hemispheres (l and r); mesencephalon; pons; hippocampus (l and r); superior frontal cortex (l and r); superior parietal cortex (l and r), lateral temporal cortex (l and r), occipital cortex, and white matter (l and r). Standard VOI based on the stereotactic atlas were applied to individual scans. To avoid biasing in favor of either (+) or (−) scans, average DVtot images of the (+) and (−) scans were created for each subject. The VOI were allowed to move slightly using an automated search to find the local maximum (or minimum in the case of white matter) for each brain region. These individualized VOI then were applied to the dynamic data sets to create the TACs for compartmental analyses. Left and right hemisphere regions were analyzed separately, then averaged within each subject before calculation of group means and SD. No significant hemispheric differences were detected.
RESULTS
Parametric images of the total distribution volume for (+)-[11C]DTBZ and (−)-[11C]DTBZ are shown in Fig. 1 (top and bottom, respectively). Images of the left column are at 32 mm above the anterior-posterior commissural line and show both cortical gray and white matter. The middle column of images are at the level of the striatum (+2 mm). Easily seen are the high levels of binding in both caudate and putamen in the (+) scan, but negligible binding above cortical levels in the (−) scan. The right column of images passes through the pons and cerebellum (−27 mm). Slightly greater levels of binding are seen in these structures than in cortex. Notice the slightly higher DV values in cortex for the (−) scan compared with the (+) scan, an unexpected finding consistent across the six subjects.
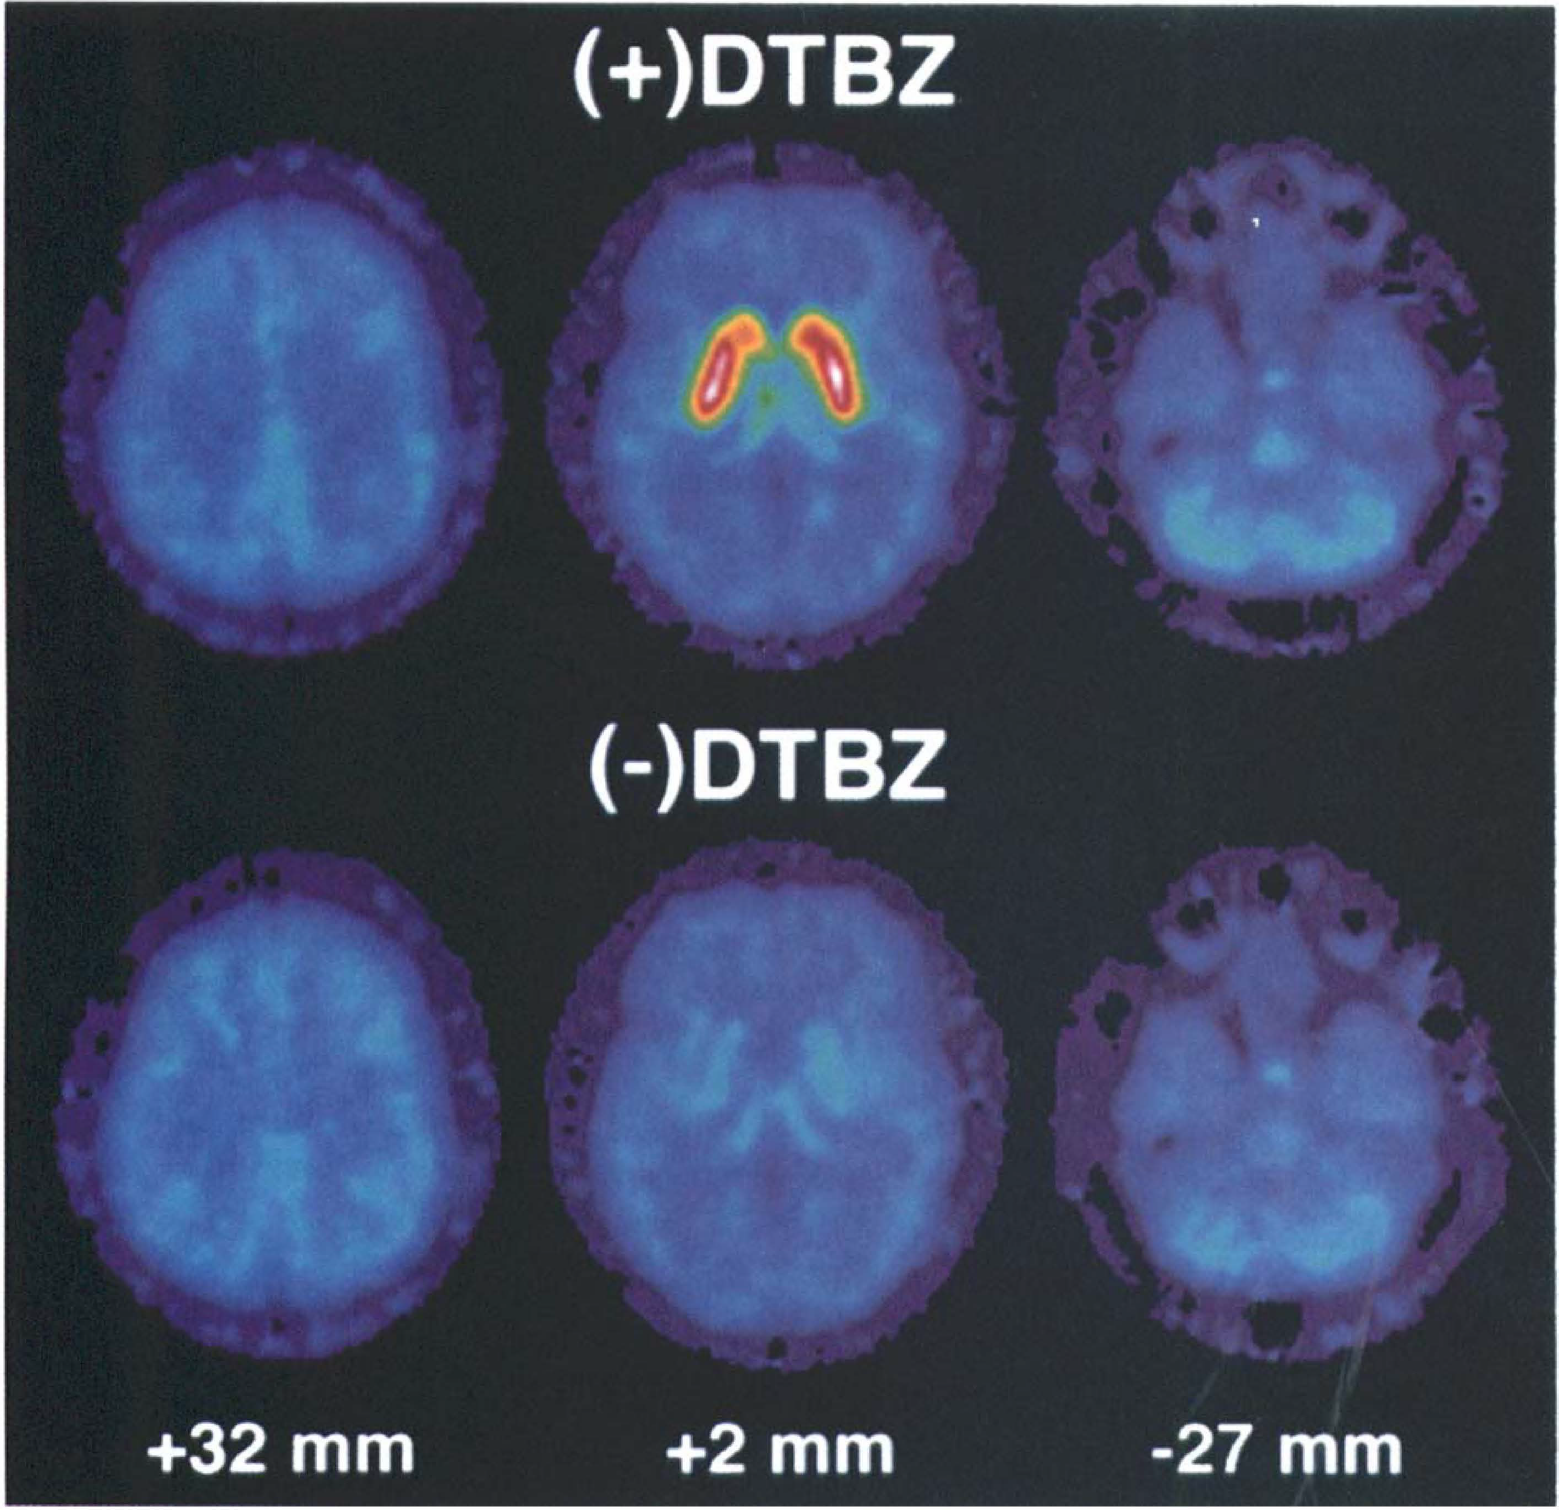
Functional images of the total distribution volume of active [(+)] [11C]dihydrotetrabenazine ([11C]DTBZ, top) and inactive [(−)] [11C]DTBZ (bottom) for three levels of the brain. Images were calculated using the graphical analysis of Logan et al. (1990).
Goodness-of-fit is demonstrated in Fig. 2. Shown are tissue TACs and least-squares fits for (+)-[11C]DTBZ (top) and (−)-[11C]DTBZ (bottom) from the same subject shown in Fig. 1. The panels display fits using both one-and two-tissue compartment configurations for putamen and occipital cortex. Interestingly, goodness-of-fit for the (−) studies as well as the (+) studies was improved significantly by inclusion of the second tissue compartment. A single-tissue model resulted in reduced χ2 values which averaged 3.1 and 4.2 across the group for the (−) and (+) studies, respectively. Fits with a two-tissue compartment model decreased the average reduced χ2 values to 1.1 and 0.7, respectively. Roughly the same degree of improvement was seen for all regions, irrespective of the level of VMAT2 binding.
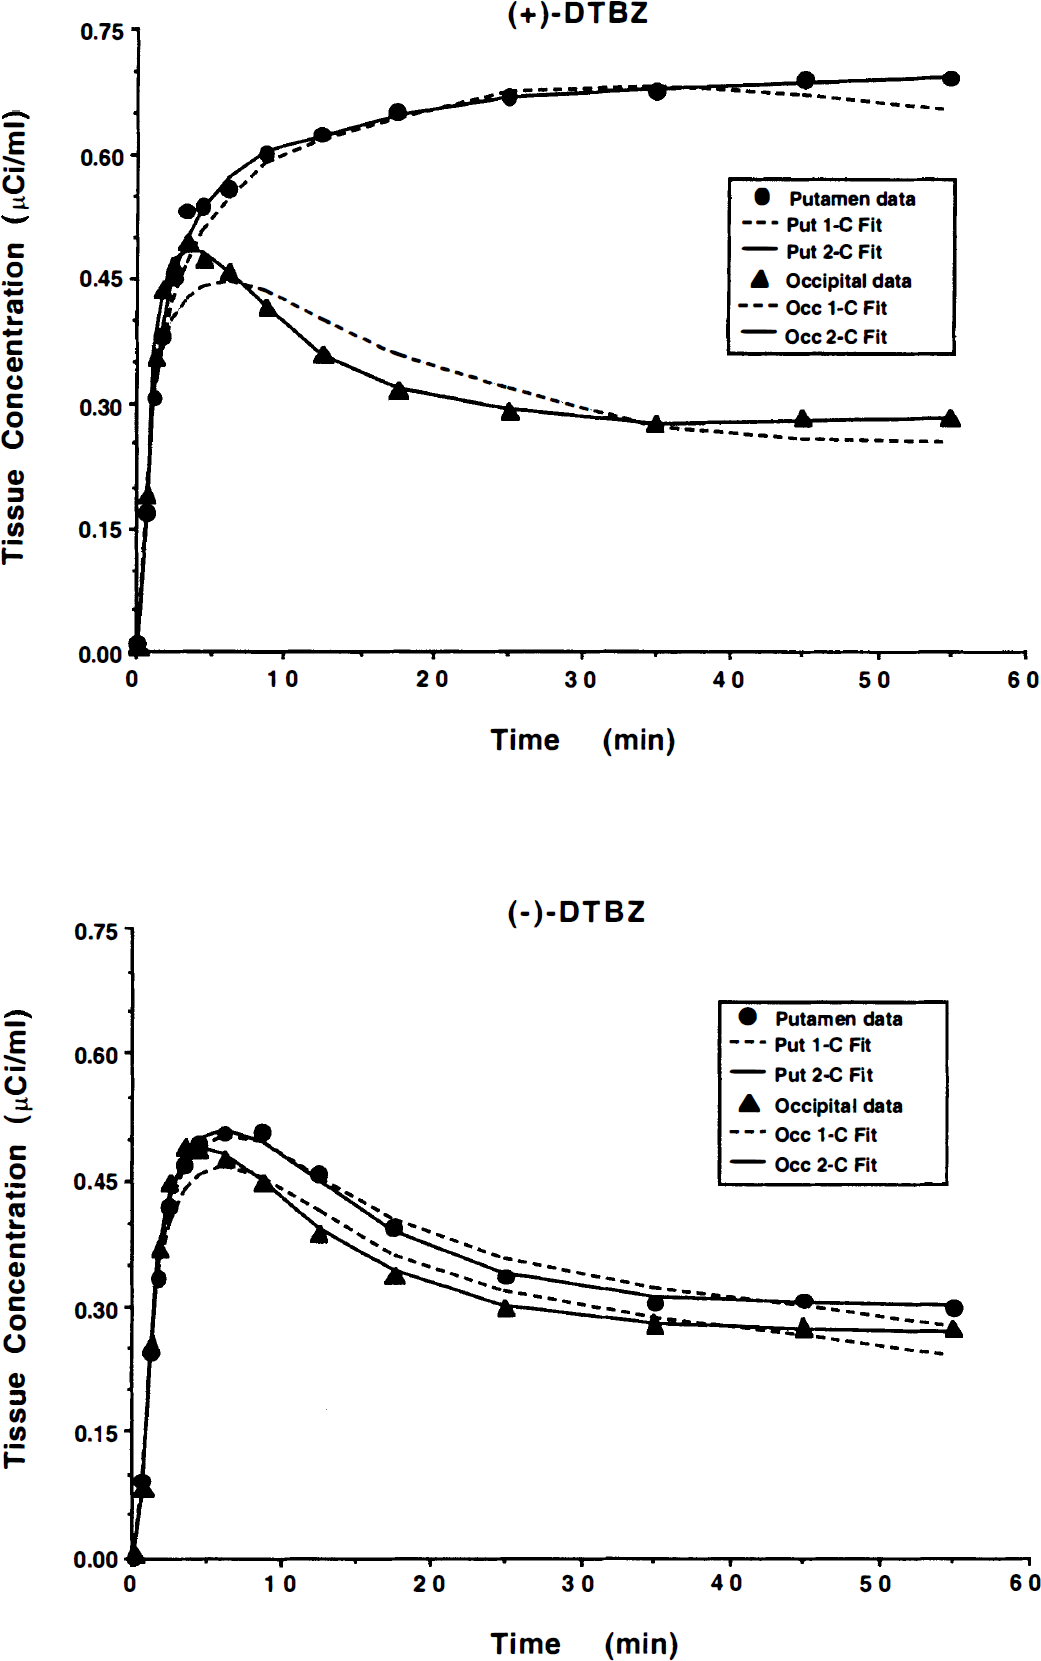
Time-activity curves and least-squares fits for (+)-[11C]DTBZ (top) and (−)-[11C]DTBZ (bottom) in putamen and occipital cortex. Shown are mean scan values (filled symbols) and fits derived using both one-tissue (1-C, dashed lines) and two-tissue (2-C, solid lines) compartment model configurations.
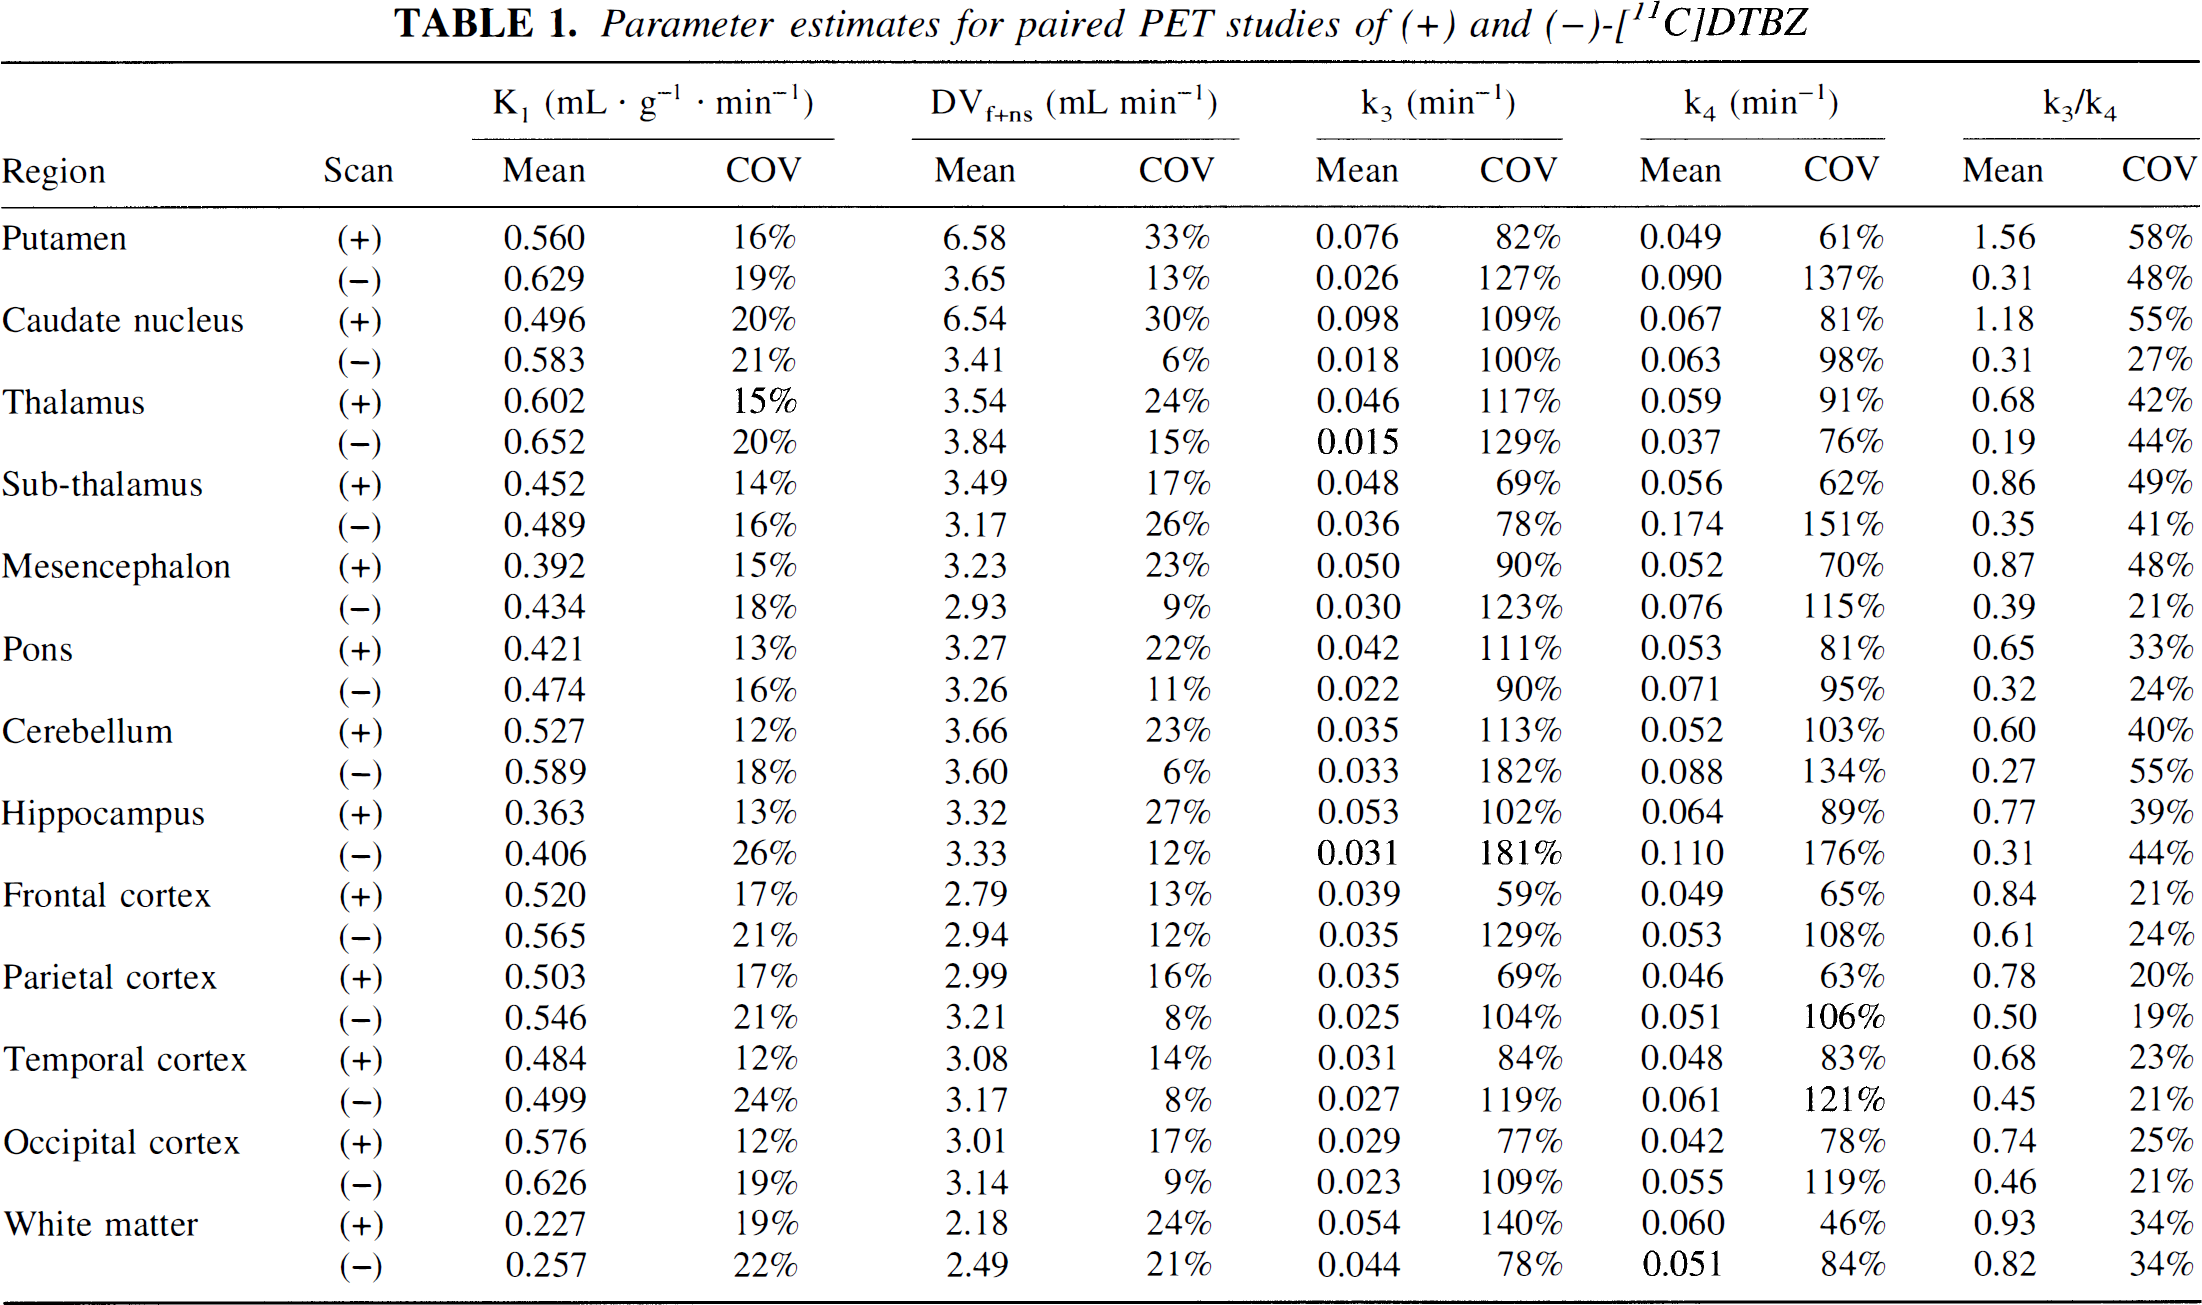
Nonlinear least-squares estimates of kinetic parameters from a two-tissue compartment model are given in Table 1 for both (+) and (−) stereoisomers (n = 6). Estimates of the transport rate constant, as expected, were nearly the same for the two tracers. The larger coefficients of variation for the (−) studies resulted largely from a single subject with unusually high K1 values in the (−) scan. Consistent with previous kinetic studies (Koeppe et al., 1996, 1997), the individual estimates of k3 and k4 were quite variable (coefficients of variation approximately 50% to 150%), but with correlated errors resulting in more stable estimates of the k3/k4 ratio (coefficients of variation approximately 205 to 55%). However, also as observed previously, neither k3/k4 nor DVsp estimates were as stable as estimates of DVtot, which had coefficients of variation of 105 to 15% (Fig. 3).
Parameter estimates for paired PET studies of(+) and (−)-[11C]DTBZ
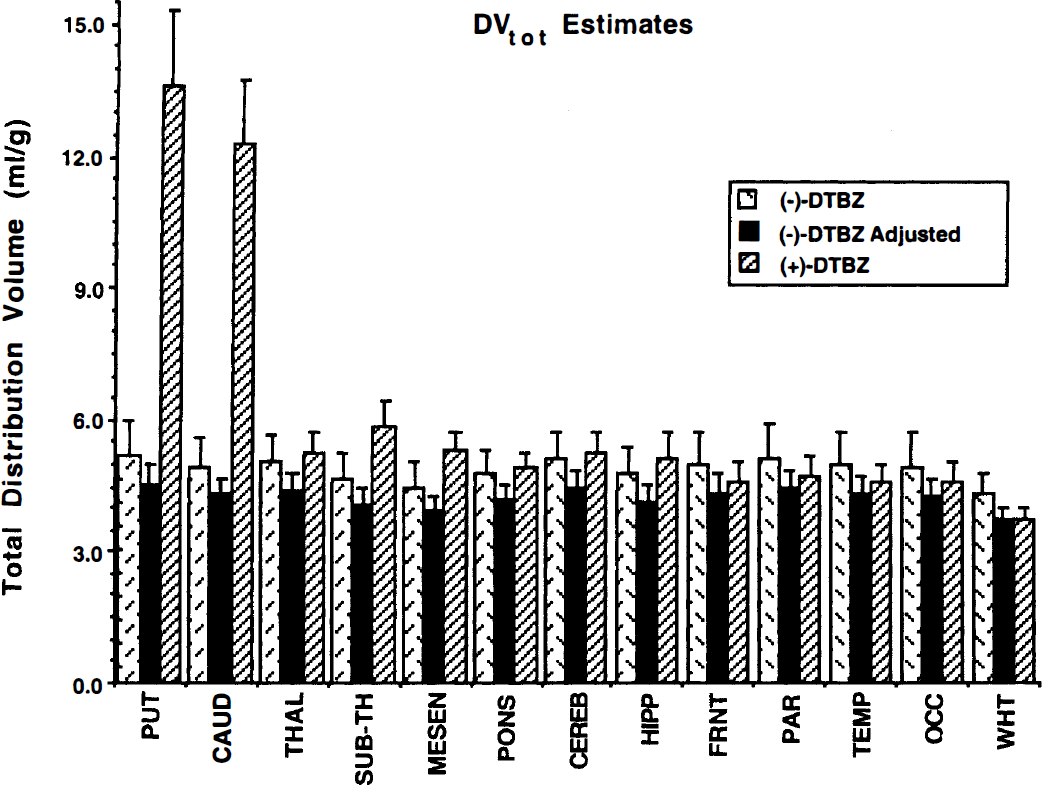
Regional estimates of the total distribution volume for (+)-[11C]DTBZ (right bar of each group) and (−)-[11C]DTBZ (left bar of each group). Also shown are adjusted (−)-[11C]DTBZ DVtot values after white matter normalization (see text for details).
The kinetically derived contributions of the two model compartments for both (+)- and (−)-isomers can be inferred from estimates of k3/k4 (Table 1). This ratio, the binding potential, gives the equilibrium contributions of the specific and free plus nonspecific components. In extrastriate regions for (+)-DTBZ, the specific component averages about 70% to 80% that of the free plus nonspecific component, or 40% to 45% of the total uptake, whereas for (−)-DTBZ, the specific component still averages nearly half that of free plus nonspecific, or about 30% of the total. The k3/k4 ratio exceeds 1.0 only in striatum for (+)-DTBZ; however, the estimates are more variable. DVf+ns is uniform except for the (+)-isomer in striatum, where values are higher, indicating a particular inability to differentiate the two tissue compartments accurately in areas of high binding. Thus, BP estimates calculated directly from individual (+)-[11C]DTBZ rate constants are both highly biased and imprecise.
The DVtot estimates derived from pixel-by-pixel analysis are shown in Fig. 3. Regional group means and SD are given for the (−) studies (cross-hatched bars) and (+) studies (striped bars). Although we predicted that DVf+ns would be the same for the two isomers, and thus the total DV would be higher for the (+)-isomer, our results showed that for cortex and white matter regions, DVtot estimates were slightly higher in the (−) than the (+) studies. Thus, we assumed VMAT2 binding in white matter to be insignificant and reexpressed each individual's DV estimates so that DVtot for white matter (DVWM) was the same for that subject's two studies. In practice, we adjusted the (−)-DTBZ values to match the (+)-DTBZ estimates, although the decision of which isomer to adjust was arbitrary. The adjusted (−)-DTBZ DV for a given VOI is calculated as DVVOI(−) × DVWM(+)/DVWM(−). These adjusted DVtot values are shown as the solid bars of Fig. 3.
Regional specific binding of (+)-[11C]DTBZ can be seen in Fig. 4. The ordinate on the left of the plot is DVtot for the (+)-isomer normalized to DVtot for the (−)-isomer, DVtot(+)/DVtot(−), and thus is equivalent to the ratio of total to free plus nonspecific binding. The right ordinate separates the normalized DVtot(+) into free plus nonspecific and specific components, as well as illustrating its relationship to binding potential (DVtot(+)/DVtot(−) ≡ [DVf+ns(+) + DVsp(+)]/DVtot(−) ≡ 1.0 + BP). The value of DVf+ns(+)/DVtot(_) is merely 1.0, since we assume the (−)-isomer to have only free plus nonspecific binding, whereas the normalized specific binding, DVsp(+)/ DVtot(_), is equivalent to the binding potential. These calculations used the adjusted (−)-DTBZ values are shown in Fig. 3. Only a small fraction of the total uptake of (+)-[11C]DTBZ in extrastriate regions, less than 10% in cortex, results from specific binding to VMAT2 sites.
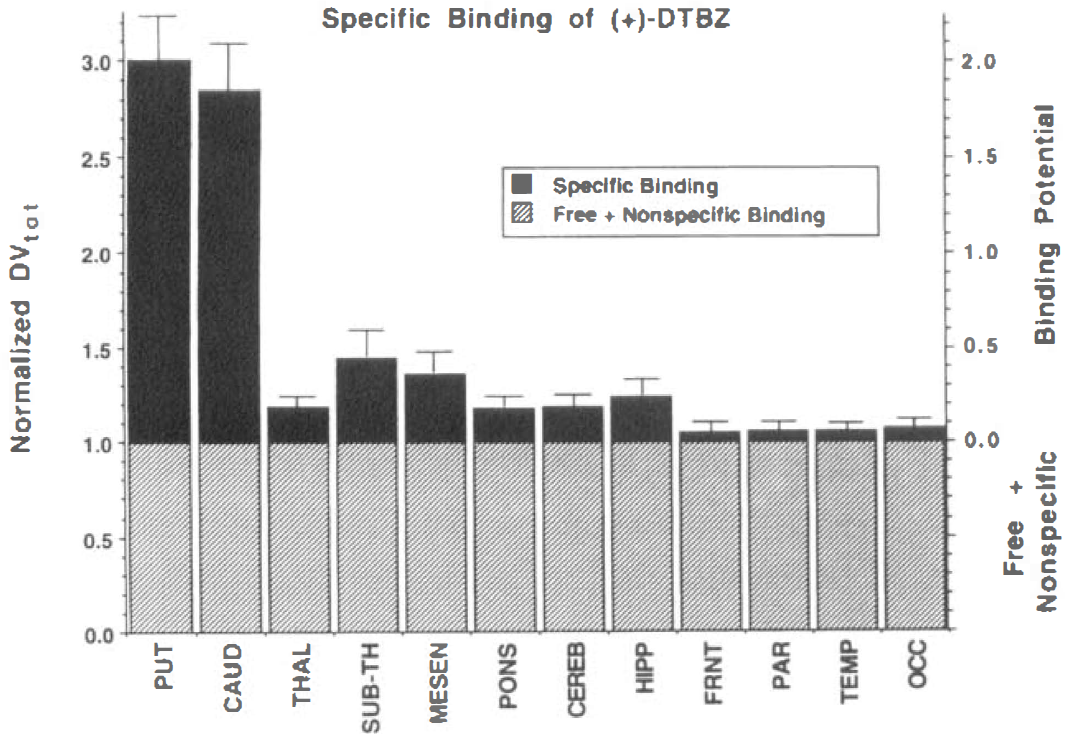
Regional normalized DVtot (+)-[11C]DTBZ estimates also shown as 1 plus binding potential (BP). The DVtot values for each region are normalized by the DVtot of the (−)-isomer for the same region. By displaying normalized DVtot as 1 + BP, the fraction of PET signal caused by specific binding becomes readily apparent.
Because the observed cortical binding was low, we proceeded to assess how well a reference region approach works with (+)-[11C]DTBZ. Validity of the approach requires that the total binding of the reference region be equal to the free plus nonspecific binding of the region under investigation. Previous studies (Frey et al., 1996; Gilman et al., 1996; Chan et al., 1999) report DTBZ binding values relative to occipital cortex. The degree to which the total binding of (+)-[11C]DTBZ in occipital cortex matches the level of free plus nonspecific binding in other brain regions is shown in Fig. 5. The free plus nonspecific component, as measured by the (−)-isomer, is only moderately uniform across the brain and is slightly lower, particularly in midbrain structures, than the binding levels of the (+)-isomer in occipital cortex. Thus, using occipital cortex as the reference region, the binding potential as given by [DVtot(+) –DVocc(+)]/DVocc(+) is underestimated, as shown in Fig. 6. The magnitude of the underestimation is greater in areas with lower free plus nonspecific binding (because too much is subtracted and the denominator is too large) and in areas with low specific binding (since the free plus nonspecific is a greater fraction of the total binding). In regions that have both low VMAT2 binding and lower free plus nonspecific uptake, the BP is underestimated by more than 50%. The same absolute underestimation may occur in the caudate nucleus, but because specific binding is much greater, the relative error in BP is much less.
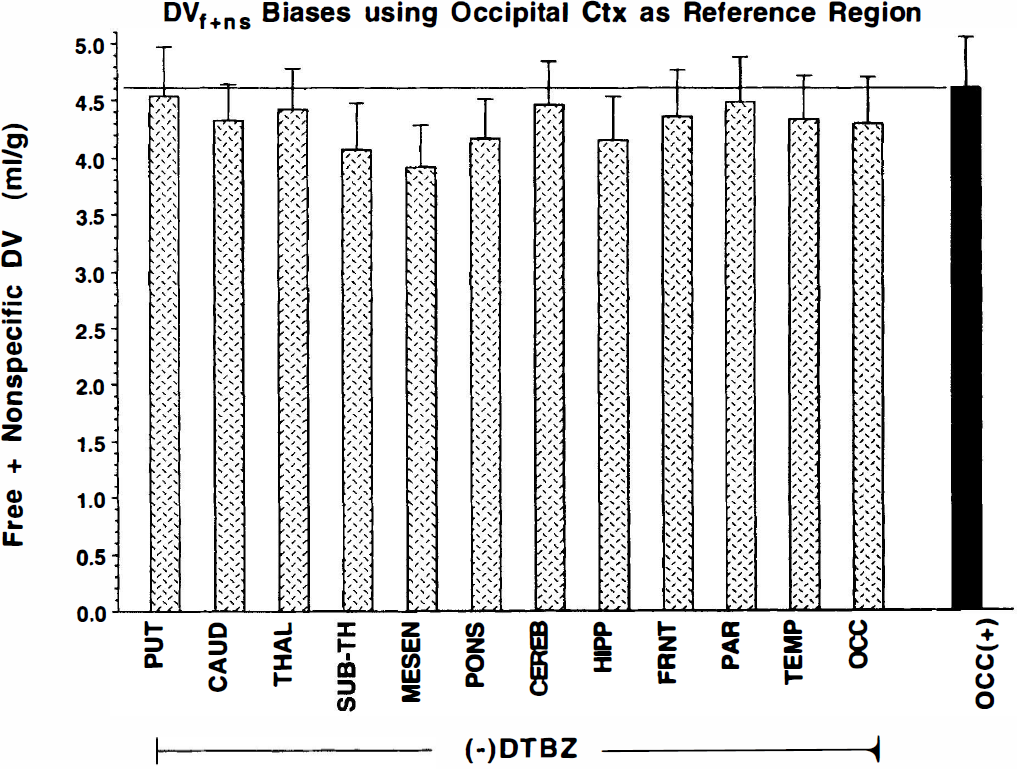
Comparison of regional DVtot estimates for (−)-[11C]DTBZ (cross-hatched bars) with (+)-[11C]DTBZ DVtot in occipital cortex (solid bar). Differences between regional values from the (−) study and occipital cortex from the (+) study determine the magnitude of the biases introduced in binding potential estimates if occipital cortex is used as a reference region for (+)-[11C]DTBZ studies.
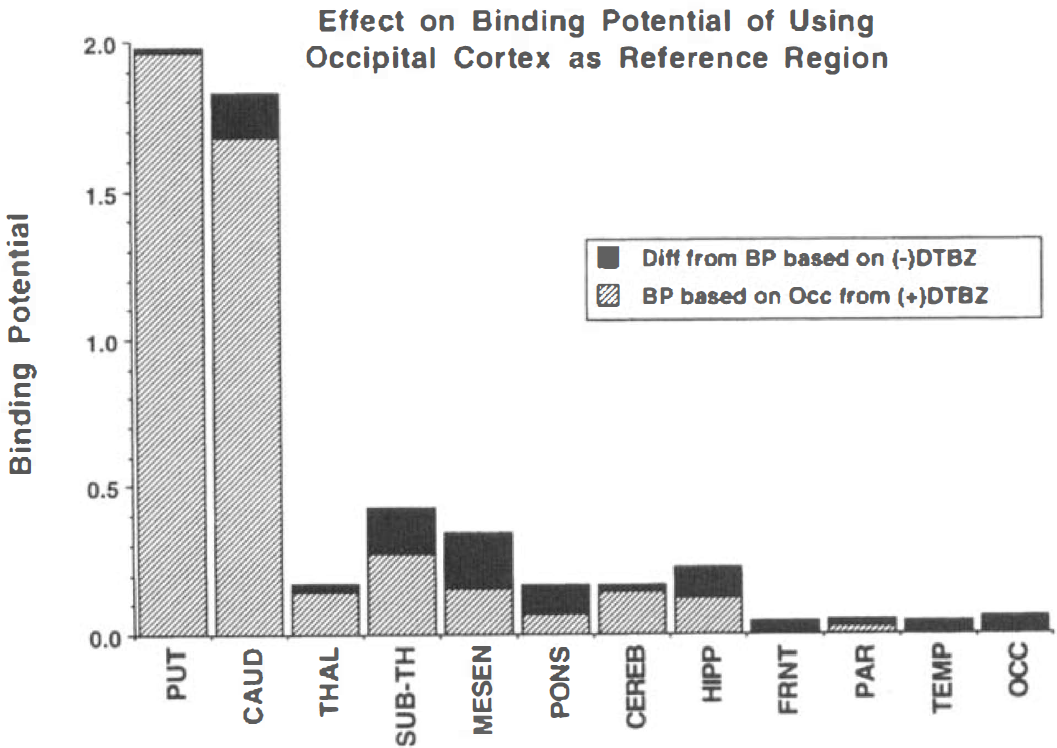
Differences in binding potential estimates using a reference region approach with (+)-[11C]DTBZ compared with those using paired scans with the (−)-isomer.
DISCUSSION
Multiple stereoisomers have been used for examining the degree of specific binding in a variety of neurophar-macologic imaging studies using PET or single photon emission computed tomography. Imaging of both active and inactive enantiomers has proved the presence of specific binding or uptake for many radiotracers, including l- and d-[11C]deprenyl (Fowler et al., 1987) used for imaging monoamine oxidase activity, (1R)-[123I]β-CIT and (1S)-[123I]β-CIT (Scanley et al., (1994) or [11C]d-threo-methylphenidate and [11C]l-threo-methylphenidate (Ding et al., 1997) for imaging the dopamine reuptake system, and [3H]-(−)-cyclofoxy and [3H]-(+)-cyclofoxy (Kawai et al., 1990b) for imaging opiate receptors. Quantitative imaging of the inactive enantiomer also has been used as a direct measure of free plus nonspecific binding in the analysis of the active enantiomer images. Such studies include [11C]raclopride and its inactive enantiomer (R)-[11C]FLB472 (Farde et al., 1988) for quantification of D2-dopamine receptors, [18F]-(−)-cyclofoxy and [18F]-(+)-cyclofoxy for kinetic analysis of opiate receptor studies in humans (Carson et al., 1989), [18F]-(−)-cyclofoxy and [3H]-(+)-cyclofoxy for autoradiographic imaging in rats (Kawai et al., 1990a, 1991), and (R)- and (S)-[125I]QNB (Sawada et al., 1990) or [123I]4-iododexetimide and [123I]4-iodolevetimide (Müller-Gärtner et al., 1992) for quantification of muscarinic cholinergic receptors. Obviously, to determine independently the level of free plus nonspecific uptake, one enantiomer must be inactive. For some enantiomer pairs, such as (S)-and (R)-[11C]nicotine (Nyback et al., 1994) or (S)- and (R)-N-methyl-[11C]ketamine (Hartvig et al., 1994), both are active. In other cases, such as using methyl-[11C]-l-methionine and methyl-[11C]-d-methionine, uptake may (Bergstrometal., 1987) or may not (Schober et al., 1987) be stereospecific, depending on which physiologic process is rate limiting. For [11C]DTBZ, the approximately 2 μmol/L affinity of the (−)-isomer for the VMAT2 binding site compared with the more than three orders of magnitude higher 1 nmol/L affinity of the (+)-isomer fully suffices for use as a measure of free plus nonspecific binding.
Our previous work with (+)-DTBZ indicates that two-tissue compartments were necessary to describe TAC in cortex in addition to striatum (Koeppe et al., 1996). This result suggests that quantifiable levels of specific VMAT2 binding might exist in cortex and other extrastriatal brain regions. Kinetic estimates of the compartmental distribution volumes in cortex from those subjects and the six individuals in this experiment (Table 1) distribute approximately 40% of the equilibrium (+)-[11C]DTBZ uptake into the specific binding compartment. However, blocking studies in animals suggest lower cortical VMAT2 levels (Vander Borght et al., 1995). If TAC from the (−)-DTBZ scans could be fitted using a single-tissue compartment model and the total distribution volume estimates matched the free plus nonspecific distribution volumes from the (+)-DTBZ scans, we would have greater surety in our ability to quantify VMAT2 binding in cortex.
As seen in Fig. 2, a single-tissue compartment model did not describe the kinetics of (−)-[11C]DTBZ. Because we assume that the appropriate model for the (+)- and (−)-isomers is the same except for the addition of a specifically bound compartment for (+), we can deduce from (−)-DTBZ fits that the necessity of a second tissue compartment for (+)-DTBZ, even in cortex, results, at least in part, to something other than specific binding. Possibilities include (1) slow equilibration between free and nonspecifically bound ligand, and (2) tissue heterogeneity where both gray and white matter contribute to any single voxel or VOI. In addition, DVtot estimates of the (−) scans not only exceeded the free plus nonspecific DV values of the (+) scans, they were higher than the total DV values in cortex for the (+) scans. Each of these factors argue against cortical VMAT2 levels sufficient for quantification using (+)-[11C]DTBZ and PET. The finding of elevated uptake in cortex in the (−) studies was unexpected and difficult to explain. Although this difference was small, it was consistent across subjects, ranging from 2% to 15%, averaging 8%. Order effects were ruled out because of counter-balancing and all six subjects showed the effect. Differences in the rate of plasma metabolite formation or errors in our metabolite assays might explain this result, although we did not detect any differences in the arterial plasma curves between the two isomers. This “global” difference between isomers was removed by normalization to white matter as shown in Fig. 3.
From these arguments, we conclude that the compartments of a standard two-tissue model configuration should not be interpreted as reflecting reliably free plus nonspecific and specific binding. Only estimates of the total equilibrium distributions of the tracers are useful. The most accurate measure of (+)-[11C]DTBZ binding potential is given as ([DVtot(+) − DVtot(−)]/DVtot(−)) or ([DVtot(+)/DVtot(−)] − 1). Results presented in Fig. 4 demonstrate clearly that the level of specific binding in extrastriatal regions is low. Cortical BP averaged only 0.06 ± 0.04, meaning the specific binding signal is only 6% that of free plus nonspecific signal. The highest binding levels outside of the striatum were found in the ventral diencephalic nuclei and mesencephalon, which had BP of 0.45 ± 0.14 and 0.36 ± 0.11, respectively. Thus, there is not sufficient (+)-[11C]DTBZ binding in cortex to be quantified accurately with PET. There is measurable binding in a few extrastriate structures; however, the sensitivity for detecting changes is limited because, at most, only approximately 30% of the PET signal is derived from VMAT2 binding.
Specific binding values have been calculated assuming white matter to be devoid of binding sites and thus the distribution volumes in white matter to be the same for both isomers. Recent in vitro studies in our laboratory measuring (+)-[3H]DTBZ binding in human brain sections yielded relative specific binding levels of 51, 49, 4.5, 3.7, and 1.0 for putamen, caudate nucleus, frontal cortex, occipital cortex, and white matter, respectively. In these experiments, white matter binding was approximately 25% of cortical and 2% of striatal levels. If these are the same in vivo, then we have underestimated cortical binding by about 25%, increasing BP values in cortex, but still only to about 0.08. If we also consider partial volume averaging between gray and white matter, the underestimation could be greater. However, even if there were 33% cross-contamination between gray and white matter measures, BP values in cortex would increase to only approximately 0.12. If the in vitro ratios between striatum and cortex of 12.5 were true in vivo, cortical BP could be as high as around 0.16. However, this still means that only one part in seven of the cortical PET signal would be related to specific VMAT2 binding. Considering all this information, we believe that the fraction of signal derived from specific VMAT2 binding in cerebral cortex is only 5% to, at most, about 15% of the total.
Although cortical binding is not adequate for precise quantification, it appears to be sufficiently low for use in a reference region approach. A reference region in the context of neuropharmalogic PET studies refers to a particular anatomic area of the brain that is assumed to be devoid of specific binding sites. Such a region can be used to provide a more accurate estimate of the level of free plus nonspecific uptake of tracer. Reference regions have been used for a variety of tracers and include cerebellum for the D2-dopamine receptors (Farde et al., 1986), occipital cortex for opiate receptors (Frost et al., 1989), and brain stem or pons for benzodiazepine receptors (Blomqvist et al., 1990). Biases in receptor density or the binding potential estimates occur if the reference region does not reflect accurately the level of free plus nonspecific binding. If some specific binding does occur in the reference region, then binding site density will be underestimated (Litton et al., 1995; Delforge et al., 1995; Lassen et al., 1995). However, another consideration besides the possible presence of specific binding in the reference region is the degree of regional nonuniformity in free plus nonspecific binding. The distribution of (−)-[11C]DTBZ (Fig. 5) appears to be moderately uniform, but still with enough variability to cause significant bias in binding potential estimates in some regions. These two sources of bias may tend either to cancel or to add. An example of the former is in the putamen where DVf+ns of occipital cortex is higher for (+)-DTBZ than (−)-DTBZ (because of some specific binding), but DVf+ns in putamen for the (−)-isomer also is higher than in occipital cortex and by about same amount, thus reducing the net error. An example of the latter is in the mesencephalon where the (−)-DTBZ DVf+ns in the occipital cortex is higher than in mesencephalon, thus compounding the error resulting from use of a reference region.
White matter might be considered as a reference region candidate because specific binding levels are less than in cortex. Although this would reduce the bias related to the reference region not be completely devoid of specific binding, white matter has lower free plus nonspecific binding levels than other regions, increasing the bias related to heterogeneity of DVf+ns, and thus causing overestimation of the binding potential. Furthermore, consistent definition of white matter regions may be problematic for a variety of reasons. Partial volume contributions both from cortex and from CSF may be significant and may vary with age. We should caution that whereas we have focused on how best to estimate binding potential, the estimation of BP inherently involves normalization to a region assumed not only to be devoid of specific binding, but also to be invariant across subjects and between groups. Thus, any use of a reference region has the potential of being flawed. If DVf+ns of the reference region differs between groups, yet the absolute levels of specific binding are the same, estimates of the binding potential, in fact, will appear different although binding is unchanged.
Figure 6 shows error magnitudes when using occipital cortex as a reference region caused by the combined effects of small levels of specific binding in the occipital cortex and nonuniformity in free plus nonspecific distribution across the brain. What little binding that does exist in the cortex is now missed entirely. Because cortical binding is too low to quantify accurately anyway, this is not a concern. However, the binding potentials in the ventral diencephalic nuclei, mesencephalon, pons, and hippocampus are underestimated by around 50%, making accurate quantification even more difficult. To examine regions with lower binding, we would propose a first-order correction where the standard reference region from cortex would be adjusted by a multiplier based on the regional DVtot values shown in Fig. 5. For example, DVtot for (−)-DTBZ in the mesencephalon was 88.5% of that for (+)-DTBZ in occipital cortex. Therefore, BP in mesencephalon calculated from the (+)-DTBZ scan alone is given by [DVtot(mesen) − (0.885 × (DVtot(occ))]/(0.885 × DVtot(occ)). Whereas the intersub-ject SD of DVtot estimates for (−)-DTBZ averaged about 12% across regions, the SD of values relative to occipital cortex averaged only 5.5%. Thus, the correction is feasible and should better than halve this source of bias.
The DVtot estimates reported here were derived from pixel-by-pixel estimates using the graphical method of Logan et al. (1990). Estimates from single- or dual-tissue compartment nonlinear least-squares, weighted integral, or equilibrium analyses yielded comparable results. Although there were slight differences in absolute DVtot measures across the methods consistent with what has been reported previously (Koeppe et al., 1997), these differences were similar for both (+) and (−) scans, and thus binding potential estimates based on (DVtot(+)-DVtot(−))/DVtot(−) showed no consistent difference across methods. The same conclusions are reached irrespective of analytical approach, namely, no VMAT2 binding quantifiable by [11C]DTBZ exists in cortex; however, cortex can serve as a reference region.
In summary, we have performed studies on six normal volunteers using both active and inactive stereoisomers of [11C]DTBZ with the goal of assessing better the degree of VMAT2 binding in extrastriate regions of the brain. A single-tissue compartment model was not able to describe the in vivo kinetics of the inactive isomer, (−)-[11C]DTBZ, indicating that standard interpretation of a two-tissue compartment model (i.e., free plus nonspecific and specific compartments) for DTBZ is problematic. Binding potential calculations indicate that only approximately 5% of the PET signal in cortex results from specific binding. Thus, although quantification of VMAT2 binding density in cortex is futile, cortical structures may be used for reference region analysis. VMAT2 binding in other extrastriate regions, such as the ventral diencephalic nuclei and mesencephalon, was detectable, but with limited sensitivity because of (1) the level of nonspecific binding, and (2) biases arising from regional nonuniformity of the free plus nonspecific tracer distribution when using a reference region approach. Any PET investigation with a primary focus on extrastriatal VMAT2 binding should consider development of a new ligand with an affinity constant 10 to 50 times higher than DTBZ.
Footnotes
Abbreviations used:
STATEMENT OF OWNERSHIP, MANAGEMENT AND CIRCULATION (Act of August 12, 1970; Section 3685, Title 39 United States Code) Date of Filing—October 1, 1999. Title of Publication—Journal of Cerebral Blood Flow and Metabolism; Frequency of Issue—Monthly; Annual Subscription Price—$389.00, Location of Known Office of Publication—12107 Insurance Way, Suite 114, Hagerstown, MD 21740; Location of the Headquarters of General Business Offices of the Publisher—Lippincott-Raven Publishers, 227 East Washington Square, Philadelphia, PA 19106; Publisher—Lippincott-Raven Publishers, 227 East Washington Square, Philadelphia, PA 19106; Editor—James McColloch, Wellcome Surgical Institute, University of Glasgow/Garscube Estate, Bearsden Road, Glasgow, Scotland G61 1QH; Managing Editor—Marie Chesney, Lippincott Williams & Wilkins, 227 East Washington Square, Philadelphia PA 19106; Owner—International Society of Cerebral Blood Flow and Metabolism, University of Michigan, R5605 Kresge I, 1500 E. Medical Drive, Ann Arbor, MI 48109–0532; Known Bondholders, Mortgagees, and other security holders owning or holding 1 percent or more of total amount of bonds, mortgages, or other securities—None. A. Total no. copies printed (net press run), average 1,870, actual 1,800; B. Paid circulation 1. Sales through dealers and carriers, street vendors and counter sales, average none, actual none; 2. Mail subscriptions, average 1,089, actual 1,122; C. Total paid circulation, average 1,089, actual 1,122; D. Free distribution by mail carrier or other means. Samples complimentary, and other free copies, average 110, actual 79; E. Total distribution (Sum of C and D), average 1,199, actual 1,201; F. Copies not distributed 1. Office use, leftover, unaccounted, spoiled after printing, average 671, actual 599; 2. Returns from news agents, none; G. Total (Sum of E and F—should equal net press runs shown in A), average 1,870, actual 1,800. I certify that the statements made by me above are correct and complete. Abbe Nelson, Manager, Periodical Operations.