
Abstract
Fluoxetine inhibits the reuptake of serotonin, and dextroamphetamine enhances presynaptic release of monoamines. Although the excitatory effect of both noradrenaline and dopamine on motor behavior generally is accepted, the role of serotonin on motor output is under debate. In the current investigation, the authors evidenced a putative role of monoamines and, more specifically, of serotonin in the regulation of cerebral motor activity in healthy subjects. The effects on cerebral motor activity of a single dose of fluoxetine (20 mg), an inhibitor of serotonin reuptake, and fenozolone (20 mg/50 kg), an amphetamine-like drug, were assessed by functional magnetic resonance imaging. Subjects performed sensorimotor tasks with the right hand. Functional magnetic resonance imaging studies were performed in two sessions on two different days. The first session, with two scan experiments separated by 5 hours without any drug administration, served as time-effect control. A second, similar session but with drug administration after the first scan assessed drug effects. A large increase in evoked signal intensity occurred in the ipsilateral cerebellum, and a parallel, large reduction occurred in primary and secondary motor cortices (P < 10–3). These results are consistent with the known effects of habituation. Both drugs elicited comparable effects, that is, a more focused activation in the contralateral sensorimotor area, a greater involvement of posterior supplementary motor area, and a widespread decrease of bilateral cerebellar activation (P < 10–3). The authors demonstrated for the first time that cerebral motor activity can be modulated by a single dose of fluoxetine or fenozolone in healthy subjects. Drug effects demonstrated a direct or indirect involvement of monoamines and serotonin in the facilitation of cerebral motor activity.
Keywords
Fluoxetine is well known to inhibit the reuptake of serotonin, and dextroamphetamine to enhance presynaptic release of monoamines (noradrenaline, dopamine, serotonin). Fluoxetine and dextroamphetamine may facilitate motor recovery in poststroke patients undergoing rehabilitation (Dam et al., 1996; Walker-Batson et al., 1995). Many lines of evidence suggest that amphetamine-promoted recovery of function is mediated mainly noradrenergically (Goldstein et al., 1991, 1993; Boyeson et al., 1990). Intracerebral reorganization has been demonstrated to occur after stroke in humans (Chollet et al., 1991, 1994). We postulate that these drugs can interact with reorganization processes. Although the beneficial effect of noradrenaline (Goldstein et al., 1993, 1995; Small et al., 1994), and, to a lesser extent, of dopamine (Feeney et al., 1982), has been demonstrated in animal and clinical studies, the incidence of serotoninergic modulation on motor recovery is highly controversial (Dam et al., 1996; Boyeson et al., 1996, 1994). Dam et al. found that chronic fluoxetine treatment at clinical doses enhanced the rate of recovery of poststroke patients, whereas Boyeson et al. found that serotonin modulation was ineffective in improving motor deficit in animals. Moreover, the excitatory effect of both noradrenaline and dopamine on motor behavior generally is accepted (McMillen et al., 1993; Kuczenski et al., 1995), whereas the role of serotonin on motor output is being discussed. It has been reported to be excitatory (Geyer et al., 1996; Hasbroucq et al., 1997; Veasey et al., 1995), inhibitory (Porrino et al., 1997), or both excitatory and inhibitory (Geyer et al., 1996; Jacobs et al., 1993; Elliot et al., 1992; Mangan et al., 1994a, b ). Although the role of serotonin in motor control has been only vaguely suggested, it cannot be discarded and could consist of a modulation of behavioral activity (Jacobs et al., 1993, 1997). In addition, because poststroke depression is a common sequel of stroke, 5-HT (serotonin) involvement in motor or nonmotor functions (i.e., visual, linguistic) and in motor or nonmotor recovery should be evidenced. The current investigation demonstrates the putative role of monoamines, including that of serotonin, in the regulation of cerebral motor activity in healthy subjects. The study addresses the pharmacologic modulation of motor-evoked responses and does not deal with the main effects of drugs per se. Pharmacologic compounds were chosen to modulate monoamine neurotransmission. Fenozolone (Ordinator), an amphetamine-like drug, increases transmission of all monoamines. Fluoxetine (Prozac) increases serotoninergic transmission more specifically because of its selective inhibition of serotonin reuptake. Blockade of uptake increases synaptic availability of serotonin, thereby, enhancing receptor activation and serotoninergic transmission. Effects on cerebral motor activity of single and low doses of fenozolone or fluoxetine were assessed separately by functional magnetic resonance imaging (fMRI). The fMRI studies were performed in two sessions on two different days. Such pharmacologic studies need to be performed with caution, since reproducibility problems or habituation-like effects may happen. The first session, with two scan experiments separated by 5 hours, without any drug administration, was used to check for time or habituation effects. Habituation is likely to occur when experiments are separated by 5 hours. A second, similar session with drug administration after the first scan assessed drug effects. As a first approach, we deliberately chose not to administer a placebo to bring out time effects alone. Time effects then were taken into account in the evaluation of drug effects.
MATERIALS AND METHODS
Our experiment investigated the pharmacologic modulation of motor-evoked hemodynamic responses. This is a drug-by-condition interaction. However, because the drug could be administered only after a period of predrug motor activation, drug-by-condition interactions also could be explained by time-by-condition interactions. To check this possibility, we repeated the same experiment on a separate day but without any drug. The modulatory effect of the drug that cannot be explained by time-dependent habituation or augmentation of response then is simply the drug × condition × day interaction. This is indeed a drug-dependent difference in motor-evoked responses that persists once differences caused by nonspecific adaptation have been subtracted.
Subjects
The study was performed with the approval of our Institutional Human Studies Committees. All subjects gave written informed consent to the study.
Twelve healthy, right-handed volunteers (six women and six men; mean age, 48 ± 7 years; range 41 to 63 years) were studied.
Paradigm
Time effects between two examinations performed at a few hours' interval were assessed during a first session in which subjects repeated two identical MRI examinations separated by 5 hours without taking any drugs (E1: examination 1, day 1 at 8 am; E2: examination 2, day 1 at 1 pm).
Drug effects were assessed in a second session in which the same subjects repeated the same two examinations once more: one before drug administration (E3: examination 3, day 2 at 8 am), and one after drug administration (E4: examination 4, day 2 at 1 pm). Subjects in group I (n = 6) were given fenozolone (20 mg/50 kg; 2 hours before E4), and subjects in group II (n = 6) were given fluoxetine (20 mg; 4 hours before E4) at the peak plasma concentrations (Lemberger et al., 1985; Altamura et al., 1994). Several weeks separated the two sessions to avoid habituation from taking place (group I, mean 60 days; group II, mean 42 days). Sessions assessing time or drug effects were not counterbalanced within subjects because time separating the two sessions was long (2 months). However, this point was taken into account in the statistical assessment of drug effects.
Task paradigm
The task paradigm consisted of eight 30-second epochs alternating between rest (R) and activation (A), resulting in an acquisition time of 4 minutes per functional time series. During “activation,” subjects were instructed to perform an auditory 1-Hz paced task that alternated between two fist closings and sequential touching of the thumb with each of the four digits of one single hand. During “rest,” subjects were told to relax and not think about finger movements. Subjects were instructed to keep their eyes closed. The 1-per-second auditory signal continued throughout the activation and rest periods. To increase the signal-to-noise ratio, the task was repeated over three runs (R-A-R-A-R-A-R-A was repeated over run 1, run 2, and run 3) so that each run included four pairs of rest-activation periods.
Before the subjects were positioned in the scanner, the tasks were explained to them in a preliminary session without any further training. We verified that the subjects performed the task correctly. The execution of the tasks during scanning was inspected visually, and all subjects were seen to comply with the auditory pacing. Head motion was minimized by using foam padding and ear blocks.
Data acquisition
Magnetic resonance imaging was performed on a 1.5-T scanner (Siemens Vision, Erlangen, Germany) equipped for echo-planar imaging. A three-dimensional, high-resolution T1-weighted data set of the whole brain (three-dimensional magnetization-prepared rapid acquisition gradient echo) was acquired for each volunteer (repetition time 15 milliseconds; echo time 7 milliseconds; inversion time 300 milliseconds; 12° flip angle; 30 × 30 cm field of view, 256 × 256 matrix, voxel size = 1.17 × 1.17 × 1 mm3, 128 slices). After sagittal localization images, 12 contiguous, 5-mm thick, axial anatomic images were obtained from the plane of the anterior-posterior commissural line through the vertex and four contiguous images of the cerebellum were acquired (T2-weighted images, repetition time 418 milliseconds, echo time 10 milliseconds, 30° flip angle, 20 × 20 cm field of view, 128 × 128 matrix).
For fMRI studies, blood oxygen level-dependent imaging was performed using a T2*-weighted single-shot echo-planar imaging sequence (repetition time 8 milliseconds, echo time 60 milliseconds, 90° flip angle, 20 × 20 field of view, 64 × 64 matrix, 3.125-mm inplane resolution, 5-mm slice thickness). Sixteen slices (12 + 4) were acquired every 3 seconds, coincident with the T2-weighted reference images.
Functional magnetic resonance image postprocessing
Image analysis was carried out on a SPARC workstation (Sun Microsystems, Surrey, U.K.) using interactive image display software (Analyze, Biodynamics Research Unit, Mayo clinic, Rochester, MN, U.S.A.), matlab (Math Works, Inc., Natick, MA, U.S.A.), and SPM96 4 2.c software (Wellcome Department of Cognitive Neurology, London, U.K.). The first four images of each time series were discarded to eliminate signal intensity variations arising from progressive saturation. Echo-planar imaging images were realigned to the first functional image of each time series to remove residual head movement. The functional images of each subject and of each time series were coregistered with the first functional image of one subject taken as a model. Images then were resized into the standard anatomic space defined by the atlas of Talairach and Tournoux (1988) to perform a group analysis. The images were smoothed with a Gaussian kernel of full-width at half-maximum of 6 mm to reduce the anatomic and functional variability between the subjects.
Next, statistical parametric maps were generated to identify areas of interest that covaried positively with movements (Friston et al., 1995). The differences between baseline and activation were assessed with the t statistic at each voxel for each run of each subject separately. All images were inspected for evidence of misregistration (e.g., edge effects, rims of activity along the cortical surface, absence of activity). Scans in which obvious movement artifacts were identified were excluded from subsequent analysis. A thirteenth subject was excluded because of excessive movement. All subjects displayed activation foci in the contralateral primary sensorimotor cortex (Sl/ Ml).
Group analysis then was performed on the 12 remaining subjects.
First, runs were averaged giving statistical parametric maps of the difference [ACTI − REST]E1 > 0. These maps were calculated for the first examination E1 (n = 12) and thresh-olded: Z score > 3.09 for peak height and P < 0.05 for the cluster (corrected for multiple comparisons) (Friston et al., 1995) (Fig. 1A). They were overlaid onto the anatomic three-dimensional images. Only changes in these activated areas were considered for the following statistics (the condition E1 > 0 is specified as a mask with SPM software).
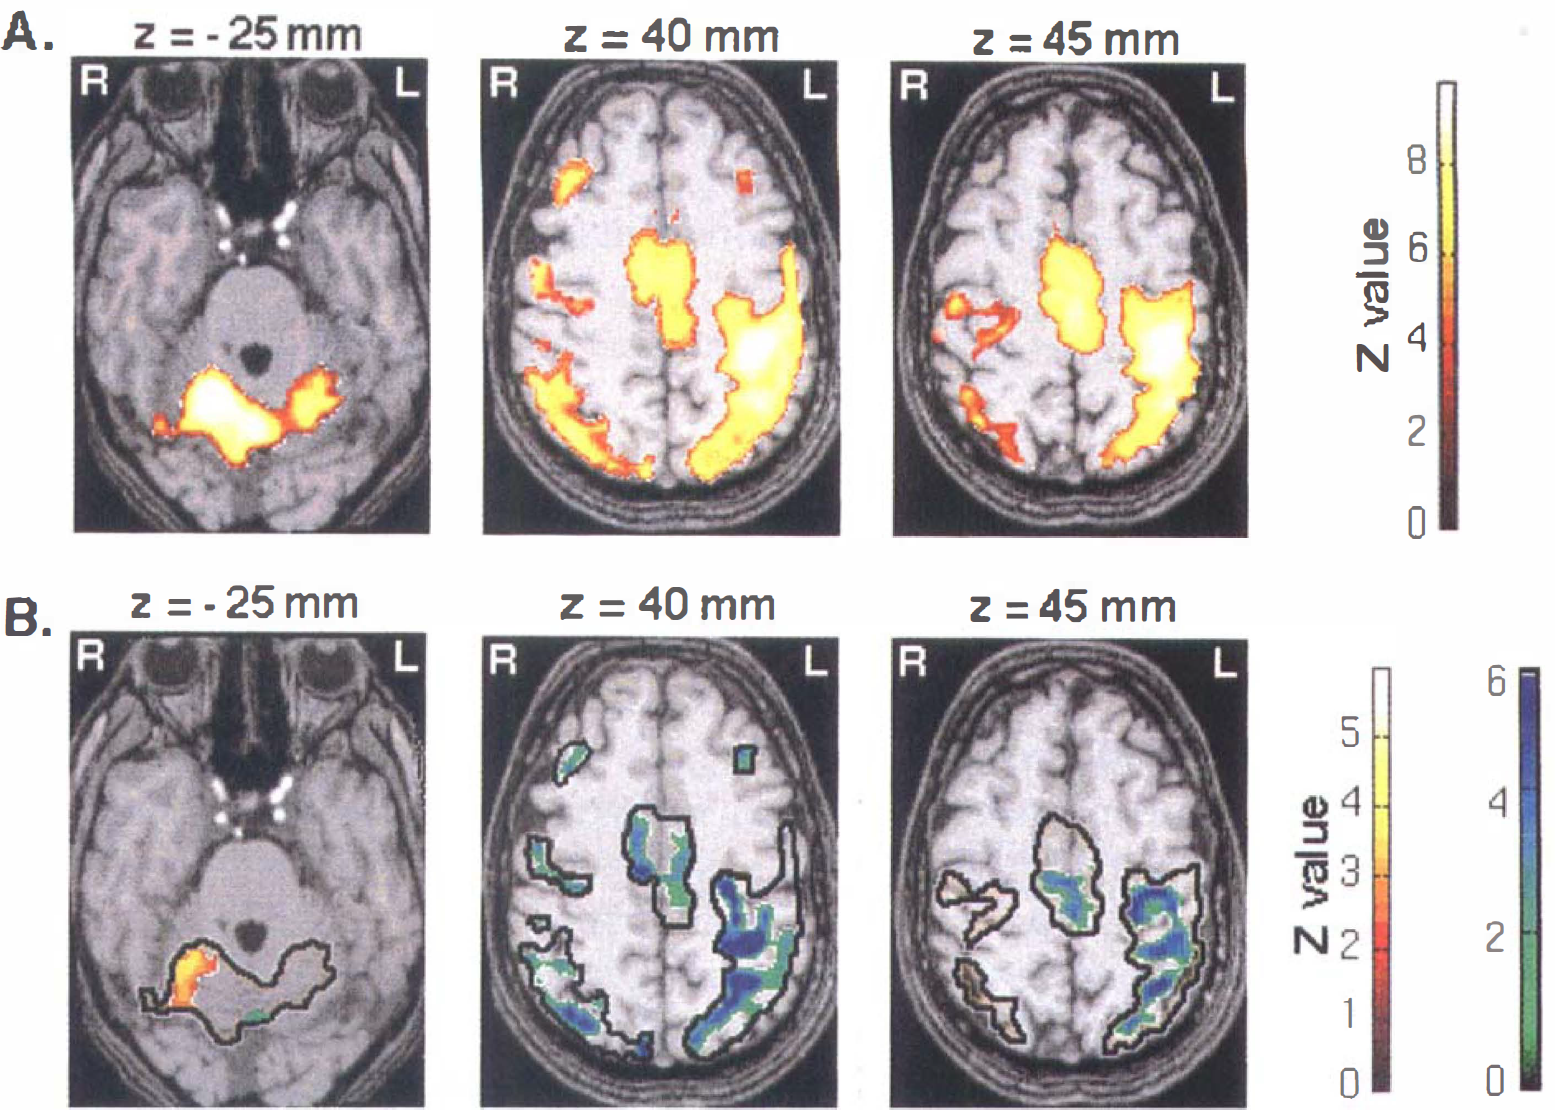
(A) Activated foci by right finger movements (ACTI − REST) > 0 superimposed on T1-weighted magnetic resonance images (n = 12). Three transaxial images of −25, 40, and 45 mm under and above the anterior-posterior commissural line are shown. The pixels in yellow show level of statistical significance above P < 0.001 for peak height and P < 0.05 for spatial extent (corrected for multiple comparisons). A corresponding Z score bar is provided. Left side of the figure corresponds to the right hemisphere. Notice a large activation mainly in the cerebellum ipsilateral to the movement and in primary and secondary motor cortices.
Second, the statistical parametric maps ACTI − REST of examinations E1 and E2 were compared to determine putative time effects. We generated statistical parametric maps of the following:
[(ACTI − REST)E2 − (ACTI − REST)E1] > 0, and [(ACTI -REST)E2 − (ACTI − REST)E1] < 0, which is, in a more simplified form,
E2 − E1 > 0 increased evoked signal with time, and
E2 − E1 < 0 decreased evoked signal with time (n = 12; Z score > 2.32, P < 0.01 uncorrected for multiple comparisons, corrected for spatial extent, E1 > 0).
Third, drug effects were assessed in each group by the statistical differences between E4 and E3, from which were subtracted the time effects previously assessed between E1 and E2 within each group:
(E4 − E3) − (E2 − E1) > 0 or
(E4 − E3) − (E2 − E1) < 0
(fenozolone group: n = 6; fluoxetine group: n = 6; Z score > 2.32, P < 0.01 uncorrected for multiple comparisons, corrected for spatial extent, E1 > 0). In a conservative approach and because the time effect evaluated between E1 and E2 could not be perfectly reproducible between E3 and E4 despite the long delay that separated the sessions, we evaluated only drug effects that were inversely correlated to time effects:
Case 1: (E4 − E3) − (E2 − E1) > 0 and E2 − E1 < 0 and E4 − E3 > 0, postdrug-evoked signal increases
Case 2: (E4 − E3) − (E2 − E1) < 0 and E2 − E1 > 0 and E4 − E3 < 0, postdrug-evoked signal decreases.
RESULTS
Activation maps
Figure 1A shows the group statistical parametric maps for the condition ACTI − REST > 0 obtained during the first examination E1 (n = 12). Areas of activation included mainly contralateral and, to a lesser extent, ipsilateral primary sensorimotor cortex (S1/M1), parietal cortices (Brodmann area [BA] 40, BA 7), supplementary motor area (SMA), cingulate cortex (BA 24, BA 32), bilateral premotor cortices, frontal cortices (BA 8–9), contralateral thalamic nuclei, and cerebellum. Presence and size of all activated areas, including the contralateral S1/M1 cortex, were variable among subjects.
Interaction between time and movement: time effects
Significant evoked signal intensity changes were observed between examinations E1 and E2 (P < 10–3; n = 12). A large increase in signal intensity occurred in a restricted area of the ipsilateral cerebellar cortex, and a parallel large reduction of signal intensity occurred in some parts of the primary and secondary motor cortices, including the posterior SMA (Fig. 1B; Table 1). Notice that the decrease in sensorimotor activation spared the center of the S1/M1 area (knob of the central sulcus) so the area of activation was restricted, whereas the intensity of activation remained stable in the center of the S1/M1 area between examinations E1 and E2.
Comparisons of activations [ACTI-REST] between E1 and E2 examinations
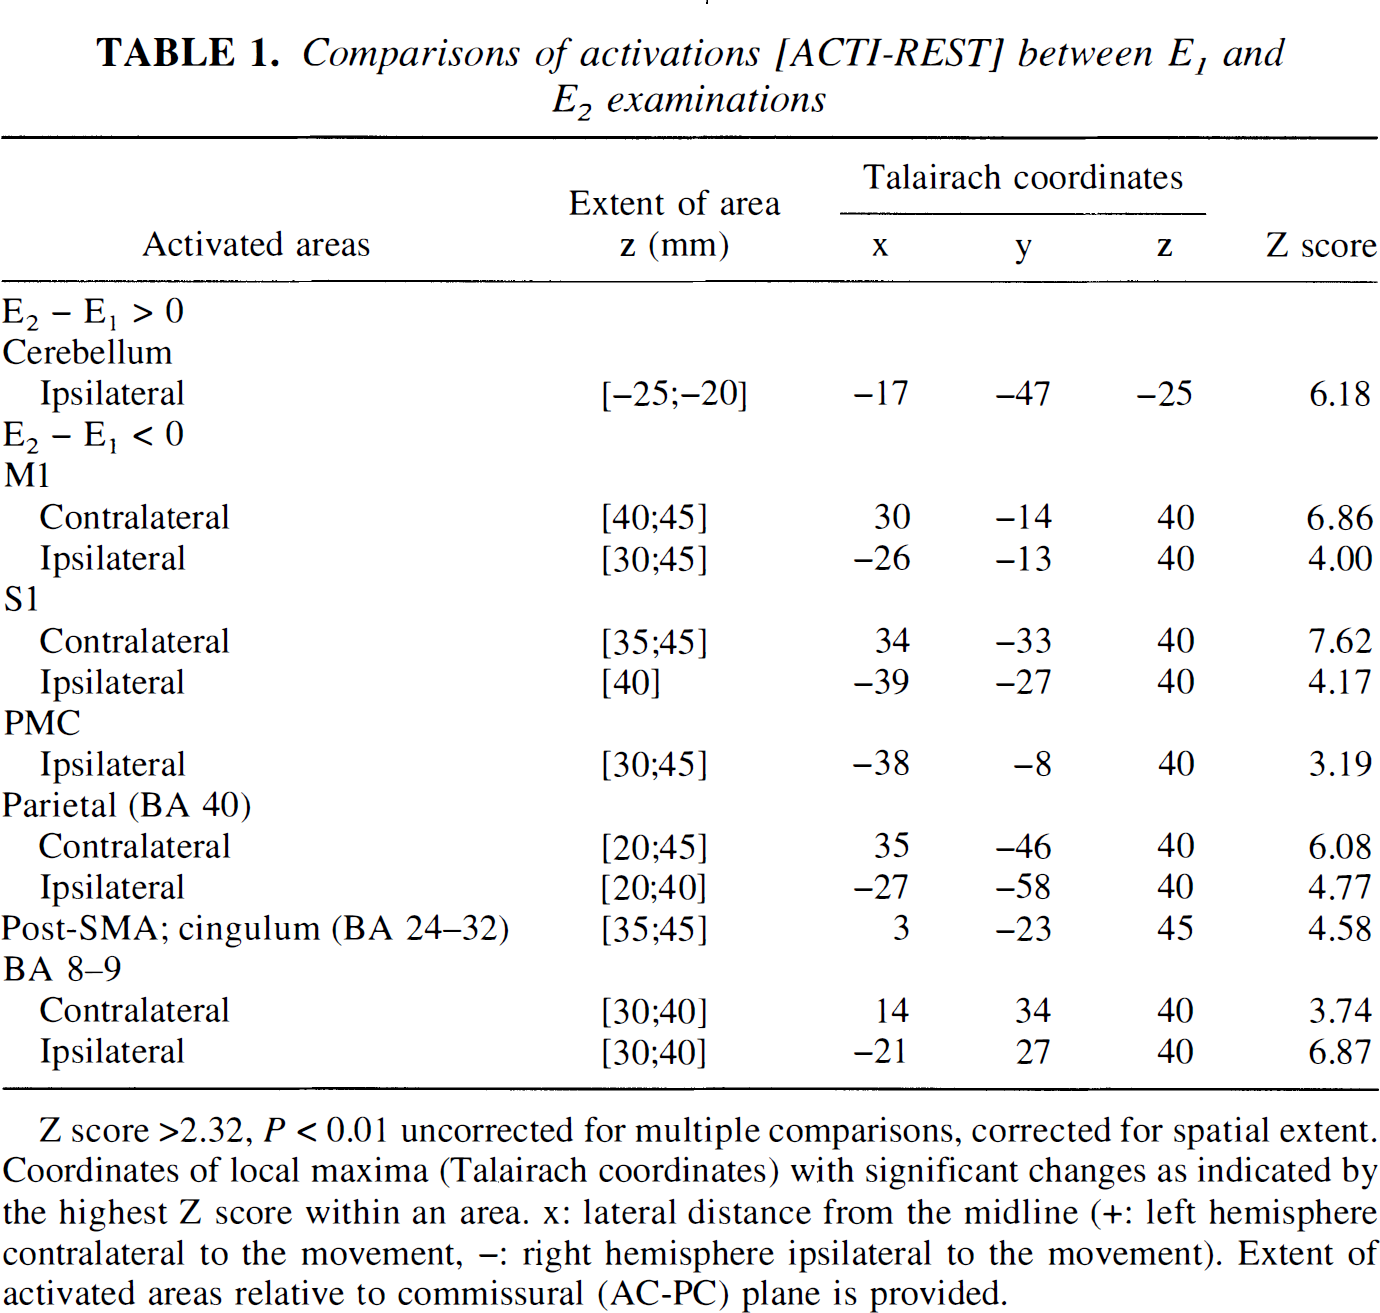
Z score >2.32, P < 0.01 uncorrected for multiple comparisons, corrected for spatial extent. Coordinates of local maxima (Talairach coordinates) with significant changes as indicated by the highest Z score within an area. x: lateral distance from the midline (+: left hemisphere contralateral to the movement, -: right hemisphere ipsilateral to the movement). Extent of activated areas relative to commissural (AC-PC) plane is provided.
Beyond a good intraindividual reproducibility found when the two control experiments of the first session were compared (no significant difference between E1 and E2 evoked signal intensities in many areas, including motor cortices, anterior SMA, vermis, and most of the cerebellum; P < 0.01), time effects in specific cerebellar and cortical areas were evidenced when experiments were repeated after only 5 hours. When the group of 12 subjects was split at random into two groups of 6 and when this time effect was considered, no statistical difference was found between the time effect of the two groups. This statistic validated that such a time effect existed and was reproducible among groups of subjects.
Interaction between drug and movement: drug effects
Evaluation of time effects was considered as a necessary step before a pharmacologic study could be performed. To correctly assess drug effects, the time effects previously evidenced were taken into account (see Materials and Methods). Fluoxetine or fenozolone intake did not change the mean arterial blood pressure or heart rate of healthy volunteers. The subjects mentioned no clinical side effects during the procedure. No vascular effects are expected from these pharmacologic types of drug. In functional images, no effects of fluoxetine or fenozolone were observed in areas that were not activated or deactivated by the sensorimotor tasks.
The main effects of administration of a single dose of either fluoxetine or fenozolone concerned cerebellum and contralateral sensorimotor cortices.
Both drugs elicited a highly significant and widespread decrease of activation in bilateral cerebellum and vermis (fenozolone group: approximately −55% at the maximum peak; fluoxetine group: approximately −133% at the maximum peak; P < 10–6) (Figs. 2 and 3, green and blue clusters; Tables 2 and 3). The plots of a local maximum in ipsilateral cerebellum for the fluoxetine group show evoked signal changes through E1, E2, E3, and E4 examinations (Fig. 4). A time effect occurred in this part of the ipsilateral cerebellum (E2 − E1 > 0), and fluoxetine intake reversed it (E4 − E3 < 0). Cerebellar activity decrease was more pronounced in the fluoxetine group. Two foci that were less activated after fluoxetine also appeared in the brain stem and may suggest changes in the activation state of somatosensory fibers, that is, of the spinothalamic tract and of the fasciculi gracilis and cu-neatus, in the medial lemniscus.
Coordinates of local maxima (Talairach coordinates) in hyper activated and hypoactivated areas after fenozolone treatment (n = 6)
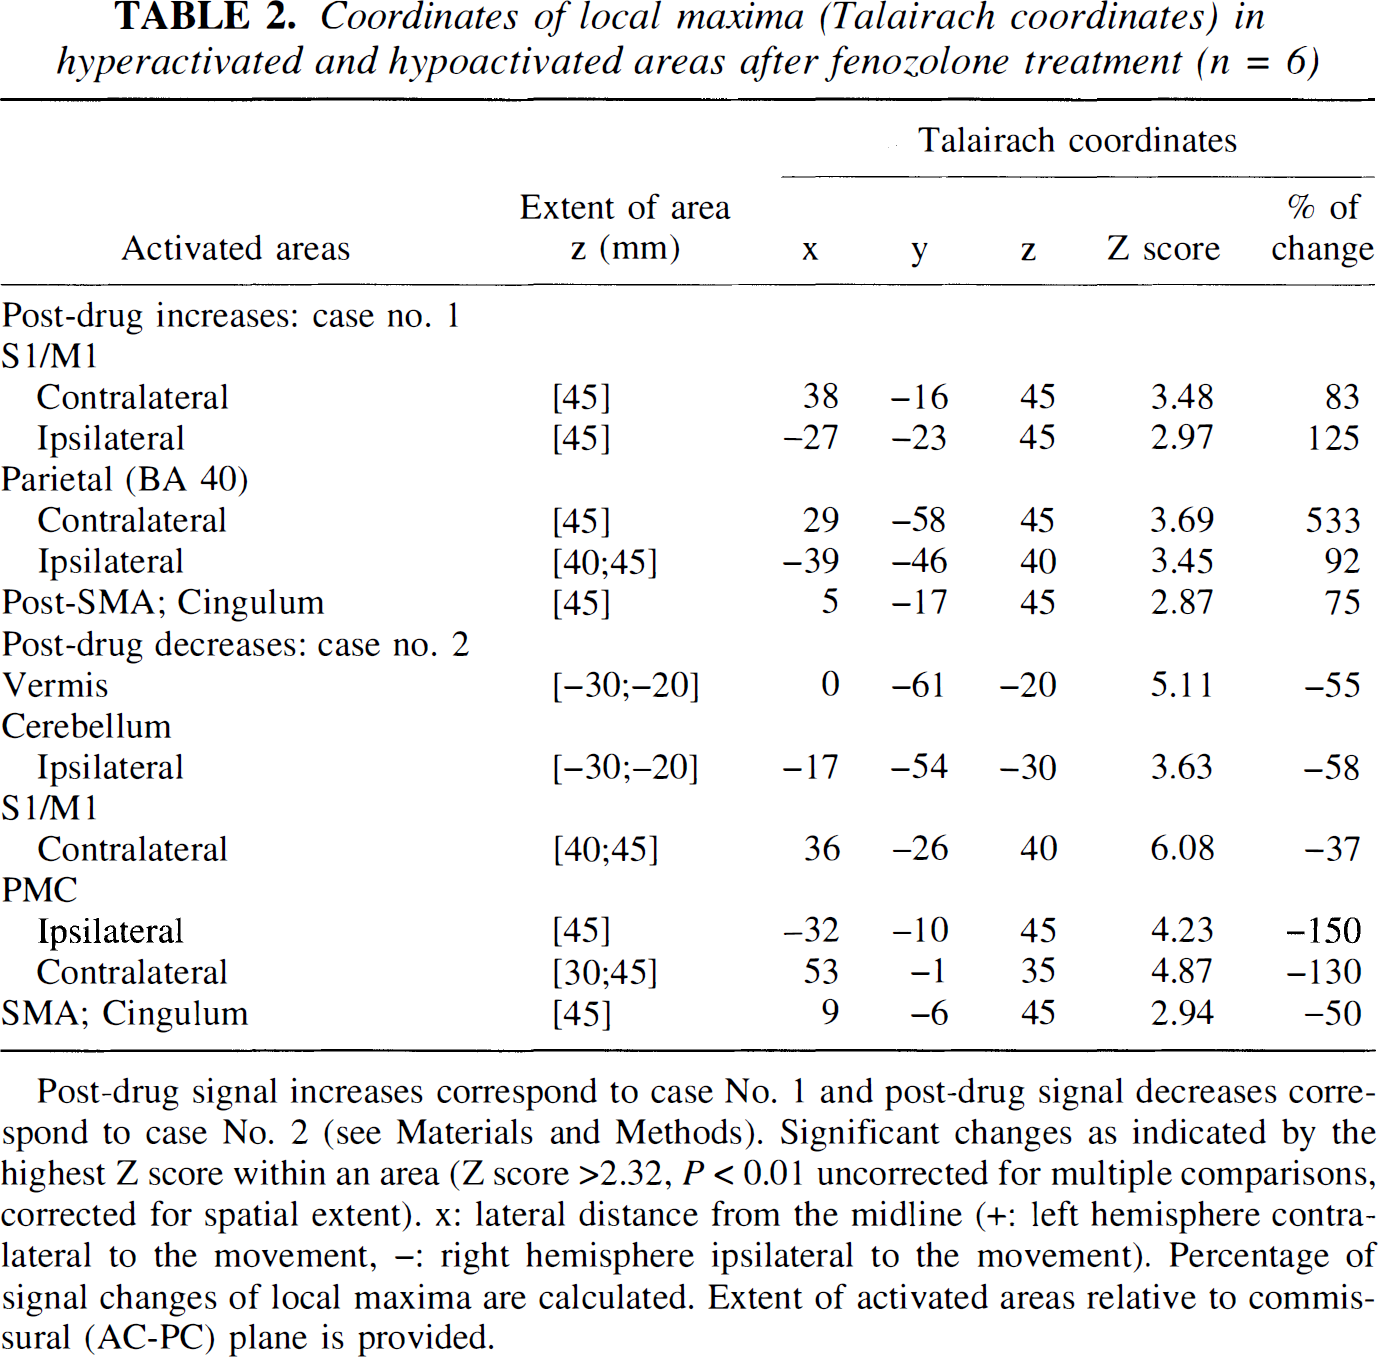
Post-drug signal increases correspond to case No. 1 and post-drug signal decreases correspond to case No. 2 (see Materials and Methods). Significant changes as indicated by the highest Z score within an area (Z score >2.32, P < 0.01 uncorrected for multiple comparisons, corrected for spatial extent). x: lateral distance from the midline (+: left hemisphere contralateral to the movement, -: right hemisphere ipsilateral to the movement). Percentage of signal changes of local maxima are calculated. Extent of activated areas relative to commissural (AC-PC) plane is provided.
Coordinates of local maxima (Talairach coordinates) in hyperactivated and hypoactivated areas after fluoxetine treatment (n = 6)
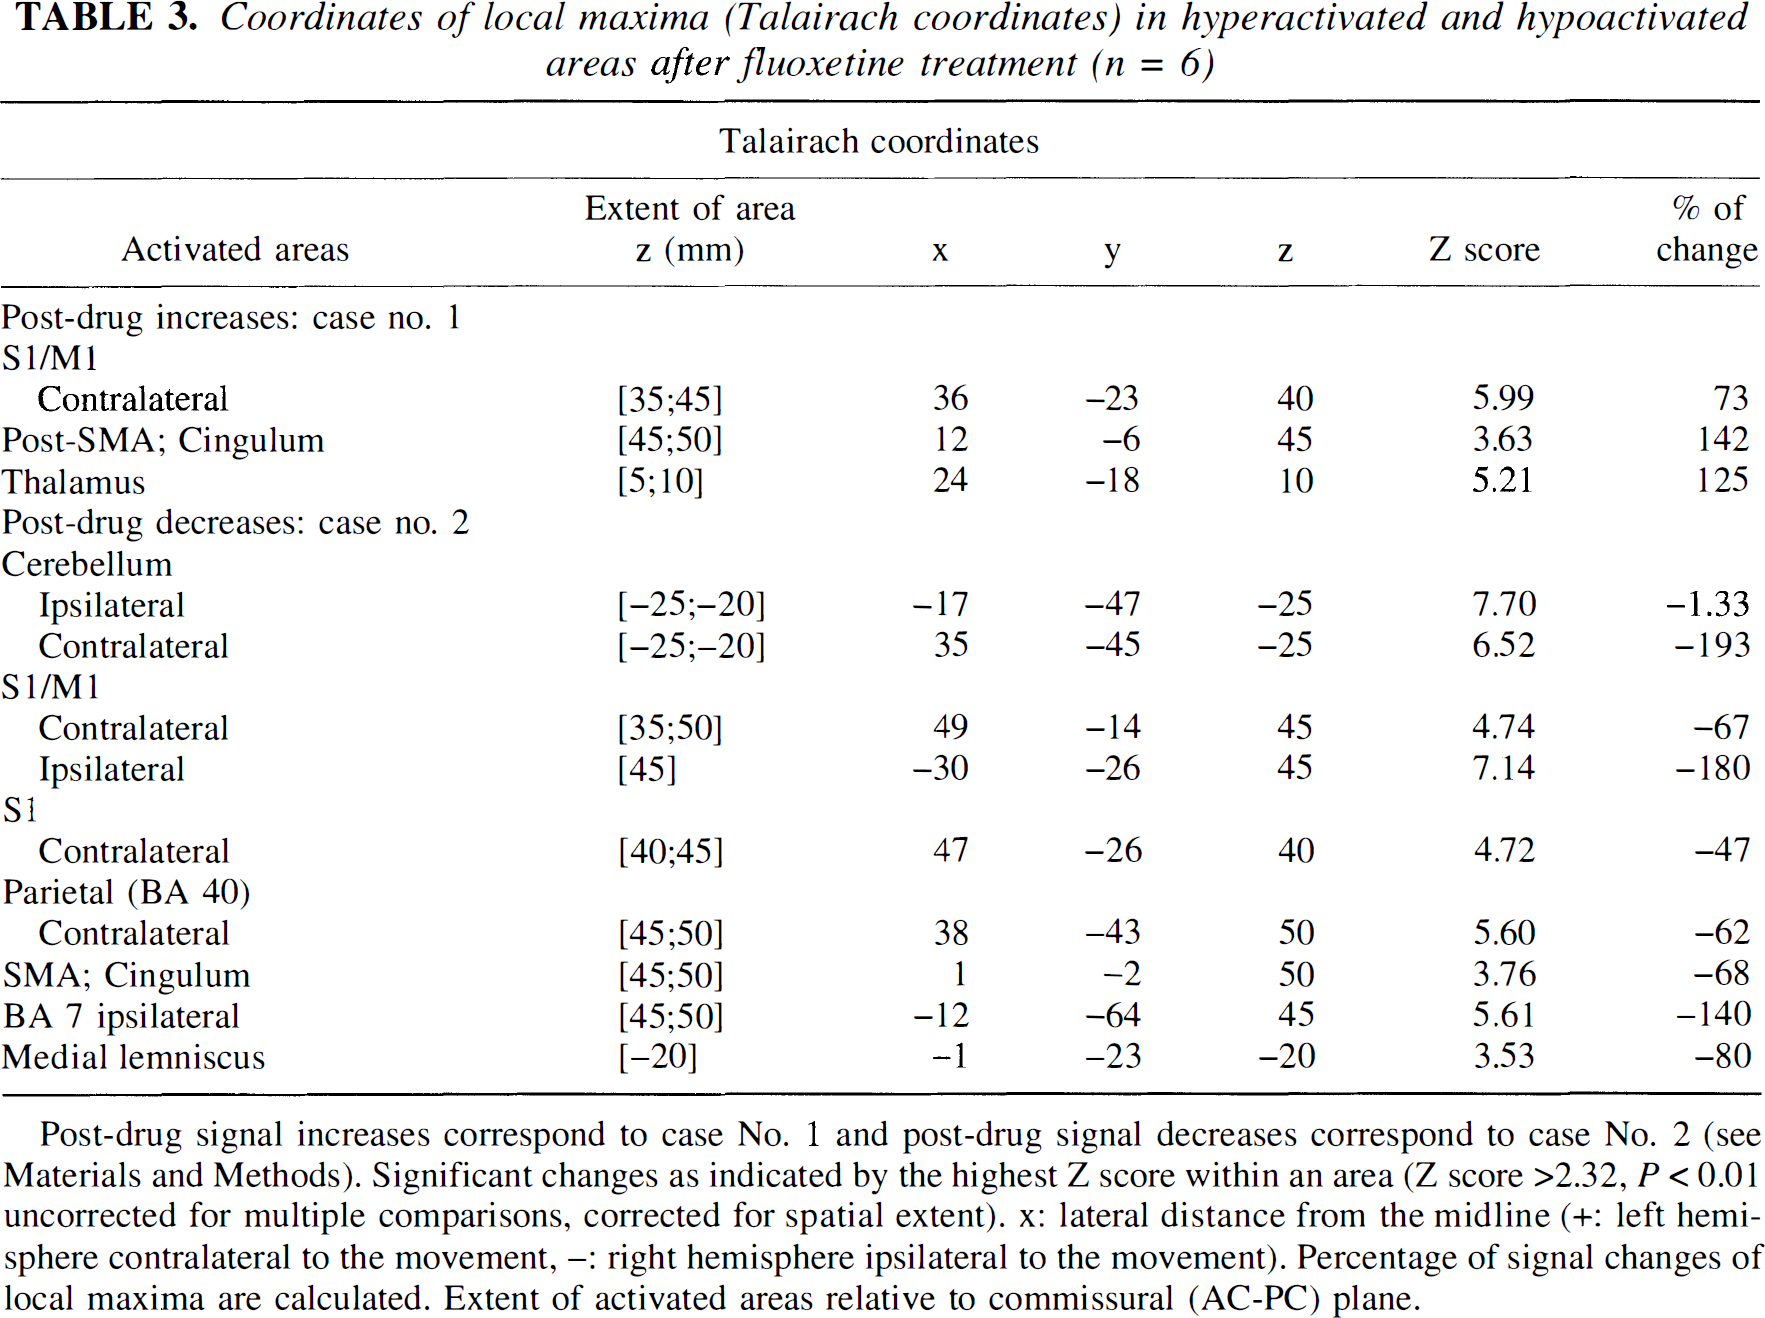
Post-drug signal increases correspond to case No. 1 and post-drug signal decreases correspond to case No. 2 (see Materials and Methods). Significant changes as indicated by the highest Z score within an area (Z score >2.32, P < 0.01 uncorrected for multiple comparisons, corrected for spatial extent). x: lateral distance from the midline (+: left hemisphere contralateral to the movement, -: right hemisphere ipsilateral to the movement). Percentage of signal changes of local maxima are calculated. Extent of activated areas relative to commissural (AC-PC) plane.
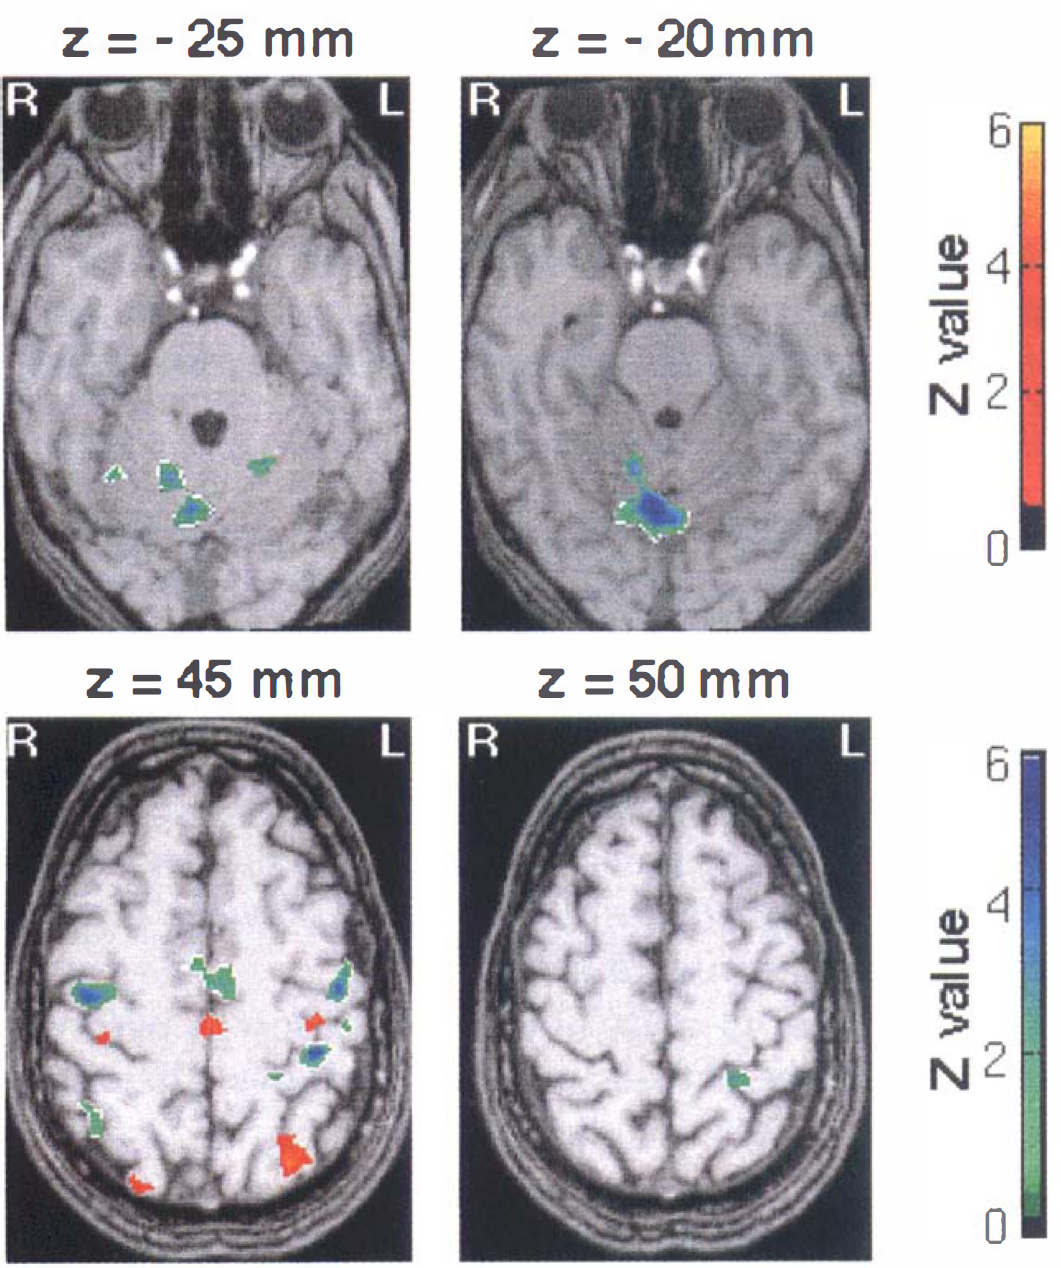
Fenozolone effects on sensorimotor activation. Hyperac-tivated areas (red-yellow clusters, Case 1) and hypoactivated areas (green-blue clusters, Case 2) after fenozolone treatment (n = 6) superimposed on T1-weighted magnetic resonance images (Z score > 2.32, P < 0.01 uncorrected and corrected for spatial extent). A corresponding Z score bar is provided. Six transaxial images of −25, −20, 45, and 50 mm under and above the anterior-posterior commissural line are shown. Left side of the figure corresponds to the right hemisphere. Notice a significant and widespread decrease of activation in bilateral cerebellar cortices and vermis (green-blue clusters). A red focus clearly seen at z = 45 mm on the knob of the contralateral central sulcus demonstrates enhanced activity (approximately +83% at the maximum peak, P < 10–3). It is surrounded by large areas of decreased signal encompassing sensorimotor and premotor areas. Notice the increased participation of the posterior part compared with the anterior part of mesial areas (cingulum and supplementary motor area [SMA]).
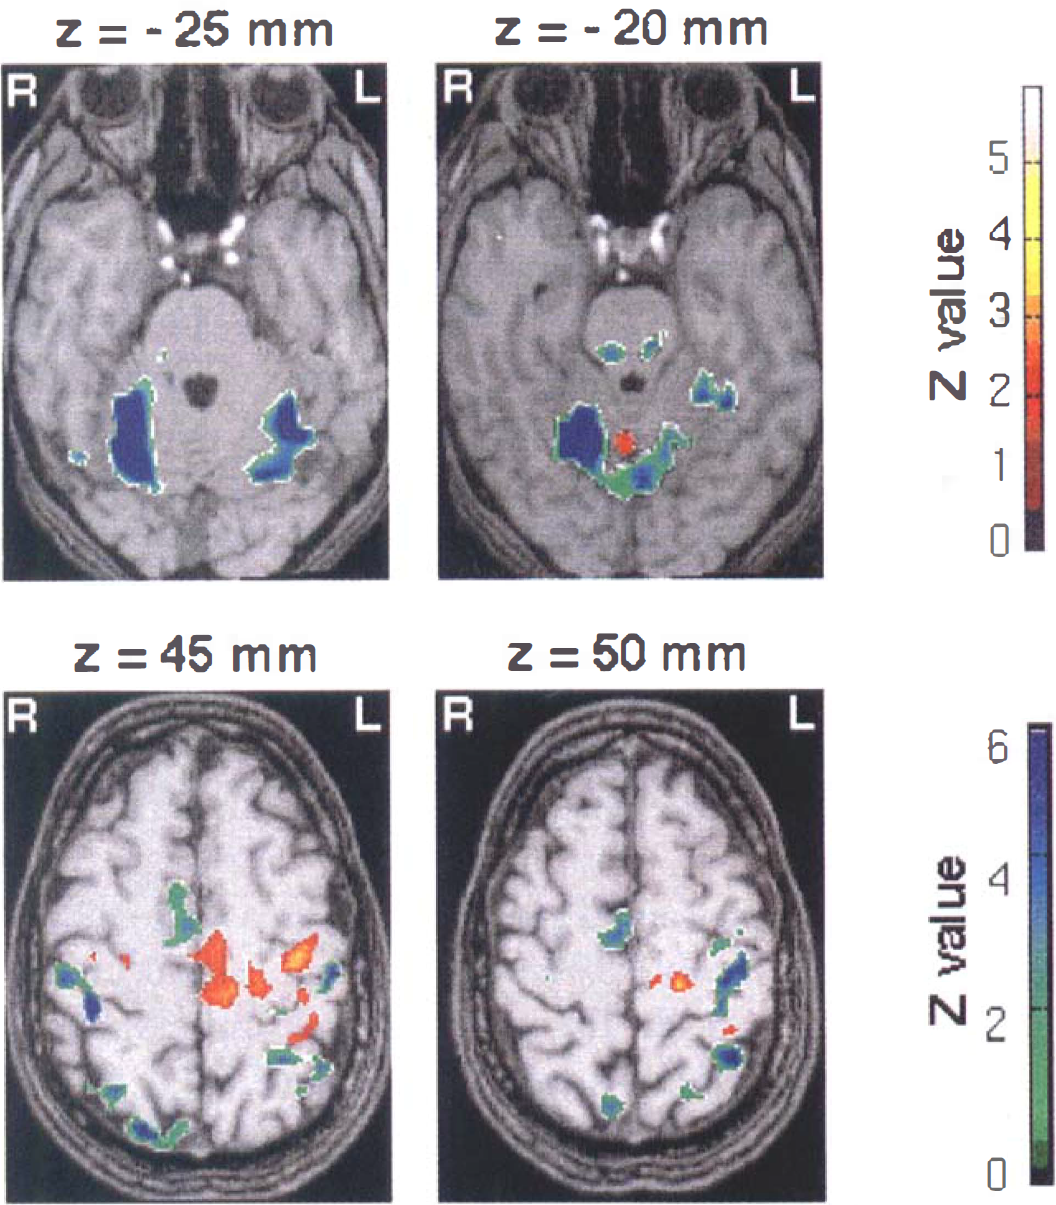
Fluoxetine effects on sensorimotor activation. Hyperac-tivated areas (red-yellow clusters, Case 1) and hypoactivated areas (green-blue clusters, Case 2) after fluoxetine treatment (n = 6) superimposed on T1-weighted magnetic resonance images (Z score > 2.32, P < 0.01 uncorrected and corrected for spatial extent). A corresponding Z score bar is provided. Six transaxial images of −25, −20, 45, and 50 mm under and above the anterior-posterior commissural line are shown. Left side of the figure corresponds to the right hemisphere. Notice a highly significant and widespread decrease of activation in bilateral cerebellar cortices and vermis (green-blue clusters). A red focus clearly seen at z = 45 mm near the knob of the contralateral central sulcus demonstrates enhanced activity (approximately +73% at the maximum peak, P < 10–6). It is surrounded by large areas of decreased signal encompassing sensorimotor and premotor areas. Notice the increased participation of the posterior part compared with the anterior part of mesial areas (cingulum and SMA).
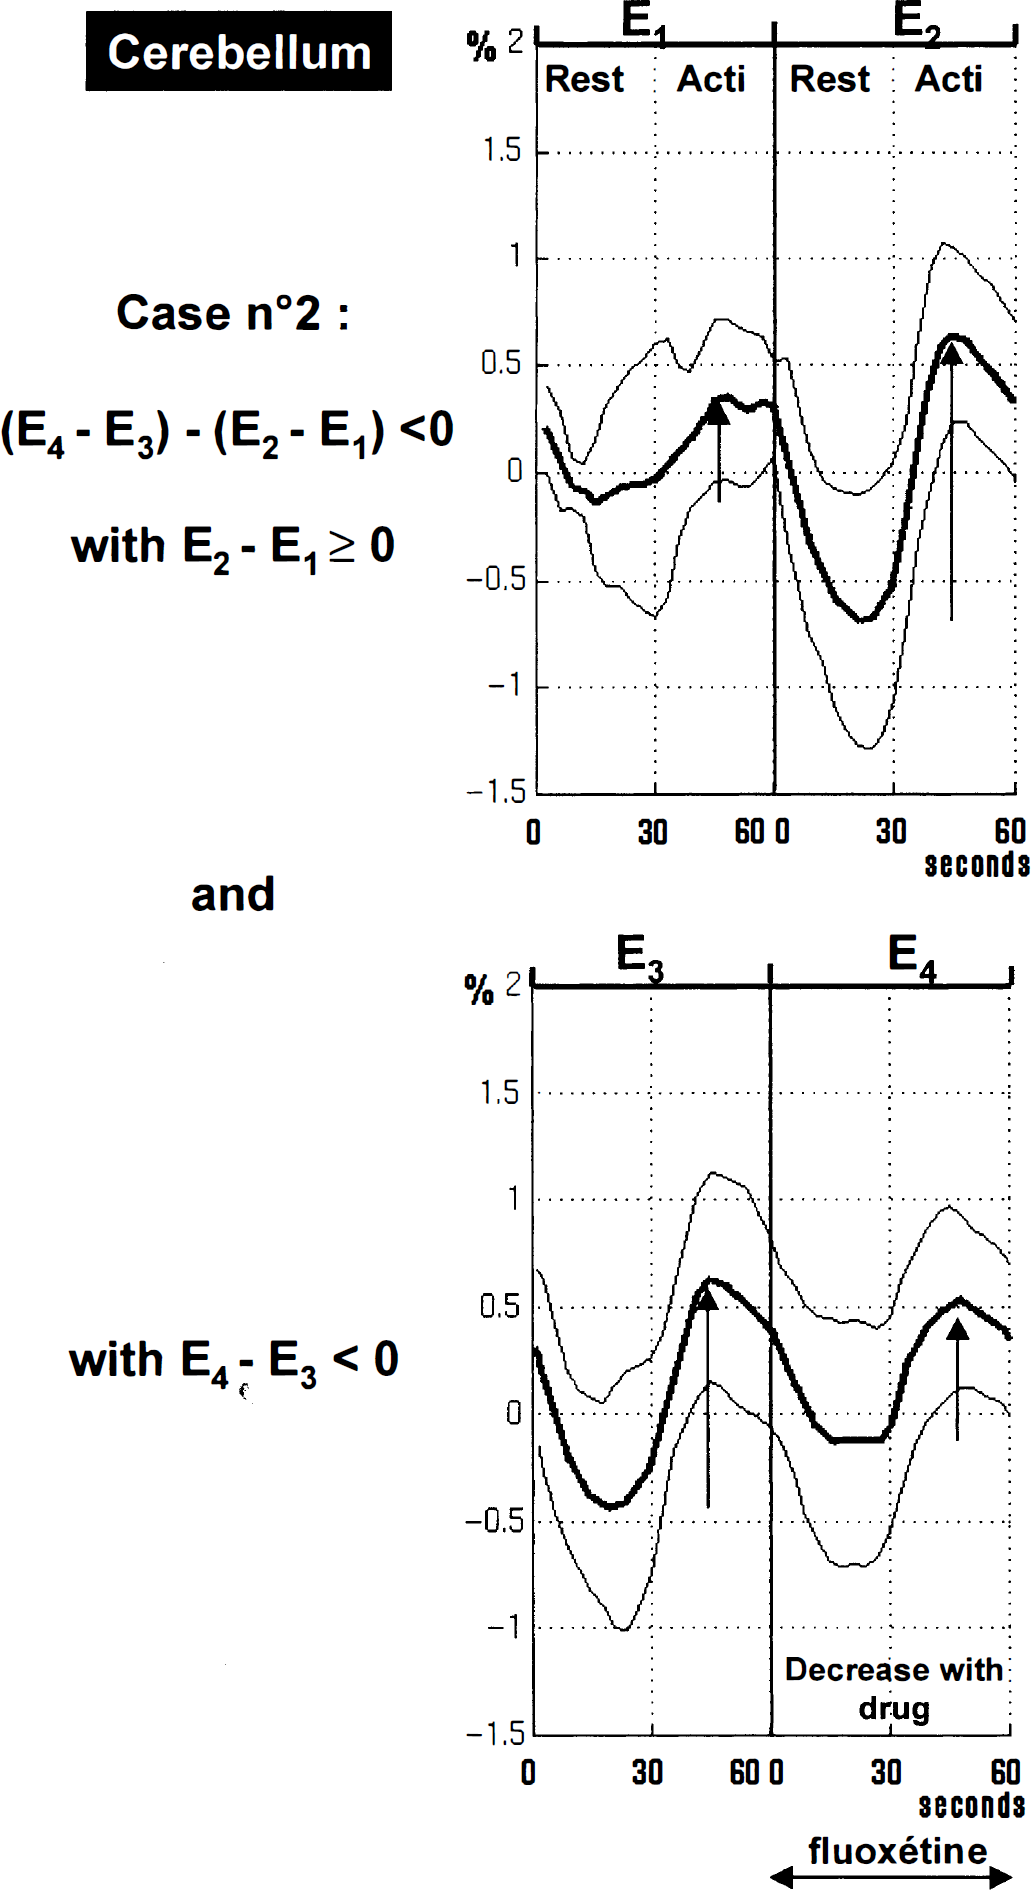
Plots of the local maximum in ipsilateral cerebellum (x = −17; y = −45; z = −25) for the fluoxetine group showing signal changes through E1, E2, E3, and E4 examinations (mean ± SD). Results are expressed in δ% [(x − meanRest)/meanRest] where meanRest is a mean value for E1, E2, E3, and E4 rest values. These plots illustrate Case 2, a decrease in signal activation after drug administration: (E4 − E3) − (E2 − E1) < 0 (Z score = 7.70). A time effect is visible in this part of the ipsilateral cerebellum: E2-E1 > 0 (i.e., [(ACTI − REST)E2 − (ACTI-REST)E1] > 0), and fluoxetine intake reversed such an effect: E4 − E3 < 0 (i.e., [(ACTI-REST)E4 − (ACTI − REST)E3] < 0).
The second main effect was a large reduction of the spatial extent of activation and of the evoked signal intensity in the contralateral sensorimotor area (fenozolone group: approximately −37% of signal intensity decrease at the maximum peak; fluoxetine group: approximately −67% at the maximum peak; P < 10–6) (Figs. 2 and 3, green and blue clusters; Tables 2 and 3). Both drugs also elicited a more focused increase in evoked signal intensity in the same area (Figs. 2 and 3, red clusters).
For the fenozolone group, the focus of hyperactivity clearly seen at z = 45 mm along the contralateral central sulcus (approximately +83% at the maximum peak, P < 10–3) was surrounded by large areas of decreased evoked signal encompassing sensorimotor and premotor areas.
For the fluoxetine group, sensorimotor foci of hyperactivity were larger and more significant (Fig. 3). The evoked signal intensity was increased by approximately +73% at the maximum peak (P < 10–6). Figure 5 shows plots of the increase after fluoxetine intake for the maximum peak. A similar pattern also was seen along the ipsilateral central sulcus (Fig. 2). The foci also were surrounded by decreased signal areas in the sensorimotor and premotor fields.
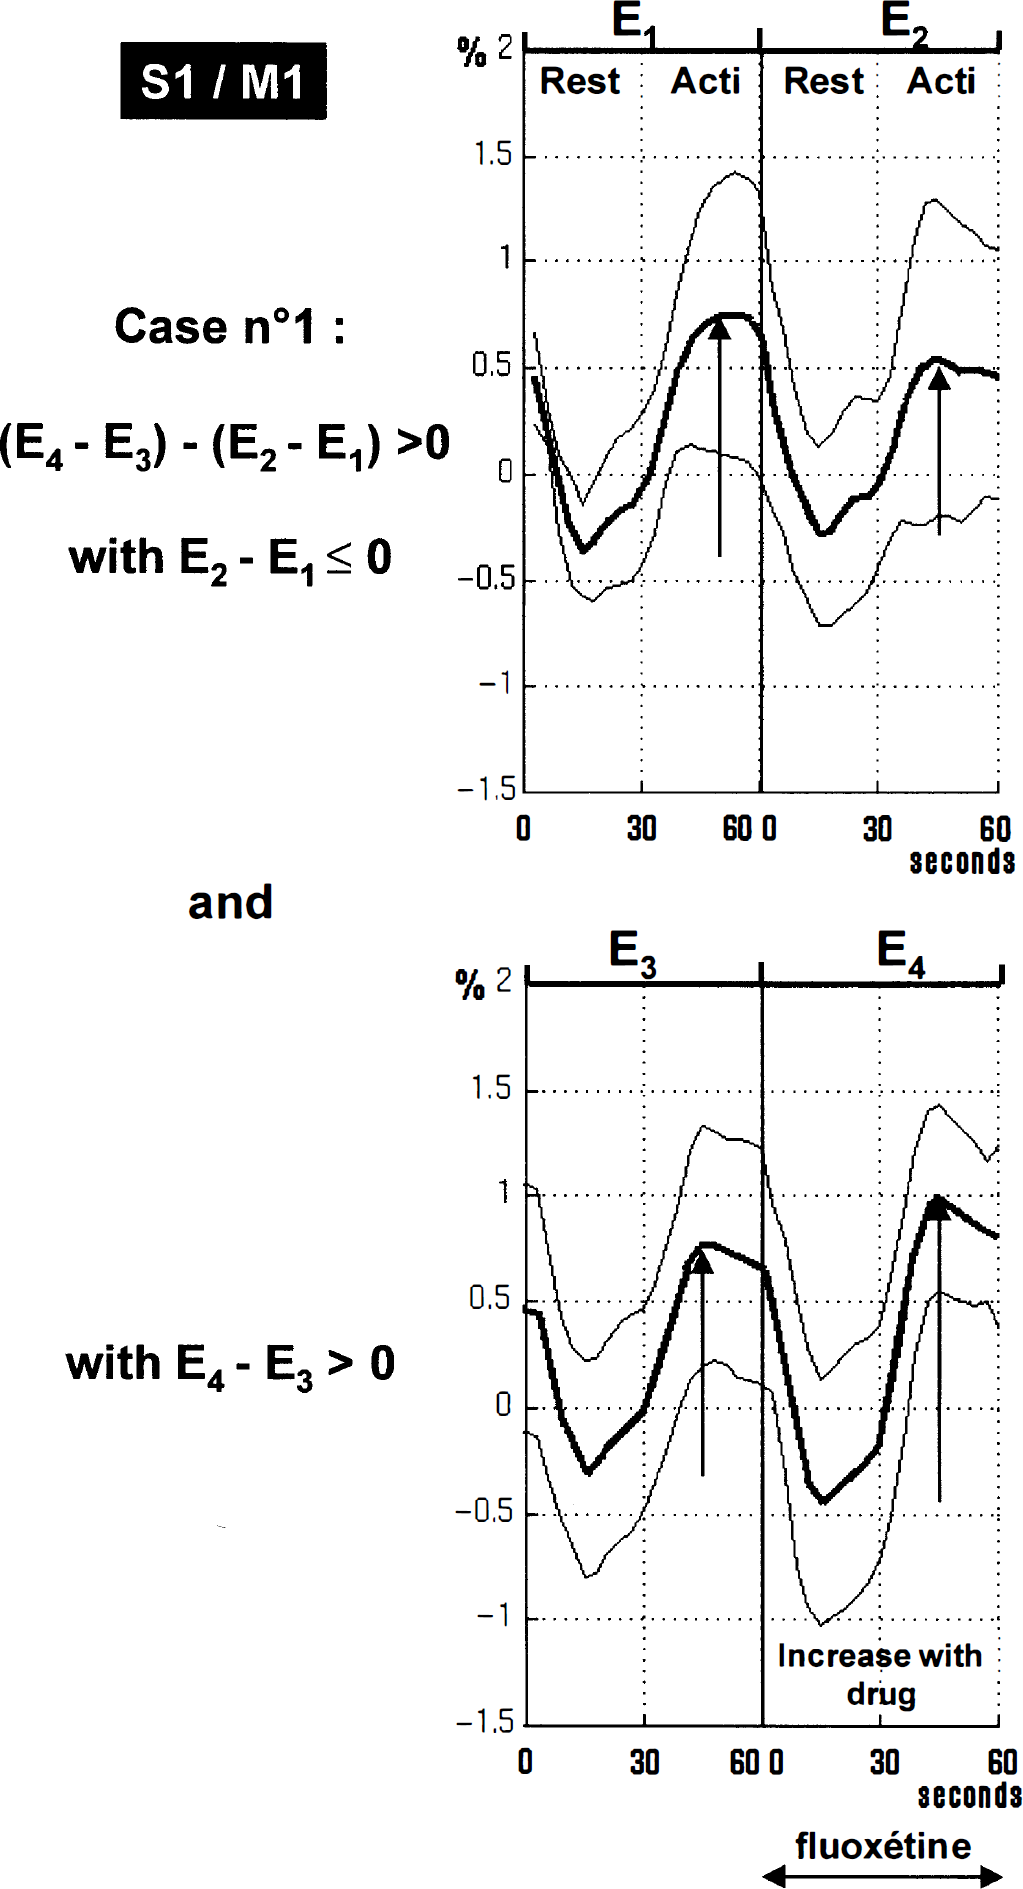
Plots of the local maximum in the contralateral sensorimotor cortex S1/M1 for the fluoxetine group showing signal changes through E1, E2, E3, and E4 examinations (mean ± SD). Results are expressed in δ% [(x − meanRest)/meanRest] where meanRest is a mean value for E1, E2, E3, and E4 rest values. These plots illustrate Case 1, an increase in signal activation after drug administration: (E4 − E3) − (E2 − E1) > 0 (x = 36, y = −23, z = 40; Z score = 5.99). A time effect is visible at this point: E2 − E1 < 0 (i.e., [(ACTI − REST)E2 − (ACTI- REST)E1] < 0), and fluoxetine intake reversed such effect: E4 − E3 > 0 (i.e., [(ACTI-REST)E4 − (ACTI- REST)E3] > 0).
Both drugs elicited the same pattern of changes in the mesial motor areas, SMA, and cingulate cortex (BA 6, BA 32, BA 24): a depressed activity in anterior mesial areas and an enhanced activity in posterior mesial areas (Figs. 2 and 3). Again, this effect was more prominent in the fluoxetine group.
Therefore, when the fluoxetine group was compared with the fenozolone group, we found a greater increase of activation in executive motor areas (primary motor cortex, premotor cortex, posterior cingulate cortex, and posterior SMA). The greater changes observed after fluoxetine treatment could not be explained by a group effect, that is, by a greater activation [(ACTI − REST)E1 > 0] of the fluoxetine group compared with the fenozolone group, but a difference of dose effect between the two drugs cannot be discarded.
A significant increase in activation also was observed in the contralateral thalamus after fluoxetine administration. Changes in the amplitude of the activation also were observed in Brodmann's areas 40 and 7 (Tables 2 and 3). In fact, both drugs induced similar changes in the different motor areas, but fenozolone increased signal activation in Brodmann's area 40, whereas fluoxetine decreased it (Figs. 2 and 3).
DISCUSSION
We demonstrated, for the first time, that cerebral motor activity can be modulated by a single low dose of fluoxetine or fenozolone in healthy subjects and that fMRI sensitivity is high enough to evidence such changes. Our results showed that both drugs induced similar profound changes in the entire motor pathway, including primary and secondary cortices, thalamus, and cerebellum. We also noticed time effects between two examinations in accordance with a habituation phenomenon.
Time effects
The first methodologic session of the current study showed that time effects occurred between two examinations separated by 5 hours. We found no published studies assessing the reproducibility of fMRI signals between two experiments separated by several hours. Nevertheless, a reduced extent of cortical motor activated areas was demonstrated when 10 to 30 minutes separated the experiments (Ramsey et al., 1996). Such changes can reflect merely a diurnal effect or, more likely, a habituation effect. The lower cortical activity in the second experiment is consistent with the known effects of habituation (Karni et al., 1995). These time effects are interpreted as a routinization of the task when experiments are repeated over a short time scale of few hours. However, the neural substrate triggering the process had never been suggested or demonstrated. We showed that, in parallel with the decreased cortical activity, a restricted cerebellar cortical area displayed a strongly increased activity in the second examination compared with the first one. Thus, this cerebellar area seems to be the assumed triggering neural substrate that inhibits cortical activity. Our hypothesis is in line with the known effects of the cerebellum, which would assume a greater role as the task becomes “automatic” (Shadmehr et al., 1997). Karni et al. (1998) and Brashers-Krug et al. (1996) demonstrated that some gains continue to develop after motor practice has ended and require time to become effective. It should result in less effort and less energy demand to perform the task, and maybe in decreased use of inefficient brain areas (Haier et al., 1992). This study emphasizes the cerebellum participation in motor planning, motor performance, and in monitoring and adjustment of sensory acquisition to optimize processing in the rest of the brain (Parsons et al., 1997).
Drug effects
Cerebral motor activity was seen to be modulated by a single low dose of fluoxetine or fenozolone in healthy subjects, and the pattern of changes was in accordance with the known neuroanatomy of monoaminergic transmitter systems. The densities of adrenergic and serotoninergic sites were found to be high in the sensorimotor cortex (Geyer et al., 1997). It would be difficult to explain a change in the activation pattern such as a fo-calization in the sensorimotor cortex by a general vascular effect, and no effect on cardiovascular systems or psychological variables with low doses of drugs, such as those used in this study, have been reported (Gelfin et al., 1998; Wong et al., 1990; Walker-Batson et al., 1995). Specific neurovascular effects on regional CBF and metabolism can occur with this type of drug (Freo, 1996; Mann et al., 1996; Meyer et al., 1996). High doses of 5-HT serotonin reuptake inhibitors (approximately 40 mg/kg) reduced regional CMRglc selectively in limbic areas and in brain stem monoaminergic nuclei in animals (Freo, 1996). Significant regional changes were observed after a low dose of d,l-fenfluramine (Kapur et al., 1994; Mann et al., 1996) and of d-fenfluramine (0.3 mg/kg) (Meyer et al., 1996) in the frontal cortex, temporal cortex, and thalamus using positron emission tomography.
However, these effects may be independent of neuronal activity. Also, we did not observe any clinical side effects in the volunteers. At first sight, a placebo effect cannot be eliminated. However, data analysis shows that this is unlikely. Indeed, both drugs induced similar effects except in Brodmann's area 40 where opposite effects were observed. Similar effects in both groups would be expected with a placebo. An order effect seems difficult to suspect as a possible confound. It looks unlikely because the time between the two groups of sessions was too long (2 months). Moreover, we evaluated only drug effects that were inversely correlated to time effects.
The drugs affect the cerebral motor activity, suggesting their specific action and a direct or indirect involvement of monoamines, including 5-HT serotonin, in the regulation of cerebral motor activity. This is the first demonstration of the cerebral pattern induced by an assumed excitatory action of a monoaminergic drug such as fenozolone on motor activity. Notice that fluoxetine induced an enhanced activation of motor executive areas: motor and premotor cortices and the posterior SMA. This confirms the role of 5-HT serotonin in motor control. Fluoxetine is not a purely selective serotoninergic reuptake inhibitor because it also is a weak inhibitor, but an inhibitor, nonetheless, of noradrenergic uptake (Wong et al., 1990). However, it has been repeatedly shown that fluoxetine, at the concentration used in this study, does not alter noradrenaline uptake directly (Wong et al., 1974) and that several indirect mechanisms instead should be taken into consideration.
Fenozolone modulation of cerebral activity is noradrenergic but also dopaminergic and serotoninergic, whereas fluoxetine modulation is specifically serotoninergic, but the similarity of the effects of the two drugs remains striking. However, these results are in accordance with the distribution of the densities of [3H]prazozin and [3H]5-HT ligands that bind to adrenergic and serotoninergic sites, respectively, which are similar in the sensorimotor cortex (Geyer et al., 1997). Also, it is probably impossible to manipulate the serotoninergic system or one aminergic system alone without affecting the other aminergic systems.
In the motor cortices, the focus with an increased activation is located directly on the knob of the central sulcus that is thought to be the center of the motor hand area (Yousry et al., 1997). This focus, surrounded by less activated areas, is interpreted as an enhanced activation of more efficient neurons sparing peripheral and less concerned neurons. As more restricted activation goes with simpler tasks (Shibasaki et al., 1993), facilitating the effect of the two drugs on monoaminergic transmission may increase motor performance and render the task easier. Increase in motor performance and efficiency of information processing in simple sensorimotor tasks has been demonstrated after the administration of fluvoxamine, another selective inhibitor of serotonin reuptake (Hasbroucq et al., 1997). The pattern of drug effects presented in this study suggests excitatory brain motor responses coexisting with inhibitory brain motor responses in local cortical areas. This may be explained by the fact that serotonin terminals in the cerebral cortex exert their main effect by activating pyramidal neurons and also by activating inhibitory gamma-aminobutyric acid interneurons, which have relatively local cortical effects (Mann et al., 1996).
A greater involvement of the posterior cingulum and posterior SMA compared with the anterior part of these structures on administration of the two drugs suggests that enhanced monoaminergic transmission favored the execution rather than the programming of the movement (Deiber et al., 1996) as far as such functions can be attributed to these structures. There is growing evidence that development of easiness and automaticity on a motor task results in such changes in the SMA (Jenkins et al., 1994, see Picard and Strick, 1996, for review).
The large decrease in the activation of cerebellar cortices after drug treatment suggests less involvement of cerebellum in performing the task and may be related to a reduction of information processing as performance is increased. Attenuation of activation in the lateral cerebellum and in cerebellar nuclei during the execution of overlearned writing movements has been found (Seitz et al., 1994).
We demonstrated a drug effect that countered the habituation phenomenon evidenced in the time effect. Together, these data are in line with the hypothesis that brain monoamine systems, including the 5-HT system, facilitate motor output. Accumulating evidence indicates that the 5-HT serotonin link to motor activity is related both to the coactivation of the noradrenergic nervous system and to the modulation of the afferent inputs of this system (Jacobs et al., 1997). Its seems that the primary functions of the 5-HT system in the brain are to facilitate motor output and concurrently inhibit sensory information processing (Jacobs et al., 1993).
In conclusion, drug effects have been demonstrated on motor task-dependent physiologic responses. The anatomic, physiologic, and pharmacologic arguments presented are in accordance with a real pharmacologic effect and not a pure placebo effect. The action of both drugs on sensorimotor cortices, SMA, cingulate cortices, and cerebellum suggests a facilitatory or stimulating function of the monoaminergic systems on motor activity. Also, it was shown that dextroamphetamine tends to “focus” neural activity in the specific network involved in particular cognitive tasks (Mattay et al., 1996). Because a pharmacologic effect of fenozolone and fluoxetine has been demonstrated, similar studies of more specific noradrenergic, dopaminergic, and serotoninergic agonists may be considered. Methodologic problems like habituation have been evidenced; further studies will take them into account as well as the placebo effect. Neurotransmitter systems, like monoaminergic systems, largely innervate all brain regions, suggesting that they are involved in many physiologic cerebral functions. However, the heterogeneity of the receptor types and subtypes and the differences in their cerebral distribution for each monoaminergic systems point out that more specific functions exist. Their determination will be a major concern in clinical studies on patient recovery where the development of facilitatory drugs is needed, and where more specific drugs influencing precise cerebral functions without blocking others, reducing or avoiding un-desired side effects, are seriously warranted.
Footnotes
Acknowledgments:
The authors thank Pr. Richard Frakow-iak for helpful discussion, and Dr. Claire Thalamas and le Centre d'Investigation Clinique du CHU (Centre Hospitalier de Toulouse) for their assistance.