
Abstract
To evaluate the effect of movement amplitude on the “blood oxygen level-dependent effect,” the authors studied six normal subjects while they extended their index finger with two different amplitudes, Images were analyzed using SPM96, In five subjects, the signal intensity increase in the primary sensorimotor area was significantly greater with the larger amplitude movement. In other areas of interest (supplementary motor area, premotor cortex, insula, postcentral area, cerebellum), the large-amplitude movement often showed significant activation when the small-amplitude movement did not. The authors conclude that, in studies of the motor system, movement amplitude needs to be controlled.
Functional imaging has become an important tool to study the motor system, Different cortical activation patterns can be shown with simple and complex tasks, (Catalan et al., 1998; Rao et al., 1993; Shibaski et al., 1993), self-paced and externally paced movements, (Jahanshahi et al., 1995; Remy et al., 1994) and overlearned and novel tasks, (Dieber et al., 1997; Grafton et al., 1992; Jueptner et al., 1997), Plastic changes of the motor cortex have been demonstrated with prolonged learning, (Karni et al., 1995), and reorganization has been studied after recovery from stroke, (Cramer et al., 1997; Rossini et al, 1998; Weiller et al., 1992), Since the landmark study of Sadato et al. (1997), which showed frequency-dependent changes of regional cerebral blood flow during finger movements, investigators have paid careful attention to the movement rate, However, another basic determinant of a movement, amplitude and therefore speed for a given movement rate, has been less well studied, To study the effect of movement amplitude, we performed a functional magnetic resonance imaging (fMRI) study using a simple finger-tapping task with a constant tapping rate and two different amplitudes, Our hypothesis was that a larger amplitude would evoke a larger blood oxygen level-dependent (BOLD) signal.
MATERIALS AND METHODS
Volunteers
We scanned six healthy normal subjects, aged 29 to 47 years, The subjects gave informed consent according to institutional guidelines, Five subjects were right-handed, and one was left-handed (Oldfield, 1971).
Task
The task consisted of extending the index finger of the dominant hand, Movement rate was 1 Hz, paced by a metronome, Subjects were asked to adjust their movement speed in a way that allowed a continuous movement. Movement amplitude was restricted by a plastic bar, which could be adjusted to allow movements of 1.3 or 3.8 cm (0.5 or 1.5 inches), Movements were performed for a period of 30 seconds, followed by 30 seconds of rest. Each scan lasted 4 minutes; four consecutive scans were taken, Three subjects performed the following series (R, rest; S, small-amplitude movement; L, large-amplitude movement): R-L-R-S-R-L-R-S-R-S-R-L-R-S-R-L-R-S-R-L-R-L-R-S-R-L-R-S-R-S-R-L The other three subjects performed the series with L and S reversed.
Functional magnetic resonance imaging
All studies were performed on a 1.5-T GE/Signa scanner (GE Medical Systems, Waukesha, WI, U.S.A.) using the GE quadrature head coil and shielded gradients with maximum amplitude of 22 mT/m and maximum slew rate of 115 T/m/s. The pulse sequence used (PRESTO) is described in Gelderen et al. (1995, 1997), Every 2,6 seconds, 32 slices, 3,75 mm apart and covering the whole brain, were acquired, The image matrix was 64 × 51, resulting in an isotropic voxel volume of 3.75 mm. The same sequence but with a higher resolution (128 × 102 matrix) was used to acquire the anatomical reference image, which therefore had the same distortions as the functional images and allowed overlaying the statistical parametric maps without further adjustment.
Data analysis
After three-dimensional realignment using an in-house algorithm, images were analyzed using SPM96 (Wellcome Department of Cognitive Neurology, London, United Kingdom). Each data set was analyzed individually. A z score threshold of 3.09 was applied and corrected for multiple comparisons (P < 0.05). Six regions of interest were defined based on each volunteer's individual anatomy: contralateral primary sensorimotor cortex, posterior SMA, contralateral premotor cortex, contralateral postcentral sulcus, contralateral insula, and ipsilateral cerebellum. For each voxel in each region of interest that passed the threshold for significant activation for either the small- or large-amplitude movements, the average intensity change between rest and activation was calculated for both movement types. These values then were used to perform a nonparametric statistical analysis to assess whether the intensity changes for each region were significantly different.
In two of the six subjects, electromyographic (EMG) studies (MP-100, Biopac, Santa Barbara, CA, U.S.A.) were done during a separate session to check whether the same set of muscles was used to perform the small- and large-amplitude movements. The task was identical to the one used during the fMRI. Surface electrodes were placed over the thenar, hypothenar, extensor indicis, extensor digitorum communis, flexor carpi radialis, and flexor carpi ulnaris muscles.
RESULTS
The contralateral sensorimotor cortex was activated in all six subjects with both the large- and small-amplitude movements (Table 1). The number of voxels activated was as follows: 30/49, 20/36, 12/29, 7/15, 59/45, and 33/56 (small-amplitude movement/large-amplitude movement). Five of the six subjects showed a significantly higher increase in BOLD signal intensity change with the large-amplitude movement (Fig. 1). The posterior SMA showed significant activation in five of the six subjects with the large-amplitude movement but only in three of six subjects with the small-amplitude movement. The signal intensity change was higher for the large-amplitude movement for four of the five subjects that showed activation. The contralateral premotor cortex was significantly activated in three of the six subjects with large-amplitude movements, but only in one volunteer with small-amplitude movements. All four subjects had a greater signal increase with the large-amplitude movement. Five of six subjects showed ipsilateral cerebellar activation with large movements and three with small-amplitude movements. All five subjects had a greater signal increase with the large-amplitude movements. In the contralateral postcentral sulcus, activation was detected in four of six subjects with the large and in two subjects with the small-amplitude movements. Three of four subjects with activation in the contralateral post-central sulcus had a greater increase with the large-amplitude movement. Five of six subjects had activation in the contralateral insula with the large movement and three with the small-amplitude movements. Four of five subjects showed a greater increase in BOLD signal intensity with the large-amplitude movement.
Areas of interest that showed significant activation
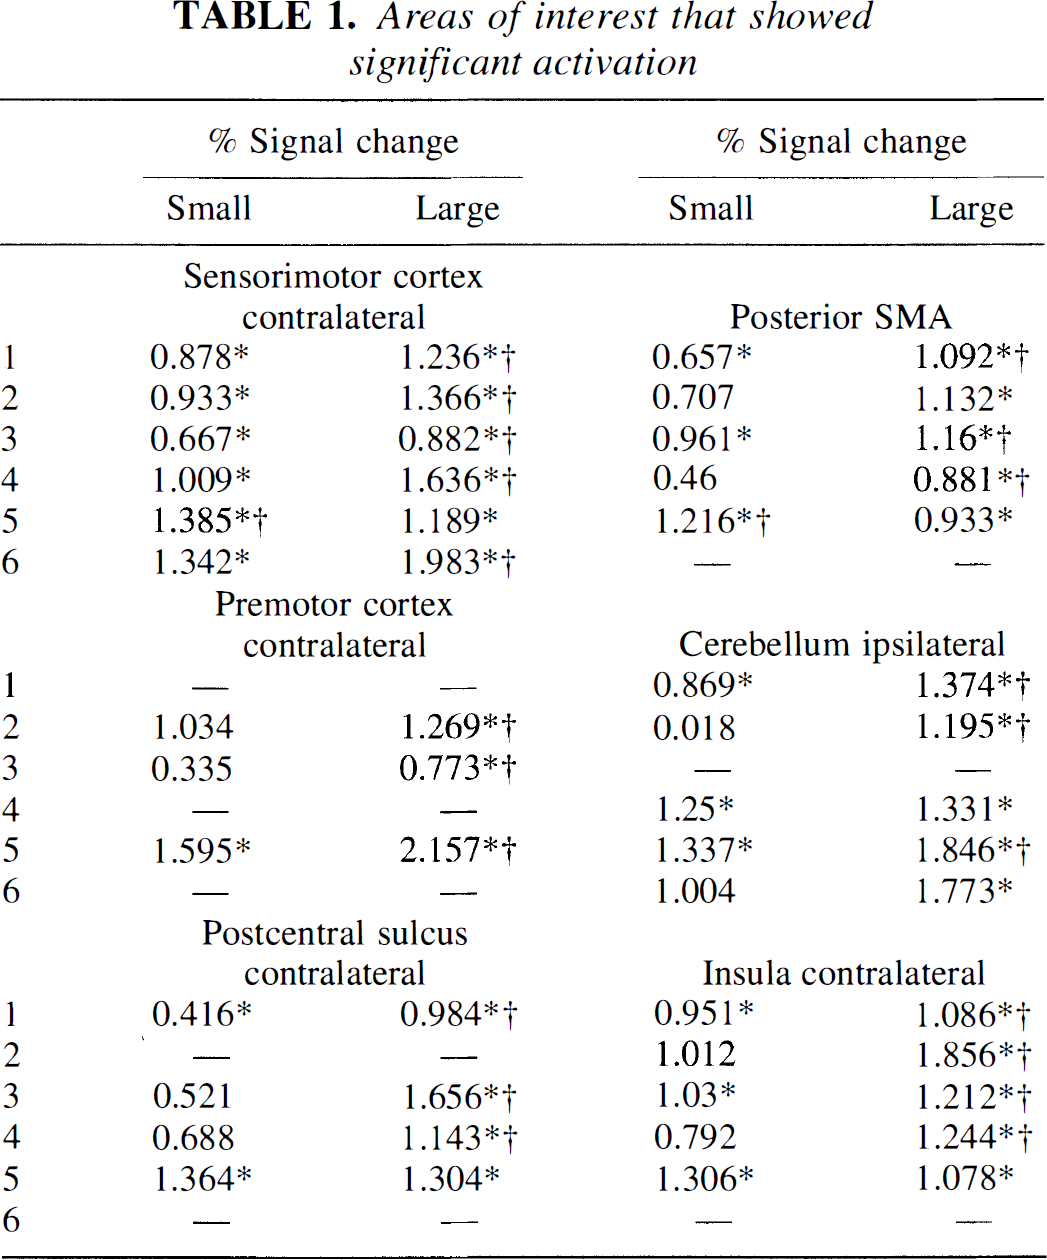
(Z score ≥3.09, corrected for multiple comparisons P < 0.05) with either the small amplitude movement (SMALL) or the large amplitude movement (LARGE) and average signal intensity change for these areas.
Denotes areas where the intensity change is significantly different between large and small amplitude movement and the symbol is placed after the larger signal (P < 0.05, Wilcoxon signed rank test).
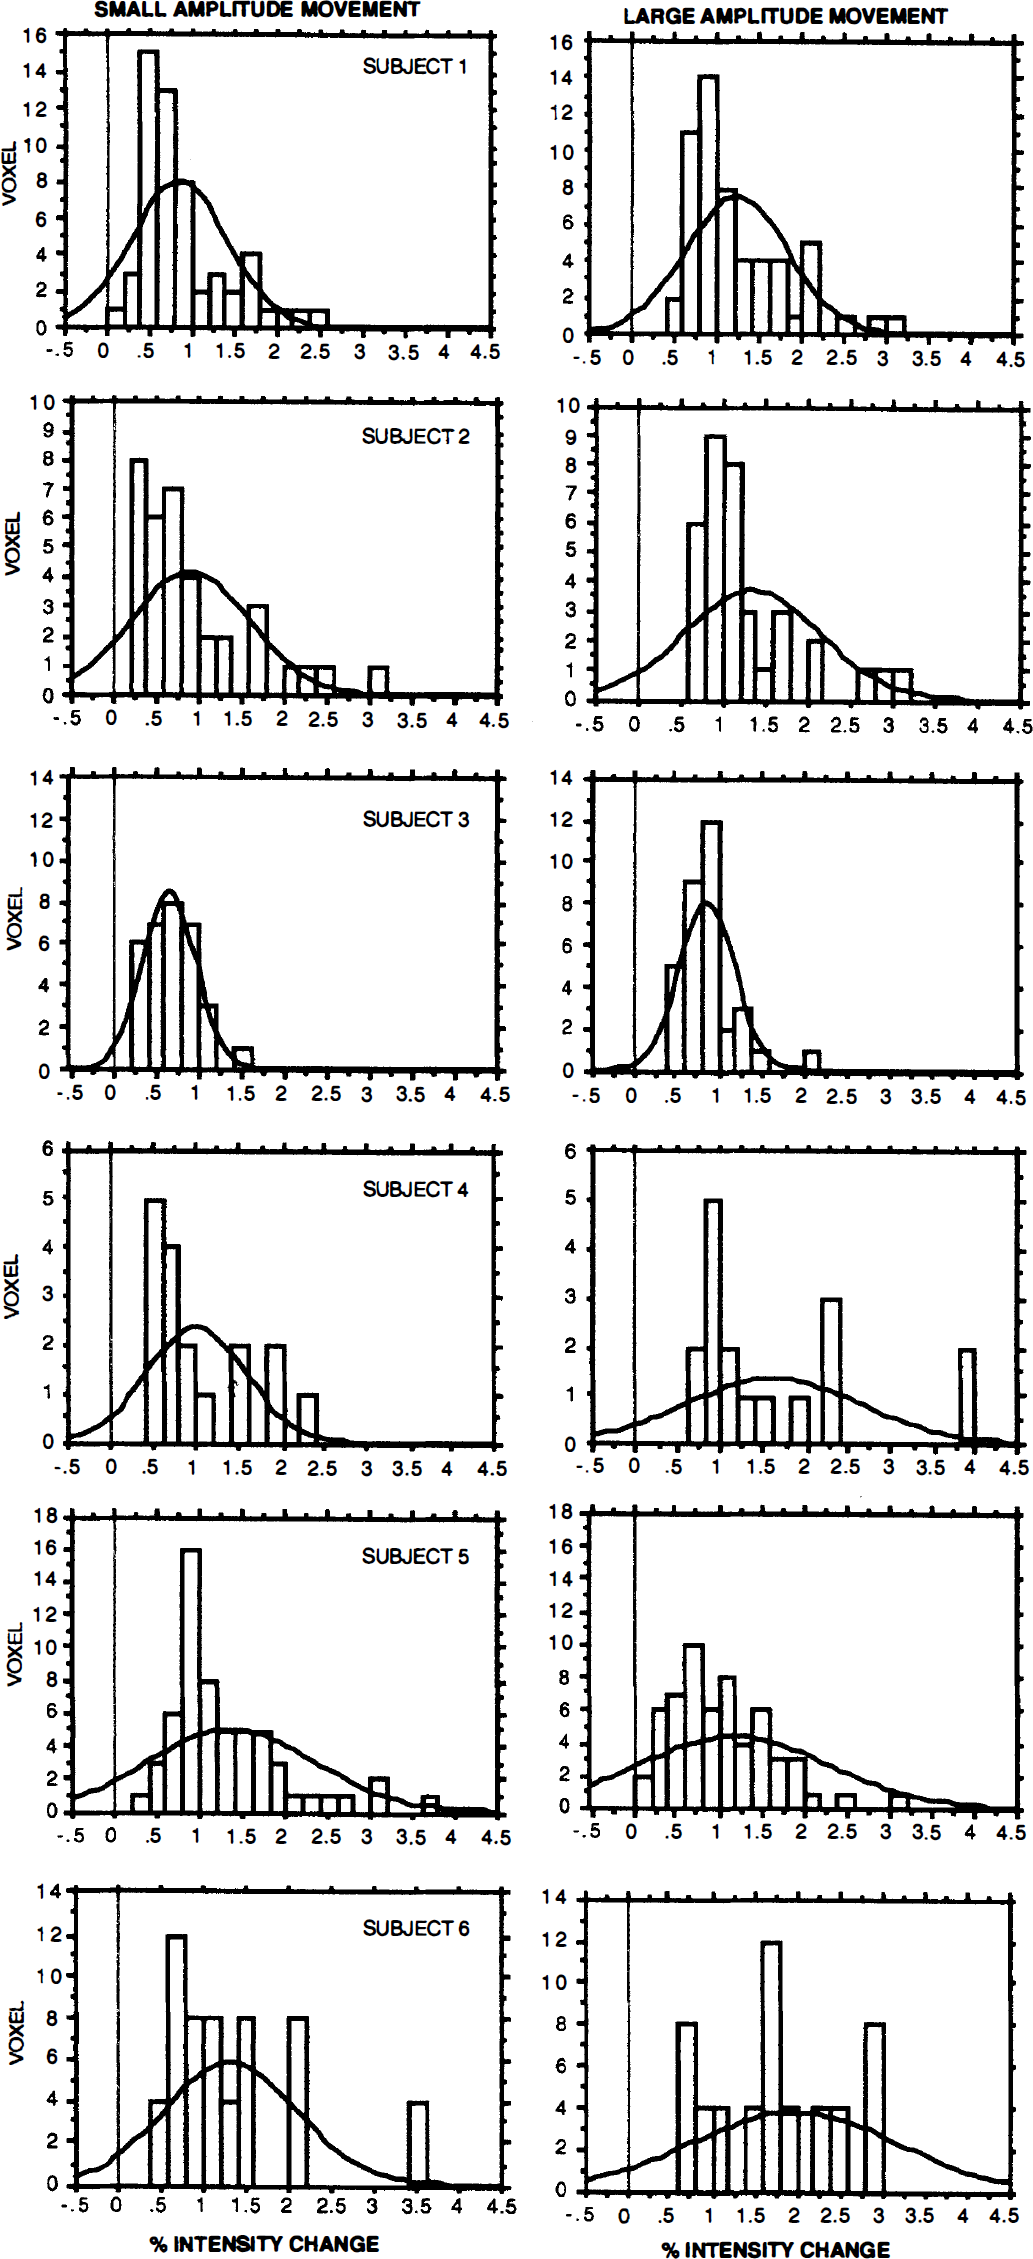
Histogram of the percent signal intensity change in the central area of all six subjects for the small- and the large-amplitude movement. Pixels were taken into account if they passed the threshold (z score 3.09, corrected for multiple comparisons at P < 0.05) for either the small- or large-amplitude movement. Notice the shift to the right with the large-amplitude movement for all subjects except Subject 5.
The EMG study revealed that the same pattern of muscles was used to execute both the small- and large-amplitude movements. However, the amplitude of the EMG response was higher for the large movement. No additional muscles were recruited for the large movement that had not been recruited for the small movement.
DISCUSSION
Our results show that a simple 1-Hz extension of the index finger produces different changes in signal intensity during a fMRI experiment, depending on whether this movement is executed with a large or with a small amplitude. The EMG studies in humans have demonstrated that increased movement amplitude for a given movement time increases the EMG amplitude (Sherwood et al., 1988), indicating that a larger percentage of the motoneuron pool has been recruited. A relation between movement extent and discharge rate of cortical neurons was demonstrated for the primary motor cortex (Ashe and Georgopoulos, 1994; Fu et al., 1993), the premotor cortex, (Fu et al., 1993; Kurata, 1993), the superior parietal cortex (Ashe and Georgopoulos, 1994), and the cerebellum (Fu et al., 1997; van Kan et al., 1993), The high temporal resolution of these electrophysiologic studies allowed distinguishing between preparation for the movement, execution, and feedback. Neurons in the premotor cortex were found to be active after instruction signals were delivered, therefore making it likely that the premotor cortex is involved in movement preparation (Fu et al., Kurata, 1993). However, an increase in the firing rate before movement onset also was noted in the primary motor cortex (Fu et al., 1993, 1995), indicating that some movement preparation also occurs in the primary motor cortex. In contrast, for cells in the postcentral gyrus and in parietal area 5, the onset of change in activity generally is later than that in the motor cortex (Ashe and Georgopoulos, 1994; Wannier et al., 1991). In the cerebellum, Purkinje cells, whose firing rate was significantly correlated with distance, were nearly equally distributed during the preparation and movement period. In contrast to these electrophysiologic studies, fMRI, with its poor temporal resolution, does not allow distinguishing between the different movement periods, resulting in an averaged assessment.
In a simple extension/flexion tapping task often used in imaging studies, movement extent for a given movement rate is invariably coupled to movement speed, and therefore also to movement acceleration and force. These parameters, velocity (Ashe and Georgopoulos, 1994; Flament and Hore, 1988; Hamada, 1981; Humphrey et al., 1970; Kubota and Hamada, 1978; Mano and Yamamoto, 1980; Marple-Horvat and Stein, 1987; Schwartz, 1992; van Kan et al., 1993), acceleration (Ashe and Georgopoulos, 1994; Hamada 1981; Kubota and Hamada, 1978), and force (Evarts, 1968; Humphrey, et al., 1970), all are correlated with the neuronal firing rate in the primary motor cortex, sensory cortex, area 5, and cerebellum. It has also been shown that most cells correlate with more than one of these defining characters of a movement but that they seem to be differently weighted (Ashe and Georgopoulos, 1994). From the aforementioned studies, it can be concluded that an extension/flexion movement with a large amplitude evokes a higher increase in the neuronal firing rate than a small-amplitude movement. The higher firing rate leads to higher synaptic activity and, therefore, to higher metabolic demand, which in turn leads to an increased blood flow. This increase in blood flow reduces the percentage of paramagnetic deoxyhemoglobin and therefore increases the BOLD signal (for a recent review see Raichle, 1998).
A further explanation for the increase in BOLD signal with the large-amplitude movement could be that the subjects used additional muscles to stabilize the hand during the large-amplitude movement. We could not use EMG during scanning to exclude this. However, when we studied two subjects outside of the scanner, the main finding was that the same pattern of muscles was activated for the small- and large-amplitude movements but that the amplitude of the EMG response was markedly different. This agrees with previous studies (Kurata, 1993).
Since a large-amplitude movement leads to an increased BOLD signal intensity compared with a small-amplitude movement, we conclude that in studies of the motor system, not only movement rate, but also movement amplitude, need to be controlled and reported.
Footnotes
Acknowledgments:
The authors thank Dr. Cathrin Buetefisch for her help with the EMG studies and Devera G. Schoenberg for the skillful editing of the manuscript.