
Abstract
Using functional magnetic resonance imaging techniques CBF and oxygenation changes were measured during sustained checkerboard stimulation in 38 right-handed healthy volunteers (18 men and 20 women). The average blood oxygenation level dependent (BOLD) contrast technique signal intensity change was 1.67 ± 0.6% in the group of male volunteers and 2.15 ± 0.6% in the group of female volunteers (P < .05). Baseline regional CBF (rCBF) values in activated gray matter areas within the visual cortex were 57 ± 1 mL · 100 g−1 · min−1 in women and 50 ± 12 mL · 100 g−1 · min−1 in men, respectively (P = .09). Despite a broad overlap between both groups the rCBF increase was significantly higher in women compared to men (33 ± 5 mL · 100 g−1 · min−1 versus 28 ± 4 mL · 100 g−1 · min−1, P < .01). The increase of rCBF was not correlated with the baseline rCBF (mL · 100 g−1 · min−1) (rs = 0.01, P = .9). Moreover, changes of rCBF were not correlated with changes in BOLD signal intensities (rs = 0.1, P = .7). Enhanced rCBF response in women during visual stimulation could be related to gender differences in visual physiology or may reflect gender differences in the vascular response to focal neuronal activation. Gender differences must be considered when interpreting the results of functional magnetic resonance imaging studies.
The idea that regional cerebral blood flow (rCBF) changes could reflect neuronal activity originated more than a 100 years ago, and during the last century a large amount of data showing the tight coupling between normal neuronal activation and blood flow has accumulated (Lou et al., 1987). Therefore, specific localized brain activation can indirectly be visualized with a number of flow sensitive functional neuroimaging methods such as positron emission tomography (PET), single-photon emission computed tomography, or functional magnetic resonance imaging (fMRI).
With the advent of fMRI techniques it has become possible to map human brain function noninvasively (Kwong et al., 1992; Ogawa et al., 1990). Increases in CBF during brain activation are accompanied by decreased blood deoxyhemoglobin levels which can be visualized with the blood oxygenation level dependent contrast (BOLD) technique. This technique uses deoxyhemoglobin as nature's own intravascular contrast agent and it is based on the concept of a tight coupling between local brain activity and CBF (Villringer and Dirnagl, 1995).
However, BOLD effects depend on multiple physiologic parameters such as CBF, cerebral blood volume, and cerebral metabolic rate of oxygen, and thus it is impossible to extract a single physiologic parameter from the observed signal changes. This problem can partially be overcome by additionally using arterial spin tagging techniques, which use magnetically tagged endogenous water as a tracer. These are based on perturbing the magnetization of in-flowing arterial blood and acquiring pairs of flow-sensitive and flow-insensitive images. The CBF-based image is then obtained by subtracting the flow-sensitive images from the flow-insensitive images. One of these techniques, the flow-sensitive alternating inversion recovery (FAIR) technique, has been used to determine absolute CBF values at rest, as well as relative and absolute CBF changes during focal brain activation (Kim and Tsekos, 1997; Kim and Ugurbil, 1997).
In the past, gender differences have been reported for many brain structures and functions across species. In humans, gender differences in cognitive and emotional processing have been widely recognized (Benbow and Stanley, 1983; Cioffi and Kandel, 1979; Rubin et al., 1981; Shaywitz et al., 1995) and may be reflected by differences in regional cerebral glucose metabolism between men and women (Our et al., 1995). Fairly consistent results indicate that women have higher global and rCBF levels than do men (Our et al., 1982; Rodriguez et al., 1988). Among other human brain structures gender differences in the size and morphology of the corpus callosum have been extensively documented (Allen et al., 1989; DeLacoste-Utamsing and Holloway, 1982).
Recently, the effect of gender on fMRI studies has received increasing attention. Hedera et al. (1998) reported significantly higher BOLD signal changes during visual stimulation experiments in 18 women compared to 13 men, suggesting that women may also have higher increases in occipital rCBF during processing of simple visual stimuli. In contrast, Levin et al. (1998) compared BOLD signal changes during photic stimulation in similar groups of eight men and women and found higher signal changes in male subjects. However, the large average BOLD signal changes of 5% in male volunteers and 3% in female volunteers, respectively, indicate that these values may have been confounded by large vessel contributions.
Against the background of discrepant results and lack of quantitative CBF data, the goal of the present study was to evaluate possible gender differences in rCBF and oxygenation changes during focal physiologic neural activity.
MATERIALS AND METHODS
We studied 38 healthy right-handed volunteers (18 men and 20 women) recruited by advertising within our institution. The mean age ± SD was 32 ± 7 years for men and 33 ± 8 years for women. All volunteers underwent comprehensive medical neurologic screening and had normal visual acuity. The human protocol was approved by the Institutional Review Board of the Stanford University School of Medicine. Informed consent was obtained after the nature and possible consequences of the study were explained.
All images were obtained using a GE Signa Horizon 1.5 T scanner (General Electric Medical Systems, Milwaukee, WI, U.S.A.) equipped with an Echo-Speed gradient system.
To reduce motion artifacts, subjects were secured with pillows and padding in the head coil.
T2-weighted images were acquired using a gradient echo version of a single-shot spiral sequence with TE/TR = 50/3000 msec. The FAIR spiral sequence was implemented by applying an adiabatic inversion pulse before the gradient echo data acquisition. After an inversion pulse and a subsequent tagging delay, a gradient echo image was acquired using a 15.6-millisecond spectral-spatial 90° radiofrequency (RF) pulse and single-shot spiral readout gradients. For this study we used a matrix size of 64 × 64 over a field view of 240 × 240 mm2, which corresponds to a one-shot spiral readout window of 25.6 milliseconds using a 100 kHz receiver bandwidth. The slab thickness of the selective inversion pulse was increased to extend 10 mm at each end, beyond the region of the multiple slices imaged.
In each volunteer four oblique slices (8-mm slice thickness and 2-mm interslice spacing through the visual cortex) were imaged for both T2-weighted and FAIR imaging, respectively. In FAIR imaging the first slice had an inversion time of 1.2 seconds, whereas inversion time for the other slices were successively increased by about 50 milliseconds. Magnetic resonance signal changes induced by functional activation encompass signal originating from both brain microvasculature and large vessels. Using a TI of 1.2 seconds and a small bipolar gradient, which was used before the spiral readout, large vessel contributions were successfully excluded in this study. For each FAIR image two images with and without slice-selective gradients, during an adiabatic inversion pulse, were acquired in an interleaved fashion. All other parameters were kept the same. In this manner the magnetization transfer effects of these two inversions can be regarded as nearly identical.
The image procedure for each volunteer scanning was as follows: sagittal localizer images were first obtained with a conventional gradient echo sequence. A midsagittal image was used to prescribe oblique slices parallel to the calcarine fissure of the brain.
For CBF quantification a fast T1 mapping was also performed (Ordidge et al., 1990). The entire inversion recovery curve was recorded in a single TR. A single inversion was followed by multiple low flip angle excitations and readouts.
In each subject BOLD and FAIR images were acquired for a total dynamic scanning time of 10 minutes for each sequence, respectively. Visual stimulation was accomplished by a custom-built projection setup. Stimulation was achieved by computer-generated images transferred directly to the projection system. In all studies a black and white circular checkerboard stimulus with a flicker frequency of 6 Hz was used. All subjects were instructed to keep their eyes open and to maintain constant attention during the individual experiments. The protocol consisted of a 3-minute control period followed by 5 minutes of sustained visual stimulation and another 2-minute control period.
Image reconstruction was performed off-line on a SPARC workstation (Sun Microsystems, Mountain View, CA, U.S.A.). The images were visually inspected for motion with the use of a movie tool. Studies showing significant motion artifacts were excluded from further analysis.
From the alternating selective and nonselective images, 100 frames of FAIR images were calculated by magnitude subtraction of the nonselective inverted image from the selective inverted images.
Activation was determined by a pixelwise correlation of signal intensity time courses with a boxcar reference function (Bandettini et al., 1993) representing the stimulus protocol shifted by two images (6 seconds) to account for hemodynamic latencies. Quantitative maps of correlation coefficients were analyzed, threshold (P = .0001), and color-coded as described previously (Kleinschmidt et al., 1995). Neither temporal nor spatial filters were applied and the data were not corrected for baseline drifts. Because of lacking activation in the first or last slices in some volunteers, only the middle two slices were used for analysis.
The mean rCBF value of the baseline images collected before visual stimulation was used as a reference to calculate absolute rCBF changes. Baseline rCBF values were calculated according to the formula:

where SFair is the signal intensity of the subtraction FAIR image, f is the cerebral blood flow (mL · 100 g−1 · min−1), λ is the tissue-to-blood partition coefficient (0.9 mL/g) (Herscovitch and Raichle, 1985), and M0 is the fully relaxed longitudinal magnetization of tissue-water proton (Kim and Tsekos, 1997).
Values for baseline rCBF (mL · 100 g−1 · min−1), increases in rCBF (mL · 100 g−1 · min−1), percent increase in BOLD signal intensity during visual stimulation, and number of activated pixels were compared with two-sample t tests. In each case the t test was preceded by a F test to ensure homogeneity of variance. Spearman Rank-Order correlation coefficients were used to correlate the increase of rCBF (mL · 100 g−1 · min−1) during visual stimulation with the baseline rCBF (mL · 100 g−1 · min−1) and with the percent increase in BOLD signal intensity. The data were expressed as mean ± SD. We assumed statistical significance at P < .05.
RESULTS
Photic stimulation induced an overall increase in BOLD signal intensity and rCBF. A representative fMRI study of the visual stimulation is shown in Fig. 1. Regions of rCBF and BOLD signal intensity changes were mainly located in the gray matter along the calcarine fissure. Because it is difficult to define the borders of the primary visual cortex anatomically on magnetic resonance images, no attempt was made to differentiate the various visual areas. The number of activated pixels in the gray matter areas within the visual cortex did not differ significantly (P = .5) between men and women.
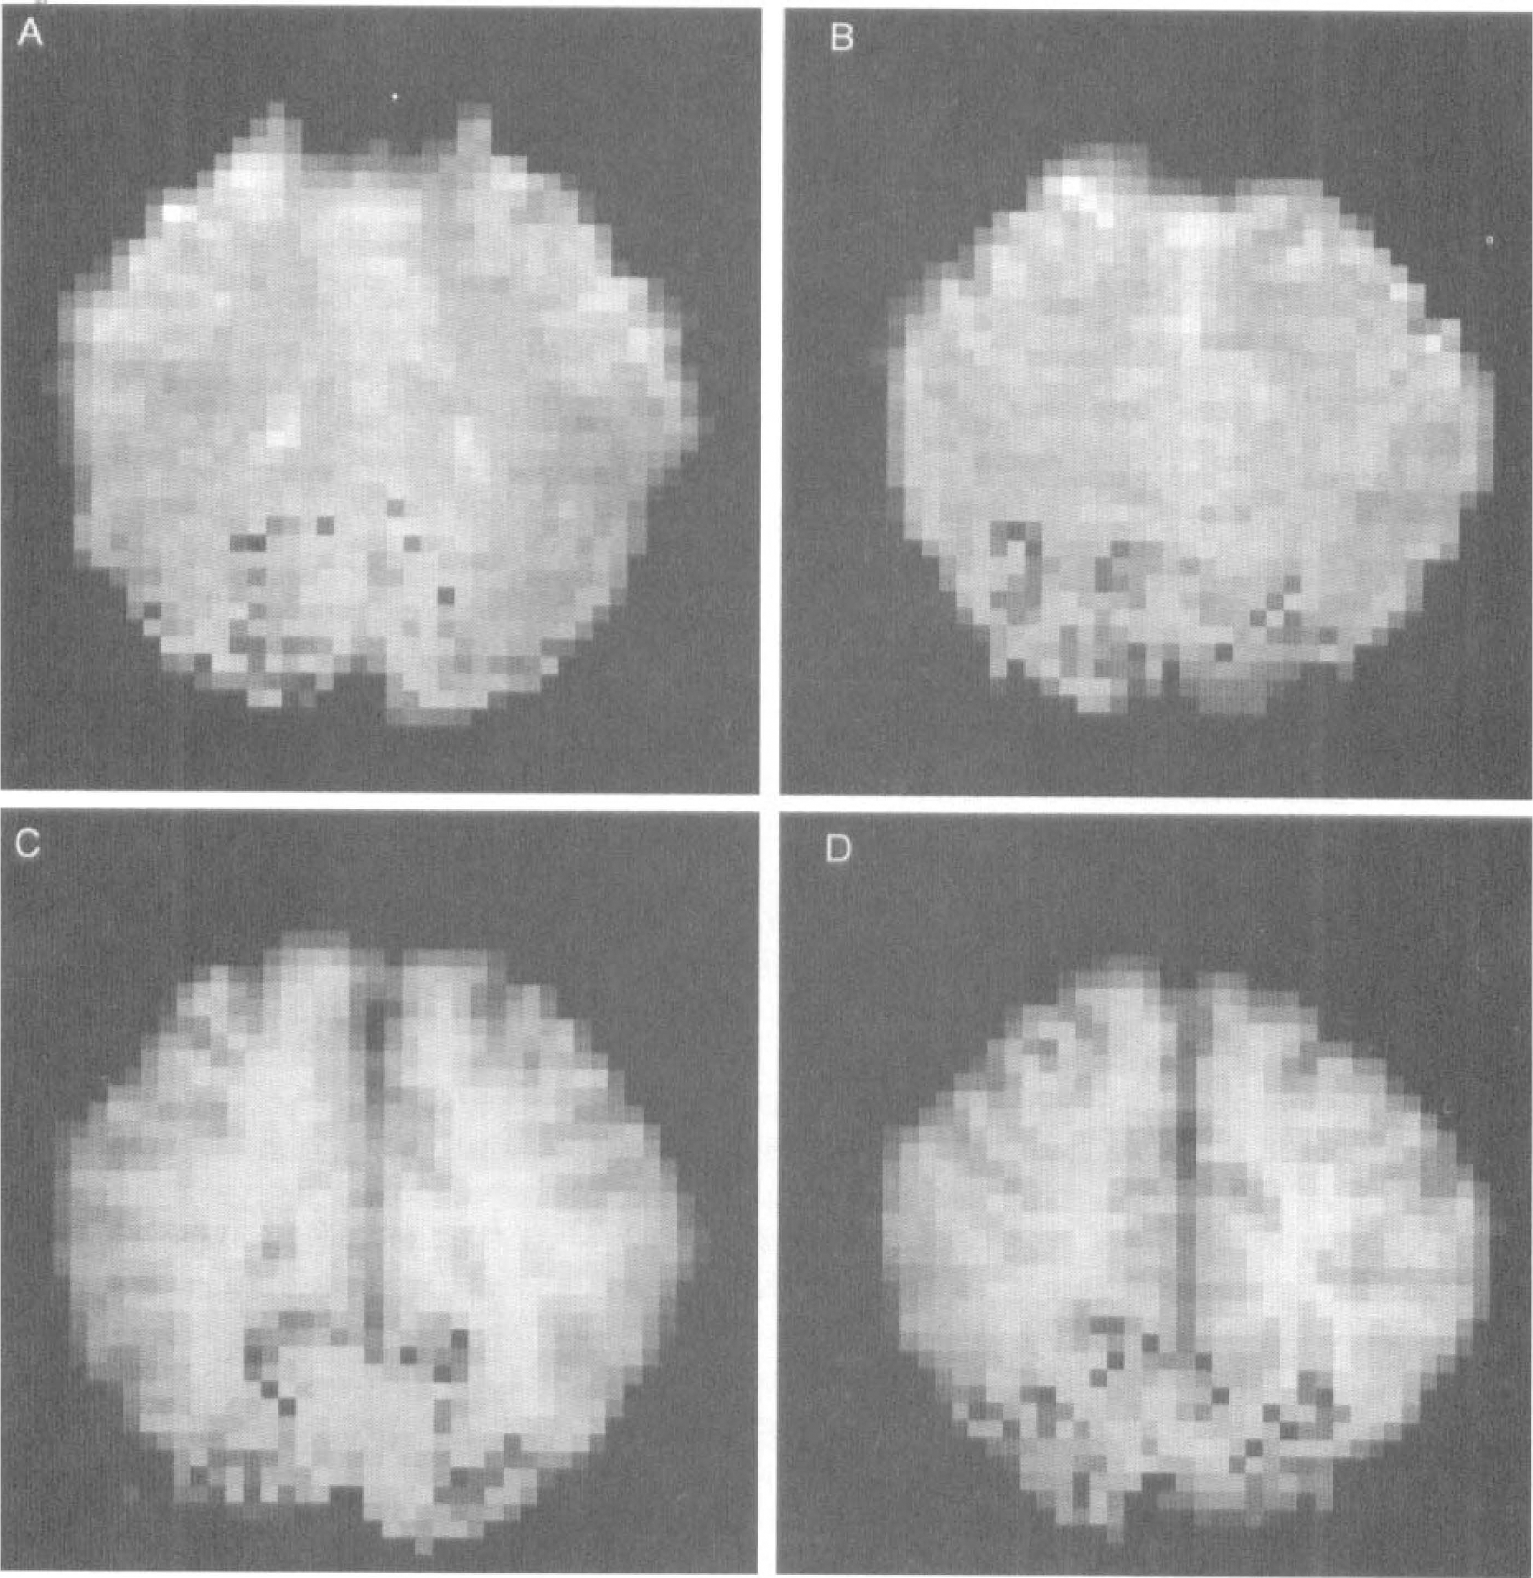
Shaded BOLD (
Because of significant motion artifacts, 1 female and 2 male volunteers were excluded from the FAIR data analysis and 2 female as well as 4 male volunteers were excluded from the BOLD data analysis, respectively.
As observed previously (Howseman et al., 1998; Kruger et al., 1998), BOLD signal intensity changes were largely preserved during the prolonged checkerboard stimulation paradigm (Fig. 2). The average BOLD signal intensity change was 1.67 ± 0.6% in the group of male volunteers and 2.15 ± 0.6% in the group of female volunteers (P < .05) (Fig. 3).
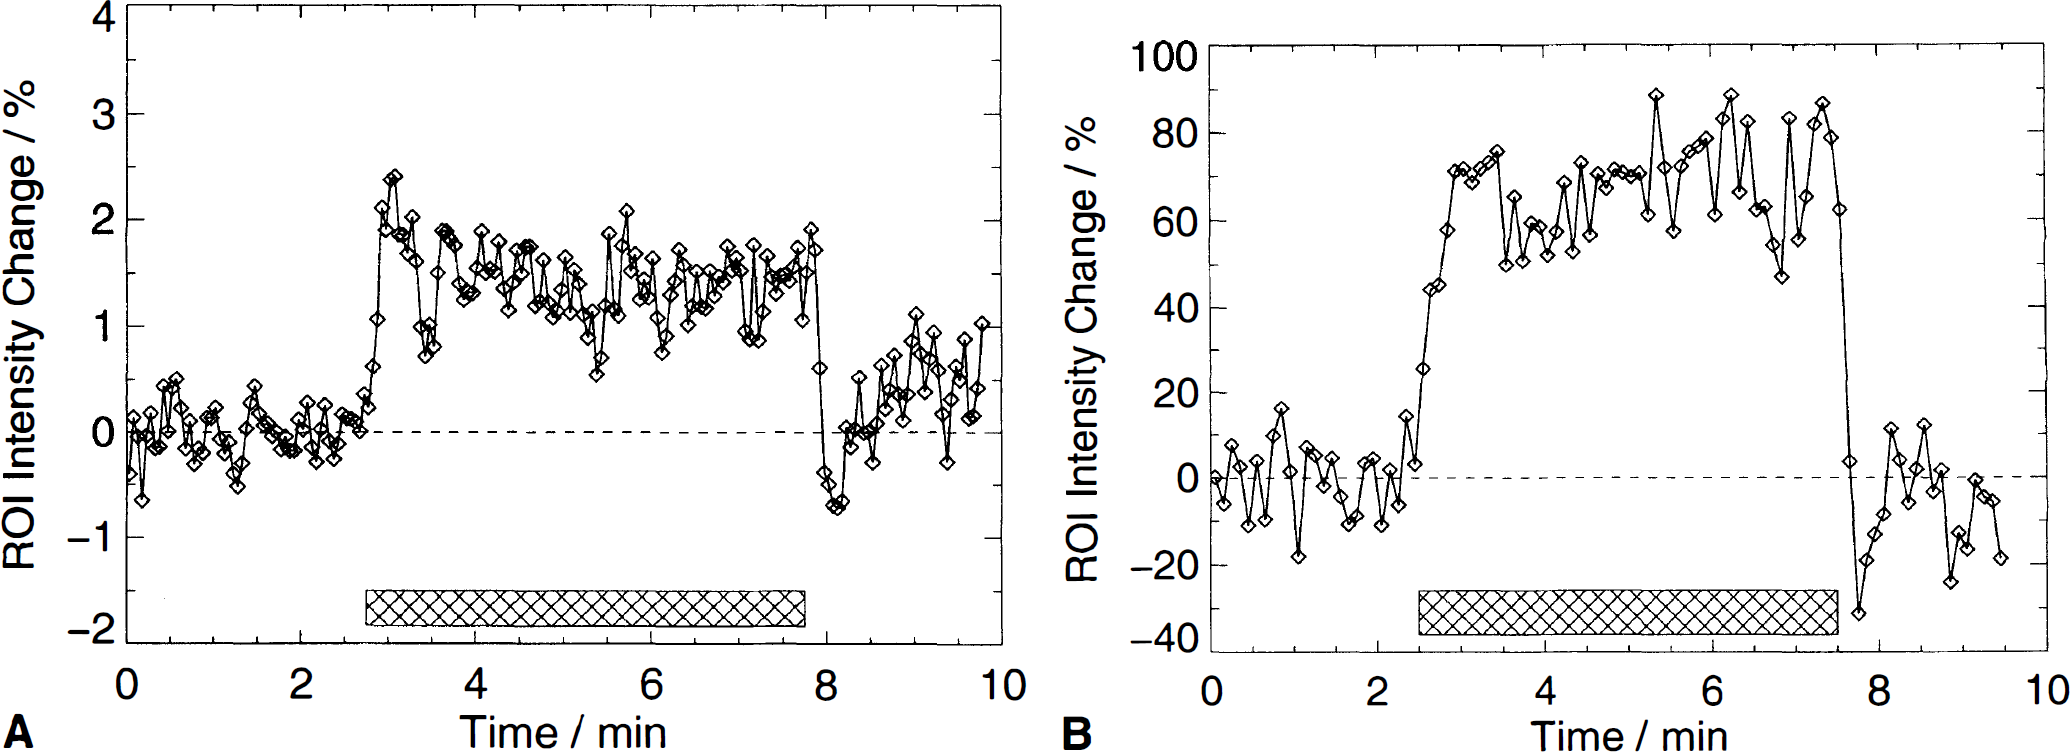
Time courses of mean BOLD (
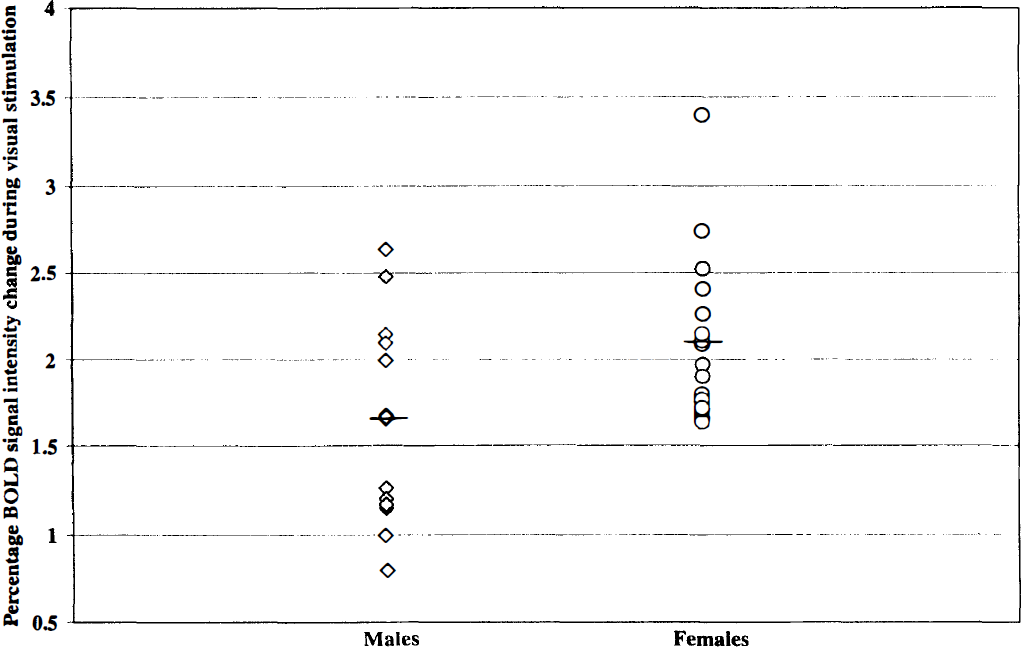
Change of BOLD signal intensities (%) during visual stimulation for men and women. Horizontal lines indicate mean BOLD increases in both groups separately. BOLD, blood oxygen level—dependent.
Baseline rCBF values in activated gray matter areas within the visual cortex were 57 ± 10 mL · 100 g−1 · min−1 in women and 50 ± 12 mL · 100 g−1 · min−1 in men, respectively (P < .05) (Table 1). For the entire study population rCBF increased by 30 ± 5 mL · 100 g−1 · min−1 · The increase of rCBF was not correlated with the baseline rCBF (rs = 0.01, P = .91) or with the percent BOLD signal intensity change (rs = 0.1, P = .7). Similar to the BOLD signal intensity changes, rCBF changes were preserved during the prolonged photic stimulation paradigm (Fig. 2). Despite a broad overlap between both groups the rCBF increase was significantly higher in women compared to men (33 ± 5 mL · 100 g−1 · min−1 versus 28 ± 4 mL · 100 g−1 · min−1, P < .01) (Table 1) (Fig. 4).
Regional cerebral blood flow values (mL · 100g−1 · min−1) in gray matter areas in human visual cortex
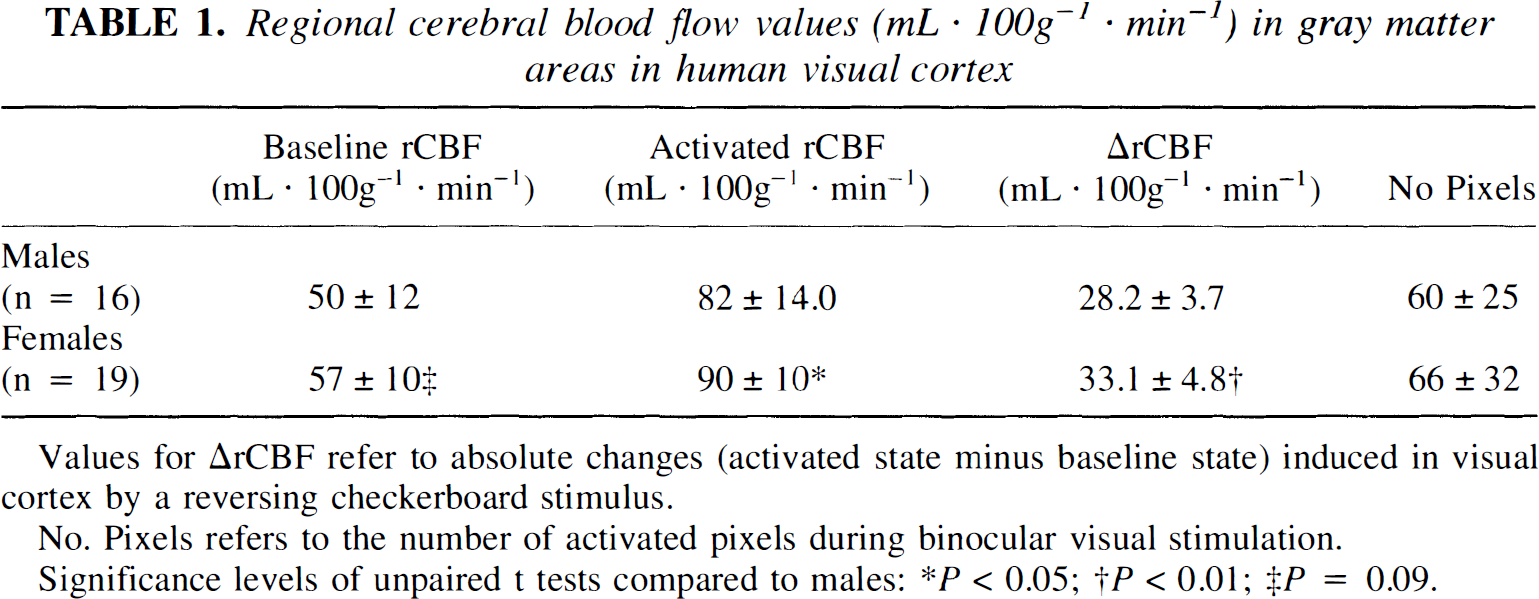
Values for ΔrCBF refer to absolute changes (activated state minus baseline state) induced in visual cortex by a reversing checkerboard stimulus.
No. Pixels refers to the number of activated pixels during binocular visual stimulation. Significance levels of unpaired t tests compared to males: *P < 0.05; †P < 0.01; ‡P = 0.09.
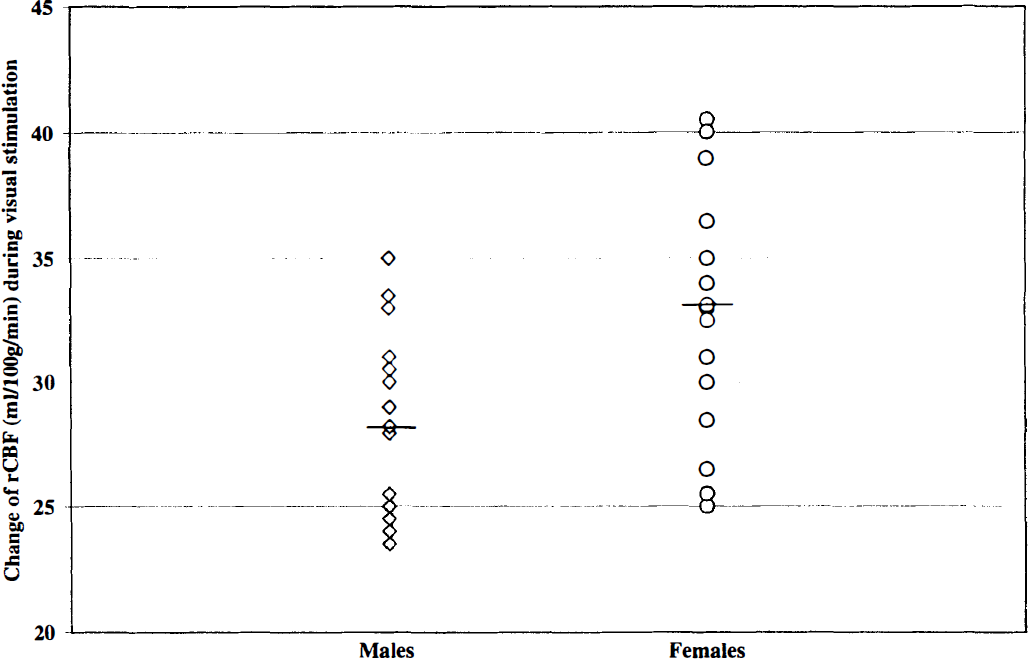
Change of rCBF (mL · 100 g−1 · min−1) during visual stimulation for men and women. Horizontal lines indicate mean rCBF increases in both groups separately.
DISCUSSION
Recently, noninvasive magnetic resonance imaging methods have been developed that are now capable of detecting and mapping CBF and oxygenation changes during brain activity, thus complementing the arsenal of functional brain investigation feasible with fMRI. Moreover, it has become possible to quantify rCBF changes during focal neuronal activation. For quantitative purposes, however, the exquisite sensitivity to motion artifacts of these techniques must be considered. Although all volunteers were secured with pillows and padding in the head coil, a few of our data sets had to be discarded because of motion artifacts.
We used a sustained checkerboard stimulation paradigm to evaluate possible gender differences in rCBF and oxygenation changes during focal physiologic neural activity. In good agreement with previous studies (Howseman et al., 1998; Kruger et al., 1998), BOLD signal intensities and rCBF changes did not decay over time.
In this study the increases of signal on T2-weighted images during checkerboard stimulation were significantly higher in women compared to men. Using a fast low-angle shot sequence and binocular visual stimulation with a flashlight frequency of 8 Hz, Hedera et al. (1998) reported similar results previously.
Because increases of the signal on T2-weighted images mainly depend on rCBF, cerebral blood volume, and cerebral metabolic rate of oxygen changes, making it impossible to attribute this gender difference to a single physiologic parameter, we also determined absolute rCBF changes.
The baseline rCBF values determined with FAIR, 57 ± 9 m · 100 g−1 · min−1 in women and 50 ± 12 m · 100 g−1 · min−1 in men, respectively, agree very well with literature values measured using PET (Rodriguez et al., 1988). Significantly higher global and rCBF values in women have been documented previously (Gur et al., 1982; Rodriguez et al., 1988); however, the mechanisms accounting for this finding are still unknown.
In accordance with the general concept of a tight coupling between CBF and brain function (Villringer and Dirnagle, 1995), rCBF increased during binocular photic stimulation. For the entire study population rCBF increased by 31 ± 5 mL · 100 g−1 · min−1, which is consistent with data measured by PET during similar experiments on visual stimulation (27.1 ± 6.85 mL · 100 g−1 · min−1, n = 10) Fox et al., 1988). Furthermore, this value is comparable to that reported by Kim and U gurbil (1997) using FAIR technique (31 ± 11 mL · 100 g−1 · min−1, n = 12).
Despite a broad overlap between both groups, the results of this study indicate gender differences in rCBF response during focal neuronal activity.
The increase of rCBF during visual stimulation was independent of baseline rCBF values, so that this finding cannot be explained by gender differences in baseline CBF. Taking into account that female global and rCBF per 100 g of brain tissue and thus the rCBF increase during brain activation could be higher as a compensation for the lower weight of the female brain (on the average ~10% less than the male brain (Dekaban, 1978)), this fact is of great importance.
Although gender differences have been found in the size and morphology of various brain structures (Allen et al., 1989; DeLacoste-Utamsing and Holloway, 1982), there is little evidence of gender-based anatomical differences in the visual system.
On the one hand, enhanced rCBF response in women during visual stimulation may be related to gender differences in visual physiology. Women have higher resting EEG activity, as well as a more pronounced EEG activity in response to checkerboard stimulation (Emmerson-Hanover et al., 1994). However, the relationship between EEG activity and rCBF remains to be clarified, although both parameters might reflect brain metabolism, which has been shown to be correlated to EEG activity (Paulson and Sharbrough, 1974).
On the other hand, the results of this study could reflect gender differences in the vascular response to focal brain activation. While the existence of a tight coupling between normal neuronal activity and blood flow is widely recognized, the coupling mechanism is still unknown. A number of vasoactive substances such as CO2, extracellular H+, K+, adenosine, and nitric oxide have been postulated to account for the coupling of CBF and metabolism (Villringer and Dirnagl, 1995).
Although a definitive role for each of these factors as major putative mediators of coupling remains to be elucidated, one may speculate that women have an increased vascular response to one or several of these vasoactive substances. A recent study has indicated that women have a stronger vasodilatory response to CO2 (Kastrup et al., 1998).
Although the mechanisms and biological significance of an enhanced rCBF response during focal brain activation in women are unclear, it is tempting to argue that hormonal influences might play a role. Consequently, it would be of utmost interest if such differences are still detectable after menopause. Moreover, one would want to examine females at different stages of the menstrual cycle while monitoring for changes in levels of gonadal and pituitary sex hormones.
From intrasubject comparison studies with different tasks, a high correlation between rCBF and BOLD signal intensity changes would have been expected (Dettmers et al., 1996). In line with a recent study by Kim and Ugurbil (1997), however, rCBF and BOLD signal changes were not correlated in this study, which may be related to differences in vessel architecture, venous oxygenation levels, and oxygen consumption (Duyn et al., 1994; Frahm et al., 1994; Lai et al., 1993). Thus, the observed gender differences in BOLD signal response during focal brain activation cannot be solely attributed to an increased flow activation.
Because our study was limited to the study of CBF and oxygenation changes during photic stimulation, our conclusions concern gender differences in the blood flow and oxygenation response in the visual cortex. The question arises if such gender differences also exist in other cortical areas. Although the rCBF values determined with the FAIR technique agree very well with previous PET studies, our results need confirmation with the use of other traditional flow-sensitive functional neuroimaging methods such as PET or single-photon emission computed tomography.
Footnotes
Acknowledgments
The authors thank the volunteers for their participation in the study and H.E. D' Arceuil for reviewing the manuscript.