
Abstract
The blood oxygenation level-dependent (BOLD) contrast mechanism can be modeled as a complex interplay between CBF, cerebral blood volume (CBV), and CMRO2. Positive BOLD signal changes are presumably caused by CBF changes in excess of increases in CMRO2. Because this uncoupling between CBF and CMRO2 may not always be present, the magnitude of BOLD changes may not be a good index of CBF changes. In this study, the relation between BOLD and CBF was investigated further. Continuous arterial spin labeling was combined with a single-shot, multislice echo-planar imaging to enable simultaneous measurements of BOLD and CBF changes in a well-established model of functional brain activation, the electrical forepaw stimulation of a-chloralose-anesthetized rats. The paradigm consisted of two 18- to 30-second stimulation periods separated by a 1-minute resting interval. Stimulation parameters were optimized by laser Doppler flowmetry. For the same cross-correlation threshold, the BOLD and CBF active maps were centered within the size of one pixel (470 µm). However, the BOLD map was significantly larger than the CBF map. Measurements taken from 15 rats at 9.4 T using a 10-millisecond echo-time showed 3.7 ± 1.7% BOLD and 125.67 ± 81.7% CBF increases in the contralateral somatosensory cortex during the first stimulation, and 2.6 ± 1.2% BOLD and 79.3 ± 43.6% CBF increases during the second stimulation. The correlation coefficient between BOLD and CBF changes was 0.89. The overall temporal correlation coefficient between BOLD and CBF time-courses was 0.97. These results show that under the experimental conditions of the current study, the BOLD signal changes follow the changes in CBF.
Keywords
The most widely used functional magnetic resonance imaging (MRI) technique is sensitive to local changes in deoxyhemoglobin concentration (Thulborn et al., 1982; Ogawa and Lee, 1990; Ogawa et al., 1990a, b ; Turner et al., 1991), the blood oxygenation level-dependent (BOLD) effect (Ogawa et al., 1992; Kwong et al., 1992; Bandettini et al., 1992). The BOLD contrast mechanism can be modeled as a complex interplay between relative CBF, cerebral blood volume, and changes in CMRO2 (Ogawa et al., 1993a, b ). However, the relation between these variables is not fully understood. Positive BOLD signal changes are presumably caused by fractional increases in CBF that are unmatched by fractional increases in CMRO2 (Fox and Raichle, 1986; Ogawa et al., 1993a). This mismatch between CBF and CMRO2 changes may not be present in all activated regions at all times (Roland et al., 1987; Seitz and Roland, 1992; Frahm et al., 1996; Kruger et al., 1996). Furthermore, there is no clear model to quantitate the changes in CBF from the measured BOLD signal changes. Therefore, BOLD remains a qualitative technique.
The functional metabolic coupling to the somatosensory cortex has been shown preserved in a-chloralose-anesthetized rats. Electrical stimulation of the rat forepaw elicits robust increases in CBF and cerebral blood volume that are associated with corresponding increases in local CMRglc. Therefore, this model has been used extensively to study the coupling between CBF and functional activity in cerebral cortex (Ueki et al., 1988; Kerskens et al., 1996; Schmitz et al., 1996; Narayan et al., 1995; Ueki et al., 1992; Hyder et al., 1996; Hyder et al., 1997). Although forepaw stimulation increases the BOLD signal (Kerskens et al., 1996; Hyder et al., 1994; Gyngell et al., 1996), reflecting a mismatch between CBF and oxygen consumption, an associated increase in CMRO2 also was reported (Hyder et al., 1996; Hyder et al., 1997). Therefore, it is unclear whether, in this model, BOLD reflects the full extent of the changes in CBF produced by increased functional activity.
Alternatives to BOLD-based functional imaging are MRI methods that can measure a single cerebrovascular parameter, such as CBF. Endogenous arterial water can be used as a MRI contrast agent to quantify absolute blood flow (Williams et al., 1992; Detre et al., 1992; Kwong et al., 1992; Detre et al., 1994; Edelman et al., 1994; Silva et al., 1995; Kwong et al., 1995; Kim, 1995). These arterial spin labeling techniques should therefore provide a precise assessment of relative CBF changes during brain activation.
In this study, we investigate the relation between BOLD and CBF during activation of the somatosensory cortex produced by electrical stimulation of the forepaw in anesthetized rats. First, the stimulation parameters producing the greatest CBF changes in somatosensory cortex were defined using laser Doppler flowmetry (LDF) to monitor CBF. Then, these parameters were used to produce focal increases in BOLD and CBF, as detected by MRI. By combining continuous arterial spin labeling with a single-shot, multislice gradient-echo echo-planar imaging (EPI) sequence, the relative increases in BOLD and CBF were simultaneously measured. Furthermore, by performing the experiments at 9.4 T, we were able to take advantage of the increased sensitivity for detecting BOLD and CBF changes at high magnetic field strengths. We demonstrate that, under carefully controlled experimental conditions, the magnitude and general localization of the BOLD changes produced by somatosensory activation are highly correlated with the associated CBF changes.
METHODS
Laser Doppler flowmetry experiments
Methods for surgical preparation of the rats and for monitoring of CBF by LDF have been described in detail previously (Iadecola, 1992a, b ) and are summarized later.
Animal preparation. Studies were conducted in nine male Sprague-Dawley rats weighing 287 ±41 g that were anesthetized with halothane (5% induction, 2% maintenance). Catheters were placed into the femoral artery and vein to monitor arterial blood pressure, mean arterial blood pressure (MAP), and heart rate, and to sample blood gases and deliver drugs. The trachea was cannulated, and the animals were placed on a stereotaxic frame (model 104, Kopf Instruments, Tujunga, CA, U.S.A.) and artificially ventilated by a mechanical ventilator (model 683, Harvard Apparatus, South Natick, MA, U.S.A.). Rectal temperature was maintained at 37° ± 0.5°C using a heating lamp thermostatically controlled by a rectal probe (model 73A-TA, YSI, Yellow Springs, OH, U.S.A.). After exposing the skull, a hole (7-mm diameter) was drilled at a site 4 mm lateral to the midline and 1 mm caudal to the bregma. Care was taken during the drilling of the bone to avoid heat damage to the cortex. The dura then was carefully removed, and the exposed surface of the cortex was superfused with Ringer's solution (37°C, pH 7.3 to 7.4) as previously described (Iadecola, 1992a). After completion of the surgical procedures, halothane was discontinued, and anesthesia was maintained with a-chloralose (80 mg/kg intravenously, followed by 40 mg/kg every 90 minutes). Blood gases then were adjusted and maintained throughout the experiment. Arterial blood pH was maintained between 7.4 and 7.5, Pa
Cerebral flood flow monitoring and forepaw stimulation. Laser Doppler flowmetry was performed using a Laserflow flowmeter (Vasamedic, St. Paul, MN, U.S.A.) as previously described (Iadecola, 1992a, b ). The probe (tip diameter 0.8 mm) was mounted on a micromanipulator (Kopf) and positioned approximately 0.5 mm above the pial surface. The analog output from the instrument was fed into a direct current amplifier (Grass Instrument Co., Quincy, MA, U.S.A.) and displayed on a polygraph (Grass), To avoid pulsatile variations in the flow signal, an internal 10-second moving average filter was used. The analog signal also was digitized and stored in a computer for accurate quantitation of the CBF changes. Changes in CBF were calculated as percentage of the baseline value determined at the end of the experiment (Iadecola, 1992a,b). The LDF probe was positioned 3 to 4 mm lateral to the midline at the level of the bregma, a region that corresponds to the location of the somatosensory cortex (Paxinos and Watson, 1996). For forepaw stimulation, two needle electrodes were inserted under the skin of the right forepaw (between digits 2 and 3 and digits 4 and 5) and connected to a Grass stimulator (model S88).
Experimental protocol. The purpose of the LDF experiments was to determine the stimulation parameters resulting in the greatest CBF changes. These stimulation parameters then were used in experiments in which CBF and BOLD were measured by MRI. After the blood gases were adjusted, the procedures for localization of the forelimb area of the somatosensory cortex were started. The right forepaw was stimulated, and the corresponding changes in CBF were recorded. Exploratory stimuli consisted of 10- to 20-second trains at 3 Hz (pulse duration 0.5 milliseconds) and 1.5 mA. The probe then was moved in 0.5-mm steps and the forepaw stimulated again. The site at which forepaw stimulation produced the largest changes in CBF was defined as the active site and used for studies in which stimulation parameters were optimized.
Three sets of experiments were performed to define the most effective stimulation parameters: (1) current optimization: the stimulation current was varied from 0.1 to 2.5 mA, applied as 40-second trains of 0.3-millisecond pulses at 3 Hz; (2) frequency optimization: a stimulation current of 1.5 mA was applied in 40-second trains of 0.3-millisecond pulses at 1 to 5 Hz; and (3) pulse width optimization: a stimulation current of 1.5 mA was applied in 40-second trains of 0.1- to 0.5-millisecond pulses at 3 Hz.
Each stimulation epoch consisted of a 20-second baseline resting period followed by a 40-second stimulation train. Stimulations were delivered every 5 minutes to allow CBF to return to baseline before the next stimulation. The 40-second stimulation train was long enough for CBF to reach a plateau during stimulation. Stimulation parameters were tested in a randomized sequence to minimize confounding effects of changing levels of anesthesia. Arterial blood gases were monitored periodically to ensure that they were in a steady state throughout the experiments.
Magnetic resonance imaging experiments
Methods for surgical preparation of the rats and for monitoring of CBF by MRI have been described in detail previously (Silva et al., 1995, 1997) and are summarized later.
Animal preparation. The MRI studies were conducted in 15 male Sprague-Dawley rats weighing 253 ± 28 g. Surgical procedures were done under either isoflurane (5% induction, 2% maintenance) or halothane (5% induction, 1.5% maintenance) anesthesia. The rats were orally intubated, and catheters were inserted in the left femoral artery and vein. After surgery, the rats were secured in a home-built head holder by means of a byte bar and two ear pieces. A 1.2-cm diameter surface coil was positioned on top of the head over bregma and secured to the head holder. The animals then were placed in a semicylindrical cradle, which contained a small, 0.5-cm in diameter butterfly labeling coil (Silva et al., 1995) used for the continuous arterial spin labeling experiments. Care was taken to position the neck of the animal over the labeling coil. The typical separation between the center of the two coils was 2 cm. Rectal temperature was maintained close to 37°C using a heated water blanket. Anesthesia was switched to α-chloralose (80 mg/kg initially, followed by 40 mg/kg every 90 minutes). Blood gases then were adjusted and maintained throughout the experiment. Arterial blood pH was maintained between 7.3 and 7.4, Pa
Magnetic resonance imaging methods. The two coils were arranged such that the radio frequency (RF) field of the imaging coil was orthogonal to the RF field of the labeling coil to avoid interaction (i.e., coupling) between the two coils. The electrical isolation between the two coils when an animal was inside the magnet was greater than 20 dB. Therefore, there was no need to use active decoupling schemes (Silva et al., 1995) between the two coils.
All images were acquired using a 9.4 T/31 cm horizontal magnet (Magnex, Abingdon, Oxon, U.K.) interfaced to a Unity INOVA console (Varian, CA, U.S.A.). Using single-average, single-shot gradient-echo EPI, images were obtained with a data matrix 64 × 32, field of view = 3.0 cm (readout) × 1.5 cm (phase encoding), slice thickness = 2 mm, echo time = 10 milliseconds, and interslice repetition time = 22 milliseconds. Three adjacent slices were acquired consecutively. Before the stimulation experiments, blood gases were adjusted and care was taken to position the three imaging slices over the somatosensory cortex, with the center slice placed 0 to 1 mm rostral to the bregma. Global shimming then was performed manually. The typical waterline width obtained after shimming was 30 Hz. Continuous arterial spin labeling was accomplished by applying a 3-second RF pulse to the labeling coil under the presence of a 10 mT/m longitudinal gradient. For the control images, the sign of the offset-frequency used for labeling was switched (Silva et al., 1995, 1997). For the stimulation experiments, labeled and control images were acquired alternately every 3 seconds.
Forepaw stimulation. Techniques for forepaw stimulation were identical to those described earlier for LDF. The forepaw stimulation paradigm consisted of two stimulation periods lasting 18 seconds (2 animals) or 30 seconds (13 animals) each, interleaved by a resting period of 1 minute. Typically, 40 pairs of labeled and control images were acquired. The stimulation parameters, as determined on the basis of the results of the LDF studies, were as follows: current intensity 1.5 mA, frequency 3 Hz, and pulse duration 0.3 milliseconds. Two needle electrodes were placed in each forepaw. However, only one paw was stimulated during a given experiment. A resting period of at least 5 minutes was observed between consecutive stimulations.
Magnetic resonance imaging data analysis. The BOLD contrast was obtained from the control images. Cerebral blood flow images were formed with a nominal temporal resolution of 6 seconds by pairwise subtraction of the labeled and control images on a voxel-by-voxel basis according to Zhang and coworkers (1995) and Silva and colleagues (1997):
where 5C is the control image signal intensity, 5L is the labeled image signal intensity, λ A is the brain-blood partition coefficient for water, T1 is the longitudinal relaxation time constant for brain tissue, and α is a measure of the efficiency of arterial spin labeling (Zhang et al., 1995; Silva et al., 1997). Both λ and T1 were set to 0.9 (Herscovitch et al., 1985) and 1.9 seconds (Tsekos et al., 1998), respectively. Following the same procedures described in by Silva and coworkers (1995), we measured α = 0.81 ± 0.03 (n = 7). This value is in excellent agreement with the value of 0.82 reported by Silva and associates (1995) and was used for all CBF calculations presented here. Equation 1 ignores the effect of cross-relaxation between tissue water and macromolecules (Zhang et al., 1995; Silva et al., 1997). However, it has been shown that this is a small effect (Zhang et al., 1995; Silva et al., 1997).
Control and CBF images were processed using a boxcar cross-correlation method (Bandettini et al., 1993). Active maps were generated by thresholding to a minimum cross-correlation value of 0.5 (Bandettini et al., 1993). The minimum cluster size for an active region was four pixels (Forman et al., 1995). Since multiple comparisons were performed on 6144 image voxels, a modified Bonferroni correction was used with the number of images set to 40, cluster size set to 4, and a cross-correlation value of 0.5, as described previously (Xiong et al., 1995; Chen et al., 1998). The effective P value was smaller than 6.0 × 10⁻⁹. To compare the relative changes of BOLD and CBF, region of interest (ROI) analysis was performed. Typically, nine pixels in the contralateral somatosensory area were chosen, based on the active maps. For each rat, the same ROI was used to obtain the BOLD and the CBF time-courses and their relative changes as a percentage of the baseline values.
Data analysis
Data in text, tables, and figures are presented as mean ± SD. Student's t-tests were performed to compare differences in the BOLD and CBF responses between left and right forepaw, and between first and second stimulations. Differences were considered statistically significant for P values < 0.05.
RESULTS
Optimization of the stimulation parameters from laser Doppler flowmetry measurements
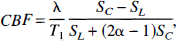
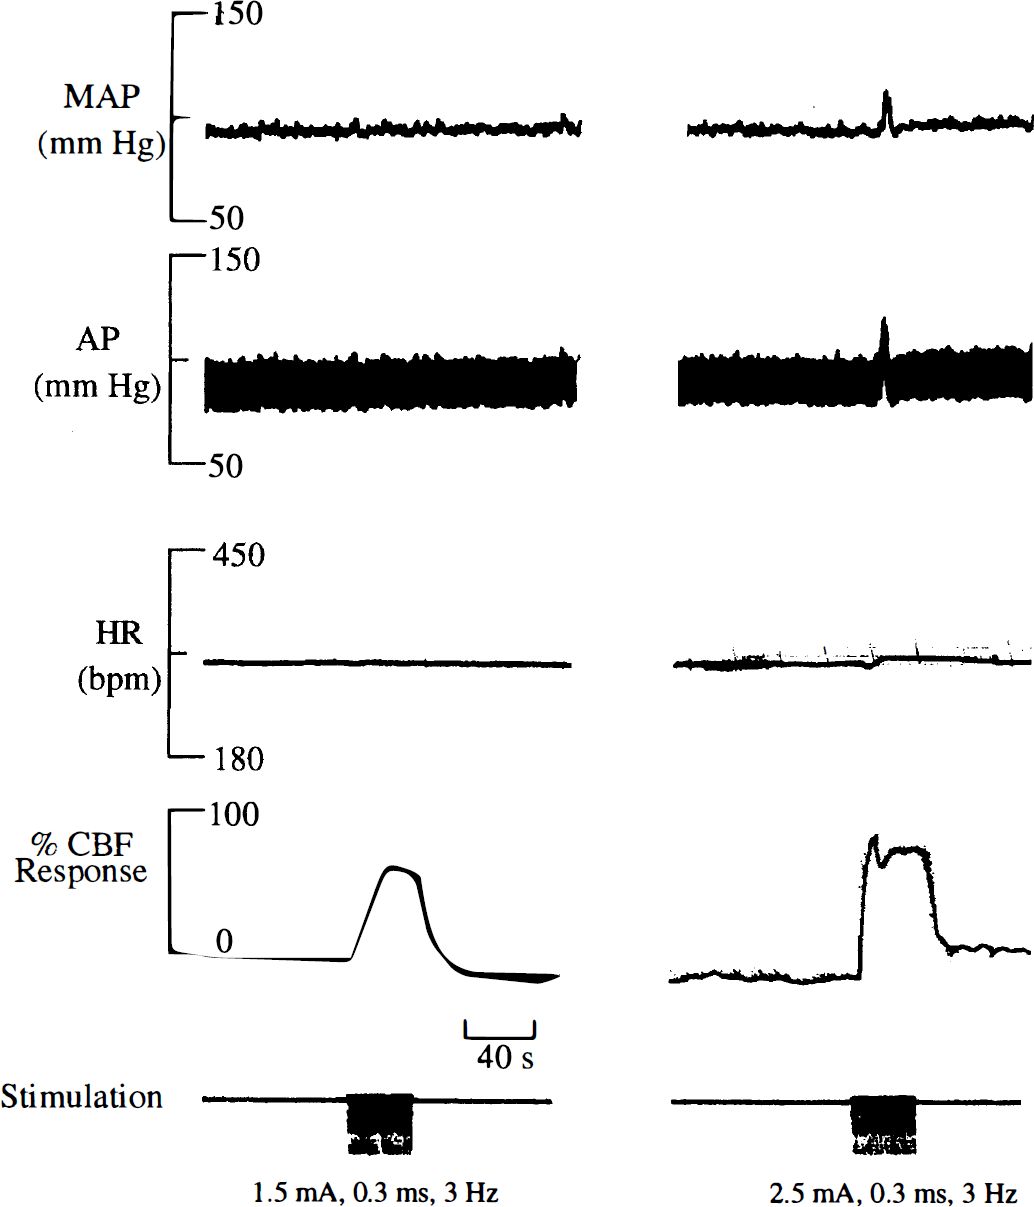
In these experiments, we defined the stimulation parameters producing the largest CBF increase in the absence of changes in MAP. These studies are needed because there has been no systematic investigation of the changes in CBF produced by forepaw stimulation under the experimental conditions of the current study. Stimulation of the forepaw produced robust increases in CBF that were locked to the stimulation period (Fig. 1). The magnitude of the increase in CBF depended on the stimulus intensity (0.1 to 2.5 mA) (Fig. 2A). The largest CBF increase without MAP changes was observed at 1.5 mA. However, stimulus intensities greater than 1.5 mA usually produced changes in arterial pressure and heart rate that contributed to the CBF increase (Fig. 1). For example, Fig. 1 shows that CBF stayed elevated above baseline after the 2.5-mA stimulus. Similar findings were reported by Detre and colleagues, who observed a monotonic increase of the CBF response for currents between 0.5 and 2 mA; however, the response to 2 mA was accompanied by global MAP changes (Detre et al., 1998). The increase in CBF also was dependent on the frequency of stimulation and pulse duration (Fig. 2B and C). The inverted U-shaped response to stimulation frequency seen in Fig. 2B also was observed by other groups (Gyngell et al., 1996; Detre et al., 1998). Gyngell and associates report decreased BOLD changes for frequencies above 3 Hz (1996), whereas Detre and coworkers report maximum CBF changes at 5 Hz (1998). As indicated by the arrows in Fig. 2, the greatest CBF increases, in the absence of changes in MAP, were observed at 1.5 mA, 3 Hz, and pulse duration of 0.3 milliseconds. This set of stimulation parameters was, therefore, used in the MRI experiments described later.
Polygraph traces of two different current stimulation challenges to a rat. The relative CBF response to a 1.5 mA (left) and a 2.5 mA (right) train of 0.3-millisecond pulses at 3 Hz are shown. For this animal, the 1.5-mA stimulation caused a 53% increase in CBF, whereas the 2.5-mA challenge caused a 92% increase in CBF. No changes in mean arterial blood pressure (MAP) were observed during the 1.5-mA stimulation. However, the MAP increased from 98 to 125 mm Hg at the onset of the 2.5-mA stimulation.
Cerebral blood flow response to forepaw stimulation measured by laser Doppler flowmetry. Stimulation consisted of a 40-second train of electric pulses using different current intensities, frequencies, and pulse widths. A minimum resting period of 5 minutes was allowed between stimulations. (
Simultaneous BOLD and CBF maps during forepaw stimulation
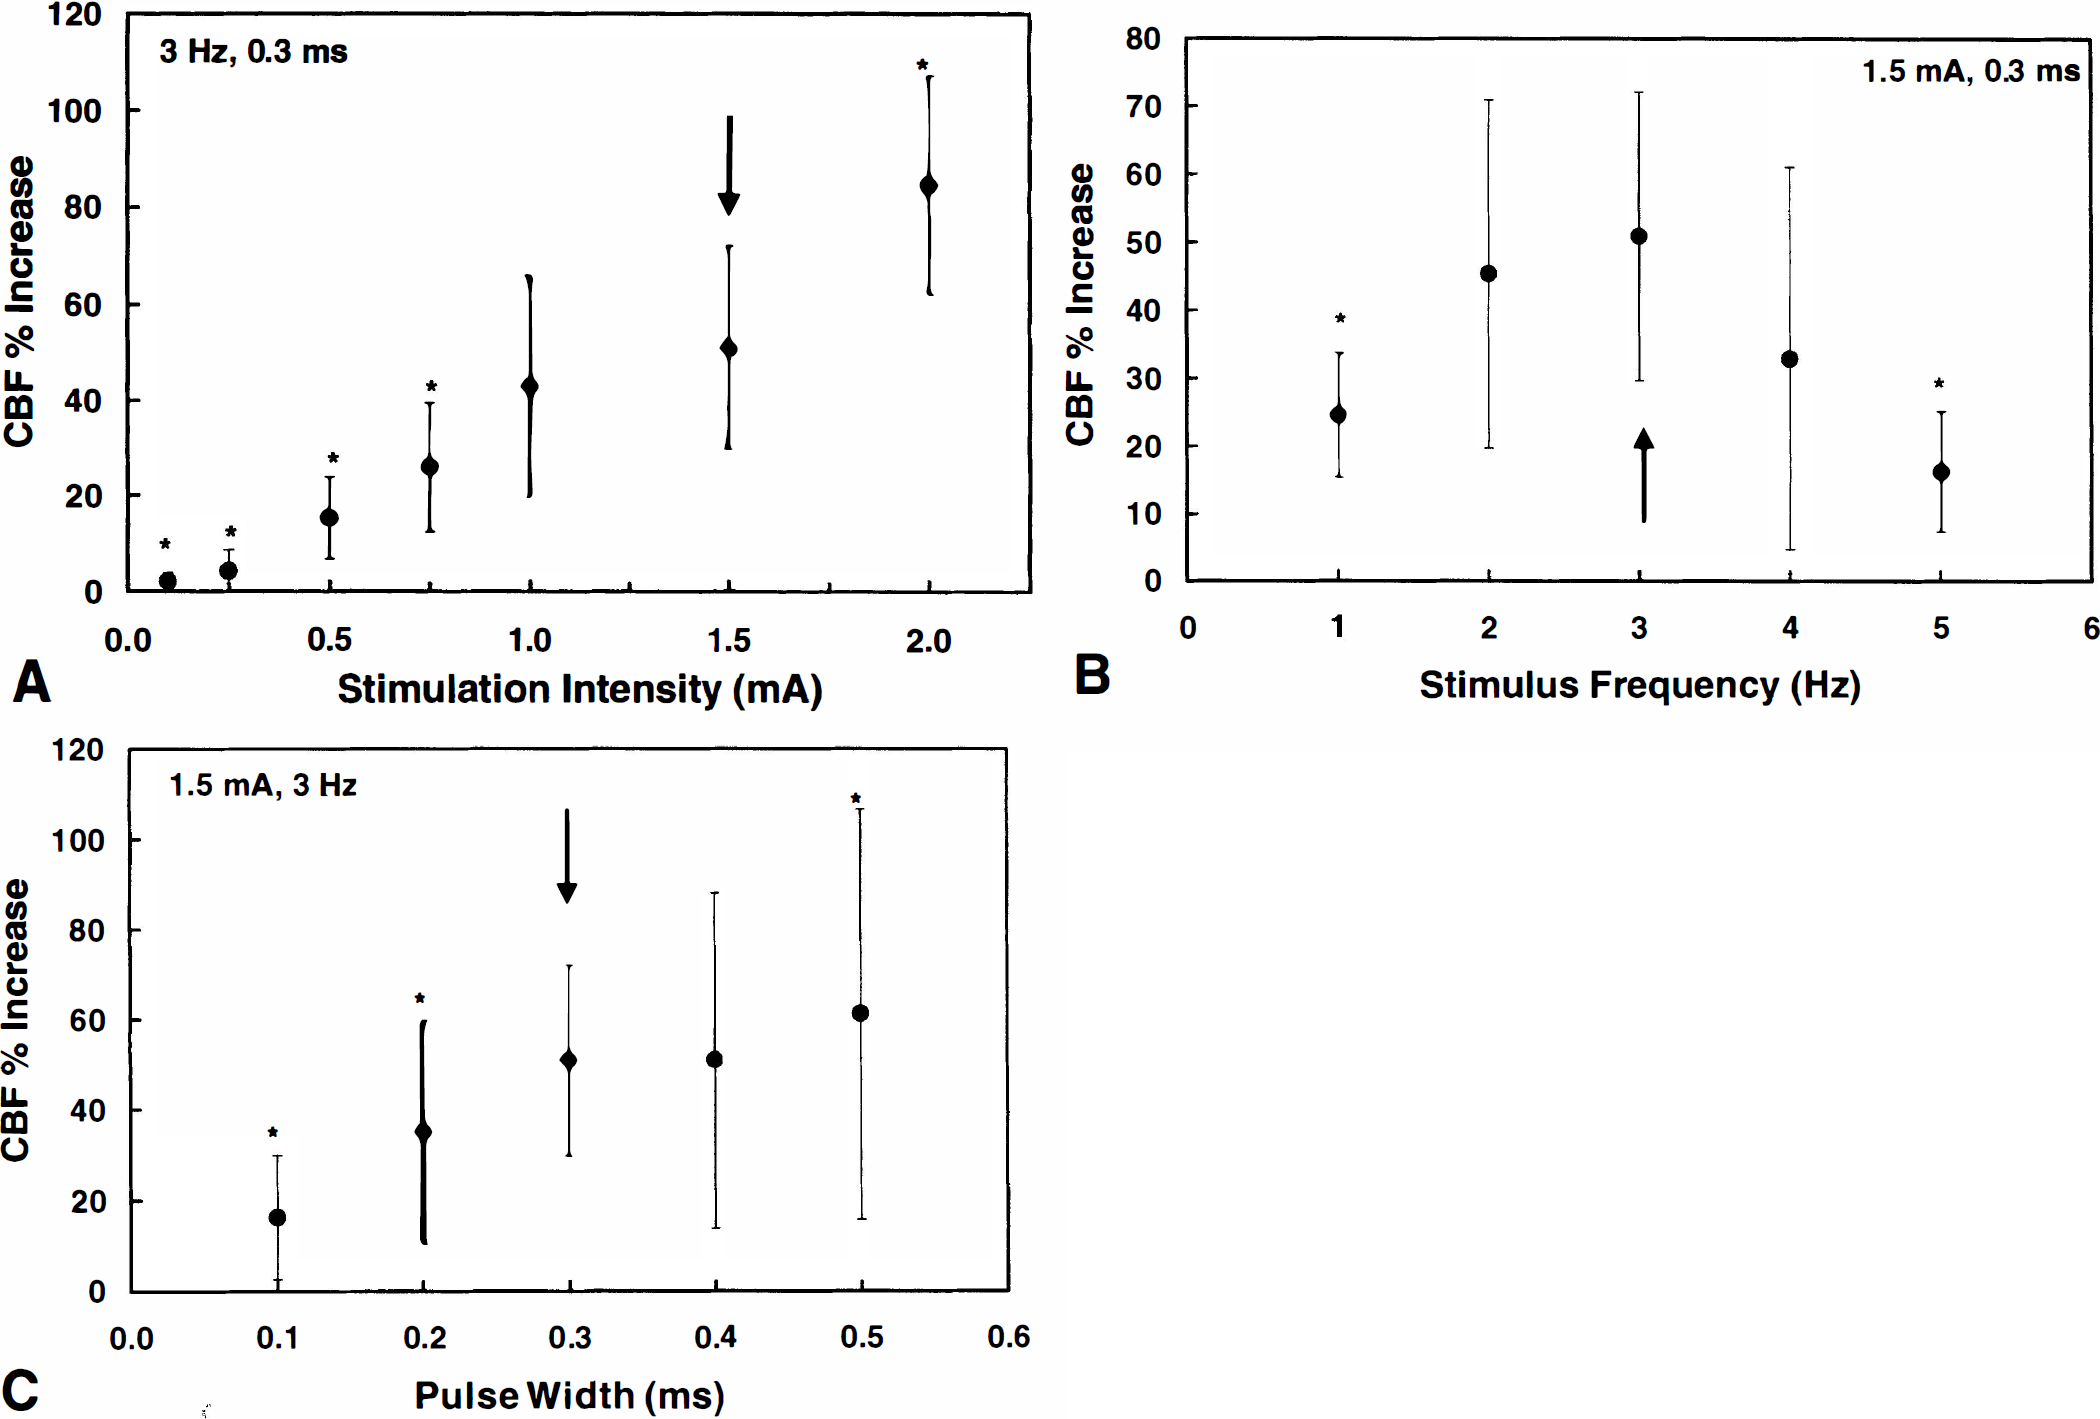
Spatial correspondence. Using the stimulation parameters determined from the LDF experiments described earlier, there were no detectable increases in MAP for all functional MRI studies. Figure 3 shows typical results obtained from the stimulation of the right forepaw. All images are viewed in radiologic coordinates (right hemisphere is displayed on the left-hand side of the image). Figure 3 shows the BOLD and CBF active maps overlaid onto the anatomical (top row) and the CBF (bottom row) images, respectively. The colored bar on the right shows the color-coded scale of the cross-correlation values for each pixel in the active regions. As expected, the stimulation of the forepaw produces activation in a well-defined region of the contralateral somatosensory cortex, whereas no activation is observed in the ipsilateral somatosensory cortex. These findings were observed in all studies. The spatial characteristics of the BOLD and the CBF response were analyzed by determining the number of active pixels in each region and by finding the spatial coordinates of the center of the active maps relative to midline. The separation between the centers of the BOLD and the CBF maps also was computed for each experiment. Table 1 summarizes the spatial correspondence between the BOLD and the CBF active maps. The locations of the centers of the BOLD and the CBF maps are in excellent agreement with the coordinates of the forelimb area of the somatosensory cortex (Paxinos and Watson, 1996; Schmitz et al., 1996). The center of the BOLD active regions was more medially located with respect to baseline than the center of the CBF maps (P < 0.05). Considering the spatial resolution of this experiment (approximately 470 × 470 μm), the mean separation between the center of the BOLD and the CBF active regions was determined to be less than one pixel (Table 1). The size of the active region for the given cross-correlation threshold of 0.5 was significantly larger for the BOLD response (P < 0.001). However, there was a strong correlation between the number of pixels in the BOLD and CBF regions (correlation coefficient = 0.92). Furthermore, as shown in Table 1, the mean cross-correlation values in the BOLD and CBF active regions were identical (P > 0.20), suggesting that the discrepant pixels had a low cross-correlation value. In general, as it can be seen from Fig. 3, discrepant pixels were more superficially and medially located, possibly belonging to regions that contain some large draining veins.
Anatomical (top row) and CBF images (bottom row) of the rat brain on stimulation of the right forepaw. The blood oxygenation-level dependent (BOLD) and the CBF active maps resulting from a boxcar cross-correlation with the time-course of the stimulation are overlaid onto the anatomical and the CBF images, respectively. The colored bar indicates the cross-correlation values.
Spatial correspondence between BOLD and CBF active maps
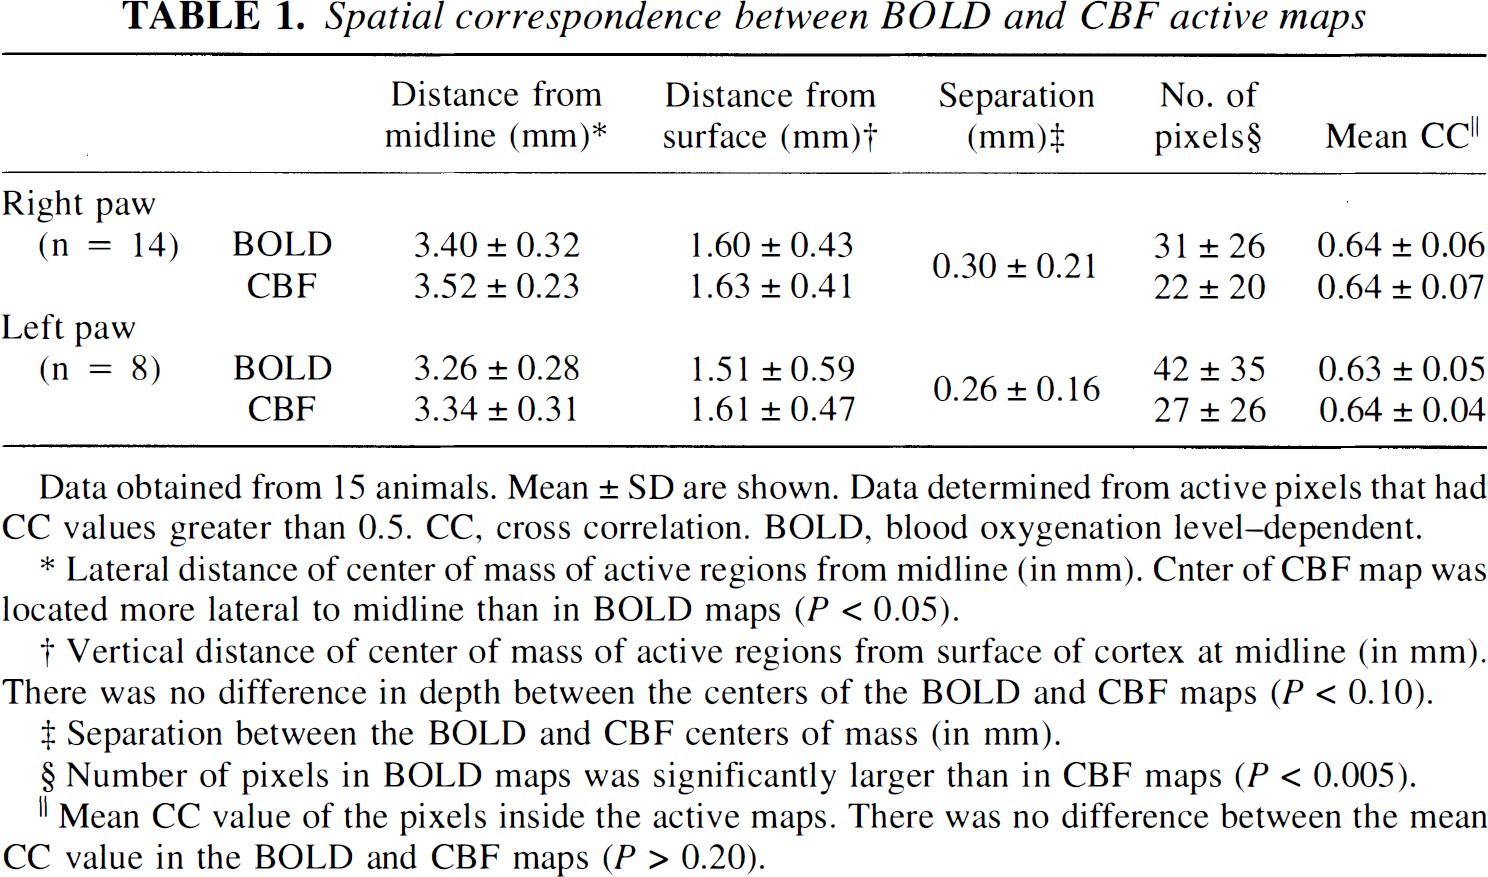
Data obtained from 15 animals. Mean ± SD are shown. Data determined from active pixels that had CC values greater than 0.5. CC, cross correlation. BOLD, blood oxygenation level-dependent.
Lateral distance of center of mass of active regions from midline (in mm). Cnter of CBF map was located more lateral to midline than in BOLD maps (P < 0.05).
Vertical distance of center of mass of active regions from surface of cortex at midline (in mm).
There was no difference in depth between the centers of the BOLD and CBF maps (P < 0.10).
Separation between the BOLD and CBF centers of mass (in mm).
Number of pixels in BOLD maps was significantly larger than in CBF maps (P < 0.005).
Mean CC value of the pixels inside the active maps. There was no difference between the mean CC value in the BOLD and CBF maps (P > 0.20).
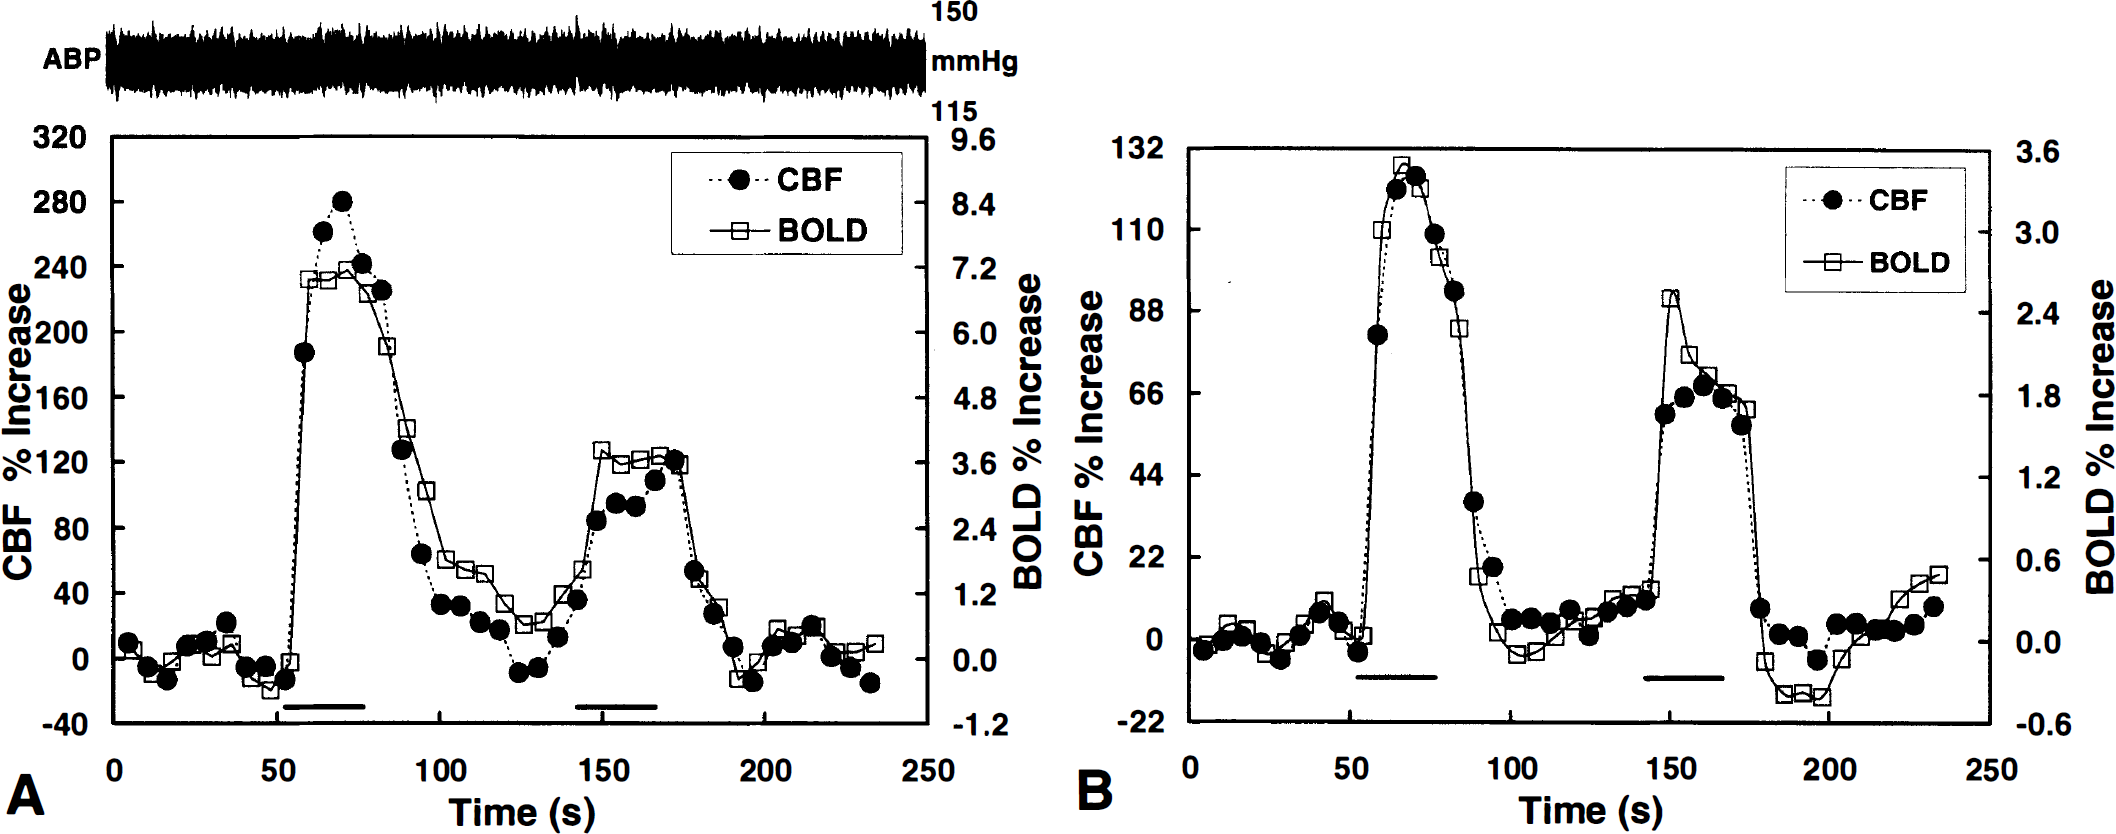
Magnitude and temporal correspondence. Figure 4A shows MRI time-courses of a nine-pixel ROI placed on the center (middle slice) of the active areas in the BOLD and CBF maps shown in Fig. 3 (the same ROI was used for both BOLD and CBF). The arterial blood pressure trace also is shown. As mentioned already, no arterial pressure change was observed during forepaw stimulation. For this particular rat shown in Fig. 3, two 30-second stimulation periods were used. There was excellent temporal correlation between the BOLD and the CBF changes throughout the entire time-course of the stimulation. Although there was a drop in the percentile response between the first and the second stimulation periods, the correspondence between the BOLD and the CBF responses remained constant. This finding was consistently observed in all studies. Fig. 4B shows averaged BOLD and CBF time-courses for the paradigm using two 30-second stimulations (13 animals, right and left forepaws combined). The mean relative BOLD and CBF changes were 3.5% and 124.4% during the first stimulation period, and 1.9% and 68.3% during the second period, respectively. Despite the weaker BOLD and CBF response to the second stimulus, the ratio of percent CBF changes to percent BOLD changes remained constant (35.5 for the first stimulation and 35.8 for the second stimulation). The overall temporal correlation coefficient for the BOLD and CBF time-courses shown in Fig. 4B was 0.97.
(
Table 2 summarizes the magnitude of the BOLD and CBF responses to forepaw stimulation as detected by MRI. The large SD values reported here result from animal-to-animal variations. Repeated measurements in the same animal produced identical results. No statistically significant difference was found between the BOLD and CBF responses obtained from stimulation of the right forepaw compared with the responses obtained from stimulation of the left forepaw (P > 0.44). The second forepaw stimulation induced less BOLD and CBF (P < 0.001) signal increases than the first stimulation period. Notice that the interval between two stimulation periods was I minute. However, the ratio between the CBF and the BOLD responses remained constant between the two stimulation periods (P > 0.13). As shown in Table 2, the contrast-to-noise ratio of the BOLD data was no higher than the CBF data. This is because the echo-time used in the EPI sequence was not adjusted to optimize the sensitivity to BOLD signal changes, but to allow CBF changes to be detected reliably, with high sensitivity.
BOLD and CBF percent increases, and contrast-to-noise ratios, during forepaw stimulation
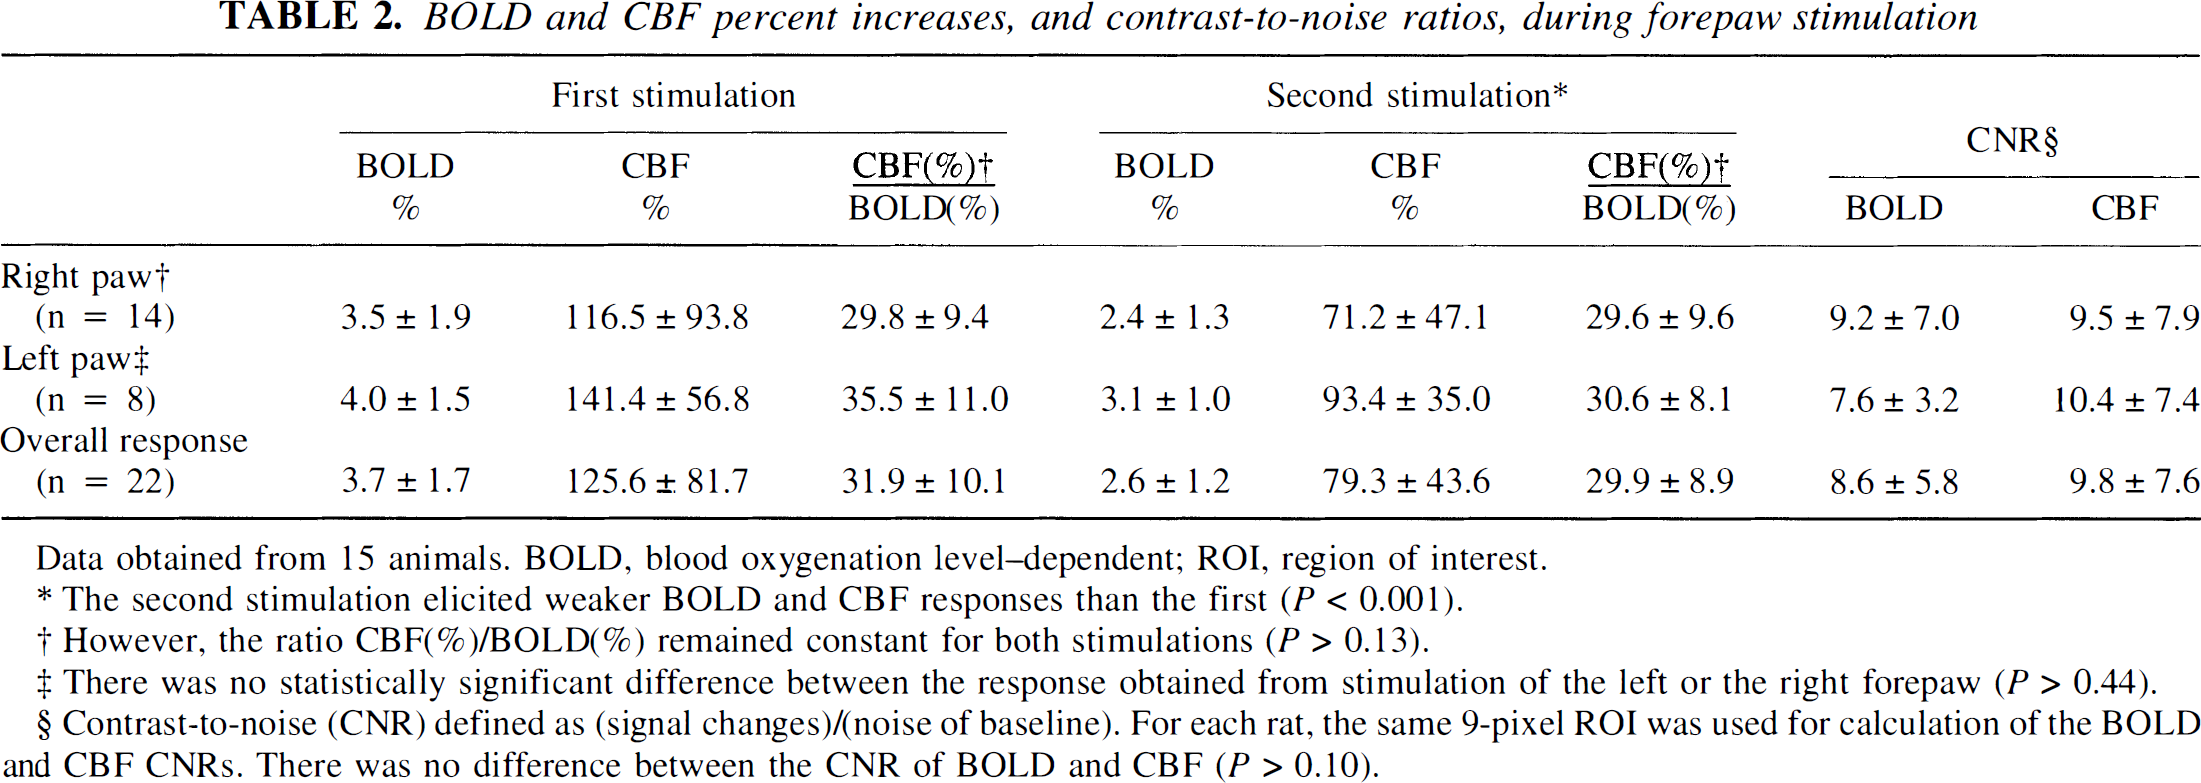
Data obtained from 15 animals. BOLD, blood oxygenation level–dependent; ROI, region of interest.
The second stimulation elicited weaker BOLD and CBF responses than the first (P < 0.001).
However, the ratio CBF(%)/BOLD(%) remained constant for both stimulations (P > 0.13).
There was no statistically significant difference between the response obtained from stimulation of the left or the right forepaw (P > 0.44).
Contrast-to-noise (CNR) defined as (signal changes)/(noise of baseline). For each rat, the same 9-pixel ROI was used for calculation of the BOLD and CBF CNRs. There was no difference between the CNR of BOLD and CBF (P > 0.10).
The relative BOLD increases against the relative CBF increases of all measurements are plotted in Fig. 5. The first stimulation period (close circles) clearly presents a stronger response than the second period (open squares). Importantly, the relative BOLD changes are well correlated to the relative CBF changes. The correlation coefficient between the relative BOLD changes and the relative CBF changes was 0.89 and 0.79 for the first and the second stimulation periods, respectively.
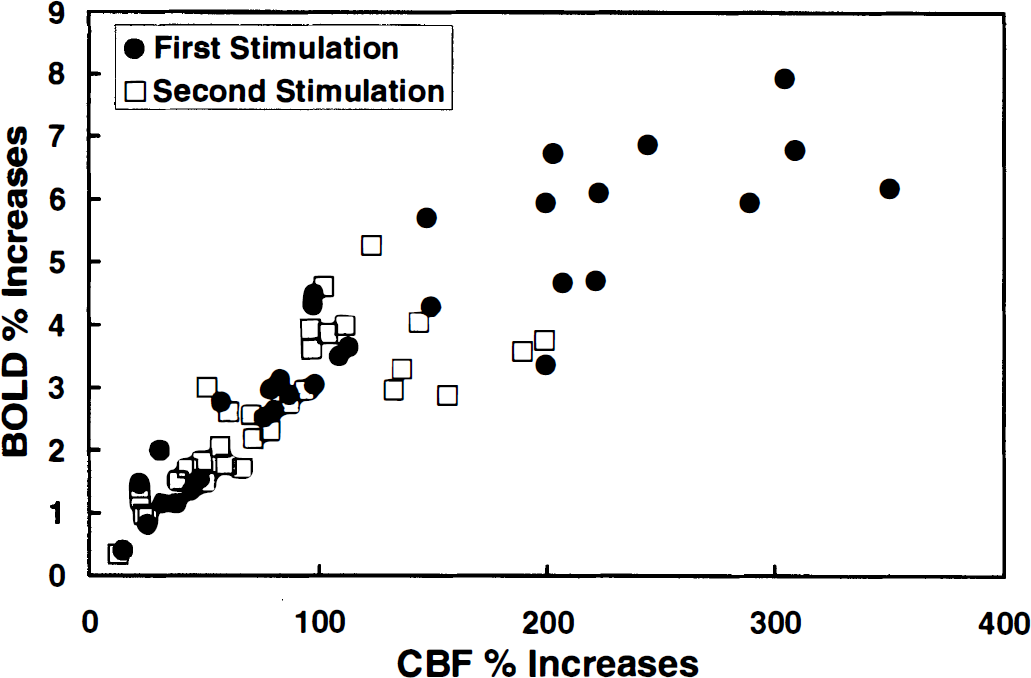
Plot of the relative BOLD changes versus the relative CBF changes from all individual measurements performed in this study. The second stimulation period (open squares) presents a weaker response compared with the first stimulation period (black circles). Correlation was excellent between the relative BOLD changes and the corresponding CBF changes in both stimulation periods.
DISCUSSION
By combining the continuous arterial spin labeling technique with EPI detection, we were able to simultaneously determine the BOLD and CBF relative changes to a well-established functional paradigm, the electrical forepaw stimulation in α-chloralose–anesthetized rats. Experimental conditions were carefully controlled by monitoring and maintaining normal blood gases, and by choosing stimulation parameters that produced robust BOLD and CBF increases in the contralateral somatosensory cortex, without eliciting arterial blood pressure changes or activation of the ipsilateral cortex. Notice that the CBF increases measured by LDF generally were smaller than those measured by MRI. This is probably because the LDF probe was not positioned at the site of maximum CBF increase, or it was caused by partial volume effects because LDF has greater sensitivity to superficial CBF changes.
From our measurements at 9.4 T using a single-shot EPI sequence with TE = 10 milliseconds, we observed BOLD and CBF changes in a well-localized region of the contralateral somatosensory cortex. For the same statistical threshold, the BOLD active region was larger than the CBF active region. This could be because BOLD is more sensitive to large vessels, in particular veins (Ogawa et al., 1993a; Lai et al., 1993; Menon et al., 1993; Kim et al., 1994; Song et al., 1996). Despite the fact that BOLD data acquired at 9.4 T should be less sensitive to large intravascular components (because of the short T*2 of deoxygenated blood at high magnetic fields), it is still sensitive to the extravascular artifacts of the regions surrounded by large vessels. Nevertheless, at 470 × 470 µm spatial resolution, the separation between the centers of the BOLD and CBF maps was smaller than one pixel. Furthermore, these regions had the same mean cross-correlation value. These two facts combined indicate that the cross-correlation values in the discrepant regions were low, suggesting that the use of a higher cross-correlation threshold for BOLD would make the active regions similar (Kim and Tsekos, 1997a).
The BOLD contrast on electrical forepaw stimulation in α-chloralose–anesthetized rats has been previously reported (Hyder et al., 1994, 1997; Gyngell et al., 1996; Kerskens et al., 1996). Because of the field and echo-time dependence of the BOLD contrast, it is difficult to compare the percentile increase in BOLD signal between the different reports. However, the regions of activation reported here were spatially consistent with the ones published by Gyngell and coworkers (1996) and Kerskens and associates (1996). A much larger and medially located region of activation was reported by Hyder and others (Hyder et al., 1994). This could have resulted from several factors: they used constant voltage (5 V), and not constant current, in their experiments. Assuming the internal subcutaneous impedance between digits 2 and 5 of a 200- to 300-g rat to be about 2 kΩ (unpublished measurements), the effective stimulation current in their experiment was about 2.5 mA, higher than the current used here. In addition, they also observed a 10-mm Hg increase in MAP during stimulation, as well as ipsilateral activation. Kerskens and colleagues (1996) measured the location, not quantitation, of CBF increases during 0.5 mA forepaw stimulation using the arterial spin tagging method and found active sites located at the contralateral somatosensory area, which is consistent with our quantitative CBF studies. Hyder and associates (1997) predicted larger than 200% to 400% CBF increases during 5-V (2.5-mA) forepaw stimulation based on both their oxygen consumption and BOLD measurements. Our 126% CBF increase during 1.5-mA stimulation suggests that CBF increases in excess of 200% can be possible during 2.5-mA forepaw stimulation, assuming CBF increases are correlated to the applied stimulation current, as suggested by Fig. 2A.
Stimulation of the rat forepaw elicited robust BOLD and CBF responses. However, the second stimulation elicited a smaller response. This decrease in hemodynamic response to the second stimulation could be attributed to the short (60-second) interval between the two stimulation periods. In support of this hypothesis is the observation that when the stimulation was separated by 5 minutes, no signal decrease was observed (data not shown). Furthermore, our data are corroborated by a similar decrease in the BOLD response to the second stimulation reported by Hsu et al., (1998). Their stimulation paradigm consisted of two consecutive 2-minute stimulations separated by a 2-minute resting period. Using TE = 10 milliseconds at 7.1 T, the authors observed 3.7 ± 0.5% BOLD increases during the first stimulation compared with 2.3 ± 0.3% increases during the second stimulation (Hsu et al., 1998). Therefore, since the correlation between CBF and BOLD was the major objective of the current study, both the first and the second stimulation periods were used in the temporal correlation analysis.
By choosing a small ROI centered on the center of the BOLD and CBF active maps, we observed excellent temporal correlation between the relative BOLD changes and the corresponding CBF changes during single somatosensory stimulation. This finding suggests that in the model studied and under the current experimental parameters, BOLD changes follow the CBF changes. In previous publications, BOLD and CBF relative changes were not found to be correlated across human subjects (Kim et al., 1997a, b , c ). This apparent discrepancy may result from several factors. In this study, we used a single strain of animals of the same sex, race, and age. Therefore, anatomical and physiologic parameters are expected to be similar across different animals. In the human studies, however, a larger diversity of anatomical and physiologic differences is expected, including vessel architecture, venous oxygenation level, and oxygen consumption. In addition, the interpretation of cognitive tasks by individual subjects may vary, generating intersubject variations in the data (Frahm et al., 1994). Furthermore, the data presented here scaled over a much larger range in relative BOLD and CBF changes than the human data, making it easier to establish a correlation between BOLD and CBF in this case compared with the human case. Moreover, at high magnetic field strengths such as 9.4 T, the BOLD is expected to have a decreased contribution from large venous vessels (Ogawa et al., 1993a), therefore diminishing the macrovascular contribution to the BOLD signal.
In conclusion, we measured simultaneously BOLD and CBF changes produced in somatosensory cortex during forepaw stimulation in rat. Under well-controlled physiologic conditions, the magnitude of BOLD changes correlated well with CBF changes over a large range of CBF. Furthermore, at 470 × 470 µm spatial resolution, there was no significant difference in the center of activation in the BOLD and the CBF functional maps. The data suggest that in this model of activation and under the experimental conditions of the current study, BOLD changes reflect the changes in CBF.
Footnotes
Acknowledgments
The authors thank Dr. Hellmut Merkle for hardware support, and Miss Lynnell Fritsma and Mr. Joseph Sikora for animal technical assistance.