
Abstract
The close correspondence between neural activity in the brain and cerebral blood flow (CBF) forms the basis for modern functional neuroimaging methods. Yet, the temporal characteristics of hemodynamic changes induced by neuronal activity are not well understood. Recent optical imaging observations of the time course of deoxyhemoglobin (HbR) and oxyhemoglobin have suggested that increases in oxygen consumption after neuronal activation occur earlier and are more spatially localized than the delayed and more diffuse CBF response. Deoxyhemoglobin can be detected by blood oxygenation level-dependent (BOLD) functional magnetic resonance imaging (fMRI). In the present study, the temporal characteristics of CBF and BOLD changes elicited by somatosensory stimulation in rat were investigated by high-field (9.4 T) MRI. With use of high-temporal-resolution fMRI, it was found that the onset time of the CBF response in the somatosensory cortex was 0.6 ± 0.4 seconds (n = 10). The CBF changes occurred significantly earlier than changes in HbR concentration, which responded after 1.1 ± 0.3 seconds. Furthermore, no early increases in HbR (early negative BOLD signal changes) were observed. These findings argue against the occurrence of an early loss of hemoglobin oxygenation that precedes the rise in CBF and suggest that CBF and oxygen consumption increases may be dynamically coupled in this animal model of neural activation.
Keywords
The tight coupling between neural activity and cerebral blood flow (CBF) (Roy and Sherrington, 1890) forms the basis for modern functional neuroimaging methods (Raichle, 1998). However, despite widespread use of hemodynamic changes as a surrogate for neuronal activity, the temporal relationship between neural activity, tissue oxygenation, and CBF is not well understood (Iadecola, 1993).
Recent optical imaging observations of the time course of deoxyhemoglobin (HbR) and oxyhemoglobin (HbO2) changes during visual stimulation in the cat striate cortex have provided evidence of a biphasic behavior of blood oxygenation: an early (<3-second) increase in HbR after the onset of neuronal activation, followed by a decrease in HbR and a more widespread increase in HbO2 (Malonek and Grinvald, 1996; Malonek et al., 1997). Similar findings were also observed in rat somatosensory cortex (Nemoto et al., 1999). The initial increase in HbR was interpreted to indicate that the increases in oxygen consumption after neuronal activation occur earlier and are more spatially localized than the delayed CBF response (Malonek and Grinvald, 1996). The early decrease in blood oxygenation after activation raises the possibility that tissue hypoxia may trigger the increase in CBF. Changes in HbR can be detected by functional magnetic resonance imaging (fMRI) based on the blood oxygenation level-dependent (BOLD) contrast. The implication of these results for fMRI may be that studies based on the early negative BOLD response (due to the early increase in HbR) may have better spatial resolution than CBF-based methods or studies based on the positive BOLD signal (Malonek et al., 1997).
In the present study, we investigated the temporal characteristics of the relative CBF and BOLD changes occurring during somatosensory activation in rat to determine the presence or absence of the early negative BOLD response in this model of brain activation. Electrical stimulation of the rat forepaw elicits robust increases in CBF in somatosensory cortex, which are associated with corresponding increases in local glucose and oxygen utilization (Ueki et al., 1988; Narayan et al., 1995). The large increases in cerebral metabolic rate of O2 (CMRO2) previously reported in this model of activation (Hyder et al., 1996, 1997), together with the late CBF response observed in optical imaging studies, suggest that large initial negative BOLD signal changes should be observed at high magnetic field strengths. Blood oxygenation level-dependent and CBF images of the rat somatosensory cortex were acquired with a temporal resolution of 108 milliseconds at 9.4 T. Our results show that CBF increases earlier than BOLD in response to activation, and we found no evidence for the initial dip in the BOLD signal either in the superficial or in the deep layers of the somatosensory cortex. The data argue against the hypothesis that an early increase in oxygen consumption precedes the increase in CBF and suggest that CBF and CMRO2 changes are dynamically coupled.
MATERIALS AND METHODS
Animal preparation
The MR studies were conducted in 10 male Sprague-Dawley rats weighing 263 ± 26 g. Surgical procedures were performed under halothane anesthesia (5% induction, 1.5% maintenance). The rats were orally intubated, and catheters were inserted in the left femoral artery and vein. After surgery, the rats were placed in a home-built headholder, and a 1.6-cm-diameter surface coil was positioned on top of the head over bregma and secured to the headholder. The animals were then placed in a semicylindrical cradle that contained a small 0.5-cm-diameter butterfly labeling coil used for the continuous arterial spin-labeling experiments (Silva et al., 1995). Care was taken to position the neck of the animal over the labeling coil. The typical separation between the center of the two coils was 2 cm. Rectal temperature was maintained close to 37°C by means of a heated water blanket. Halothane was discontinued, and anesthesia was switched to α-chloralose (80 mg/kg initially, followed by 40 mg/kg every 90 minutes). Arterial blood pressure was recorded throughout the experiments. Blood gases were adjusted and monitored throughout the experiments. Arterial blood pH was 7.34 ± 0.08, Paco2 was 37.0 ± 3.9 mm Hg, and Pao2 was 170 ± 53 mm Hg.
MRI methods: pseudocontinuous arterial spin labeling
All images were acquired using a 9.4 T/31-cm horizontal magnet (Magnex, Abingdon, U.K.) interfaced to a Unity INOVA console (Varian, CA, U.S.A.). For fMRI studies, the imaging slice over the somatosensory cortex, ~0 to 1 mm rostral to bregma, was chosen. Single average, single shot, gradient echo, echo planar imaging was performed using an in-plane resolution of 470 × 470 μm2, slice thickness of 2 mm, and echo time of 10 milliseconds, for a total imaging time of 30 milliseconds.
To obtain BOLD and CBF images with a sufficiently high temporal resolution, we devised a pseudocontinuous version of the arterial spin-labeling technique (Silva and Kim, 1999). Two experiments were necessary: a set of images acquired with arterial spin labeling and a set of control images. The BOLD contrast was obtained from the control images. The CBF images were obtained from the pairwise subtraction of the labeled and control images (Silva and Kim, 1999). In this approach, a short arterial spin-labeling radiofrequency pulse of 78 milliseconds was used in front of each echo planar image. Therefore, BOLD and CBF-weighted images were acquired every 108 milliseconds (78-millisecond labeling + 30-millisecond echo planar imaging).
Forepaw stimulation
Two needle electrodes were inserted under the skin of either the right or the left forepaw (in the space between digits 2 and 3 and between digits 4 and 5). Stimulation parameters were as follows: current intensity 1.5 mA, frequency 3 Hz, and pulse duration 0.3 milliseconds. These parameters were determined in previous experiments to produce the greatest CBF increases without inducing arterial blood pressure changes (Silva et al., 1999). Stimulations were time-gated to the image acquisition. First, 250 baseline images (27 seconds) were acquired in the resting state. Then, 200 images (21.6 seconds) were acquired during forepaw stimulation. Finally, 450 images (48.6 seconds) were acquired without stimulation. Consecutive stimulation epochs were separated by a resting period of at least 5 minutes.
MRI data analysis
The BOLD and CBF images were processed using a boxcar cross-correlation method (Bandettini et al., 1993). Activation maps were generated by thresholding to a minimum cross-correlation value of 0.3. The minimum cluster size for an active region was 4 pixels (Forman et al., 1995). As multiple comparisons were performed on 2,04,8 image pixels, a modified Bonferroni correction was used with the number of images set to 900, cluster size set to 4, and cross-correlation value of 0.3, as described previously (Xiong et al., 1995). The effective P value was <1.0 × 10⁻¹².
To compare the relative changes of BOLD and CBF, region-of-interest (ROI) analysis was performed, using two different ROIs. The first ROI included only the active pixels located along the surface of the cortex. The second ROI was constituted by pixels located below the superficial layer of active pixels. Typically, 9 pixels in the contralateral somatosensory area were chosen for each ROI, based on the activation maps. For each rat, the same ROIs were used to obtain the BOLD and the CBF time courses and their relative changes as a percentage of the baseline values. A temporal deconvolution of the CBF time courses was performed to account for the fact that instantaneous changes in CBF cause slow variations in the MRI signal (Silva and Kim, 1999). Thus, the deconvolved CBF time courses were used in the temporal analysis, together with the BOLD time courses.
For each animal, the BOLD and the deconvolved CBF time courses were analyzed using a polynomial fit. The time origin was set to the onset of stimulation. The fit was constrained from 1 second before to 20 seconds after the onset of stimulation. The BOLD and CBF time courses were individually fitted, and the response times were recorded. The onset time was defined as the latency from the stimulus onset to the first data point above 1 SD of the baseline value. We also recorded time-to-peak latencies.
Data in text and figures are presented as mean ± SD. Student's t-tests were performed to compare differences in the BOLD and CBF response times. Unless otherwise indicated, differences were considered statistically significant for P values of <0.05.
RESULTS
Figure 1 shows typical BOLD and CBF maps resulting from stimulation of the left forepaw. In Fig. 1A and 1B, the BOLD and the CBF activation maps are overlaid onto the anatomical echo planar images. Activation is confined to a well-defined region of the contralateral somatosensory cortex. In Fig. 1A, the colored bar on the right shows the scale of the cross-correlation values for each pixel in the active regions, representing a measure of how accurately the dynamics of the BOLD and CBF changes at each pixel follow the time course of the stimulation. The pixels with the highest cross-correlation values are located in the deeper layers of the somatosensory cortex. In Fig. 1B, the colored bars show the intensity of the relative BOLD and CBF changes, expressed as a percentage of the prestimulus baseline level. Figure 1B clearly shows that the largest BOLD signal changes occur at the cortical surface, whereas the largest CBF changes are located in the deeper layers. This discrepancy can be better observed in Fig. 1C, which shows the CBF activation map (in red) overlaid on the BOLD activation map (in yellow). There were no significant CBF changes detected in the pixels that showed the highest BOLD signal changes.
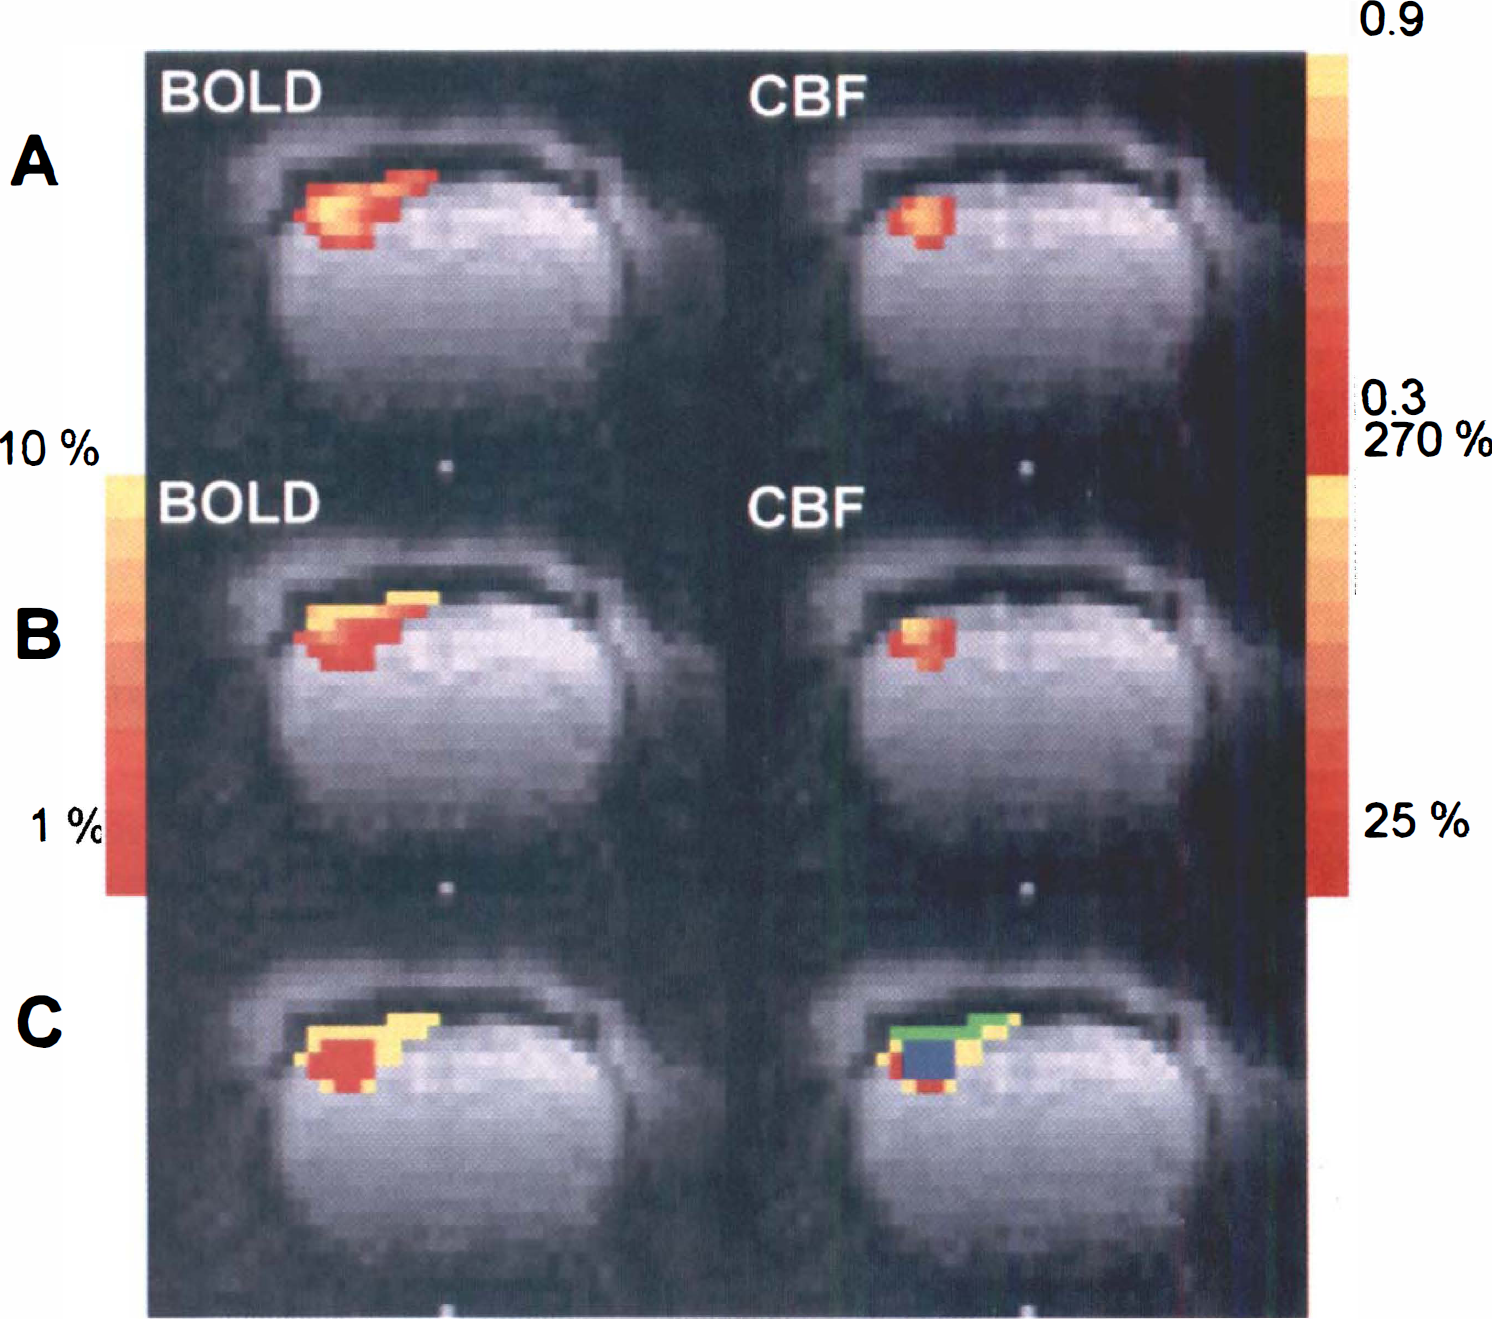
Functional MRI of a representative animal.
Because of the difference in the spatial localization of the BOLD and CBF changes, the temporal analysis was performed using two different ROIs. One ROI (surface ROI), shown in green in Fig. 1C, included only the pixels on the cortical surface. The other ROI (deep ROI), shown in blue in Fig. 1C, contained only pixels located below the superficial layer of active pixels. For consistency of analysis, both ROIs contained the same number of pixels. Figure 2A shows the averaged MRI time courses obtained in the deep region of the somatosensory cortex from all the animals used in this study. The CBF and BOLD values started to change shortly after stimulation started, but there was no evidence of an early negative BOLD response. Clearly, the BOLD response was delayed with respect to the CBF signal. The peak CBF increases in the contralateral somatosensory cortex amounted to 87.2 ± 63.6%, whereas the corresponding BOLD signal changed by 3.9 ± 1.7%. Shortly after the end of stimulation, BOLD and CBF values returned to baseline. The inset in Fig. 2A shows the BOLD response obtained from the surface region. Despite stronger signal changes, the time course of the superficial BOLD signal was similar to that in the deep cortex. Figure 2B shows the initial 2 seconds after the onset of stimulation. Clearly, CBF responds faster than BOLD, both in the deep as well as in the superficial regions of the cortex. Furthermore, the CBF response in the deep layers of the cortex occurs earlier than at the cortical surface.
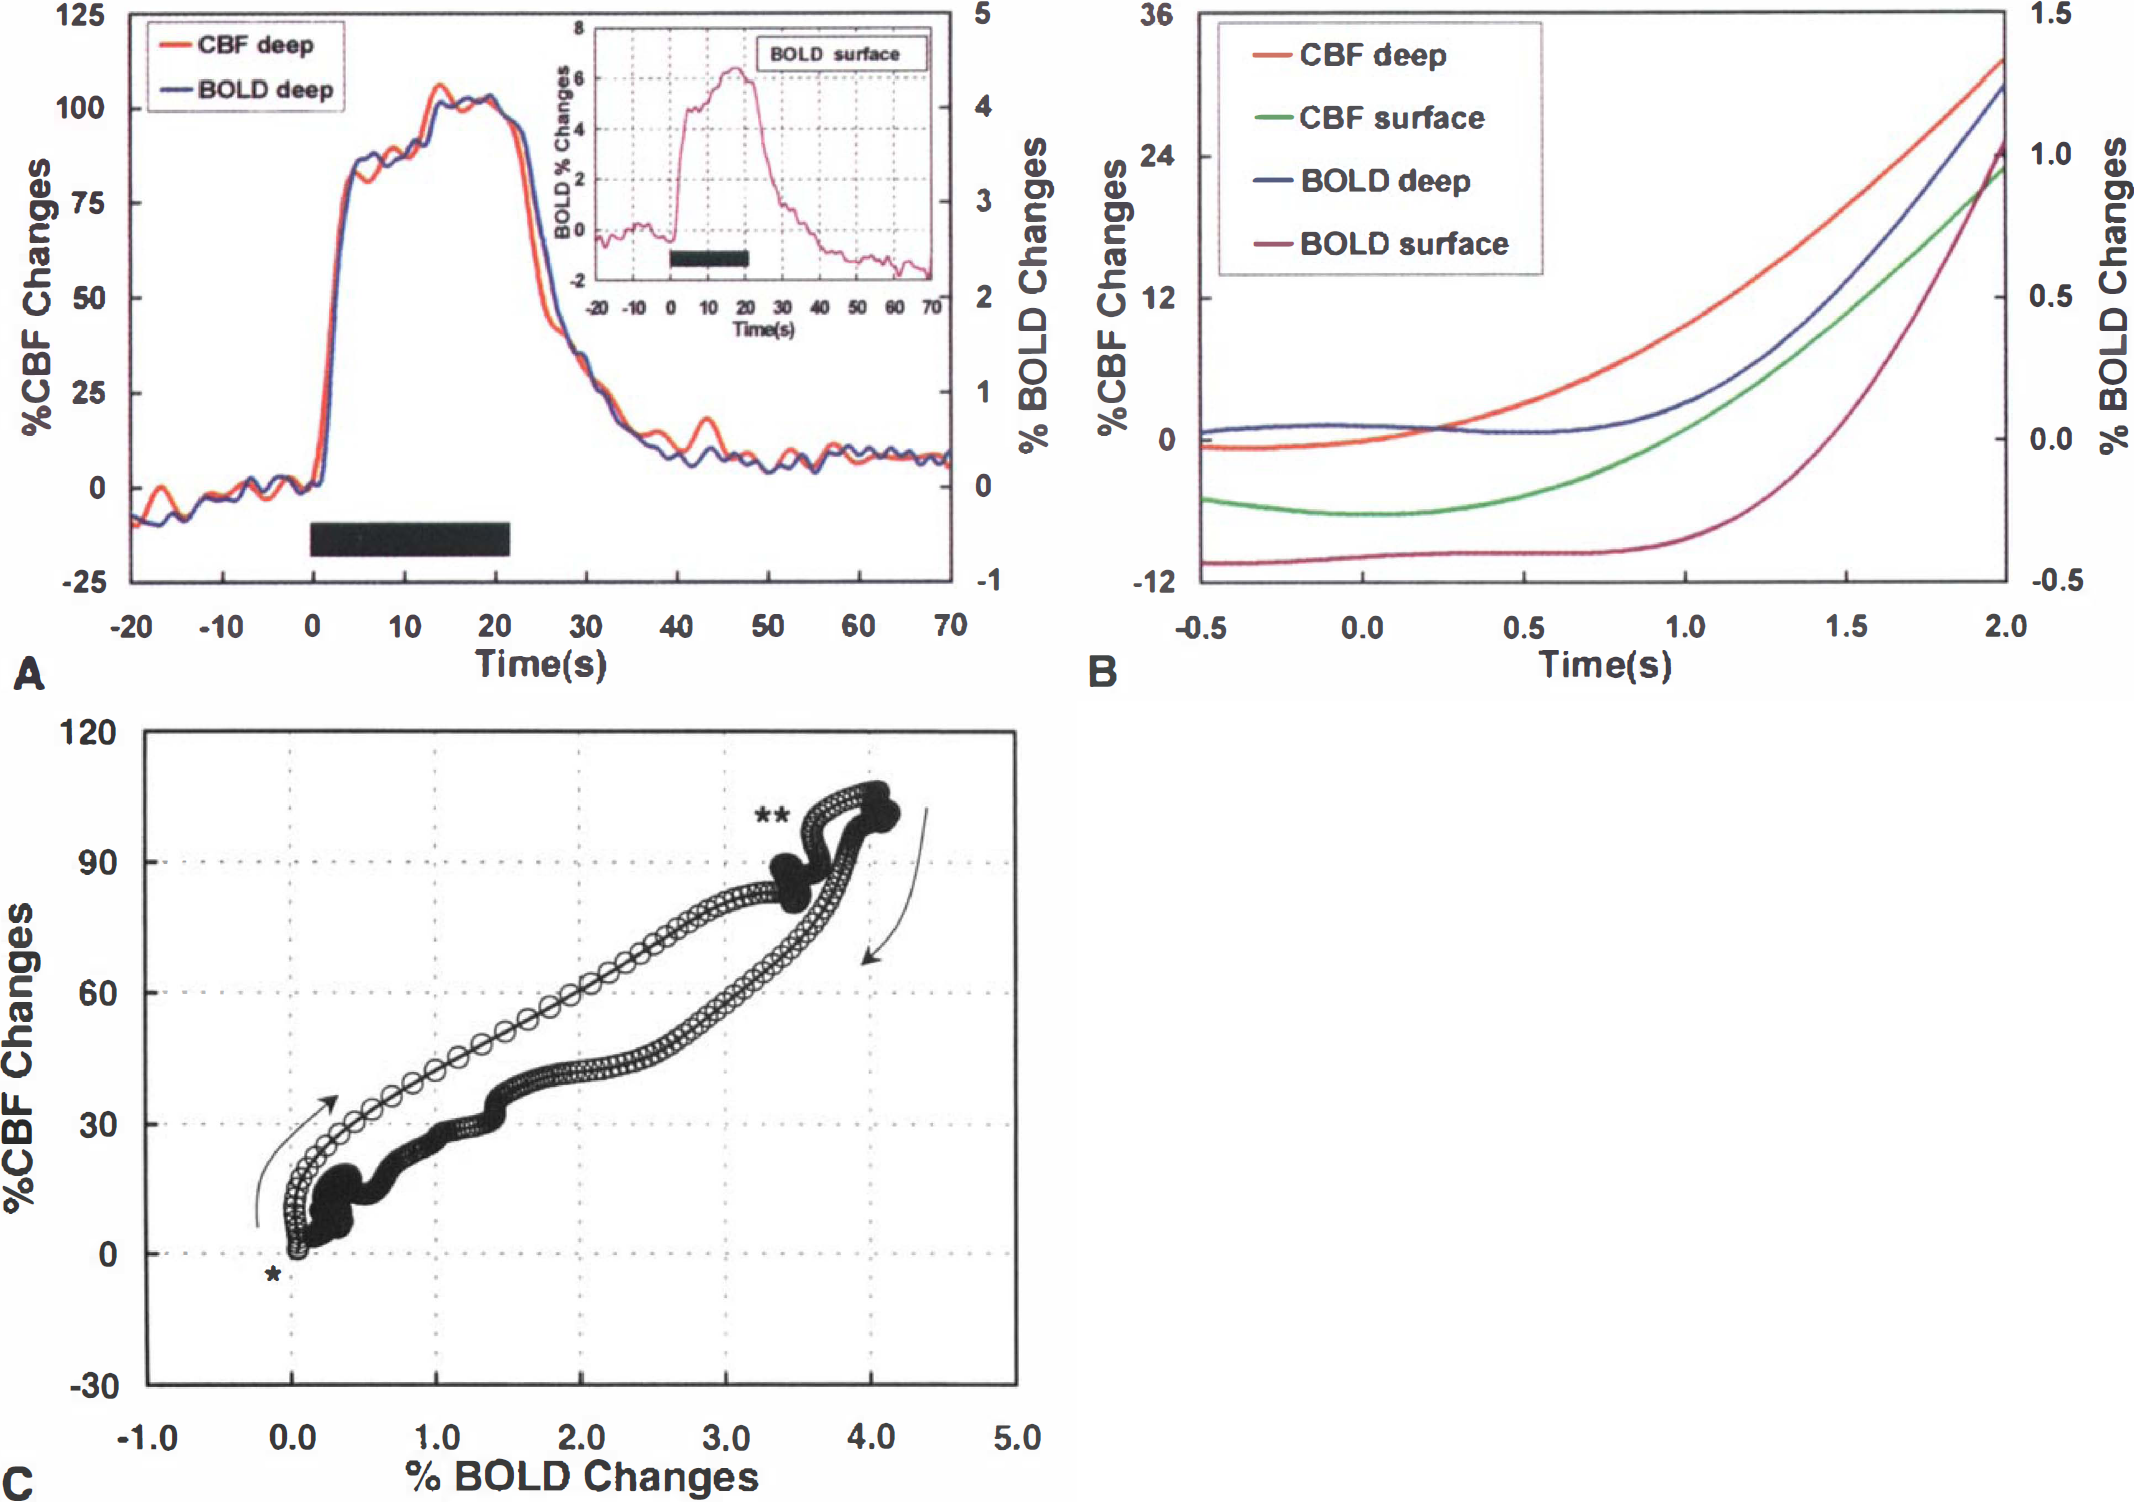
To understand better the temporal profile of BOLD and CBF during forepaw stimulation, a phase plot of the CBF changes as a function of the BOLD signal changes was obtained from the deep cortical layers (Fig. 2C). In this plot, simultaneous variations appear as a straight line and delayed changes as a curved line. The onset of stimulation (marked by an asterisk) shows the CBF increasing earlier than BOLD (arrow pointing up). No negative trends could be detected in the early phase of the BOLD response. After the initial delay in the BOLD response, BOLD and CBF increased simultaneously (straight line in the phase plot), with CBF peaking before BOLD (double asterisks in Fig. 2C). After stimulation ended, CBF started to decrease before BOLD (as indicated by the curved arrow pointing down). However, CBF later changed its curvature so that BOLD and CBF returned to baseline together.
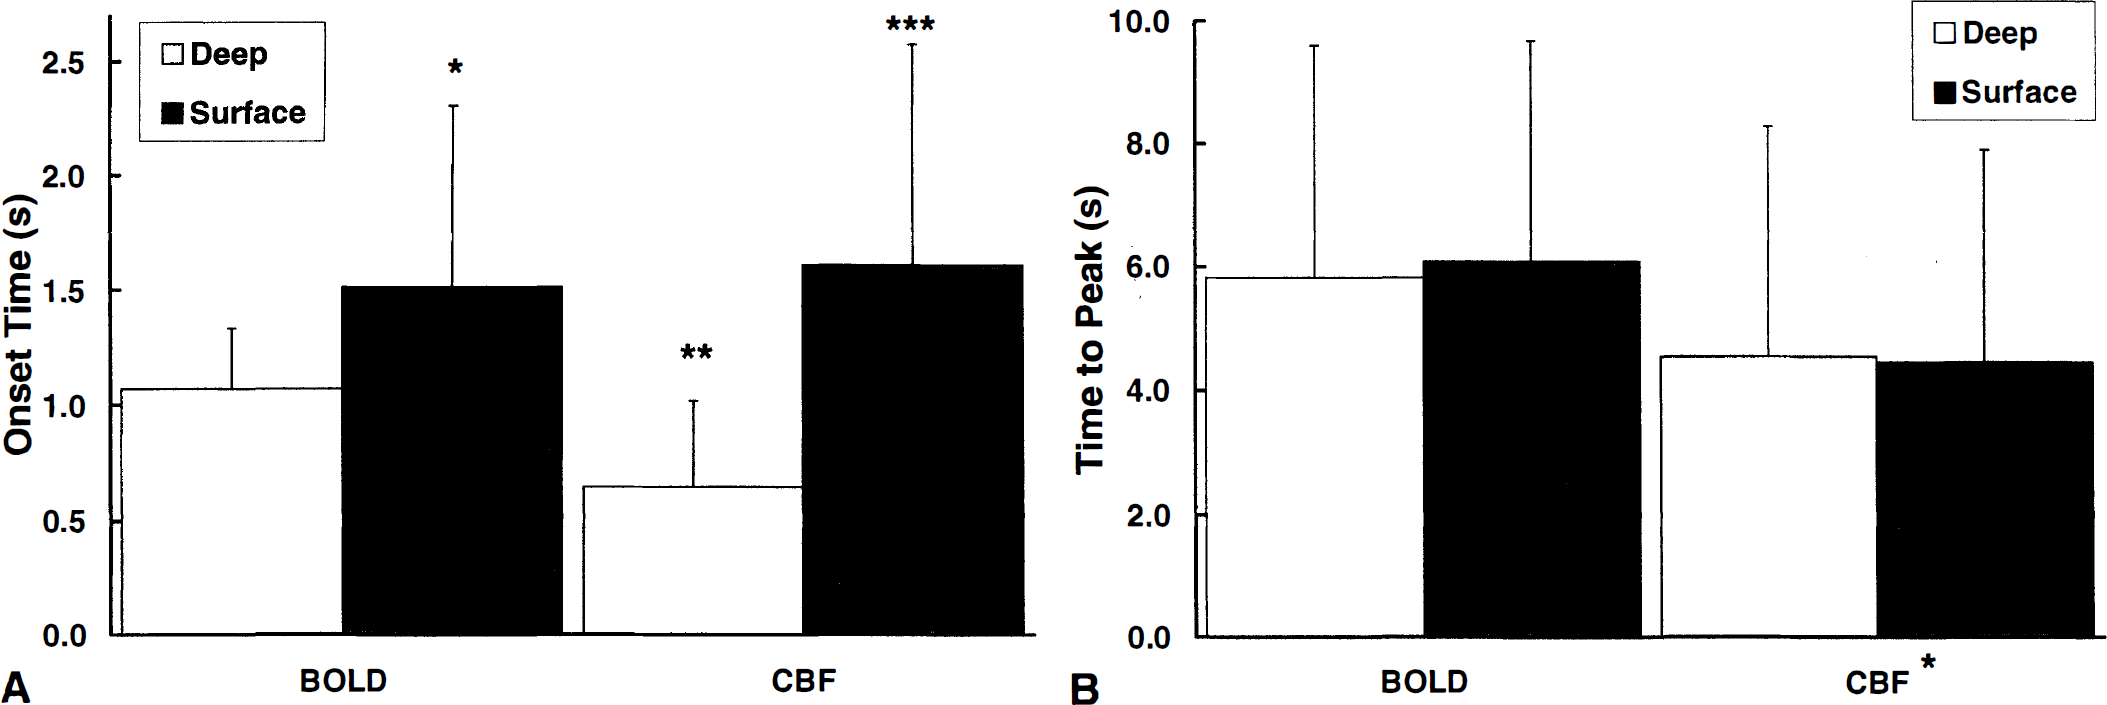
Figure 3 shows the onset time and time to peak of BOLD and CBF values in the superficial and deep regions of the somatosensory cortex after the onset of stimulation. The CBF changes in the deep layers of the somatosensory cortex occurred earlier than the corresponding BOLD changes (P < 0.003). However, in the superficial layers, the onset of the CBF response was delayed, and it was similar to the latency of the superficial BOLD signal changes. The CBF peak response occurred faster than the BOLD response in both regions (P < 0.001).
DISCUSSION
We have studied BOLD and CBF responses to somatosensory stimulation with high temporal resolution, using a novel arterial spin-labeling MRI method (Silva and Kim, 1999). In all rats, no early negative BOLD signal changes were observed after the onset of activation, either in the superficial or in the deep regions of the cortex. Furthermore, in both regions, the CBF response occurred earlier than the BOLD response.
To date, high-temporal-resolution hemodynamic responses have been measured by laser—Doppler flowmetry and optical imaging (Dirnagl et al., 1989; Iadecola, 1993; Malonek and Grinvald, 1996; Malonek et al., 1997). Unfortunately, both techniques are more sensitive to events occurring in the superficial layers of the cortex and are invasive, requiring exposure of the cortex. Our MRI technique is noninvasive and provides sufficient spatial resolution to differentiate between responses in deep and superficial cortical layers. The onset time of the CBF response measured in this study at the surface of the cortex is consistent with those measured in previous laser—Doppler flowmetry and optical imaging studies (Malonek et al., 1997; Detre et al., 1998). The more rapid onset time of the CBF response in the deep tissue is also consistent with data obtained by the hydrogen clearance technique (Moskalenko et al., 1996). The observed onset time of the CBF response at the surface of the cortex was significantly longer than at the inner layers of the cortex. This is consistent with the hypothesis that the changes in CBF start at the site of neural activity and propagate backward toward the feeding arterioles and arteries (Iadecola, 1993).
We did not observe an early decrease in the BOLD signal after onset of stimulation. To investigate whether the initial BOLD dip is more short-lived in this animal model than the BOLD dip observed in the human visual cortex (2 to 3 seconds), we performed BOLD experiments using only a temporal resolution of 50 milliseconds (data not shown). We were likewise unable to detect any early negative BOLD signal changes during forepaw stimulation in rats at 9.4 T. In agreement with our findings, other investigators did not observe the early negative BOLD response during forepaw stimulation in rats at 2 or 4.7 T (Marota et al., 1999) or during visual stimulation in cats (Jezzard et al., 1997).
It was suggested that the early BOLD response could be explained by a slower CBF response following an early CMRO2 increase (Malonek and Grinvald, 1996; Malonek et al., 1997). This late CBF response would give rise to the metabolic negative BOLD effect (Janz et al., 1997). An early CMRO2 increase without a simultaneous CBF increase would increase HbR in capillaries and later in draining veins, inducing a decrease in BOLD. Assuming that the late CBF response is a plausible explanation for the initial BOLD dip, we were to expect a large initial negative BOLD response in this animal model of stimulation, because recent reports indicated that CMRO2 increases between 200 and 400% during forepaw stimulation in rats (Hyder et al., 1996, 1997). For example, assuming that CMRO2 increased initially to half the peak value of the later CBF increase (i.e., by ~44%), we would expect an initial BOLD signal change of about −5% (Ogawa et al., 1993; Weisskoff et al., 1994); that is, the initial BOLD dip would be larger in amplitude than the positive BOLD signal changes observed in this study. However, we did not observe any signs of an initial BOLD dip in the predominantly microvascular deeper layers of the somatosensory cortex. Furthermore, despite the late CBF response observed in the superficial cortex, no initial negative BOLD response was detected. This implies that the initial BOLD dip is not related to the late CBF response mechanism. Thus, our results suggest that CBF changes may be dynamically coupled to CMRO2 changes; that is, CBF and CMRO2 variations happen nearly simultaneously.
Our results obtained from the rat somatosensory cortex contrast with those of fMRI experiments in the human visual cortex (Ernst and Hennig, 1994; Menon et al., 1995; Hennig et al., 1995; Hu et al., 1997; Janz et al., 1997). This discrepancy may be due to a number of factors including different species, vessel architectures, venous oxygenation level, and oxygen consumption, namely, different anatomical and physiological parameters that could affect the BOLD signal changes elicited by neuronal stimulation in each species. Furthermore, to our knowledge, the initial BOLD dip was observed only during activation of the visual cortex. In fact, we have recently observed the initial negative BOLD signal during stimulation of the cat visual cortex (D.-S. Kim, T. Q. Duong, and S.-G. Kim, unpublished data). Therefore, it is possible that the early negative BOLD signal changes are specific to this brain region.
In summary, we devised a technique that allows the simultaneous measurement of CBF and BOLD relative changes to a brain functional paradigm with high temporal resolution. We used this technique to characterize the temporal response of CBF and BOLD to somatosensory stimulation in rat. We determined that CBF increases earlier than BOLD during neural activation. We were unable to detect the presence of an early negative BOLD response after the onset of stimulation. The data do not support the hypothesis that a loss of hemoglobin oxygenation precedes the CBF increase and suggest that the CBF response may be dynamically coupled to CMRO2 changes.
Footnotes
Acknowledgment
The authors thank Dr. Kâmil Ugurbil for stimulating discussions during the preparation of this manuscript.