In Vivo Determination of Absolute Cerebral Blood Volume Using Hemoglobin as a Natural Contrast Agent: An MRI Study Using Altered Arterial Carbon Dioxide Tension
Free accessResearch articleFirst published online July, 1999
In Vivo Determination of Absolute Cerebral Blood Volume Using Hemoglobin as a Natural Contrast Agent: An MRI Study Using Altered Arterial Carbon Dioxide Tension
The ability of the magnetic resonance imaging transverse relaxation time, R2 = 1/T2, to quantify cerebral blood volume (CBV) without the need for an exogenous contrast agent was studied in cats (n = 7) under pentobarbital anesthesia. This approach is possible because R2 is directly affected by changes in CBF, CBV, CMRO2, and hematocrit (Hct), a phenomena better known as the blood-oxygenation-level-dependent (BOLD) effect. Changes in CBF and CBV were accomplished by altering the carbon dioxide pressure, Paco2, over a range from 20 to 140 mm Hg. For each Paco2 value, R2 in gray and white matter were determined using MRI, and the whole-brain oxygen extraction ratio was obtained from arteriovenous differences (sagittal sinus catheter). Assuming a constant CMRO2, the microvascular CBV was obtained from an exact fit to the BOLD theory for the spin-echo effect. The resulting CBV values at normal Paco2 and normalized to a common total hemoglobin concentration of 6.88 mmol/L were 42 ±18 μL/g (n = 7) and 29 ±19 μL/g (n = 5) for gray and white matter, respectively, in good agreement with the range of literature values published using independent methodologies. The present study confirms the validity of the spin-echo BOLD theory and, in addition, shows that blood volume can be quantified from the magnetic resonance imaging spin relaxation rate R2 using a regulated carbon dioxide experiment.
Recent advances in functional magnetic resonance imaging (MRI) have allowed the design of MRI techniques for quantitative determination of hemodynamic parameters. Approaches to quantify cerebral blood volume (CBV) generally involve injection of a paramagnetic contrast agent (Belliveau et al., 1990), whereas CBF quantification has used either contrast agents (Hamberg et al., 1993; Kucharczyk et al., 1993; Guckel et al, 1994) or frequency labeling of arterial water nuclei (Detre et al., 1992; Williams et al., 1992; Kim, 1995). Analogous to radioactive tracer methods, these new MRI techniques require either the assumption or measurement of an arterial input function. Eliminating the need for such a function using a natural contrast agent studied under equilibrium conditions would be beneficial. Magnetic resonance imaging has the capability of doing this through the so-called blood-oxygenation-level-dependent (BOLD) effect (Ogawa et al., 1990, 1992, 1993a, 1993b; Moonen et al., 1990; Prielmeyer et al., 1994; Haacke et al., 1995; Bandettini and Wong, 1995; Boxerman et al., 1995; van Zijl et al., 1998), which measures changes in the average magnetic property of hemoglobin in the MRI volume element (voxel) caused by differential binding of oxygen and alterations in CBF, CBV, and CMRO2.
Recently, a theory was derived that quantitatively interrelates these three quantities, the hematocrit fraction (Hct), and the arterial oxygen saturation fraction (Ya) to the measured relaxation rate R2 in the MRI voxel (van Zijl et al., 1998). This allows design of specific physiologic experiments to study any of the above five parameters. We recently showed (van Zijl et al., 1998) that absolute CBV values for gray and white matter could be obtained using the physiologic perturbation of hypoxic hypoxia. In the present paper we determine absolute CBV in the cat brain using changes in Paco2, which is a major physiologic regulator of CBF and CBV. Both hypoxic hypoxia and changes in CO2 can be applied over a range of partial pressures at which CMRO2 remains constant. However, contrary to mild hypoxic hypoxia, in which oxygen delivery remains constant (Ulatowski et al., 1998) alterations in Paco2 lead to changes in oxygen delivery irrespective of CMRO2. As CBF changes, the oxygen extraction ratio (OER) changes, causing concomitant variation in the voxel fractions of deoxygenated hemoglobin in capillary and venous compartments. We show here that this phenomenon can be exploited as a simple means to quantify absolute CBV in vivo through measurement of the local relaxation rate R2 as a function of the whole-brain OER at different Paco2 levels.
MATERIALS AND METHODS
Theory
Spin-echo versus gradient-echo MRI. It is well known that the BOLD effect measured using so-called gradient-echo R*2 based MRI sequences is a factor of about three larger than the spin-echo (SE) R2-based methods and, consequently, the gradient-echo approaches are generally used for functional MRI studies. The reason is that R*2 is sensitive to both intravascular and extravascular susceptibility differences (Boxerman et al., 1995), whereas R2 is mainly sensitive to intravascular susceptibility effects. It is generally accepted that the incremental effect (2/3 of R*2) is caused by water protons diffusing through local field gradients inside and outside the vessels, while it was recently demonstrated that the intravascular R2 contribution can be satisfactorily explained by protons exchanging rapidly between erythrocytes and plasma, which have different susceptibilities (van Zijl et al., 1998). This latter interpretation is in agreement with whole-blood data, in which it has also been shown that the exchange effect dominates and that the effect of diffusion through local field gradients is negligible for SE sequences at the field strengths used (Bryant et al., 1990). Because R*2 cannot be quantitatively interpreted yet and is prone to spatial variation because of the effect of magnetic field inhomogeneities and local susceptibilities (e.g., at tissue interfaces), we confine our measurements to R2, for which we recently derived a quantitative theory (see below). We stress that the definition of a “true R2” as measured by either a multi-echo (Carr-Purcell-Meiboom-Gill) or a single-echo (Hahn-echo) sequence is very different, and we refer the reader to the detailed discussion about this in recent papers (van Zijl et al., 1998; Grohn et al., 1998). To obtain the maximal SE BOLD effects (Thulborn et al., 1982; Bryant et al., 1990; van Zijl et al., 1998), we collected MRI data for absolute R2 maps by combining Hahn SE data obtained at multiple echo times (TE). In addition we point out that the potential contribution of diffusion through field gradients to R2 as measured by SE sequences is an incoherent effect that cannot be directly equated to R*2, which in addition includes the contributions of coherent dephasing owing to the presence of local field inhomogeneities and susceptibility differences.
Physiologic basis of R2. The quantitative interpretation of the SE BOLD effect in terms of the physiologic parameters has recently been published in detail (van Zijl et al., 1998; Gröhn et al., 1998), and we will only summarize the essential equations necessary to perform the calculations. The deoxygenated fraction of hemoglobin (xdeoxy) that causes the paramagnetic effects measured by the BOLD phenomena depends on the Ya and the balance between oxygen consumption and delivery in the capillaries. For an individual microvessel i, this is given by
in which
The constant mi equals 0 and 1 for arteriolar (i = a) and venular (i = v) blood, respectively, and, assuming a symmetric deoxygenation process (van Zijl et al., 1998), m1 equals 0.5 for the capillaries (i = c). The total hemoglobin concentration, [Hbtot1, is directly related to the hematocrit fraction via
in which the factor 3.0 was determined for cats (Ulatowski et al., 1996), and 0.016125 and 0.85 are the micromolar mass of one hemoglobin unit and the small-vessel to large-vessel hematocrit ratio, respectively. For simplicity we here follow the positron emission tomography literature (Leenders et al., 1990) in using equal hematocrit in all microvessels. These equations indicate that any increase in OER, such as occurring upon reducing Paco2, will cause an increase in deoxyhemoglobin concentration, which will lead to a concomitant increase in R2.
The subscripts deoxy, oxy, and dia relate to deoxygenated and oxygenated hemoglobin and the remaining diamagnetic sites inside the erythrocytes, respectively, and it is assumed that the constants for plasma are the same inside and outside the erythrocytes. The constants in equations 5 through 7 were recently determined (van Zijl et al., 1998) using shifts reported for hemoglobin solutions (Fabry and San George, 1983) and relaxation measurements on whole blood at 4.3 and 4.7 T (Thulborn et al., 1982; Gilles et al., 1995; Meyer et al., 1995). The coefficients are as follows: ωdia = 0.0304 ppm, ωoxy = −0.0538 ppm, ωdeoxy = −0.2708 ppm, R2,plas = 4.6 S−1,R2,dia + R2,oxy = 9.3 s−1, and R2,deoxy – R2,oxy = 42 s−1. Finally, the time τCpMG is the echo spacing in a multiecho (Carr-Purcell-Meiboom-Gill = CPMG) experiment, and therefore equals TE for the single echo (also called Hahn echo) used in our experiments here. It follows directly from equation 5 that the BOLD effect is largest for long τCPMG and we therefore used a single SE. Actually, at very short interecho spacings in a multiecho sequence, the BOLD effect becomes almost negligible. The lifetime between exchanges, τi = (1 – Hctcti) τrey is determined by the measured hemoglobin level (equation 4) and the well-known lifetime of water inside human erythrocytes τery = 12 ±2 ms (Herbst and Goldstein, 1989). This lifetime has been found to be of the same magnitude for humans, cows, sheep, and dogs (Benga, 1994; Vieira et al., 1970), and we therefore assumed that value in cats.
To calculate R2 in the tissue, the blood volume and tissue volume have to be accounted for. Our interpretation of the SE methods (van Zijl et al., 1998) assumes that there is no water exchange between the microvessels and tissue on the time scale of the R2 measurement, which is likely for our measurements, because TE is equal to or less than 100 ms, whereas the lifetime of water protons in the capillaries has been shown to be longer than 500 ms (Eichling et al., 1974; Paulson et al., 1977). For this situation of slow exchange inside a voxel containing only blood and tissue, the signal attenuation (S) in a nuclear magnetic resonance measurement with variable echo time TE is given by
in which R2,PP is the apparent relaxation time. The tissue and blood fractions are related through
Equation 9 indicates that the blood fraction is the total microvascular blood volume ( in μL/g) at normocapnia divided by the total water content,Vd which is 820 μL/g and 720 μL/g for gray and white matter, respectively. Similar to our previous study (van Zijl et al., 1998), we used an arteriole to capillary to venule volume ratio of 0.21:0.33:0.46 as deduced for animals (Sharan et al., 1989). Finally, for flows less than 1.2 mL·g−1·min−1, flow and volume changes are related through (van Zijl et al., 1998)
This equation, which includes equivalent dilation in all microvessels on increasing carbon dioxide levels fits well with experimental data on the relationship between flow and volume (van Zijl et al., 1998; Grubb et al., 1973).
Hypercapnia and hypocapnia. From the specific characteristics of our experiments in which the Paco2 is changed, and the use of two plausible assumptions, the above expressions can be simplified to retain only two unknowns. First, arterial hemoglobin oxygen saturation is kept unchanged in our experiments by using full oxygenation (Ya = 1), and the expressions for the deoxygenated hemoglobin fractions in the microvasculature are simplified to xdeoxy,a = 0, xdeoxy,c = 0.5 × OER and xdeoxy,v = OER. Second, we assume that the hematocrit remains constant during hypercapnia. Finally, it is assumed that oxygen consumption remains unchanged during this paradigm, which has been experimentally verified by several groups to be a correct assumption within a few percent (Rhodes et al., 1981; Barzilay et al., 1985; Sieber et al., 1993). As a consequence, the change in OER is solely caused by the blood flow changes as a function of Paco2, and at constant hematocrit, equation 10 can be rewritten to
Thus, because we measure total hemoglobin and determine OER experimentally using the right side of equation 2, the only unknowns left when plotting the measured R2,app as a function of OER are the blood volume at normocapnia (Paco2 = 35 mm Hg) and the tissue relaxation rate, R2,tissue' which can be determined from the curve using a two-parameter fit.
It should be pointed out that some of the equations may no longer apply for certain disease conditions. This is for instance so for the CBV-CBF relationship under conditions of arterial occlusion (Grohn et al., 1998). However, blood relaxation parameters such as the susceptibilities, relaxation rates, and lifetimes should remain reliable, because they are inherent to the blood. Thus only certain blood diseases may change them, especially diseases related to erythrocyte membrane permeability (Mathai et al., 1996).
Animal preparation
Animal care throughout the experimental procedures was in accordance with institutional guidelines. Mixed-breed male or female cats weighing 2.5 to 3.5 kg were anesthetized with pentobarbital sodium (40 mg/kg intraperitoneally followed by 6 mg·kg−1·h−1 intravenous infusion). Catheters were placed into the femoral artery and vein bilaterally to monitor MABP and blood gases and to administer fluids and drugs, respectively. Animals received lactated Ringer's solution intravenously at a rate of 8 mL·kg−1·h−1 during the surgical preparation and 4 mL·kg−1·h−i thereafter throughout the experimental protocol. Pancuronium bromide (0.1 mg/kg intravenously) was administered for muscle paralysis during electrocauterization and MRI measurements. Animals were ventilated (Harvard Instruments Animal Ventilator, Boston, MA, U.S.A.) through endotracheal intubation and supplemental oxygen was administered to maintain the Pao2 at more than 100 mm Hg. Ventilation rate was adjusted to achieve Paco2 as required. The head was secured in a frame, and the sagittal sinus was cannulated at the level of the coronal suture for sampling cerebral venous blood. Core temperature was maintained with a water-jacketed warming blanket. Blood gases and pH were analyzed with Radiometer ABL-5 equipment (Copenhagen, Denmark). Whole blood [Hbtot] arterial and venous O2 saturation, arterial and sagittal blood content (Cao2 in volume percent) and (Cv02 in volume percent) were determined with a hemoximeter (model OSM3; Radiometer), using the calibration for cat blood. Oxygen extraction ratio was calculated according to equation 2. After each experiment, the anesthetized cats were killed by intravenous injection of 6 mL of saturated KCl.
MRI measurements
A 4.7-T GE CSI (General Electric, Fremont, USA) imager was used for image acquisition and a 4-cm surface coil for signal transmission and reception. The cat head and surface coil were fixed to a custom-built animal holder with adherent tape to avoid motion artifacts. A coronal T2/spin density-weighted image (repetition time [TR], 3,000 ms; TE, 60 ms; field of view, 64 mm; 256 × 128 data matrix, zero-filled to 256 × 256 before Fourier transformation) was acquired at the beginning of the CO2 experimental protocol to use as an anatomic reference. During the experiment coronal Hahn-SE images were acquired using five different TEs (20, 35, 50, 65, and 80 ms); TR, 1,000 ms; four dummy scans; FOV, 64 mm; and matrix size, 128 × 64, zero-filled to 256 × 256. Note that, although this TR seems short, this is not a problem with respect to signal saturation and inflow effects because absolute relaxation times are determined from a fit as a function of TE while the animal is at physiologic equilibrium. Nominal image resolution was 2 × 1 × 1 mm3 (2-mm slice) before zero-filling to 256 × 256.
Experimental protocol
After collecting the anatomic reference MR image at normal Paco2, cats were exposed to several Paco2 levels, each lasting 30 to 35 minutes. Desired Paco2 levels were 20 to 30, 35 to 45, 55 to 65, 75 to 85, and more than 90 mm Hg (four to five Paco2 levels for each animal), and they were adjusted in a random order. Animals were allowed to reach a physiologic steady state for 10 minutes at each Paco2 level (Ellingsen et al., 1987), after which absolute R2,aPP MRI measurements were performed (scan time approximately 10 minutes). Femoral arterial and sagittal sinus venous blood was withdrawn at the end of the R2,app measurements.
Image processing
Absolute R2,app maps were calculated using a voxel-fitting routine in which the logarithm of the signal intensity was fitted linearly versus TE (right side of equation 8). The R2,app maps were analyzed by choosing 12 regions-of-interest in gray matter and 6 in white matter, throughout the coronal slice (the slice was 15.0 mm from the occipital pole as determined from an anatomic sagittal image). The average region-of-interest size was 19 voxels in gray matter and 26 voxels in white matter. The R2,app values were averaged to give a mean and standard error. The absolute R2,app was then correlated to OER using the exact theory described above using a nonlinear least square Levenberg-Marquardt algorithm.
To judge the statistical significance of the relaxation rate changes, regression analysis was performed for covariate data (OER and R2) in gray and white matter from each animal. The slope of each regression line was averaged and compared with a slope equal to 0. The 95% confidence interval was used to determine significance at P < 0.05.
RESULTS
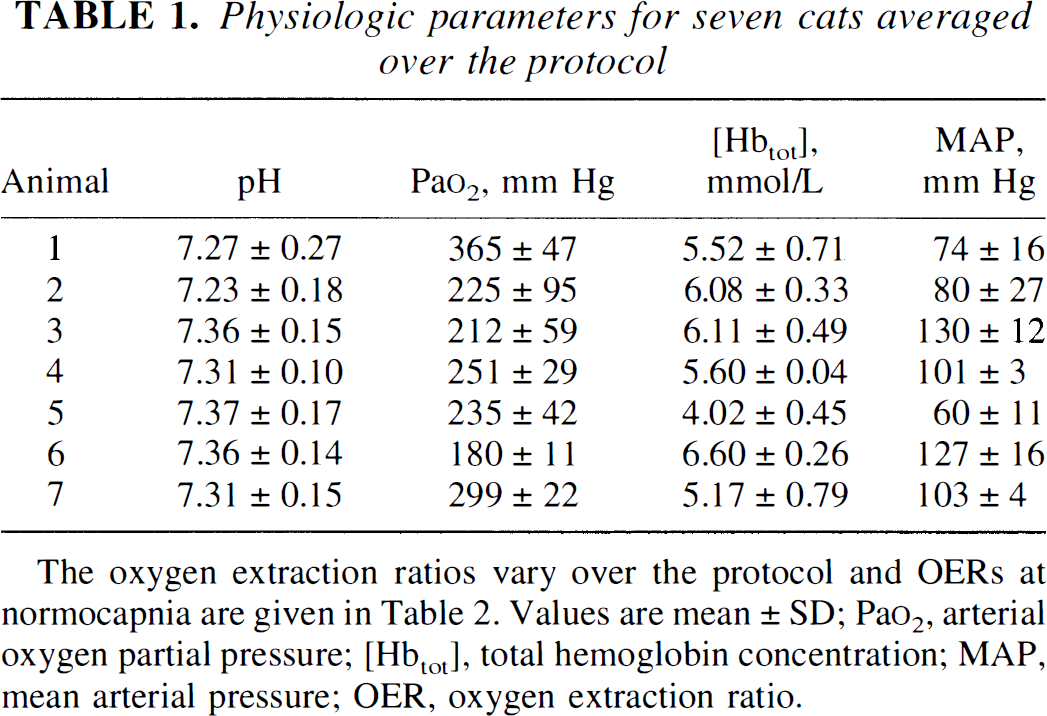
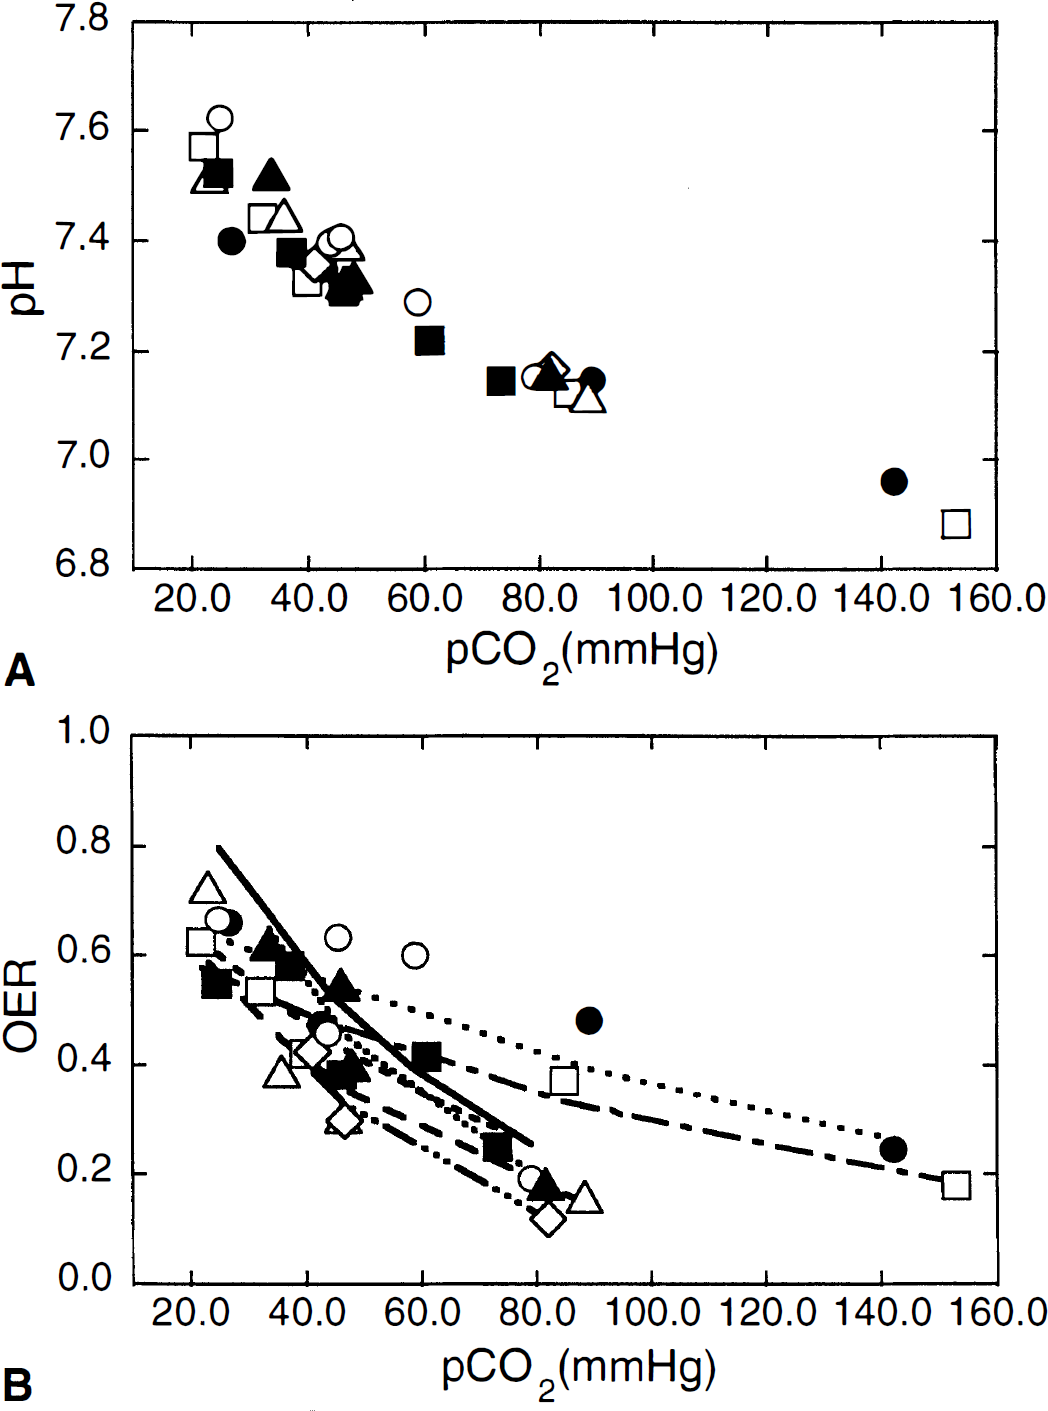
Animals were monitored for physiologic stability during the experiment (Table 1). Respiratory acidosis and alkalosis occurred, as anticipated with the experimental change in ventilation, and were treated with bicarbonate only for negative base excess on blood gas analysis. Because the average pH in each experiment may be weighted by the number of hyperventilation or hypoventilation samplings taken during the protocol, we have plotted the exact pH changes as a function of Paco2 in Fig. 1A. The reduction in pH on increasing Paco2 is a well-studied phenomena and generally considered to be a factor causing vasodilation (Lassen, 1968). The Pao2 was supranormal because of the addition of supplemental oxygen to maintain Ya at 100%. The average Hct and hemoglobin were reasonably well maintained during the protocol. These values were normal except in one cat (5), which started with a low blood count. This animal contributed the highest OER and lowest MABP values. Otherwise, MABP was well within the cerebral autoregulatory range (50 to 150 mm Hg).
Physiologic parameters for seven cats averaged over the protocol
Animal
pH
Pao2, mm Hg
[Hbtot], mmol/L
MAP, mm Hg
1
7.27 ± 0.27
365 ± 47
5.52 ± 0.71
74 ± 16
2
7.23 ± 0.18
225 ± 95
6.08 ± 0.33
80 ± 27
3
7.36 ± 0.15
212 ± 59
6.11 ± 0.49
130 ± 12
4
7.31 ± 0.10
251 ± 29
5.60 ± 0.04
101 ± 3
5
7.37 ± 0.17
235 ± 42
4.02 ± 0.45
60 ± 11
6
7.36 ± 0.14
180 ± 11
6.60 ± 0.26
127 ± 16
7
7.31 ± 0.15
299 ± 22
5.17 ± 0.79
103 ± 4
The oxygen extraction ratios vary over the protocol and OERs at normocapnia are given in Table 2. Values are mean ± SD; Pao2, arterial oxygen partial pressure; [Hbtot], total hemoglobin concentration; MAP, mean arterial pressure; OER, oxygen extraction ratio.
Experimental variation of pH (A) and OER (B) as a function of Paco2. The curves in (B) denote a fit to the equation OER = a×e−b. Paco2, from which the OER value at normocapnia (Paco2, 35 mm Hg) is determined. OER35 mm Hg. (□) 0.51; (●) 0.59; (△) 0.45; (◊) 0.53; (○) 0.64; (▲) 0.62; and (■) 0.51.
The OER varied inversely as a function of Paco2 for all cats (Fig. 1B). During hypercapnia when blood flow is higher than mandated by the metabolic needs of the brain (vasodilation), the OER is decreased as less oxygen is removed from the blood with each pass through the brain. The reciprocal occurs during hypocapnia as less blood reaches the brain because of vasoconstriction, such that a greater extraction of oxygen is necessary on each pass to maintain oxygen utilization. The change in OER in response to changing Paco2 varied in the seven cats (Fig. 1B), as evidenced by a difference in the curves. The variance is not unexpectedly large for in vivo experiments as individual cats may have different baseline OER or differences in hemoglobin, both of which independently affect OER. In cats 1 and 2, the slope of the OER versus Paco2 curve is flatter, indicating greater oxygen extraction for a degree of change in Paco2. The hemoglobin concentrations were not low in these animals, however. Despite a different curve in these two animals, the OER at Paco2 35 mm Hg (OER35 mm Hg), interpolated from the curve (Fig. 1B), is not dissimilar to the population mean because of the fact that at the lower Paco2 values the OER coincided with results of the other animals.
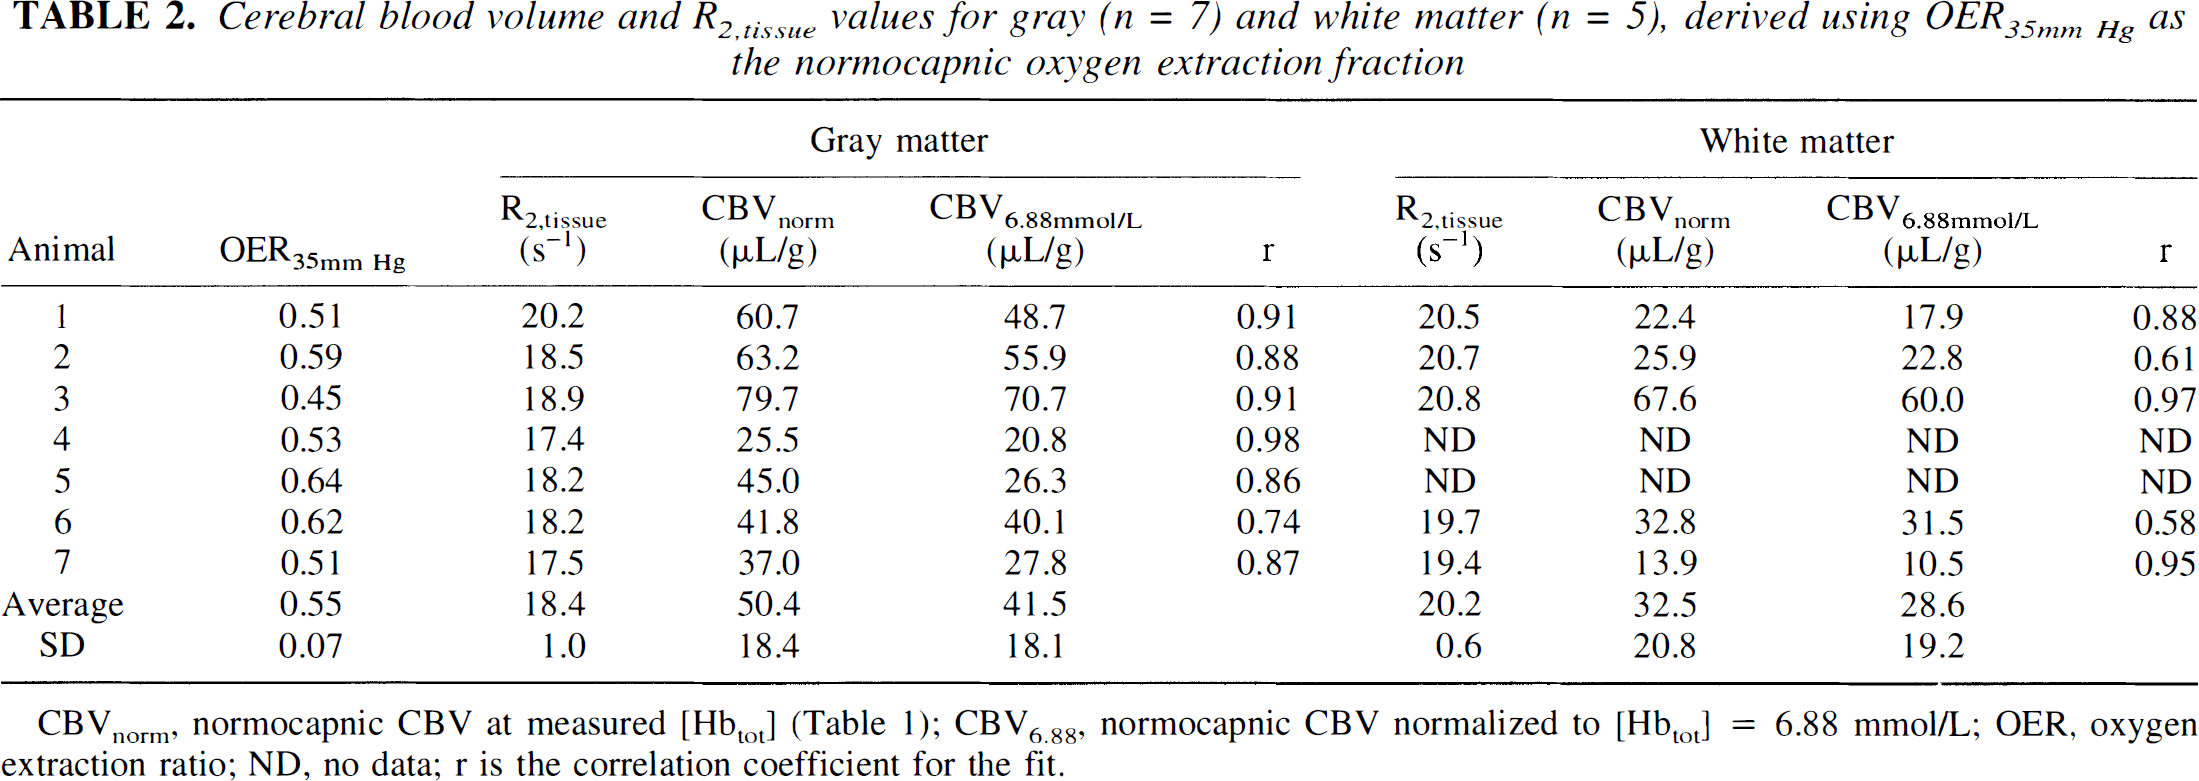
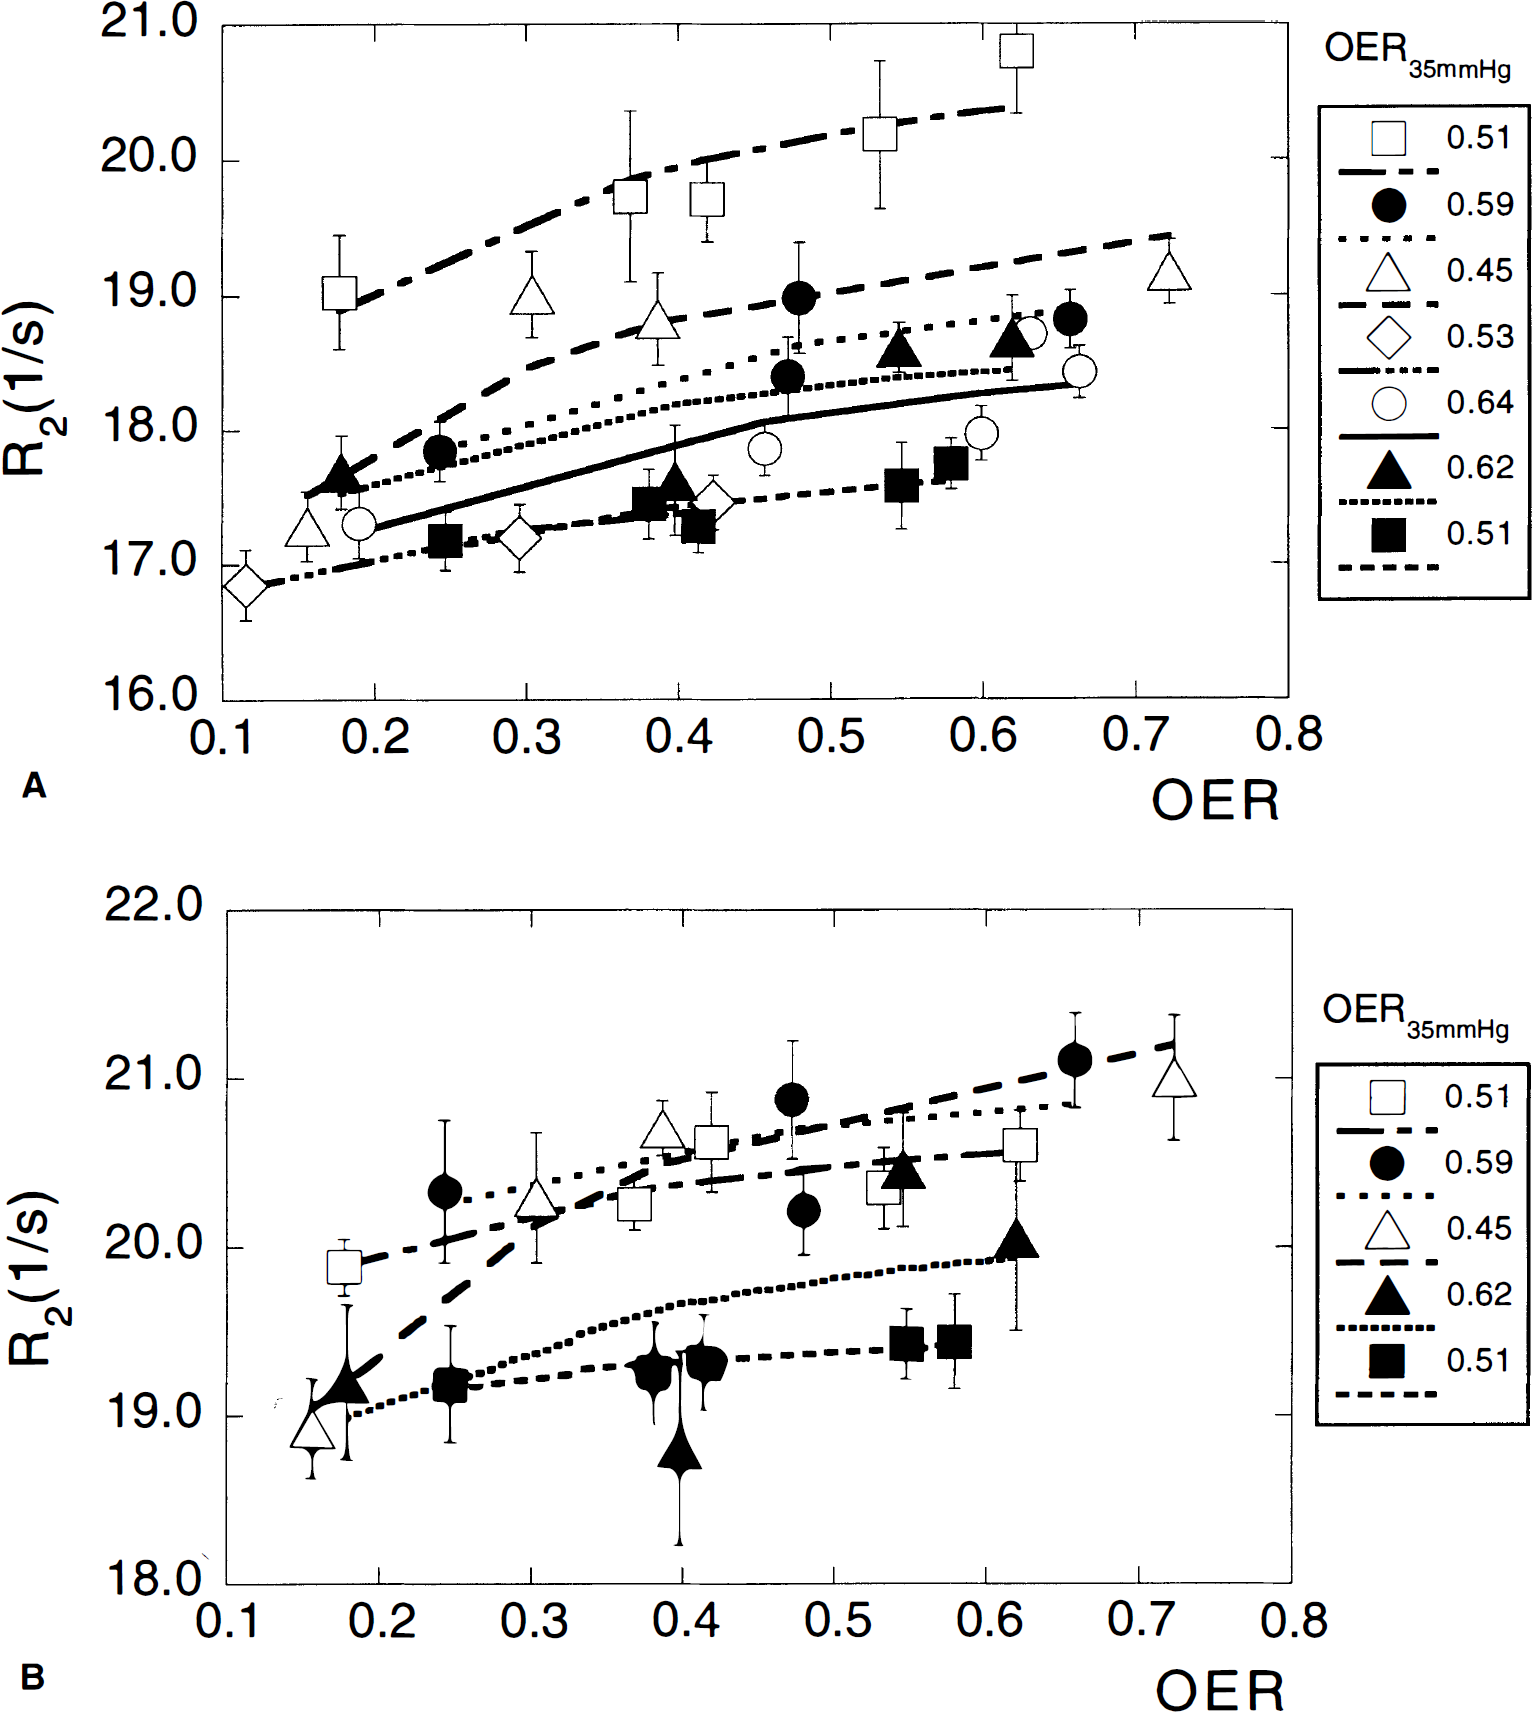
The measured relaxation rates as a function of OER are given in Fig. 2A (gray matter) and 2B (white matter). Individual regression lines were derived for each animal. The slopes for gray (2.5) and white (1.99) matter were compared as a measure of statistical significance. The 95% confidence intervals for gray (0.635) and white (1.21) matter indicate significance at the P < 0.05 level comparing these to a slope of 0. Table 2 summarizes the resulting blood volume and R2,tissue values. The blood volumes obtained from the fits for the individual cats represent total microvascular CBV at normocapnia, which may vary between cats because it depends on the total hemoglobin concentration and OER as described by equation 11. For better comparison, we therefore report blood volumes normalized to the average [Hbtot] of 6.88 mmol/L in cats (Ulatowski et al., 1996) (and the average OER at normocapnia mentioned above). The resulting values of CB V 6.88 mm ol/L were 42 ±18 μL/g (n = 7) and 29 ± 19 μL/g (n = 5) for gray and white matter, respectively. The limited number of data available for white matter is because of lower signal-to-noise ratio for this tissue type than that of gray matter, and the fact that blood flows and volumes are smaller and changes in these parameters therefore more difficult to measure. This difficulty is reflected in the reduced correlation coefficients of the fits for white matter compared with gray matter. Actually, the average white matter blood volume appears very high because of one cat (3) that deviated, with an exceptionally high CBV, but we have kept this value with the data because of a lack of sufficient exclusion criteria, such as signs of ischemic insult or gross changes in some of the physiologic parameters during the course of the measurements. One potential reason for the high volume may be increased cerebral metabolism causing increased blood flow in this animal, as the gray matter CBV is also high.
Cerebral blood volume and R2tissue values for gray (n = 7) and white matter (n = 5), derived using OER35mm Hg as the normocapnic oxygen extraction fraction
Gray matter
White matter
Animal
OER35mm Hg
R2,tissue(s−1)
CBVnorm(μL/g)
CBV6.88mmol/L(μL/g)
r
R2,tissue(s−1)
CBVnorm(μL/g)
CBV6.88mmol/L(μL/g)
r
1
0.51
20.2
60.7
48.7
0.91
20.5
22.4
17.9
0.88
2
0.59
18.5
63.2
55.9
0.88
20.7
25.9
22.8
0.61
3
0.45
18.9
79.7
70.7
0.91
20.8
67.6
60.0
0.97
4
0.53
17.4
25.5
20.8
0.98
ND
ND
ND
ND
5
0.64
18.2
45.0
26.3
0.86
ND
ND
ND
ND
6
0.62
18.2
41.8
40.1
0.74
19.7
32.8
31.5
0.58
7
0.51
17.5
37.0
27.8
0.87
19.4
13.9
10.5
0.95
Average
0.55
18.4
50.4
41.5
20.2
32.5
28.6
SD
0.07
1.0
18.4
18.1
0.6
20.8
19.2
CBVnorm, normocapnic CBV at measured [Hbtot] (Table 1); CBV6.88, normocapnic CBV normalized to [Hbtot] = 6.88 mmol/L; OER, oxygen extraction ratio; ND, no data; r is the correlation coefficient for the fit.
Relaxation rates R2 in gray (A) and white (B) matter as a function of OER. The curves represent a two-parameter fit to the theory, from which the blood volume and R2,tissue are determined. Error bars indicate the standard error over 12 and 6 regions of interest chosen in gray and white matter, respectively.
On studying the results in Table 2, it becomes apparent that the distribution of resulting CBV6.88 mmol/L values is not normal. Under such conditions, it may be useful to use the median and range, which are 40.1 μL/g (range, 70.7 to 20.8 μL/g) and 22.8 μL/g (range, 60.0 to 10.5 μL/g). To judge the validity of our results we applied a paired t test to the animals for which both gray and white matter data are available, showing P < 0.02.
To check the influence of the assumption of linear deoxygenation we used our equations to estimate the effect of changes in the microvascular compartment sizes. Variation in oxygen affinity or in the shape of the deoxygenation curve all come down to the question of how much blood with the venous oxygenation level is present at a certain point after the capillaries are entered. To estimate the maximal deviation from linear deoxygenation, we calculated the effect of direct deoxygenation after entering the capillaries, corresponding to a 21% arterial and 79% venous fraction, as well as the other extreme of deoxygenation at the end of the capillary bed, corresponding to 54% arterial and 46% venous. The resulting calculations show that the change in R2 over the full CO2 range deviates 18% for the 54:46 case and 13% for the 21:79 case, which is not unreasonable in view of the accuracy of the experiment.
Because small changes in cerebral Hct have been reported when changing Paco2 (Keyeux et al., 1995), we calculated the effect of a cerebral Hct variation between 0.31 and 0.37 from hypocapnia (CBF, 0.32· mL·g−1·min−1) to hypercapnia (CBF, 0.92 mL·g−1·min−1). The results show that the R2 change is 0.60 s−1 when assuming constant Hct, whereas it is 0.64 s−1 when adjusting the Hct. This is within experimental error.
DISCUSSION
The present study shows that local brain blood volumes can be quantified by measuring the changes in absolute R2 as a function of Paco2, thus expanding the list of quantitative MRI approaches for noninvasive determination of hemodynamic parameters. The average CBV values found at a normalized [Hbtot] = 6.88 mmol/L are 42 ±18 and 29 ±19 μL/g for gray and white matter, respectively. This result agrees well with focal PET values reported for human brain (47 ± 15 and 26 ± 6 μL/g, respectively; Leenders et al., 1990) and with whole-brain data from sheep (36 μL/g; Sharan et al., 1989) and monkeys (35 μL/g; Grubb et al., 1974). Cat morphology measurements (Pawlik et al., 1981) give a capillary blood volume range of 1.8% to 2.5%. Using a capillary volume fraction of 33% (Sharan et al., 1989) and a gray matter water content of 820 μL/g, this corresponds to a CBV range of 44.7 to 62.1 μL/g, again in excellent agreement. Previous R2 determinations using hypoxiċ hypoxia (van Zijl et al., 1998) gave volumes of 51.7 and 21.6 μL/g for gray and white matter, respectively. These numbers were obtained at an OER of 0.36 and correspond to volumes of 41.8 and 17.5 μL/g, respectively, at an OER of 0.55, which is within experimental agreement.
Because each method has particular restrictions, it is important to discuss some of the important assumptions underlying our present approach. First, it is assumed that changes in Paco2 itself or the concomitant change in pH do not influence the relaxation rate, except when leading to changes in oxygenation. We exploit the BOLD effect, which reflects the average magnetism in an MRI voxel, which in turn depends on tissue magnetism, blood magnetism, and relative tissue and blood volumes (equations 8 and 9). The magnetic properties of blood are dominated by the deoxygenation state of hemoglobin, as expressed in equations 5 through 7, which is determined by the OER (equations 1 through 3). As expressed by equation 2, several parameters may impact on OER, including the [Hbtot] (or Hct), Ya, CBF, and CMRO2, which altogether represent the oxygen demand-supply relationship. Thus, OER is small when an oversupply of blood flow and oxygen delivery exists (hyperemia), whereas it is large when oxygen delivery approaches oligemic levels and the brain extracts more oxygen to meet its need. These many variables affecting oxygen unloading in tissue would normally render a determination of what is responsible for the observed R2 changes difficult. In this series of experiments we take advantage of an animal model of induced change in partial pressure of carbon dioxide, in which blood flow and oxygen delivery are manipulated apart from the oxygen need of brain. By keeping other physiologic variables constant, i.e., Hct, Ya, and CMRO2, it is possible to limit the physiologic change affecting R2 measurements. Unlike CaO2, which was kept constant, CMRO2 was not measured in these experiments, but it has been shown to remain constant in animals anesthetized with barbiturates despite a change in Paco2 (Rhodes et al., 1981; Barzilay et al., 1985; Sieber et al., 1993). Furthermore, previous reports show unchanged cerebral oxidative metabolism and energy state (Nioka et al., 1987; Adler et al., 1988) during hypercapnia. Finally, this should not be of great influence to our measurements, because we directly fit the R2,app data as a function of the measured OER. Note that we also use this constant metabolic rate to assume that the magnetic properties of tissue, which would change if the oxidation state of cytochrome oxidase changes, remain unaltered during hypercapnia. This assumption is supported by the fact that R2,tissue < remains within narrow limits between animals (Table 2), thus confirming that the tissue relaxation rate does not respond to either hypocapnia or hypercapnia. In addition, the average R2,tissue values determined here using pentobarbital anesthetic, 18.4 and 20.2 s−1 for gray and white matter, respectively, are in excellent agreement with our hypoxia studies using a-chloralose anesthesia (van Zijl et al., 1998), in which values of 18.3 and 20.2 s−1 were determined, respectively.
An important strength of our approach is that it is not necessary to determine the blood flow. The remaining unknown variable, CBV, is measurable because it is directly linked to the OER changes (equations 10 and 11) resulting from a concomitant change in blood flow. Thus, another important assumption in our equations is the validity of equation 10, which is based on independent fitting of the data of Grubb et al. (1974) over a range at which the flow-volume relationship does not flatten because of maximal vascular dilation (less than 1.2 mL·g−1 ·min−1). Variation in this Paco2 range of 20 to 80 mm Hg causes reproducible changes in cerebral vascular tone that are manifested as changes in CBF and CBV (Brian, 1998). Within this physiologic range, whole-brain CBF changes 0.1 to 0.2 mL∙g−1·min−1 for each 10-mm Hg change in Paco2. Reducing Paco2 below 20 mm Hg does not result in further decrease of CBF (Reivich, 1964; Alexander et al., 1968) and increasing Paco2 above 80 mm Hg can increase CBF from baseline values in anesthetized animals one to twofold (Reivich, 1964). Cerebral blood flow can increase from baseline in unanesthetized animals sixfold in response to hypercapnia (Berntman et al., 1979). This inordinate increase in CBF in the awake state likely represents the effect of hypercapnic stimulation on cerebral metabolism by catecholamines, which is ablated under anesthesia. This is an important point when attempting to extrapolate these techniques to awake subjects in which changes in CMRO2 are likely. In addition to the type and level of anesthesia, the CBF response to Paco2 also varies with temperature, extremes of blood pressure (e.g., hypotension), and length of exposure to different Paco2. Similarly, CBV in humans and animals is directly related to changes in Paco2 (Grubb et al., 1974; Smith et al., 1971; Greenberg et al., 1978; Archer et al., 1987; Todd et al., 1993) from baseline values of 30 to 50 μL/g (Smith et al., 1971; Phelps et al., 1973; Grubb et al., 1973, 1974; Martin et al., 1987; Greenberg et al., 1978; Todd et al., 1993). This relationship with varying Paco2 allows us to extrapolate CBV from CBF using a fixed constant (equation 10) in a paradigm in which we indirectly measure changes in CBF by directly measuring changes in OER. Although values of CBF can be determined by similar calculations, this would require knowledge or assumption of the oxygen metabolic rate. Also, because we are measuring tissue volumes rather than the entire content of the intracranial vault, our derived value for CBV is more appropriately tissue, or microvascular, blood volume, but the same MRI techniques may be used to derive data for total CBV determinations. Finally, it should be noted that we measure the relaxation rates after establishing physiologic equilibrium to avoid any possible dynamic changes in the flow-volume relationship.
It has been reported that hypercapnia leads to a reduction in the effective spin-spin relaxation rates (R*2) in animal brain (Hoppel et al., 1993; Ono et al., 1997) and in gray matter of awake man (Rostrup et al., 1994), and that the magnitude of this effect differs regionally (Rostrup et al., 1994). For instance, Hoppel et al. (1993) found ΔR2 of −0.5 s−1 for gray matter in the dog brain using a Paco2 rise from 35 to 75 mm Hg, which seems to agree well with our values. However, comparison of the magnitude of these effects is not straightforward because of differences in field strength (4.7 T versus 1.5 T) and anesthesia (pentobarbital versus halothane). In addition, the relaxation rates in the work by Hoppel et al. (1993) were determined from signal changes at a single long TE, which will give different results than a exponential fit over a TE range (equation 8), because of the effects of nonexponential blood relaxation behavior (equations 5 through 7). Rostrup et al. (1994) found no consistent change in ΔR*2 in white matter despite a 30% increase in Paco2 and a ΔR*2 of 5% to 12% in gray matter in awake humans. These findings do not contradict our small changes, because the narrow Paco2 range attained corresponds approximately to an OER range of 0.36 to 0.22, for which the small relaxation rate changes may be difficult to detect in white matter. Our observations agree with data obtained using 99mTc-labeled red blood cells reported by Greenberg et al. (1978), showing that CBV changes in concert in both tissue types for awake humans exposed to mild hypocapnia, but not to genuine hypercapnia (highest Paco2 was 44 mm Hg).
In summary, we have quantified the focal CBV values in gray and white matter from changes in the spin-relaxation rate R2 during a carbon dioxide-regulated study. The determined values agree well with previously published data, and this study adds support to our SE BOLD theory, which is based on the assumption that the hemodynamic changes measured by absolute R2 are mainly caused by the water protons exchanging between the erythrocytes and plasma (van Zijl et al., 1998). Using this theory for R2 offers the possibility of quantifying the physiologic parameters in the equations, such as Ya, Hct, CMRO2, OER, CBV, and CBF, by designing specific experiments in which one parameter is measured while keeping the others constant through physiologic regulation. It is important to point out that it should also be possible to determine absolute blood volumes at a single carbon dioxide level. Because this requires the determination of a single unknown, CBV, from a single observable, R2, this can be achieved only if OER and R2,tissue are known. The results from this paper and the previous hypoxia experiments (van Zijl et al., 1998) show that R2,tissue is very constant and can thus be used as long as partial volume effects with CSF are avoided. The OER can, in principle, be measured from the blood draining from the tissue, leaving CBV as a single unknown. As a consequence, these types of measurements are a powerful tool with which to investigate brain metabolism and function both under normal and diseased conditions in a truly noninvasive manner.
Acknowledgment: The authors thank Olli Grohn for valuable assistance with some of the calculations.
Footnotes
Abbreviations used
References
1.
AdlerSSimplaceanuVHoC (1988) Determination of rat brain buffering in vivo by 31P-NMR. J Appl Physiol64:1829–1836
2.
AlexanderSCSmithTCStrobelGStephenGWWollmanH (1968) Cerebral carbohydrate metabolism of man during respiratory and metabolic alkalosis. J Appl Physiol24:66–72
3.
ArcherDPLabrecquePTylerJLMeyerETropD (1987) Cerebral blood volume is increased in dogs during administration of nitrous oxide or isoflurane. Anesthesiology67:642–648
4.
BandettiniPAWongEC (1995) Effects of biophysical and physiologic parameters on brain activation-induced R2* and R2 changes: simulations using a deterministic diffusion model. Int J Imag Syst Techn6:133–152
5.
BarzilayZBrittenAGKoehlerRCDeanJMTraystmanRJ (1985) Interaction of CO2 an ammonia on cerebral blood flow and O2 consumption in dogs. Am J Physiol248:H500–H507
EichlingJRaichleMGrubbRTer-PogossianM (1974) Evidence of the limitations of water as a freely diffusable tracer in brain of the Rhesus monkey. Circ Res35:358–364
14.
EllingsenIHaugeANicholaysenGThorsenMWalloeL (1987) Changes in human cerebral blood flow due to step changes in Pao2 and Paco2. Acta Physiol Scand129:157–163
15.
FabryMESan GeorgeRC (1983) Effect of magnetic susceptibility on nuclear magnetic resonance signals arising from red cells. Biochemistry22:4119–4125
16.
GillesPPetöSMolnyFMispelterJCuenodCA (1995) Proton transverse nuclear magnetic relaxation in oxidized blood: a numerical approach. Magn Reson Med33:93–100
17.
GomoriJMGrossmanRIYu-IpCAsakuraT (1987) NMR relaxation times of blood: dependence of field strength, oxidation state, and cell integrity. J Comput Assist Tomogr11:684–690
18.
GreenbergJHAlaviAReivichAMKuhlDUzzellB (1978) Local cerebral blood volume response to carbon dioxide in man. Circ Res43:324–331
19.
GröhnOHJLukkarinenJAOjaJMEvan ZijlPCMUlatowskiJATraystmanRJKauppinenRA (1998) Noninvasive detection of cerebral hypoperfusion and reversible ischemia in the rat from reductions in the magnetic resonance imaging relaxation time T2. J Cereb Blood Flow Metab18:911–920
GrubbRLRaichleMEEichlingJOTer-PogossianMM (1974) The effects of changes in Paco2 on cerebral blood volume, blood flow, and vascular mean transit time. Stroke5:630–639
22.
GuckelFBrixGRemppKDeimlingMRotherJGeorgiM (1994) Assessment of cerebral blood volume with dynamic susceptibility contrast enhanced gradient-echo imaging. J Comput Assist Tomogr18:344–351
23.
HaackeEMLaiSYablonskyDALinW (1995) In vivo validation of the BOLD mechanism: a review of signal changes in gradient echo functional MRI in the presence of flow. Int J Imag Syst Techn6:153–163
24.
HambergLMMcFarlaneRTasdemirogluEBoccaliniPHunterGJBelliveauJWMoskowitzMARosenBR (1993) Measurement of cerebrovascular changes in cats after transient ischemia using dynamic magnetic resonance imaging, Stroke24:444–451
25.
HerbstMDGoldsteinJH (1989) A review of water diffusion measurements by NMR in red blood cells, Am J Physiol256C1097–C1104
26.
HoppelBEWeisskoffRMThulbornKRMooreJBKwongKKRosenBR (1993) Measurement of regional blood oxygenation and cerebral hemodynamics. Magn Reson Med30.715–723
27.
KeyeuxAOchrymowicz-BemelmansDCharlierAA (1995) Induced response to hypercapnia in the two-compartment total cerebral blood volume, influence on brain vascular reserve and flow efficiency. J Cereb Blood Flow Metab15:1121–1131
28.
KimSG (1995) Quantification of relative blood flow change by flow-sensitive alternating inversion recovery (FAIR) technique: application to functional mapping. Magn Reson Med34:293–301
LassenN (1968) Brain extracellular pH, the main factor controlling cerebral blood flow. Scand J Clin Lab Invest22:247–251
31.
LeendersKLPeraniDLammertsmaAAHeatherJDBuckinhamPHealyMJRGibbsJMWiseRJSHatazawaJHeroldSBeaneyRPBrooksDJSpinksTRhodesCFrackowiakRSJJonesT (1990) Cerebral blood flow, blood volume and oxygen utilization. Normal values and effect of age. Brain113:27–47
32.
MartinWRPowersWJRaichleME (1987) Cerebral blood volume measured with inhaled C15O and positron emission tomography. J Cereb Blood Flow Metab7:421–426
33.
MathaiJCMoriSSmithBLPrestonGMMohandasNCollinsMvan ZijlPCMZeidelMLAgreP (1996) Functional analysis of aquaporin-1 deficient red cells. J Biol Chem271:1309–1313
34.
MeyerM-EYuOEclancerBGruckerDChambronJ (1995) NMR relaxation rates and blood oxygenation level. Magn Reson Med Moonen CTW, van Zijl PCM, Le Bihan D, Frank J, Becker ED (1990) Functional magnetic resonance imaging in medicine and physiology. Science250:53–61
35.
NiokaSChanceBHilbermanMSubramanianHVLeighJSJVeechRLForsterRE (1987) Relationship between intracellular pH and energy metabolism in dog brain as measured by 31P-NMR. J Appl Physiol62:2094–2102
36.
OgawaSLeeTMKayARTankDR (1990) Brain magnetic resonance imaging with contrast dependent on blood oxygenation. Proc Natl Acad Sci USA87:9868–9872
37.
OgawaSTankDWMenonRSEllermanJMKimS-GMerkleHUgurbilK (1992) Intrinsic signal changes accompanying sensory stimulation: functional brain mapping with magnetic resonance imaging. Proc Natl Acad Sci USA89:5951–5955
38.
OgawaSMenonRSTankDWKimS-GMerkleHEllermanJMUgurbilK (1993a) Functional brain mapping by blood oxygenation level dependent contrast magnetic resonance imaging. Biophys J64:803–812
39.
OgawaSLeeTMBarrereR (1993b) The sensitivity of magnetic resonance image signals of a rat brain to changes in the cerebral venous blood oxygenation. Magn Reson Med29:205–210
40.
OnoYMorikawaSInubushiTShimizuHYoshimotoT (1997) T2*-weighted magnetic resonance imaging of cerebrovascular reactivity in rat reversible focal cerebral ischemia. Brain Res744: 207–215
41.
PaulsonOHertzMBolwigTLassenN (1977) Filtration and diffusion of water across the blood brain barrier in man. Microvasc Res13:113–124
42.
PawlikGRacklABingRJ (1981) Quantitative capillary topography and blood flow in the cerebral cortex of cats: an in vivo microscopic study. Brain Res208:35–58
43.
PhelpsMEGrubbRLJrTer-PogossianMM (1973) Correlation between PaCO2 and regional cerebral blood volume by x-ray fluorescence. J Appl Physiol35:274–280
44.
PrielmeyerFNagatomoYFrahmJ (1994) Cerebral blood oxygenation in rat brain during hypoxic hypoxia. Quantitative MRI of effective transverse relaxation rates. Magn Reson Med31:678–681
45.
ReivichM (1964) Arterial Paco2 and cerebral hemodynamics. Am J Physiol20625–35
46.
RhodesCGLenziGLFrackowiakRSJJonesTPozzilliC (1981) Measurement of CBF and CMRO2 using the continuous inhalation of C1502 and 15O2, J Neurol Sci50:381–389
47.
RostrupELarssonHBWToftPBGardeKThomsenCRingPSondergaardLHenriksenO (1994) Functional MRI of CO2 induced increase in cerebral perfusion. NMR Biomed7:29–34
48.
SharanMJonesMDJrKoehlerRCTraystmanRJPopelAS (1989) A compartmental model for oxygen transport in brain microcirculation. Ann Biomed Eng17:13–38
49.
SieberFEBrownPRWuYKoehlerRCTraystmanRJ (1993) Cerebral blood flow responsivity to CO2 in anesthetized chronically diabetic dogs. Am J Physiol264:H1069–H1075
50.
SmithALNeufeldGROminskyAJWollmanH (1971) Effect of arterial CO2 tension on cerebral blood flow, mean transit time, and vascular volume. J Appl Physiol31:701–707
51.
SongAWWongECTanSGHydeJS (1996) Diffusion weighted fMRI at 1.5 T. Magn Reson Med35:155–158
52.
ThulbornKRWatertonJCMatthewsPMRaddaGK (1982) Oxygenation dependence of the transverse relaxation time of water protons in whole blood at high field. Biochim Biophys Acta714:265–270
53.
ToddMMWeeksJBWarnerDS (1993) Microwave fixation for the determination of cerebral blood volume in rats. J Cereb Blood Flow Metab13:328–336
54.
UlatowskiJABucciENishikawaTRazynskaAWilliamsMATakeshimaRTraystmanRJKoehlerRC (1996) Cerebral O2 transport with hematocrit reduced by cross-linked hemoglobin transfusion. Am J Physiol270:H466–H475
55.
UlatowskiJABucciERazynskaATraystmanRJKoehlerRC (1998) Cerebral blood flow during hypoxic hypoxia with plasma-based hemoglobin at reduced hematocrit. Am J Physiol274:H1933–H1942
56.
van ZijlPCMEleffSMUlatowskiJAOjaJMEUlugAMTraystmanRJKauppinenRA (1998) Quantitative assessment of blood flow, blood volume and blood oxygenation effects in functional magnetic resonance imaging. Nat Med4:159–167
57.
VieiraFLSha'afiRISolomonAK (1970) The state of water in human and dog red cell membranes. J Gen Physiol55:451–466
58.
WilliamsDSDetreJALeighJSKorteskyAP (1992) Magnetic resonance imaging of perfusion using spin inversion of arterial water. Proc Natl Acad Sci USA89:212–216