
Abstract
The authors recently showed that [15O]water PET data obtained with a short interscan interval (6 minutes) produced similar results whether or not the residual background from the previous scan is subtracted. The purpose of the present study was to compare scans obtained during motor activation using a short (6-minute) interscan interval protocol with those obtained with a standard (10-minute) protocol in the same scanning session. Single-subject and group analyses were performed using Worsley's method, which uses a pooled variance estimate and statistical parametric mapping with a local variance estimate. High consistency in both the activation maps, i.e., the number of activated motor brain structures and the Talairach coordinates of peak intensities of the activated regions, was obtained in the 6- and 10-minute studies in both single-subject and group analyses. However, in comparison to the 6-minute studies, a larger cluster size of activated brain regions and an approximately 20% higher peak activation in these regions were observed in the 10-minute studies with the same number of replicates. Analysis of these results suggests that using a 6-minute interval with an increased number of replications, i.e., without changing the subject's total study duration, should produce comparable statistical power to that of the 10-minute interval for group analysis and increased statistical power for single-subject analyses that use a local variance estimate because of increased degrees of freedom. Alternatively, with a small increase in the number of scans and the use of a 6-minute interscan interval, a comparable level of statistical significance may be achieved for single-subject experiments that use a local variance estimate, with an overall shortening of the study duration.
Positron emission tomography (PET) with [15O]water, a technique used to measure changes in cerebral blood flow (CBF) related to brain activity, has wide applications in research and clinical studies. To maximize its sensitivity, there have been ongoing improvements in the [15O]water PET technique. These are either directly connected with the PET scanners, i.e., removing the septa to allow three-dimensional acquisition with increased sensitivity and lowered radiation dose (Cherry et al., 1993) or involve optimization of parameters such as scan duration, speed of injection, and the injected dose (Sadato et al., 1997).
One important challenge is how to maximize the statistical power of an experimental design involving repeated [15O]water PET scans. To maintain subject cooperation, scanning sessions typically do not exceed 2 hours. One approach that may increase statistical power with the same total scanning time is to increase the number of scans by reducing the interscan interval from the conventional 10 to 12 minutes to 6 minutes. However, because 15O has a 2-minute half-life, residual radioactivity from the preceding scan will have a progressively larger influence as the interscan interval is shortened. This residual radioactivity can be estimated and used to correct the [15O]water scans. Several studies have evaluated the necessity and methodology of performing this “background subtraction” (Herscovitch et al., 1991; Egan et al., 1996; Eden et al., 1996; Chmielowska et al., 1998).
In our recent study (Chmielowska et al., 1998), we examined the influence of background subtraction in [15O]water studies with a 6-minute interscan interval using a motor activation task. Both single-subject and group analyses showed that [15O]water PET data obtained with a short interscan interval produce very similar results with or without background subtraction. However, because this data set was acquired at a 6-minute interscan interval, there could not be a direct comparison to data acquired using the standard interval (10 to 12 minutes).
To address this issue, in the present study we directly compared [15O]water PET data obtained with 6- and 10-minute interscan intervals without subtracting residual radioactivity. Single-subject and group analyses were performed on both 6- and 10-minute PET data sets using two widely adopted statistical strategies: the Worsley et al. (1992) pooled variance method, and statistical parametric mapping (SPM), a local variance method (Friston et al., 1991, 1994).
MATERIALS AND METHODS
Subjects and task
Eight healthy normal volunteers (ages 26 to 34 years) were studied with [15O]water and PET while they performed a motor task. A T1-weighted image was obtained in all subjects using magnetic resonance imaging (MRI). The protocol was approved by the National Institute of Neurological Disorders and Stroke Institutional Review Board and the NIH Radiation Safety Committee. All subjects gave their written informed consent for the study, and had normal physical examinations and medical histories.
Subjects performed each of the following two tasks with their eyes closed: finger extension of the right hand at 1 Hz, paced with a metronome; and the rest condition, listening to the sound of the metronome. Each of these two tasks was repeated five times during a block of scans obtained with a 6-minute interscan interval (total of 10 scans) and five times in a 10-minute interscan interval block (total of 10 scans). The order of the movement and rest tasks was randomized for both interscan intervals. All subjects had received one practice session 30 minutes before the actual study. Performance accuracy was assessed by observation.
PET data acquisition
For each subject, 20 scans were collected using a GE Advance 3-D tomograph (Waukesha, WI, U.S.A.) during a single scan session. Regional CBF changes were assessed using images obtained by summing the activity for 60 seconds after the first detection of radioactivity in the head after the intravenous bolus injection of 10 mCi of [15O]water. For scans performed 6 minutes apart, a 60-second background scan was acquired beginning approximately 90 seconds before the subsequent injection. The metronome-paced task was initiated approximately 15 seconds before tracer injection and continued until the end of the 60-second scan, for a total task duration, including the time for the tracer to reach the head, of approximately 90 seconds. Arterial blood was not sampled. For subjects 1 through 4 (Table 1), a 6-minute interscan interval was used for scans 1 through 10 (5 at rest and 5 with finger movement) followed by the 10-minute interscan interval for scans 11 through 20. For subjects 5 through 8, the order was reversed, i.e., the 10-minute interscan interval was applied first, followed by the 6-minute interscan interval. The average times (± SD) between injections are shown in Table 1. Except for subject 1, all subjects were able to stay in the same position in the PET camera for the entire study (approximately 3.5 hours, including preparation time for the scanning). Subject 1 had to leave the PET room for 30 minutes to void after completing 10 scans with the 6-minute interscan interval. For the second part of the study (10 scans with a 10-minute interscan interval), the head position in the z-axis of this subject differed slightly from the original one, as shown by repeated transmission scans. Subject 7 performed the entire 20-scan study; however, the two last scans (one rest condition, one motor task) in the 6-minute study were excluded from the analysis because the interscan interval was 8 minutes instead of 6 minutes owing to technical difficulties with the PET scanner. The average time interval between the end of the 6-minute interscan interval and the beginning of the 10-minute interscan interval sessions (or vice versa) for subjects 2 through 8 was 12.48 ± 2.27 minutes.
Study design
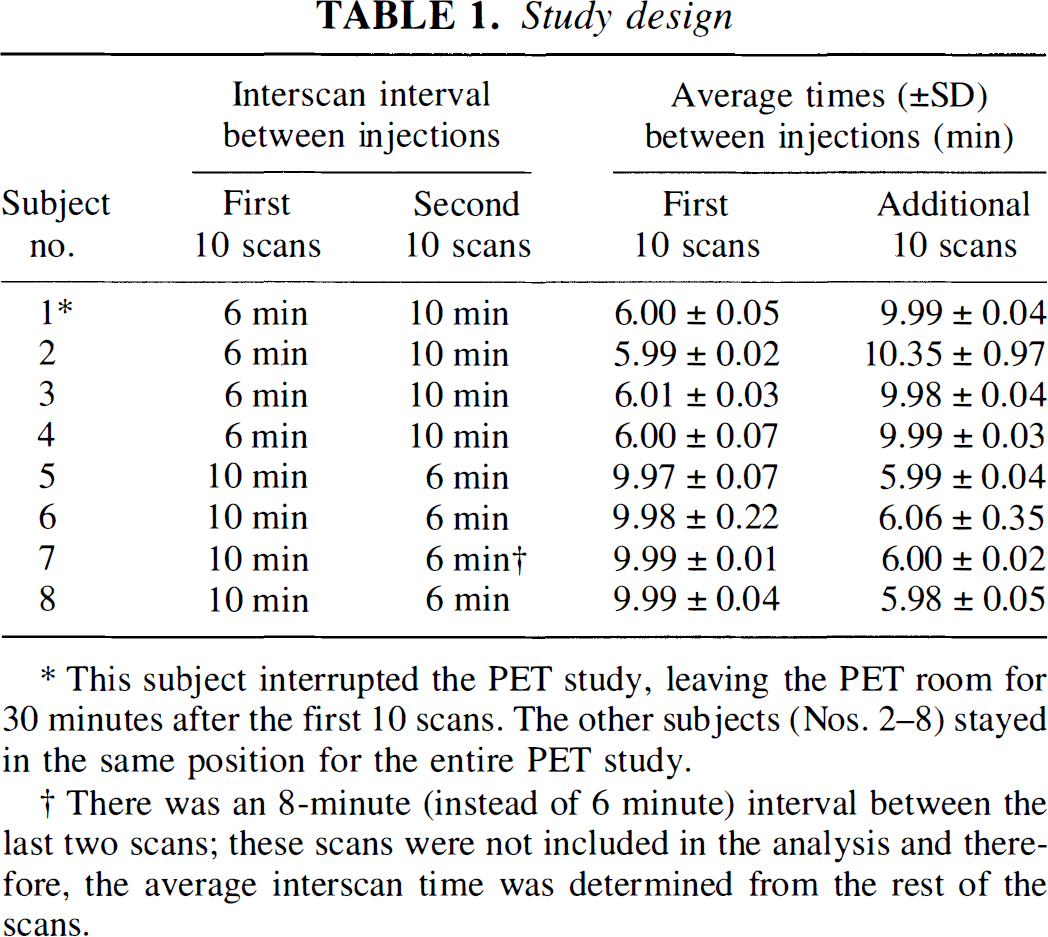
This subject interrupted the PET study, leaving the PET room for 30 minutes after the first 10 scans. The other subjects (Nos. 2–8) stayed in the same position for the entire PET study.
There was an 8-minute (instead of 6 minute) interval between the last two scans; these scans were not included in the analysis and therefore, the average interscan time was determined from the rest of the scans.
Images were reconstructed using the reprojection algorithm of Kinahan and Rogers (1989). A Hanning filter (cutoff at 0.25 min−1) was used in the transverse direction; a ramp filter (cutoff at the Nyquist frequency) was applied in the axial direction. The transverse and axial spatial resolutions with these filters were measured at 6.5 mm and 6 to 7 mm, respectively. The images were reconstructed into a 128 × 128 × 35 matrix with 2 × 2 × 4.25-mm voxels. A measured transmission scan was used for attenuation correction. Scatter correction was performed by Gaussian fitting of the projection data (Stearns, 1995). Random coincidences were measured by the delayed coincidence technique and subtracted in real time. Corrections for detector normalization and dead time were also applied.
PET image processing and data analysis
Both single-subject analyses and a group analysis were performed on data from the eight subjects.
Single-subject analysis. Spatial normalization to Talairach space (Talairach and Tournoux, 1988) was performed using MNI-AUTOREG (Montreal Neurological Institute, Montreal, Canada) to produce a 12-parameter linear transform of each subject's MRI data (Collins et al., 1996). Spatial transformations needed for PET-PET and MRI-PET alignments were performed with the AIR 2.0 software (Woods et al., 1992, 1993) and combined with the transformation to standard space to produce a single spatial transform for each PET file. Thus, each PET file was resampled only once to transform it into standard space. Then, the PET data were subsequently smoothed with a 15 × 15 × 15-mm full width at half maximum Gaussian filter. After this, all data sets (6- and 10-minute) were analyzed using proportional (ratio) normalization for global counts and pooled variance for the test statistic generation (Worsley et al., 1992). Briefly, normalization was accomplished by dividing each voxel by the average of all gray matter voxels for each PET volume and multiplying by 100. Gray matter voxels were identified by applying a threshold value to the average of each subject's 20 PET scans. Differences between motor and rest conditions were calculated and converted to t statistic data using a pooled variance estimate, according to Worsley et al. (1992). However, the pooled variance was calculated from gray matter voxels alone rather than from all intracerebral voxels (Grabowski et al., 1996; Chmielowska et al., 1998).
Two tests were used to assess the regional significance. One detected high-intensity signals (local maxima exhibiting t statistic values exceeding a threshold of 4.0 were considered to reflect meaningful regional CBF changes). The second was based on the spatial extent (the significance of the voxels exceeding a t value of 3.09 was determined on the basis of spatial extent of activation according to Friston et al., 1994).
Group analysis. Our sample size permitted the use of SPM 95 (Friston et al., 1991, 1994) for group analysis. Data were analyzed in three ways: (1) with the same image processing, proportional normalization, and pooled variance method as described for the single-subject analysis; (2) with SPM 95 with proportional scaling for global CBF normalization and a local variance estimate for the test statistic generation; and (3) with SPM 95, using analysis of covariance (ANCOVA) adjustment for global normalization (Friston et al., 1991, 1994). Data were smoothed with a 15 × 15 × 15-mm full width at half maximum filter. For SPM 95, group analysis was performed with a blocked design (the multisubject replication). Identical thresholds (4.0 for identifying “meaningful” regional CBF changes, and 3.09 for suprathreshold cluster identification) were used in all analytical strategies.
Additional analyses. Several additional analyses were performed to provide a better understanding of any potential differences between scans done with the two interscan intervals. (1) To better characterize differences between the 6- and 10-minute interscan interval studies, we examined the influence of the number of task repetitions on the magnitude of activation of the motor cortex, supplementary motor area (SMA), and cerebellum. This was performed by reanalyzing the group data using one, two, three, four, and five repetitions, i.e., using run 1, runs 1 and 2, runs 1, 2, and 3, and so forth, and comparing the magnitude of activation for the two interscan intervals. (2) Subtraction of the 6-minute group study from the 10-minute group study [(motor – rest)10 – (motor – rest)6] was performed using both pooled variance and SPM-95 techniques (multi-study, repetition of condition). This comparison would directly show any statistically significant differences between the 6- and 10-minute data sets. (3) Group analysis using pooled variance was performed on the background scans obtained from 6-minute studies. Background scans that followed a motor activation were compared with scans that followed the rest condition to determine whether there was any residual effect of an activation that is detectable in the background scan performed 6 minutes later. In the above three analyses, thresholds of 4.0 for identifying local maxima and 3.09 for cluster analysis were applied. (4) Pooled gray matter standard error of the mean was determined for the 6- and 10-minute data sets. Paired t tests were performed to assess whether there was a statistically significant difference in noise level caused by interscan interval.
Simulation studies. In comparing the results obtained with the 6- and 10-minute interscan intervals, a reduction in t values in the activated areas for the 6-minute studies was found in the group analyses and in most of the single-subject analyses (see Results). We wished to determine whether the magnitude of this reduction was consistent with that predicted from the presence of background activity and knowledge of the tracer kinetic characteristics of [15O]water. We considered a single voxel in the cerebellum, located midway between the peak activation locations of the 6- and 10-minute pooled variance group analyses. The mean tissue count values at this voxel were determined for both the 6- and the 10-minute task and rest conditions. Using an arterial input function measured in a different study and assuming a mean gray matter flow of 60 mL·min−1·100 g−1, the CBF values that corresponded to the normalized tissue counts found in the 10-minute studies were determined. Simulated tissue curves were then produced for the 6-minute scans using these CBF values and input functions measured in previous 6-minute studies (Herscovitch et al., 1991), with the assumption that task-related CBF changes occurred coincident with the start and stop times of the motor task. These tissue curves were used to calculate the magnitude of activation for the 10- and 6-minute studies. These values were then used in conjunction with measured noise values to predict the reduction in t value.
RESULTS
Direct comparison of the scan data obtained without subtracting background residual radioactivity showed a great similarity in the activation maps obtained with the 6- and 10-minute interscan intervals in both single-subject and group analyses. For clarity, we restricted the detailed comparison of significantly activated brain regions (clusters and maxima of activation) to three major structures that are typically activated during a motor task, i.e., contralateral primary motor cortex (BA 4), SMA (BA 6, medial), and cerebellum.
Single-subject analysis
Clusters of significant activation. Four subjects (2, 3, 5, and 7) showed highly similar maps of significant clusters of activation, i.e., both the motor cortex and SMA were activated in both the 6- and 10-minute data sets. The data for subject 5 demonstrate this excellent consistency in activation (Fig. 1). Three other subjects (4, 6, and 8) showed no cluster of significant activation over the SMA in the 6-minute study, but there was activation in the 10-minute study, regardless of the order of the interscan intervals. This is illustrated for subject 4 in Fig. 1. One subject (1) had no cluster of activation in the SMA in the 10-minute interscan interval study, but showed activation in the 6-minute study. For the significantly activated cerebellum, six individuals (1, 2, 3, 4, 5, and 7) showed an excellent consistency in the data for both the 6- and 10-minute PET studies (Fig. 1). One subject (8) had a bilaterally activated cerebellum in the 10-minute study, and only ipsilateral activation in the 6-minute study. One subject (6) demonstrated a significantly activated cerebellum in the 10-minute but not the 6-minute study.
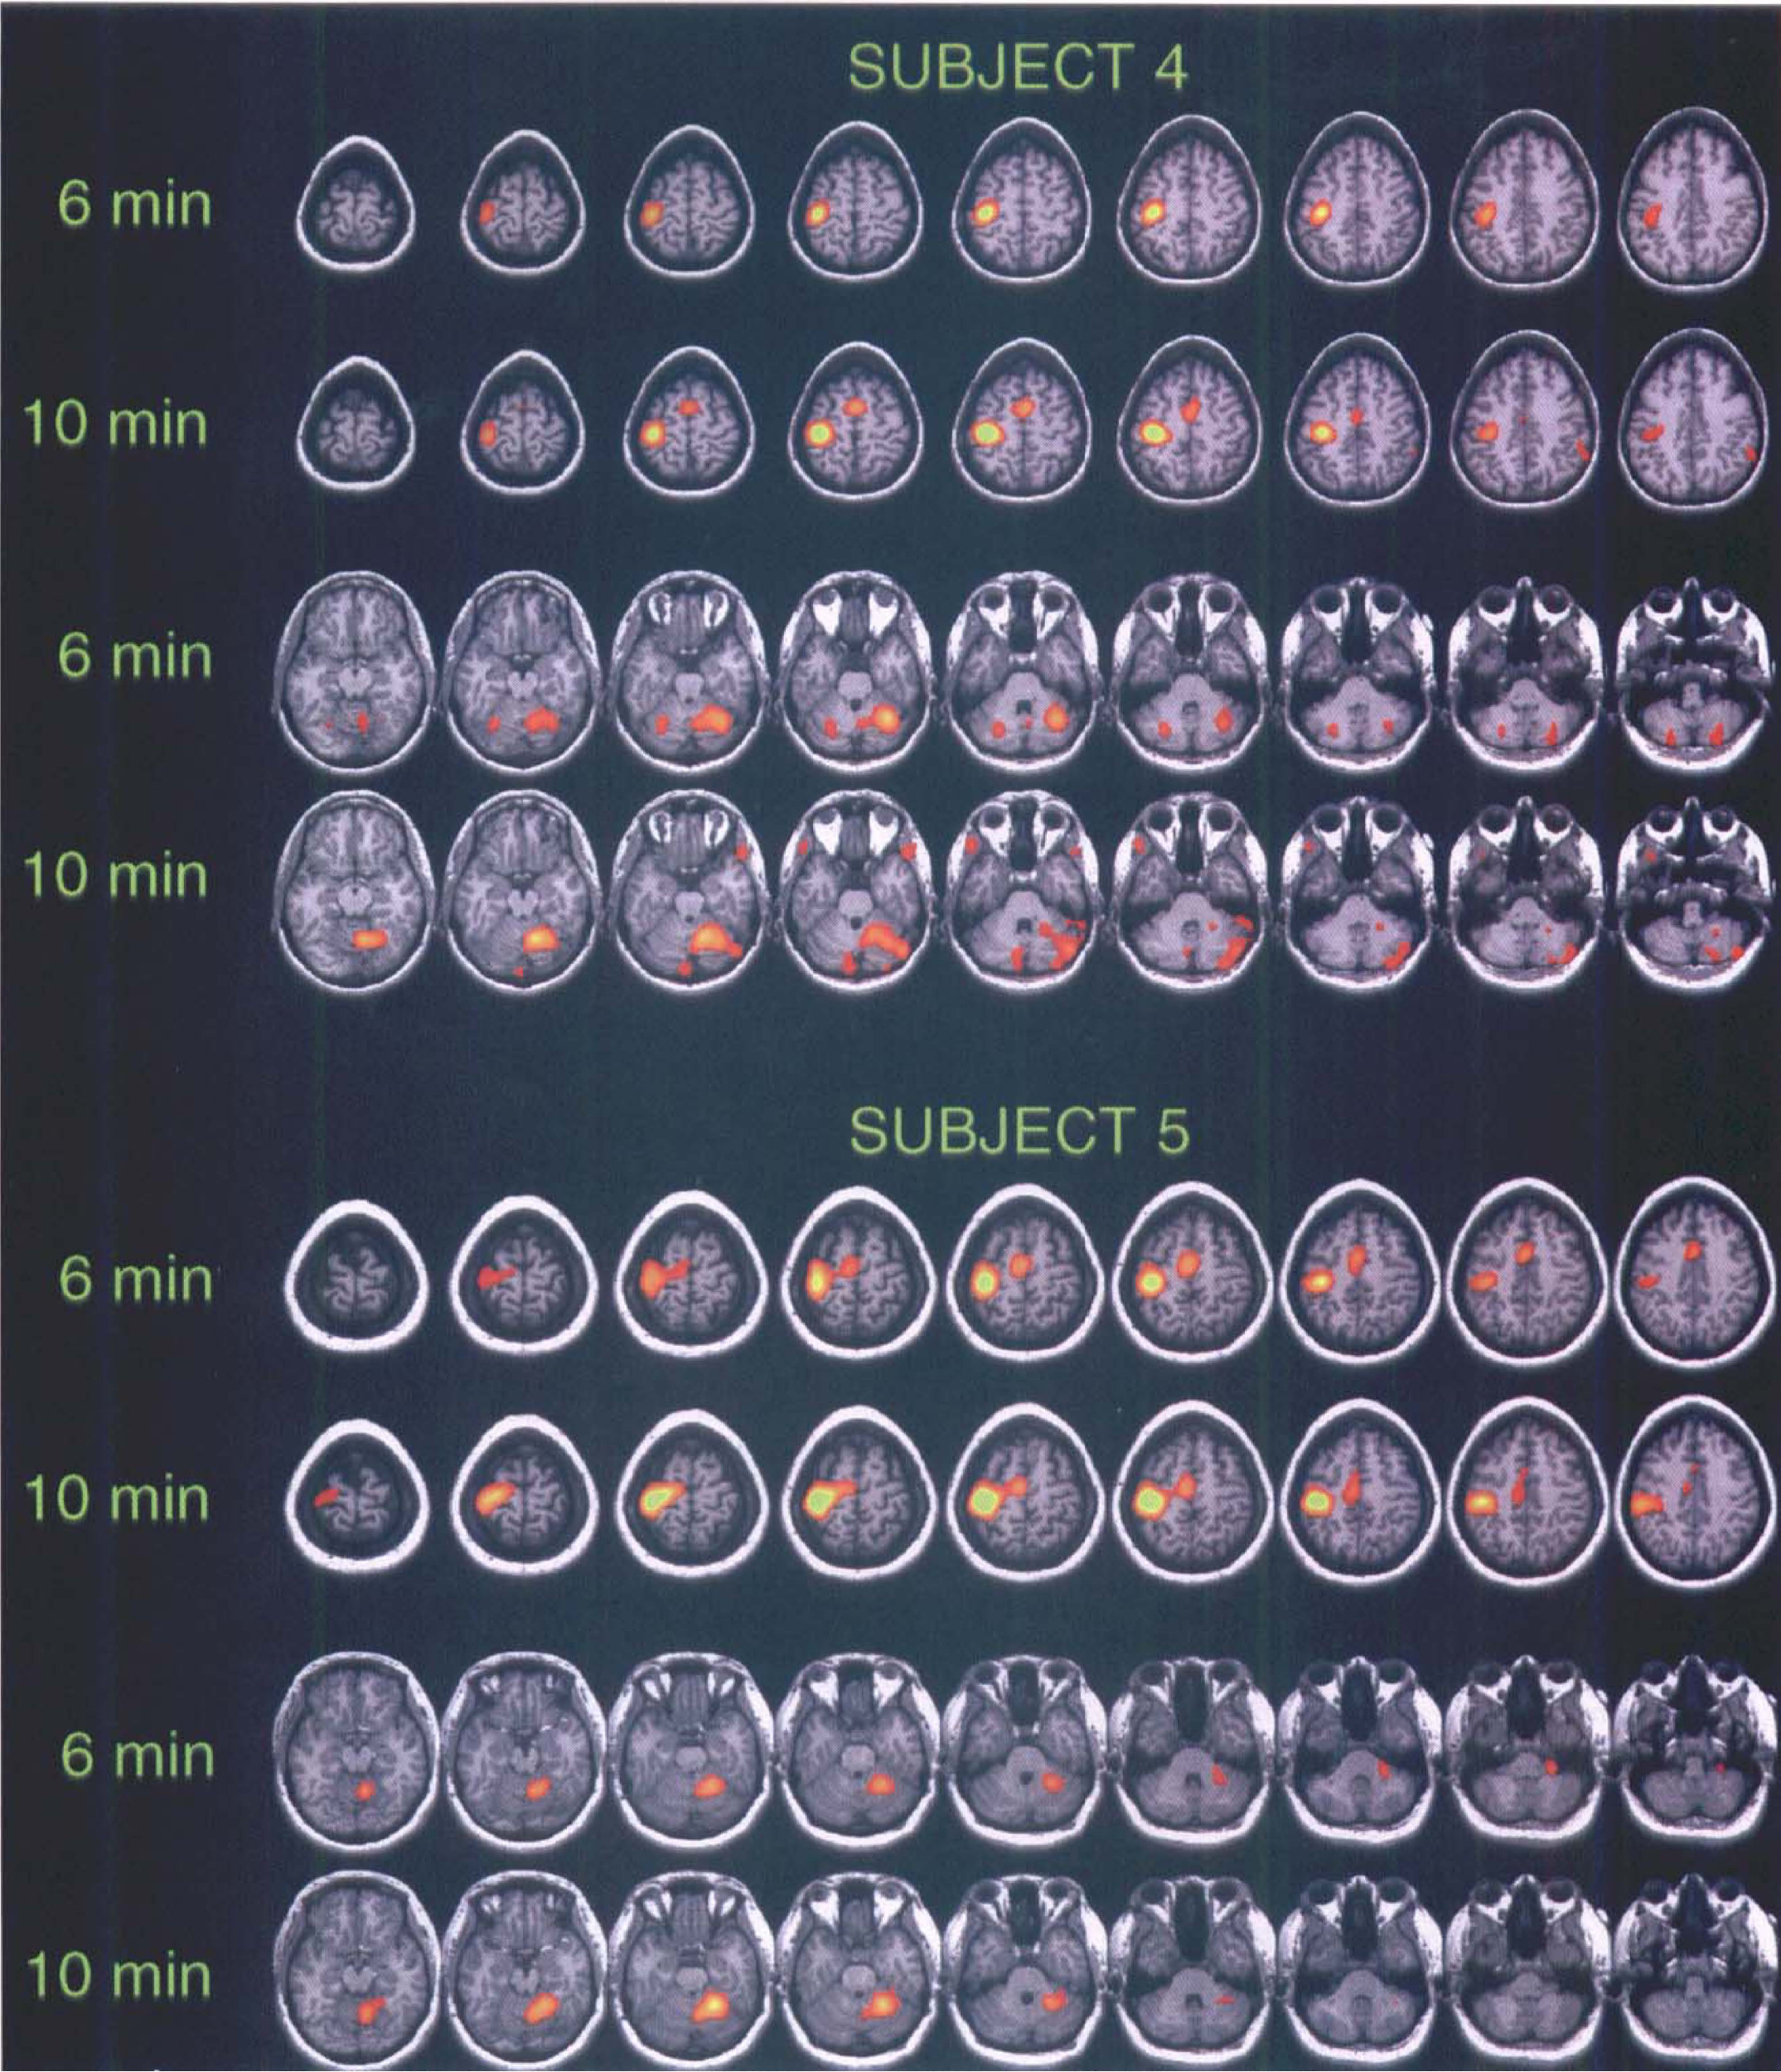
Comparison of the statistically significant clusters of activation in 6- and 10-minute interscan interval PET data sets of two normal subjects performing right hand finger extensions. The single-subject analyses were performed using the pooled variance method (Worsley et al., 1992). The significant clusters of activation (increases in red and yellow) had a threshold applied at t = 3.09 and then were superimposed on the subject's MRI image. Talairach (Talairach and Tournoux, 1988) z levels from left to right: +70 to +35 at 4-mm intervals for cortex and −12 to −48 for cerebellum. PET data for subject 4 were collected with 6-minute interscan intervals used first, followed by the 10-minute intervals, whereas the data for subject 5 were collected in the reverse order. In this figure, we illustrate the three major cortical regions activated during finger movements, i.e., contralateral primary motor cortex (BA 4), SMA (BA, medial 6), and the cerebellum. Subject 5 shows excellent consistency between activation maps obtained for the 6- and 10-minute interscan interval studies. Subject 4 shows less consistency between activation maps; activation was not detected in the SMA in the 6-minute study.
The cluster size of the significantly activated brain regions of all eight single-subject analyses using pooled variance are presented in Table 2. In seven of eight analyses (except for subject 2), cluster size including cortical and subcortical activated brain regions was smaller in the 6-minute data sets compared with the 10-minute data sets. Similarly, cluster size over the cerebellum was smaller in seven of eight 6-minute data sets (not in subject 1) compared with the 10-minute data sets.
Comparison of cluster size of significantly activated brain structures in 6- and 10-min interscan interval studies for single-subject and group analyses
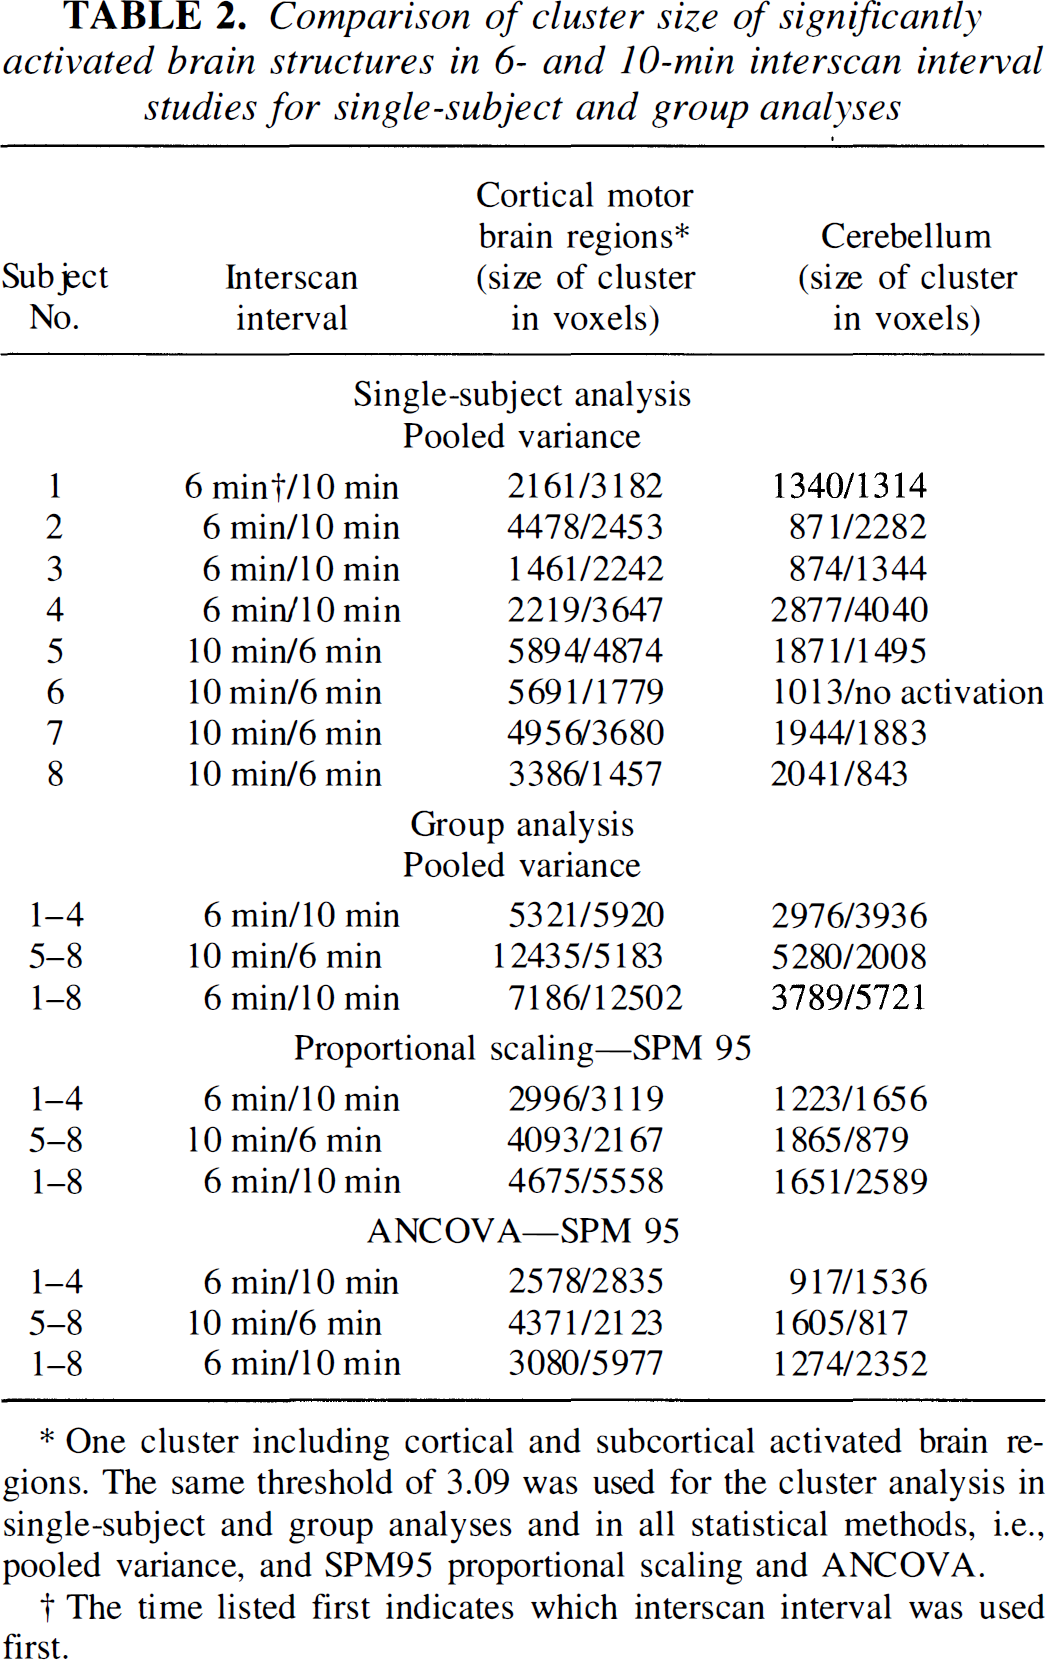
One cluster including cortical and subcortical activated brain regions. The same threshold of 3.09 was used for the cluster analysis in single-subject and group analyses and in all statistical methods, i.e., pooled variance, and SPM95 proportional scaling and ANCOVA.
The time listed first indicates which interscan interval was used first.
Local maxima. The Talairach coordinates and the t and z value of the peak intensity of the primary motor cortex, SMA, and cerebellum are shown in Table 3 for all eight individual analyses. Very small or no differences were noted in the locations of local maxima in the motor cortex, with somewhat larger differences in SMA and cerebellum between the 6- and 10-minute data sets. However, most differences were about the size of a single voxel (2 × 2 × 2 mm).
Comparison of location of the largest peck intensities and the corresponding t or z values from studies with 6- and 10-minute interscan intervals
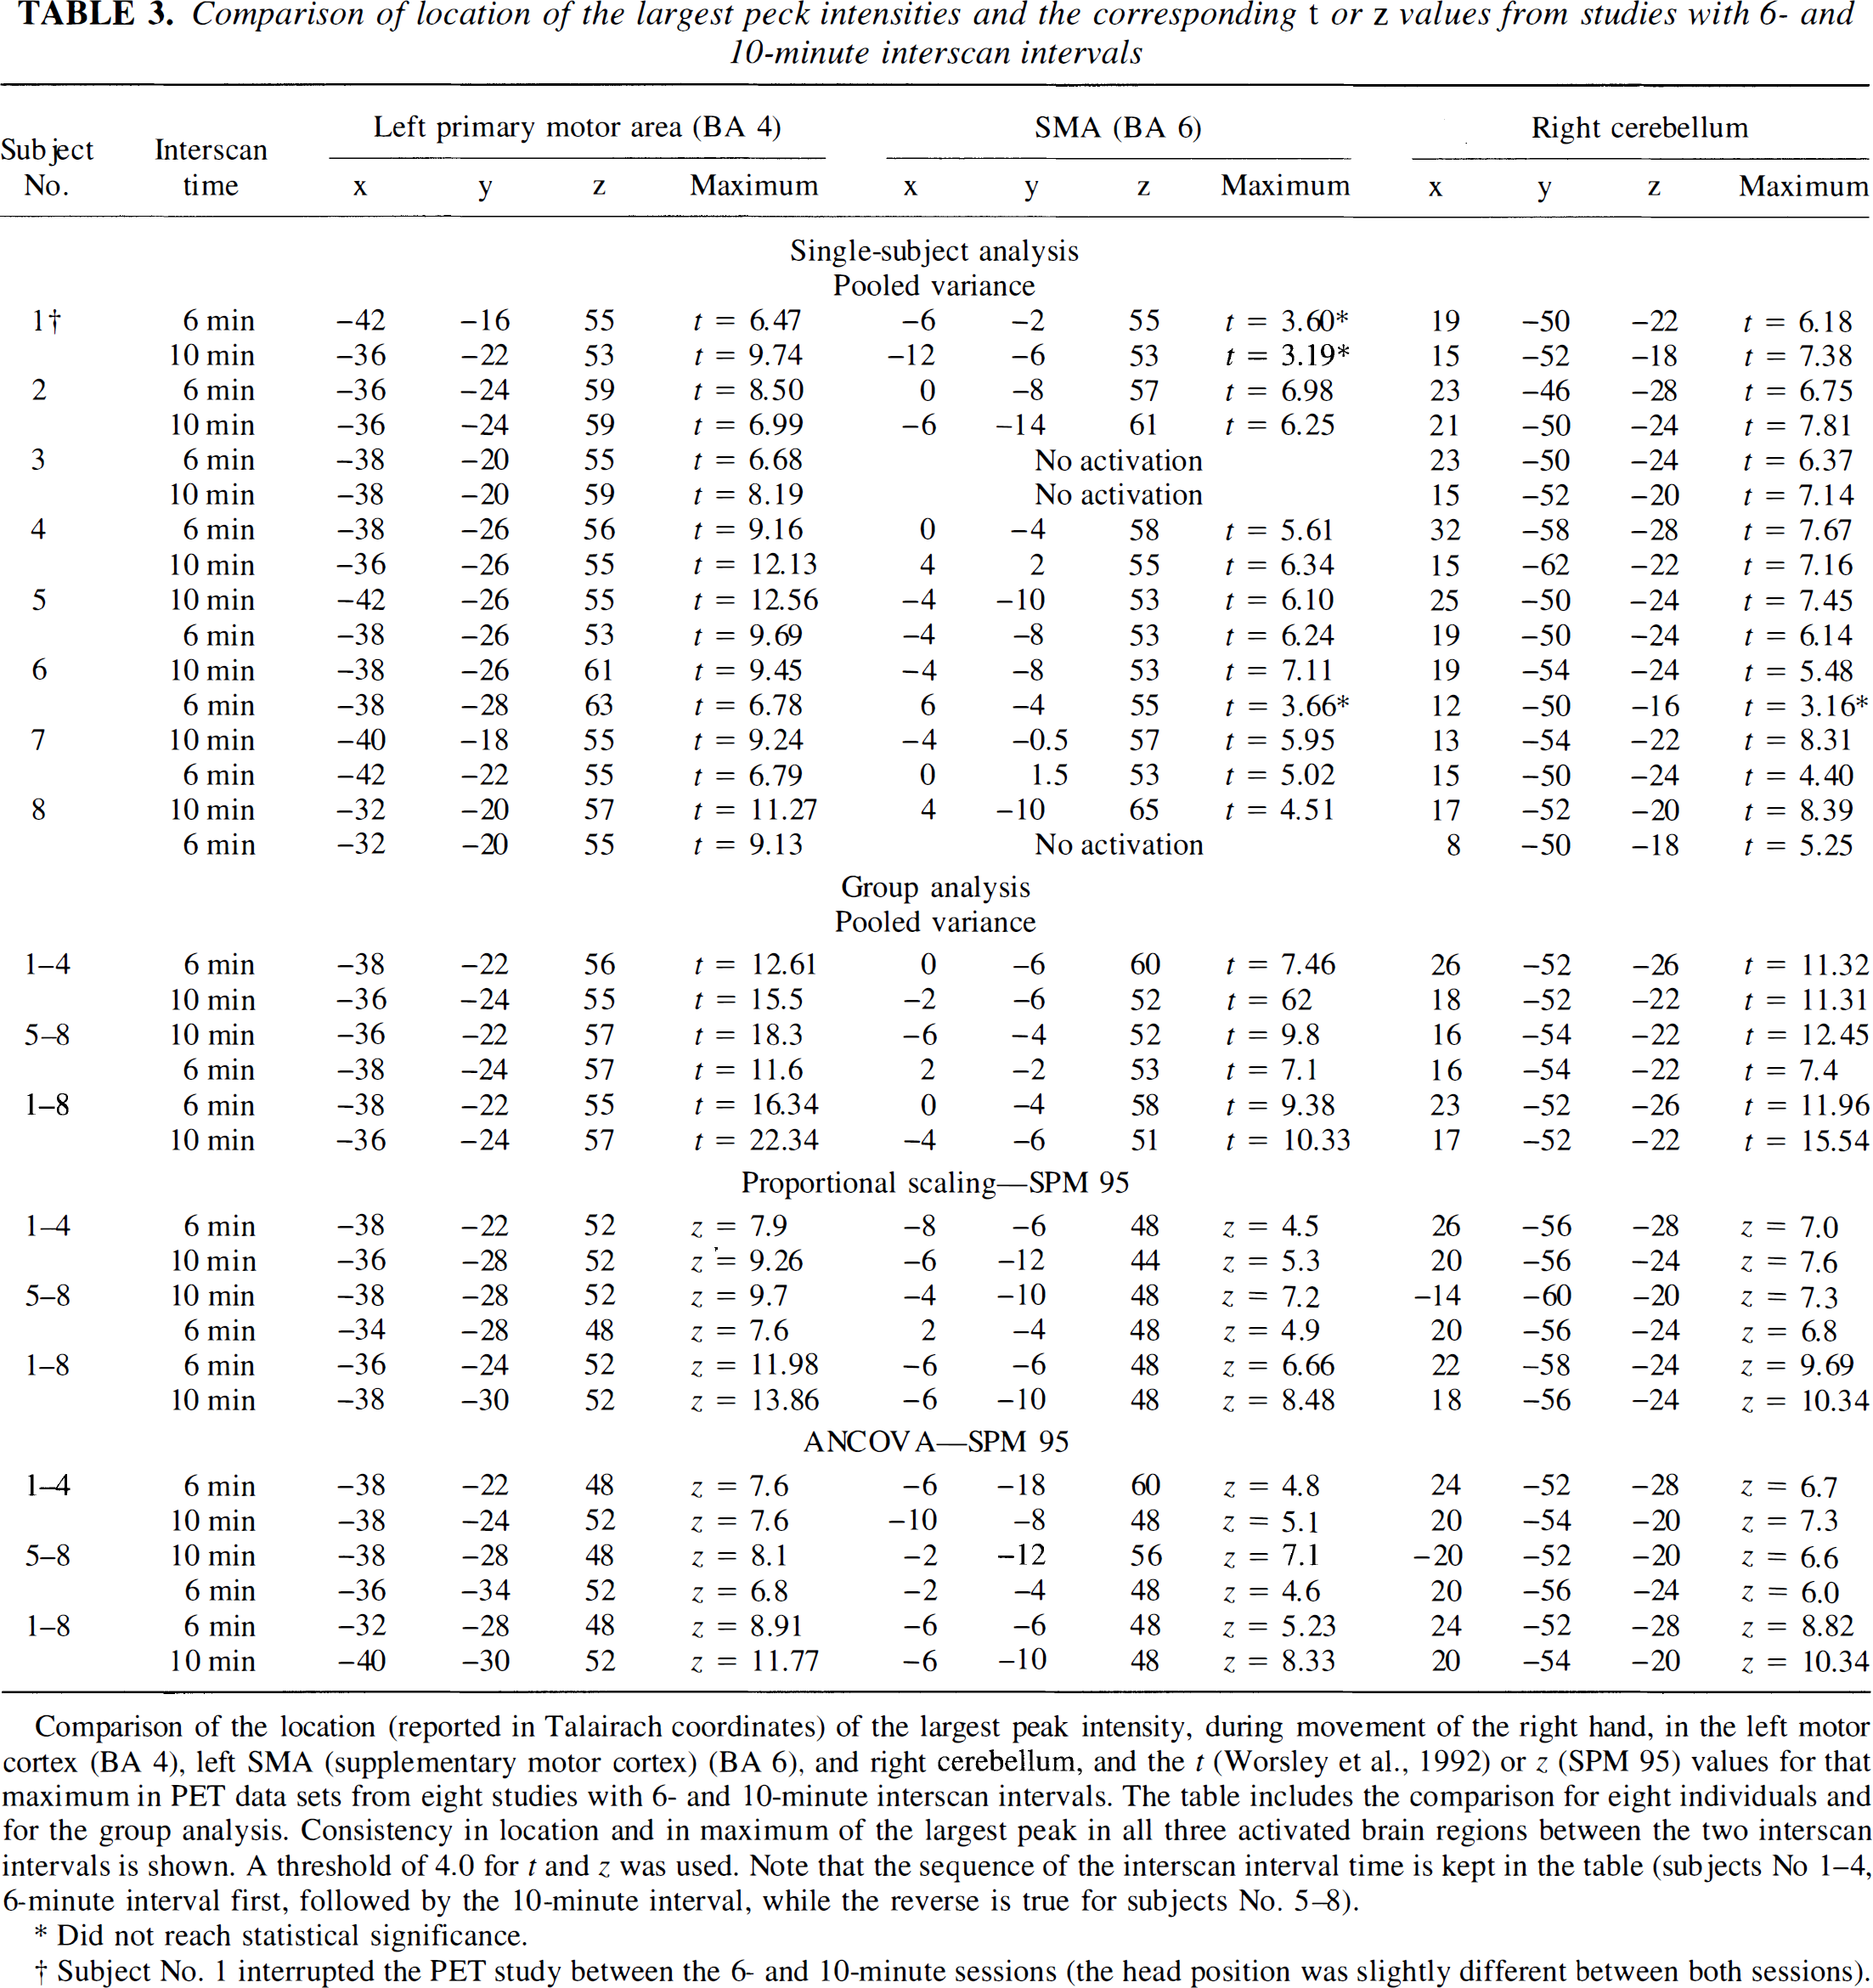
Comparison of the location (reported in Talairach coordinates) of the largest peak intensity, during movement of the right hand, in the left motor cortex (BA 4), left SMA (supplementary motor cortex) (BA 6), and right cerebellum, and the t (Worsley et al., 1992) or z (SPM 95) values for that maximum in PET data sets from eight studies with 6- and 10-minute interscan intervals. The table includes the comparison for eight individuals and for the group analysis. Consistency in location and in maximum of the largest peak in all three activated brain regions between the two interscan intervals is shown. A threshold of 4.0 for t and z was used. Note that the sequence of the interscan interval time is kept in the table (subjects No 1–4, 6-minute interval first, followed by the 10-minute interval, while the reverse is true for subjects No. 5–8).
Did not reach statistical significance.
Subject No. 1 interrupted the PET study between the 6- and 10-minute sessions (the head position was slightly different between both sessions).
The t values of local maxima were higher for the 10-minute data sets in seven of eight analyses for the motor cortex, seven of eight for cerebellum, and four of seven for SMA (excluding subject 3 who had no SMA activation). The mean values of the t scores for the 6-minute data were 26%, 14%, and 12% smaller than the 10-minute values in motor cortex, cerebellum, and SMA, respectively. Subject 4, who did not show a significant cluster of activation over SMA (see Fig. 1), demonstrated the presence of a significant local maximum in the SMA (Table 3).
Group analyses
The results of the group analysis (eight subjects) using both pooled variance and SPM techniques are illustrated in Fig. 2. One can observe the similarity in activation maps of the activated cortical regions (contralateral motor 4 and SMA) and in the bilateral cerebellum in the results from the 6- and 10-minute interscan interval studies across the applied statistical methods. In addition, subcortical motor regions, such as the contralateral thalamus and bilateral putamen and globus pallidus, were significantly activated in both the 6- and 10-minute studies in the group analyses.
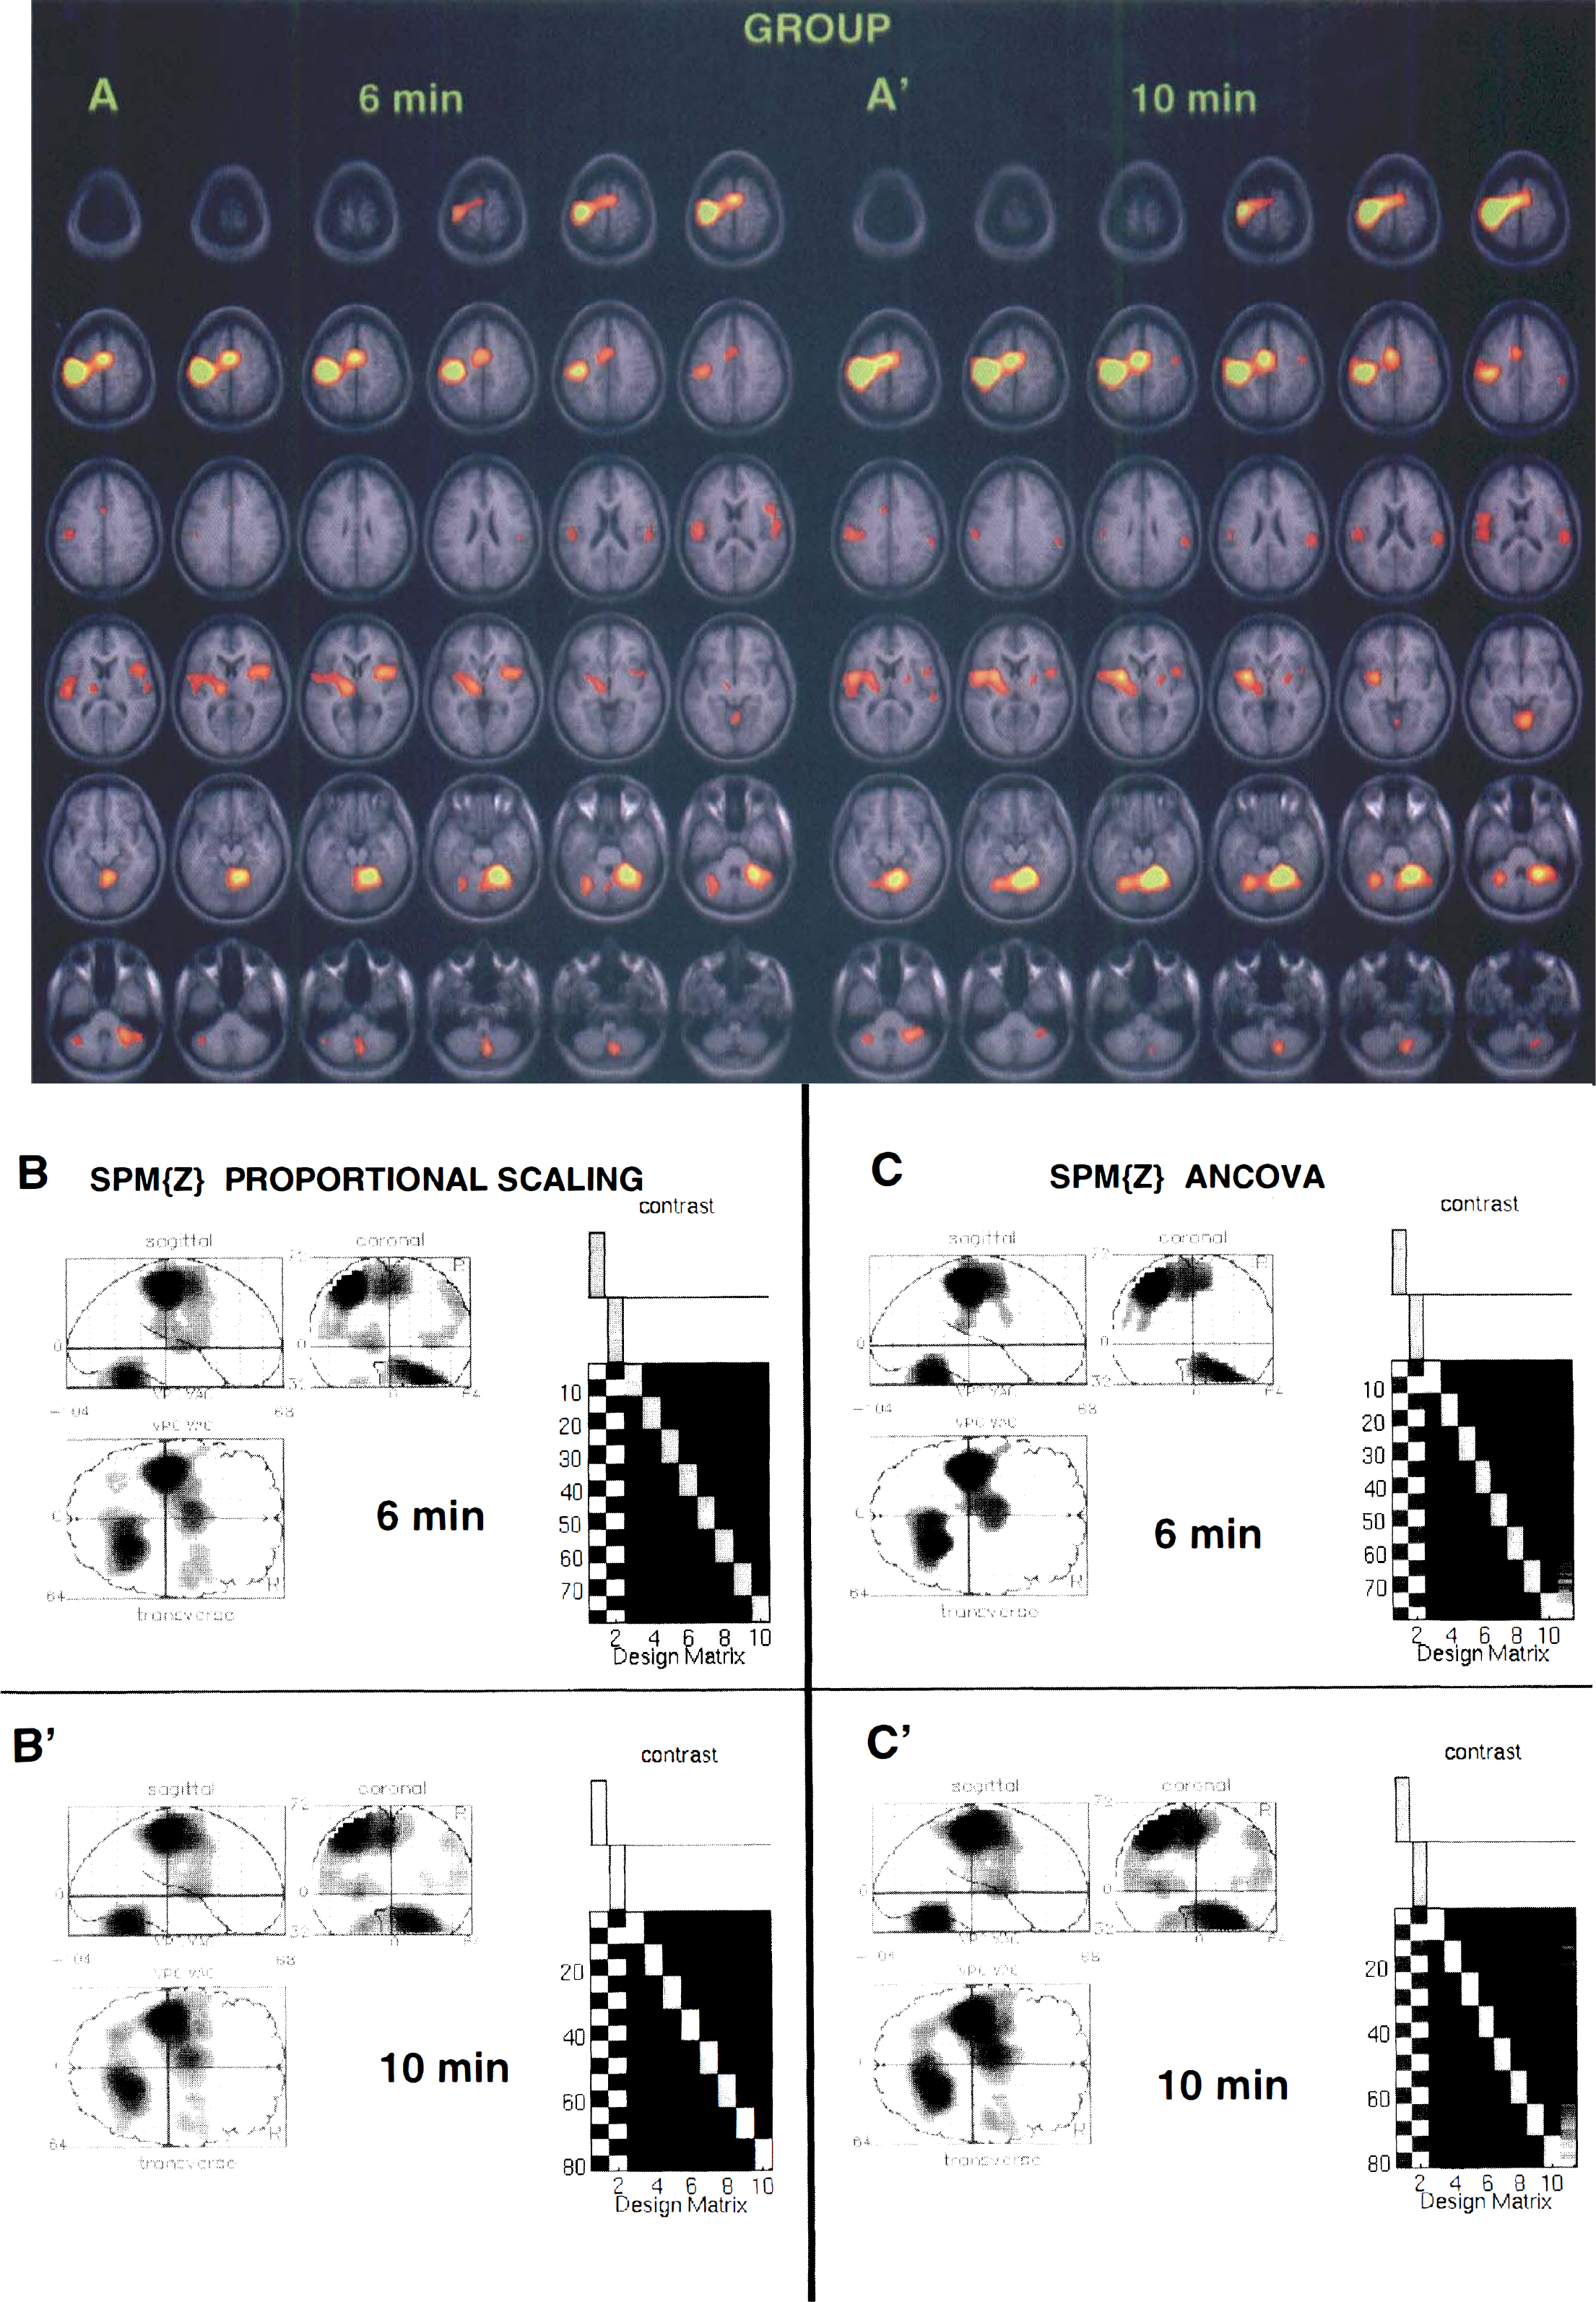
Comparison of the statistically significant clusters of activation by group analysis (eight subjects) of the 6- and 10-minute interscan interval data sets. Group PET data are superimposed on the average of eight MRI volumes of the subjects. Results of a group analysis using the pooled variance method (
Cluster size of significant activations (Table 2) and t and z values of the peak intensity (Table 3) in the group analyses across the methods were higher in the 10-minute study compared with the 6-minute study. For example, the pooled variance group analysis t scores for the 6-minute data were 27%, 23%, and 9% smaller than the 10-minute data in motor cortex, cerebellum, and SMA, respectively. The changes in the z scores between the 6- and 10-minute studies were greater for ANCOVA than they were for proportional scaling (Table 3, group analysis). In addition to group analyses with eight subjects, group analysis of subjects 1 through 4 (who had first 6- and then 10-minute studies) and subjects 5 through 8 (vice versa) were carried out. The larger clusters of activation (Table 2) as well as the higher values of local maxima (Table 3) were obtained from the 10-minute data sets across statistical methods, indicating that the order of the 6- and 10-minute interscan intervals did not influence the results.
Additional analyses
Influence of the number of repetitions on the magnitude of activation. Results obtained from the group analysis (pooled variance and SPM-proportional scaling) of eight subjects indicated that increasing the number of repetitions of conditions (motor and rest) increased the t and z values for all regions. Results obtained with the pooled variance technique are illustrated in Fig. 3. Both t statistics and the differences in normalized CBF values indicate that the 10-minute interscan interval results in a greater signal; however, the differences in t values between the 6- and 10-minute studies remained relatively constant and were approximately parallel over the number of repetitions. Figure 3 illustrates that increasing the number of repetitions in the 6-minute study can compensate for this apparent signal loss. In motor cortex and cerebellum, three repetitions in the 6-minute study yields approximately the same t values as that produced by a single repetition in the 10-minute study, and five repetitions in the 6-minute study approximates the t values from two repetitions in the 10-minute study. For SMA, the increase in t with repetitions was less dramatic (see Discussion).
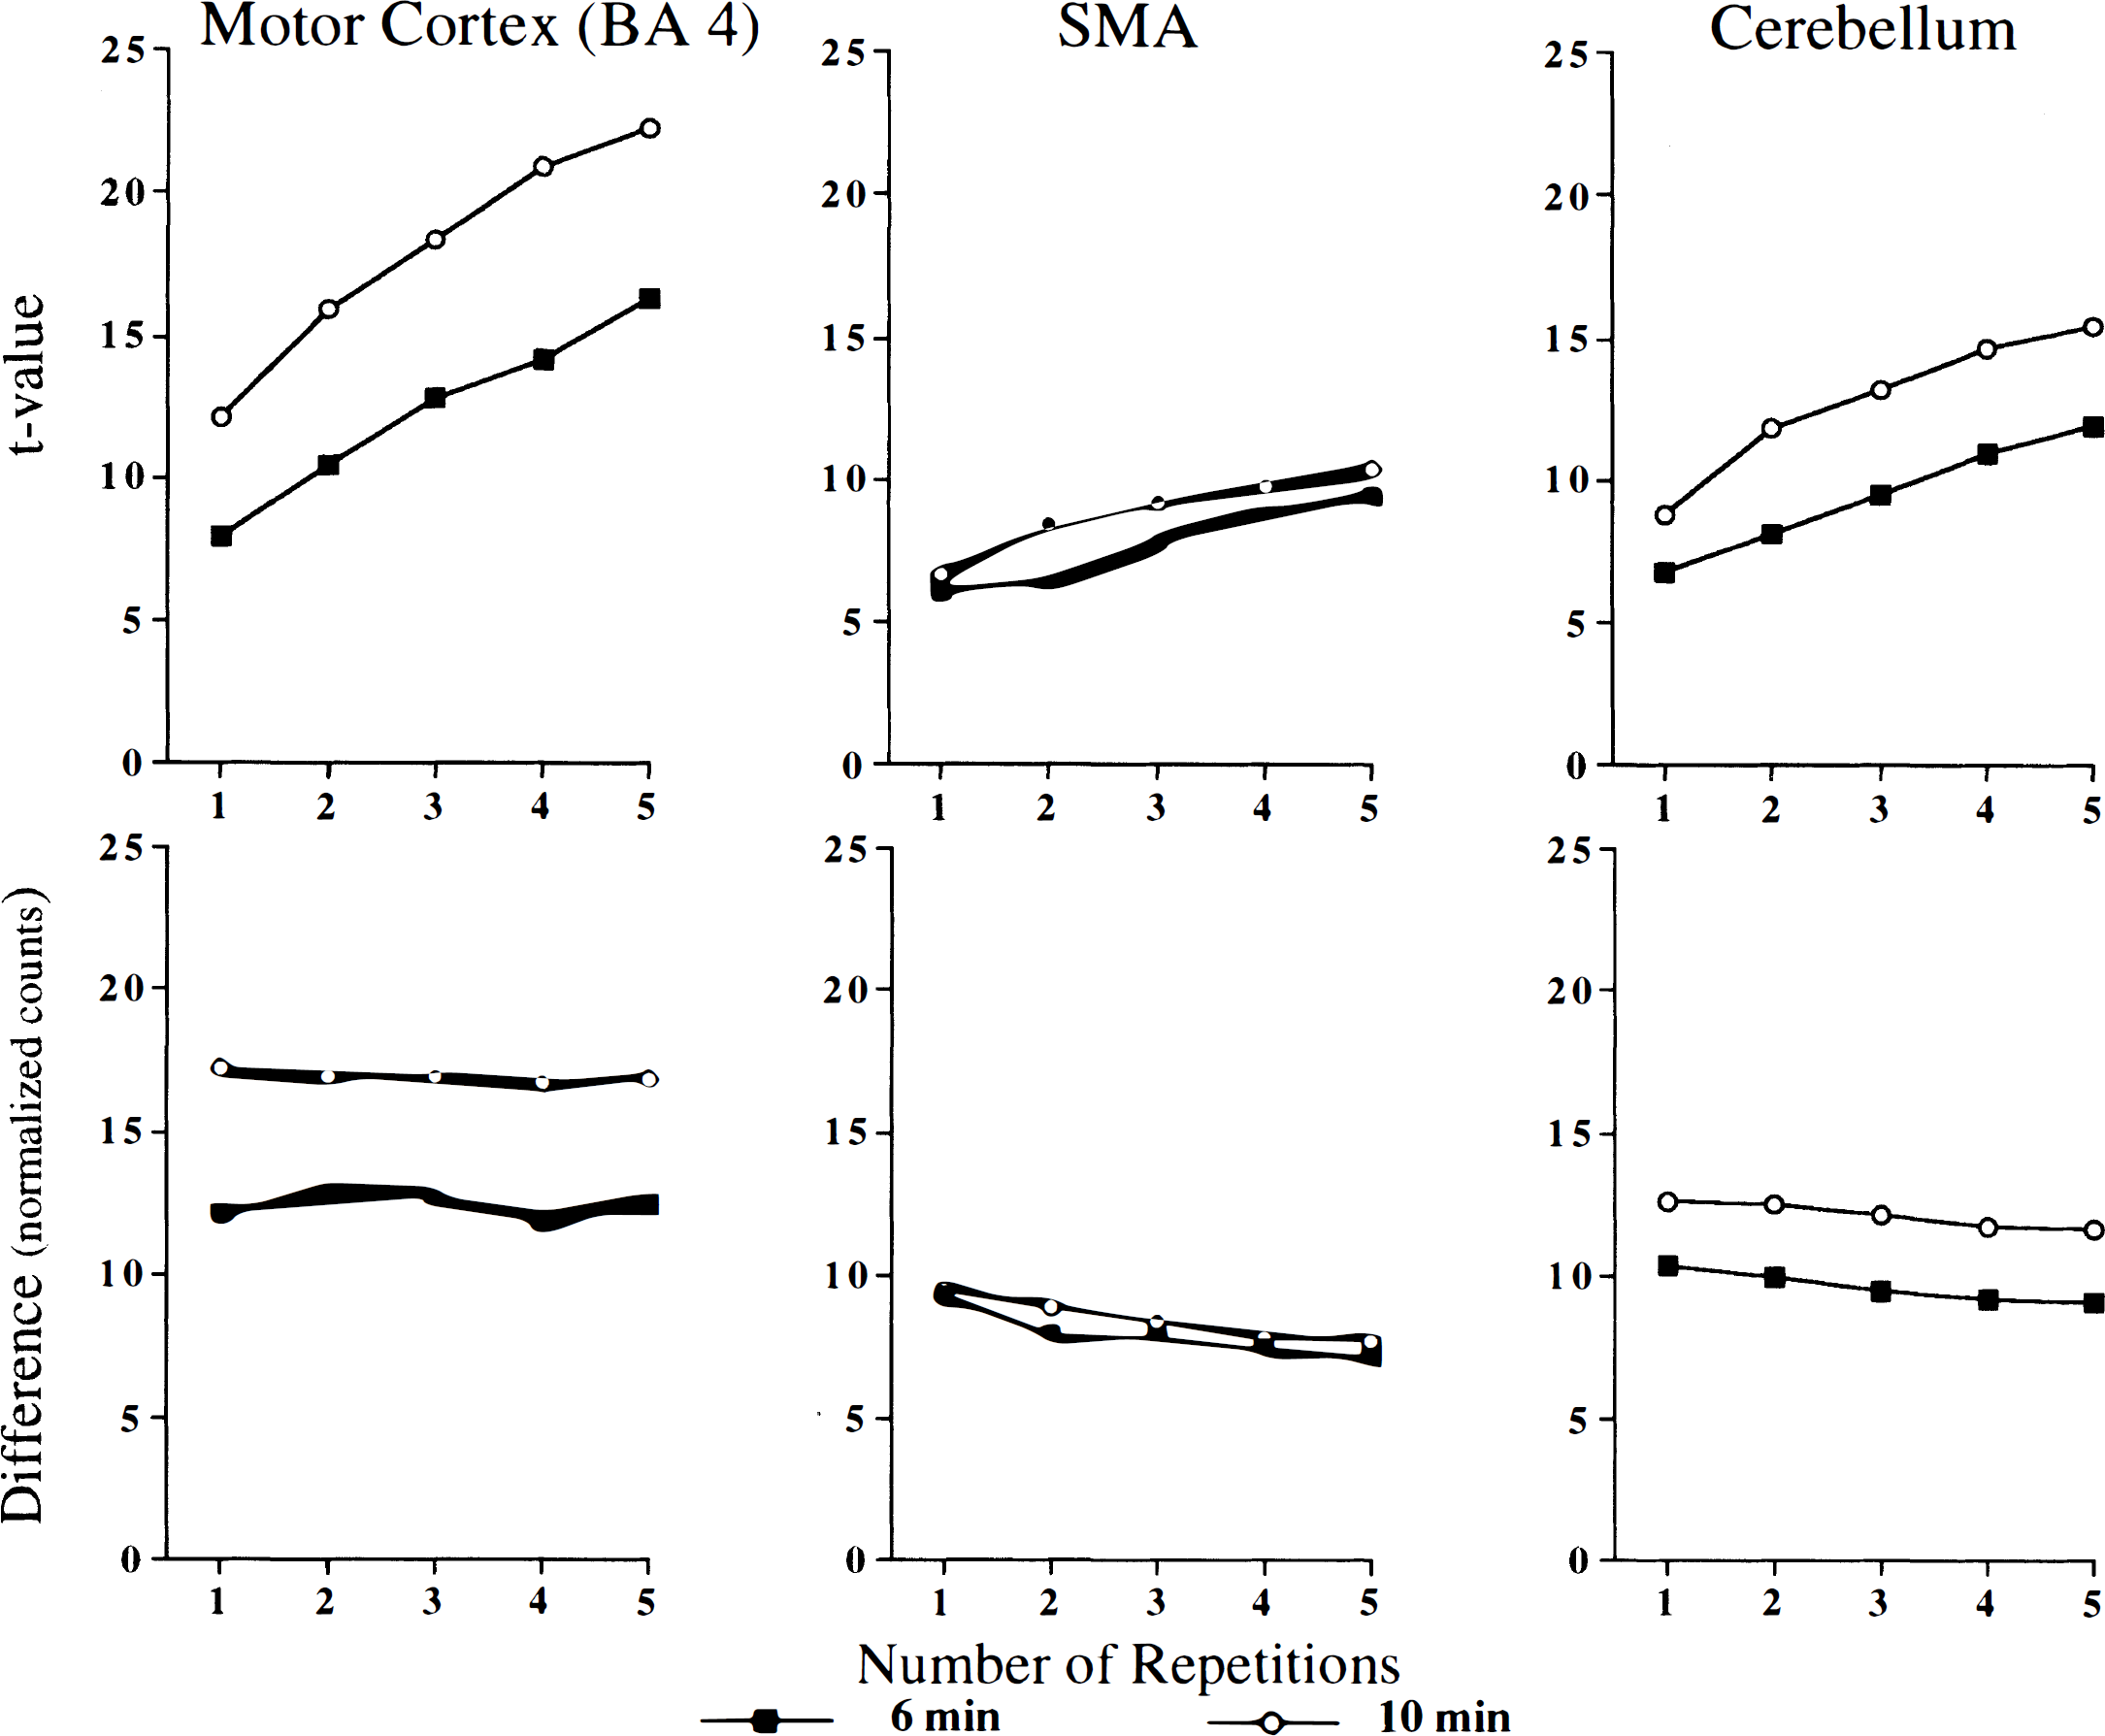
Influence of the number of repetitions of motor and rest conditions on the magnitude of activation of the motor cortex, SMA, and cerebellum. Group analysis (eight subjects) was performed using the pooled variance method. Both t statistics and differences in normalized radioactivity values between motor and rest scanning conditions indicate that the 10-minute interscan intervals result in a greater signal. For both the 6- and 10-minute interscan intervals, the t values were approximately parallel for the number of repetitions, indicating that increasing the number of repetitions can compensate for the signal loss observed with the short interscan intervals.
Differences in activation levels. This analysis tested whether there was a statistically larger activation (motor – rest) measured for the 10-minute interscan interval compared with the 6-minute interval. Analysis using SPM 95 showed one significant local maximum in the ipsilateral cerebellum (x = 12, y = −62, z = −16; z = 4.25). With pooled variance analysis, two significant clusters with significant local maxima were located in the cerebellum (x = 26, y = −74, z = −26; t = 5.24; and x = −48, y = −60, z = −32; t = 4.4). Also, by pooled variance, a significant cluster over the posterior cingulate cortex was detected.
Background analysis. Group analysis, using pooled variance, performed on the background scans from 6-minute studies (background after motor task versus background after rest) showed the presence of a few significantly activated local maxima with the t value around 5. No significant clusters were detected. Figure 4 illustrates the distribution of the local maxima over the brain, some of which are located in the cerebellum, none in the SMA or primary motor cortex. This suggests that there are no important differences in the residual background after motor and rest scans.
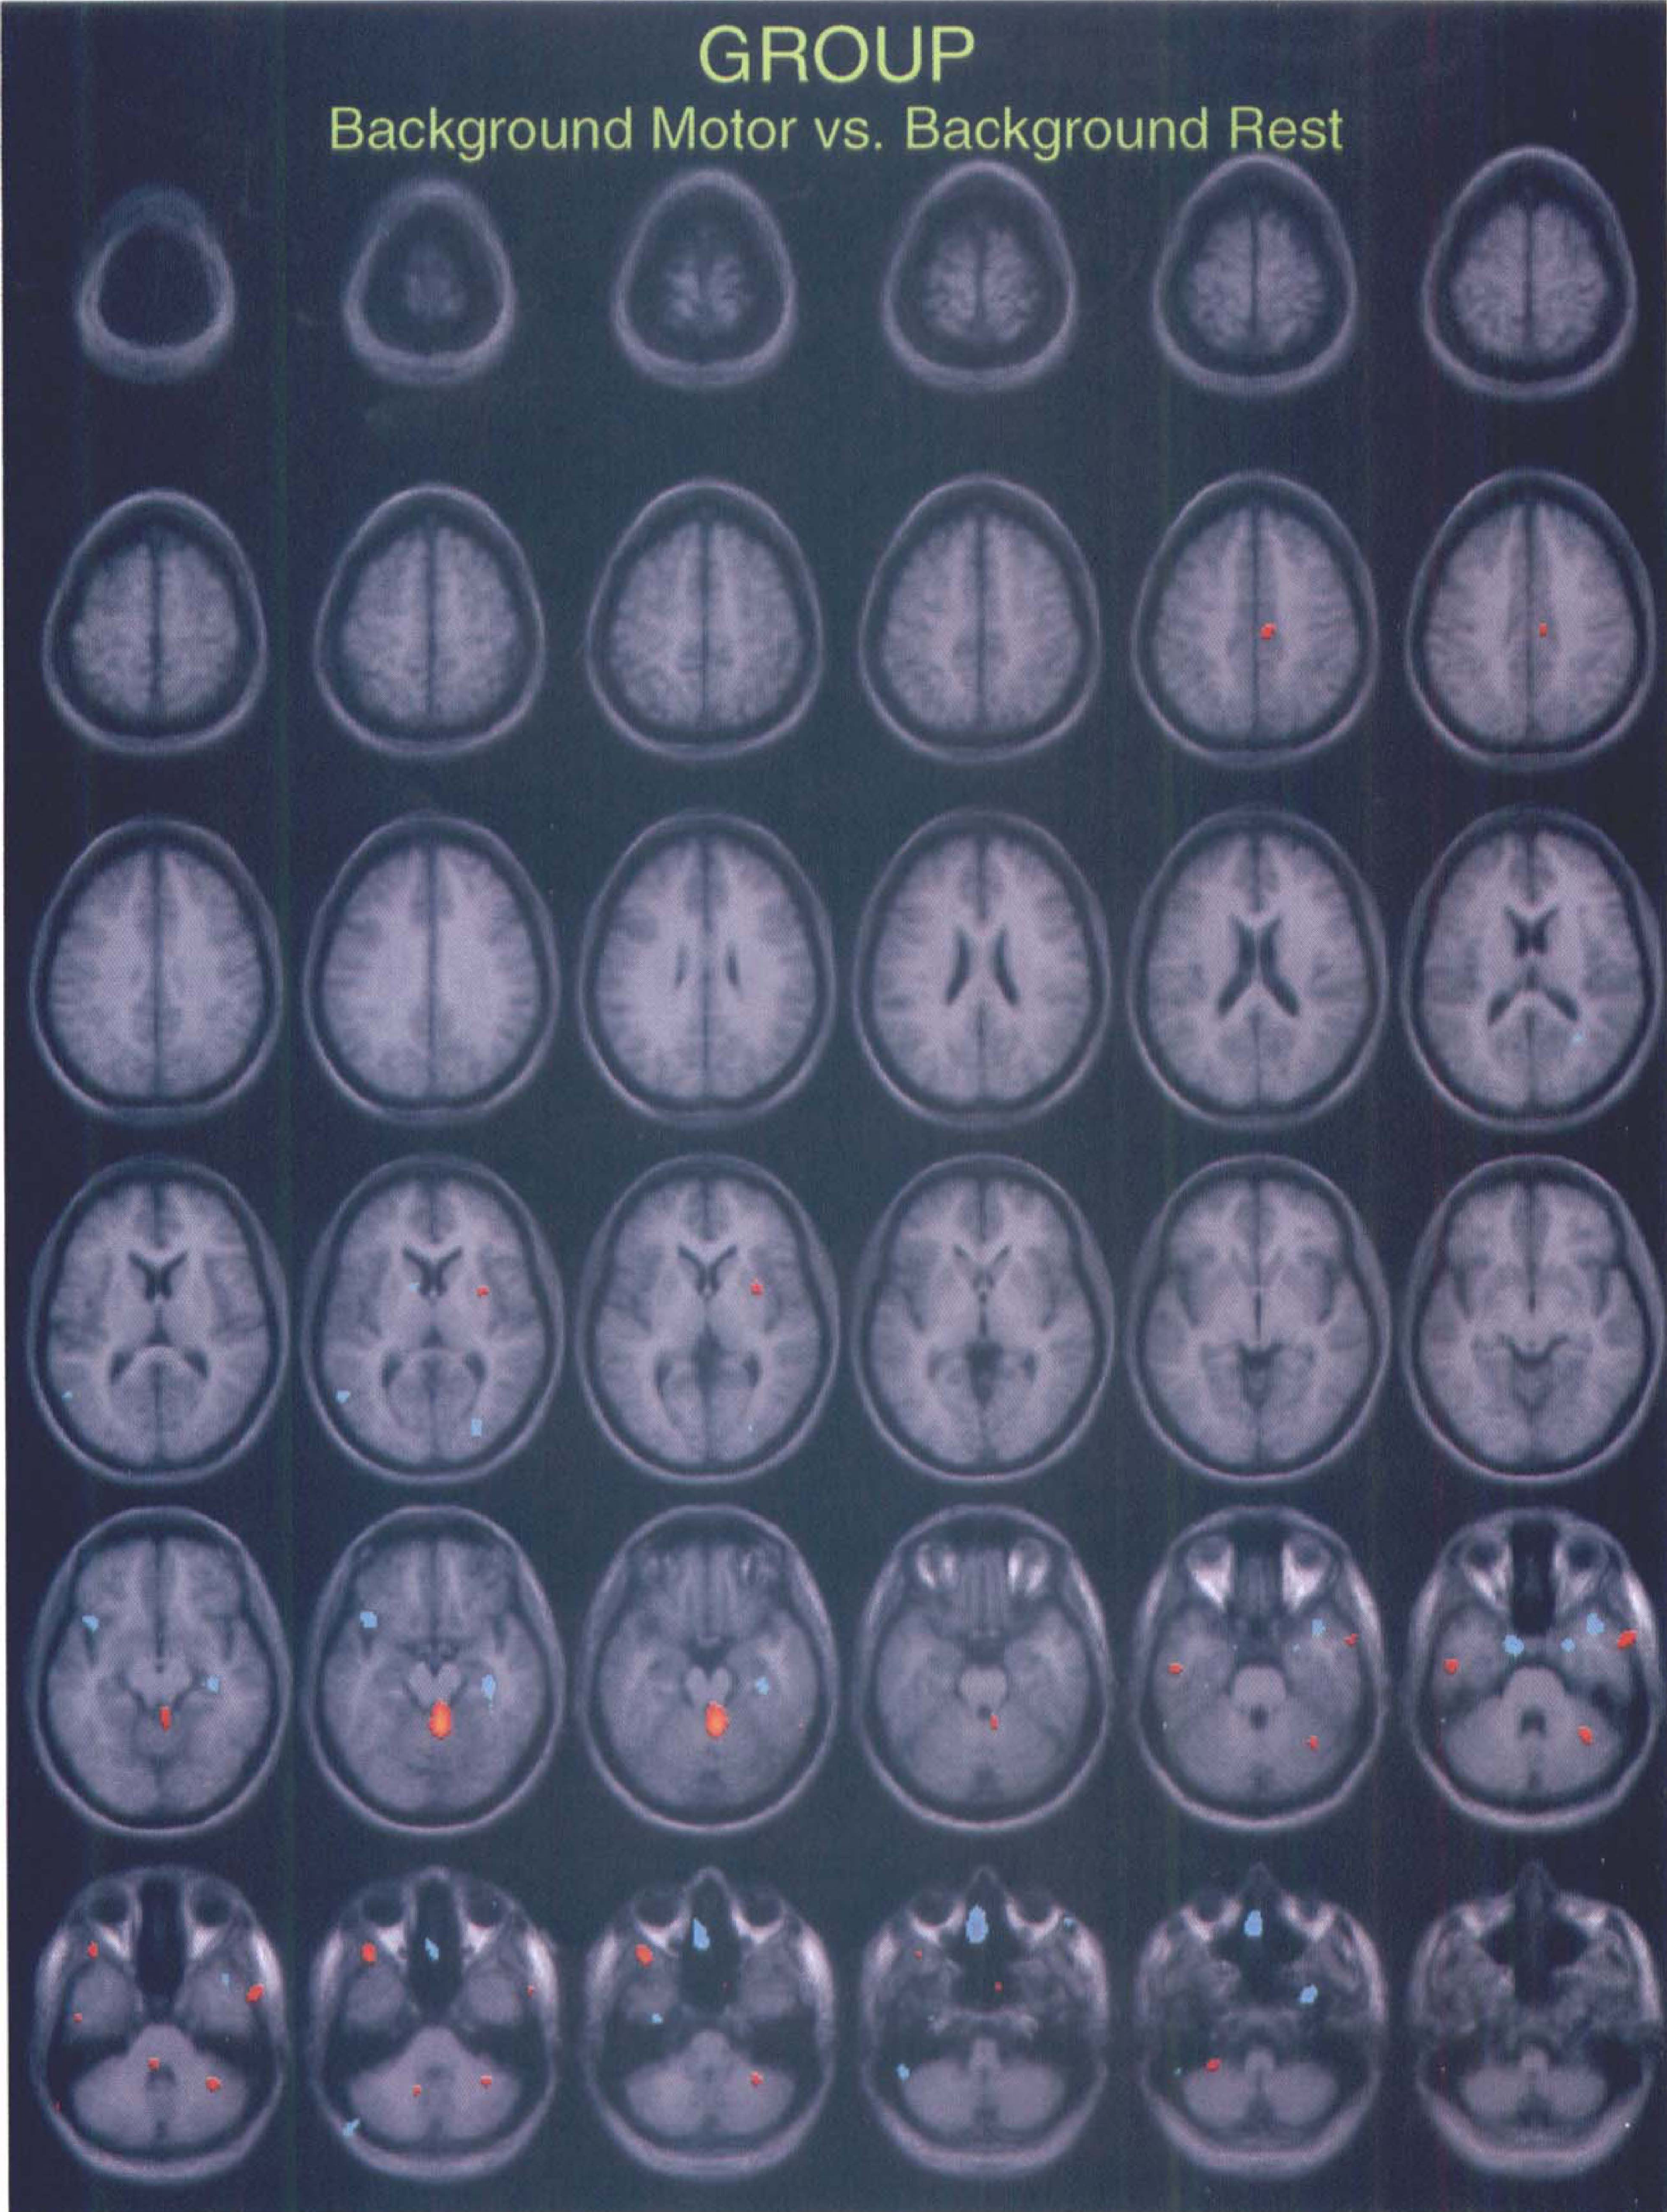
Group analysis of the background scans collected in the 6-minute study. Scans after motor activation were compared with scans after the rest condition. Some significantly activated local maxima over the cerebellum are visible, but not in the primary motor cortex or the SMA. (A threshold of t =4 was applied to detect the local maxima.) No significant clusters were detected at a threshold of t = 3.09.
Gray matter standard error of the mean. The pooled standard error of the mean in the group analysis (eight subjects) was very similar for the 6- and 10-minute studies, i.e., 0.761 and 0.752, respectively. In the single-subject analyses, there was no statistical difference for the pooled gray matter standard error for all eight subjects between the scans with 6- and 10-minute interscan intervals (6-minute mean, 1.77; 10-minute mean, 1.71; t = 0.84; P = 0.42), There was also no statistical difference between the first and second group of 10 scans (difference, 0.17 ± 0,17; t = 1.87; P = 0.10).
Simulation studies of the reduction in t values
The mean tissue count values in the cerebellar voxel midway between the peak locations of the 6- and 10-minute pooled variance group analyses were 127.6 and 116.4 for the 10-minute motor task and rest, respectively, and 125.4 and 116.6 for the 6-minute motor task and rest (values normalized so that the gray matter mean equaled 100), Thus, the observed magnitude of activation was 11.2 and 8.9 in the 10- and 6-minute scans, respectively, a 21% reduction in signal strength. The normalized tissue counts for the 10-minute studies corresponded to CBF values of 86 and 75 mL·min−1·100 g−1 for the task and rest conditions, respectively (assuming gray matter mean CBF is 60 mL·min−1·100 g−1). Simulations of the 6-minute studies with these flows predicted a measured magnitude of activation (difference in normalized counts) of 10.4, only a 7% reduction in signal strength from the value of 11.2. Very similar predicted reductions (6.6% to 7.6%) were found when activations in primary motor cortex, SMA, and thalamus were simulated.
An additional contribution to the t value is interscan noise. The pooled variance estimate of the standard error was only 1% higher for the 6-minute than the 10-minute scans (0.761 versus 0.752). To determine the noise difference in the [15O]water scans with 6- and 10-minute interscan intervals, we compared the measured noise-equivalent counts (NEC) (Strother et al., 1990). There was no significant difference in NEC between these scans: 3.30 × 10⁶ versus 3.22 × 10⁶ for 6- and 10-minute scans, respectively. This corresponds to a 2.3% higher NEC for the 6-minute scans, which should have corresponded to a 1.1% reduction in noise in these studies. Because the NEC values account for variation only caused by counting statistics and ignore effects of image registration and physiologic variation, it appears that there was no difference in noise between 6- and 10-minute intervals. Thus, with a 7% predicted loss in signal strength and the assumption of equal noise, the simulation predicts that t values should be reduced by only 7%.
DISCUSSION
Summary
Short interscan [15O]water PET studies offer several potential advantages (Chmielowska et al., 1998). They substantially increase the number of scans that can be performed during a single session. This allows the possibility of improving single-subject analyses or reducing the overall duration of the PET session, which is important when studying poorly cooperative subjects, such as children. However, the shorter 6-minute interscan interval introduces residual radioactivity. Therefore, care must be exercised when comparing these results with those obtained using the conventional 10- to 12-minute intervals.
The activation maps (demonstrating activation of the contralateral primary cortex, SMA, and cerebellum) obtained with 6- and 10-minute interscan intervals showed considerable similarity in the eight single-subject analyses and were highly consistent in the group analyses (eight subjects) across the applied statistical methods. Similarly, the location of the peak activation within these major activated brain regions was highly consistent between the 6- and 10-minute data sets. In addition, the location of maxima typically did not differ by more than one voxel.
A difference in the cluster size of the significantly activated brain regions and in the t or z values of peak activation in these regions was observed between the 6- and 10-minute data sets. In most single-subject analyses and in the group analyses across the applied statistical methods, the 10-minute studies had larger clusters for the activated structures and higher values of peak activations. The effect of order, i.e., whether the 6-minute or the 10-minute study was performed first, had no apparent effect on the appearance of the activation maps.
Methodological considerations
Previously, we explored how subtracting the residual radioactivity from the previous injection affected single-subject and group analyses of a motor task (Chmielowska et al., 1998). We found that with consistent injected doses and timing, similar results were obtained with the motor task in both individual and group analyses whether or not the background was subtracted. Because the methodology for the 6-minute data sets in the present study was very similar to that of the previous study (i.e., same PET scanner, with constant injected doses and timing of the interscan intervals), we concentrated here on comparing the 6- and 10-minute interscan interval data without subtracting background residual radioactivity. We did perform background subtraction for one single-subject analysis (data not shown) and found excellent agreement between corrected and uncorrected data, consistent with our previous study (Chmielowska et al., 1998).
Recent studies on the effect of sample size in individual PET data sets (Gold et al., 1997; Grabowski et al., 1996; Vitouch and Gluck, 1997) led us to perform single-subject analyses using only the pooled variance method (Worsley et al., 1992). In our previous study, we found that the pooled variance method exhibited greater statistical power and was more appropriate for individual analyses than either ratio or ANCOVA—normalized SPM analyses (Chmielowska et al., 1998). With a larger sample size in the group analyses in both the previous and current studies, there was greater consistency in the results across the applied statistical methods.
The results shown in Fig. 3 stress the importance of multiple repetitions of each task, even for group analyses. In a group analysis, the total variance is composed of both intersubject and intrasubject variance. Increasing the number of repetitions decreases only the intrasubject variance. If there were no intersubject variance, the increase in t would be proportional to the square root of the number of repetitions. For motor cortex and cerebellum, this is nearly the case (Fig. 3), in that t values for four repetitions are nearly double those of a single repetition. This suggests that for this motor task, the intersubject variation is small compared with intrasubject variation, so that increased statistical power can be achieved in group analyses by increasing the number of repetitions. Because this effect is less evident in SMA, our data suggest that intersubject variation in the SMA response may be larger than that in either motor cortex or cerebellum.
There are a number of factors that could affect the results of the 6- and 10-minute interscan interval studies. In performing this comparison study, we were very careful to (1) totally randomize all eight individual studies for the order in which the task was performed; (2) divide the eight subjects into two groups, with four individuals first performing the 6-minute study followed by the 10-minute study, and with the remaining four individuals carrying this out in reverse order; (3) have all subjects (with the exception of one) perform the entire study without interruption and without changing head position; and (4) have the subjects spend the same amount of time in the PET scanner.
In considering physiologic mechanisms that might be responsible for a difference in the magnitude of activation between the 6- and 10-minute studies, it might have been expected that the same number of injections performed in a shorter time would, in fact, improve the subject's cooperation and attention. Clearly, this was not observed in our data; however, such an effect may be highly task-dependent. Typically, subjects complained of fatigue in the last part of the study, regardless of whether the 6- or 10-minute study was actually performed. A study by Stapleton et al. (1997) showed that glucose utilization was higher during the first PET session than during the second session several days later in subjects with low anxiety levels. However, subjects with high anxiety showed similar metabolism in both PET sessions. There is very little PET literature that compares data from short- and long-duration studies. Rather, neuronal habituation effects caused by prolonged brain activation in PET studies with the same 10-minute intervals have been examined (Bandettini et al., 1997; Buxton and Frank, 1997; Villringer and Dirnagl, 1995).
Maximizing statistical power
The critical question is whether a 6-minute interscan interval provides more statistical power than a 10-minute interscan interval. To compare these, let us assume that the same total time in the scanner room is used for both the 6- and 10-minute interscan intervals. Furthermore, because of the greatly reduced [15O]water dose that is required for three-dimensional scanning, we assume that the higher radiation exposure because of the increased number of injections with 6-minute scanning does not exceed the appropriate dosimetry limits.
In these studies, the level of statistical significance for the same number of scans with the 6-minute interscan interval was lower than that with the 10-minute interscan interval. For example, for the pooled variance group analysis, the peak t values were reduced in the primary motor cortex, SMA, and cerebellum by 27%, 9%, and 23%, respectively (Table 3). We further evaluated this effect by creating a scatter plot (one point per voxel) of the mean activation for 10-minute studies versus that in the 6-minute studies (data not shown). This plot showed a linear relationship between the two studies with a slope of 0.79, i.e., a 21% reduction in signal strength in the 6-minute studies.
To compensate for the apparent signal loss with the 6-minute interscan interval, an increased number of repetitions (n) is required. Increasing the number of repetitions decreases the standard error of the mean and accordingly results in greater t values, as the t value is inversely proportional to the square root of n. This is the case for single-subject analysis and, if intersubject variation is small, for group analyses as well. Assuming a mean reduction of 21% in t values, it is straightforward to show that the number of runs with a 6-minute interscan interval must be increased by 60% [1/(1 − 0.21)2] to achieve equal t values. If this is done, the total scanning time for a subject would be nearly identical for the 6- and 10-minute intervals. For example, the total time to perform 10 scans (five rest/activation pairs) with a 10-minute interscan interval is equal to the time to perform 16 scans (eight rest/activation pairs) with a 6-minute interscan interval. This suggests that there is no advantage to the 6-minute method.
However, for single-subject analyses that are based on a local variance estimate such as SPM (Friston et al., 1991), there would be an advantage for the 6-minute approach, as the critical values for statistical significance of the t statistic are smaller for larger n. For example, consider a voxel with a t statistic of 3.747 from five rest/activation pairs. This corresponds to a one-tailed P value of 0.01 with four degrees of freedom. If eight rest/activation pairs were performed with a 6-minute interscan interval, the t statistic would be expected to be unchanged (21% smaller signal compensated by increased n), but because of the increased degrees of freedom (7), the P value would be improved to 0.0036. Thus, increasing the number of repetitions by using a shorter interscan interval should increase the statistical significance in single-subject analyses. (This will not be the case in group analyses, in which the number of degrees of freedom is already large with the 10-minute interscan interval and increasing it further provides only a small increase in statistical significance; nor would it be the case for single-subject analyses using a pooled variance estimate.)
Alternatively, a small increase in the number of task repetitions using a 6-minute interval could provide results with a P value comparable to that with a 10-minute interval while decreasing the overall scanning duration; this experimental design would have a lower t value with somewhat more degrees of freedom. For example, continuing the above illustration of an analysis based on a local variance estimate, six rest/activation pairs done with a 6-minute interval would result in a P value of 0.011, with a t value of 3.24 and five degrees of freedom. Therefore, with a small increase in the number of scans, one can considerably shorten the overall study duration of single-subject experiments with a 6-minute interscan interval while maintaining a comparable level of statistical significance.
We performed simulations to determine whether the magnitude of the observed reduction in t values with the 6-minute interscan interval was consistent with that predicted from the presence of background activity and knowledge of the tracer kinetic characteristics of [15O]water. These simulations predicted a 7% reduction in signal strength in cerebellum and very similar reductions (6.6% to 7.6%) in primary motor cortex, SMA, and thalamus. We found no difference in noise between the 6-minute and 10-minute interscan intervals. Therefore, the simulation predicted that t values should be reduced by only 7%. If so, the number of runs with a 6-minute interscan interval must be increased by only 16% [1/(1 − 0.07)2] to achieve equal t values to the 10-minute scans, in which case the total scanning time for the subject would be substantially reduced with the 6-minute method.
It may be that the discrepancy between the measured 21% reduction in t and the predicted 7% reduction is simply a result of the variability in t values between repeated experiments. The t statistic with a large number of degrees of freedom, by definition, has an expected SD of 1.0 (higher for a small number of degrees of freedom). If so, the difference in t values between two independent studies would be expected to have a SD of √2. In light of this, the fact that the 10-minute t values exceeded the 6-minute values by more than the predicted 7% (Table 3) may be attributed to random chance, except, perhaps, in the pooled variance group analysis for motor cortex. Alternatively, the discrepancy between the model predictions and the differences in the magnitude of the activation results with 6- and 10-minute interscan intervals in motor cortex might suggest that there is some inadequacy in the tracer kinetic model, particularly at late times after injection for which the current model predicts a transient equilibrium of the high flow brain regions with blood radioactivity.
From these results, it appears that the 6-minute interscan interval will provide more statistical power than a 10-minute interscan interval for single-subject studies using a local variance estimate, given the same total scanning time. Alternatively, with a small increase in the number of scans and the use of a 6-minute interscan interval, one may shorten the study duration while maintaining a comparable level of statistical significance. Note that we did not explicitly demonstrate these effects, as our study design used an equal number of replicates with the 6-minute and 10-minute intervals. Thus, additional 6-minute versus 10-minute comparison studies, perhaps using more complex cognitive tasks rather than a simple motor task, will be necessary to show more directly an advantage for the 6-minute interscan interval approach in single-subject analyses.
Footnotes
Abbreviations used
Acknowledgments
The authors thank the members of the Positron Emission Tomography Department, Clinical Center, National Institutes of Health, for their expertise; Devera G. Schoenberg, MS, Office of the Clinical Director, National Institutes of Neurological Disorders and Stroke, National Institutes of Health, for skillful editing; and Dr. Roger Woods and the Montreal Neurological Institute investigators for sharing their software.