
Abstract
Use of short interscan interval [15O]water positron emission tomography (PET) studies reduces the overall study duration and may allow an increased number of scans for single-subject analysis of unique cases (e.g., stroke). The purpose of this study was to examine how subtraction of residual radioactivity from the previous injection (corrected scan) compared to nonsubtraction (uncorrected scan) in a PET short interscan interval (6 minutes) study affects single-subject and group data analysis using a motor activation task. Two currently widely used analytic strategies, Worsley's method and the SPM technique, were applied. Excellent agreement between activation maps obtained from corrected and uncorrected data sets was obtained both in single-subject analyses performed on data sets from the six normal subjects and three stroke (subcortical infarct) patients, and in group analysis (six normal subjects) within a particular statistical method. The corrected and uncorrected data were very similar in the (1) number of activated brain regions; (2) size of clusters of activated brain voxels; (3) Talairach coordinates of the activated region; and (4) t or Z value of the peak intensity for every significantly activated motor brain structure (both for large activations such as in motor cortex and small activations such as in putamen and thalamus). [15O]Water PET data obtained with a short interscan interval (6 minutes) produce similar results whether or not the background is subtracted. Thus, if injection dose and timing are constant, one can achieve the advantage of a short interscan interval without the added complexity of correcting for background radioactivity.
Positron emission tomography (PET) can be used to measure changes in regional CBF (rCBF) related to local brain activity during normal motor, sensory, or cognitive performance as well as to study the activity in patients with various neuropathologic conditions. Different approaches have been developed to improve the sensitivity of the PET technique. For example, increased sensitivity of PET cameras has been achieved by removing the interplane septa allowing three-dimensional acquisition (Cherry et al., 1993). As a result of this increased sensitivity, the radiation dose per injection can be decreased, and more scans per subject can be performed. Another possible improvement of the PET technique, important in some studies, would be to have a shorter time interval between the scans. The time interval between repeat administrations of [15O]water in PET studies is typically about 10 to 12 minutes to allow the radioactivity to decay to an insignificant level. Unfortunately, this long interscan time, and thus the long overall study duration, is difficult to tolerate in some studies, especially those involving children. Additionally, it is difficult to obtain sufficient patient cooperation to collect enough scans for single-subject analysis of unique cases (e.g., stroke).
A method to perform rapid sequential quantitative measurements of rCBF by including the presence of background radioactivity in the tracer kinetic equation was described by Herscovitch et al. (1991). Subsequently, this approach was extended to relative rCBF measurements on the GE Advance 3-D tomograph (General Electric Medical Systems, Waukesha, WI, U.S.A.) (Eden et al., 1996). The interval between [15O]water injections was reduced to 6 minutes, and one 60-scan frame was acquired, starting 1 minute before the injection, to record the residual radioactivity from the previous injection. This study has shown that the analysis performed on background uncorrected and corrected data sets resulted in similar activation patterns. Comparable approaches have been described to measure rCBF with xenon-133 administered by intracarotid injection (Risberg and Ingvar, 1972) and also for repeated measurements of regional glucose metabolism with [18F]fluorodeoxyglucose (Chang et al., 1987). In another recent report, Egan et al. (1996) collected dynamic scan data over 5.5 minutes after [15O]water administration in both rest and activation conditions. The investigators noted that while comparison of the early data showed areas of activation, there were no significant rCBF changes when late (last 2 minutes) frames were compared. Egan et al. suggested that the period between repeated infusion of [15O]water in PET activation studies could be reduced to 5 minutes, and possibly even less, depending on the activation paradigm, with little apparent effect on the activation pattern. The above-mentioned studies were performed while analyzing group data sets.
In the present study, we have further explored how subtraction of residual radioactivity (“corrected”) compared to nonsubtraction (“uncorrected”) in a PET study with a 6-minute interscan interval affects data in both a single-subject analysis and a group analysis. This study was designed to determine whether the background subtraction for PET scans performed with a short interscan interval was actually necessary. If not, the advantage of a short interscan interval could be achieved without the added complexity of correcting for residual radioactivity. We compared uncorrected and corrected individual data sets of both normal subjects and stroke (subcortical infarct) patients. A group analysis of six normal subjects was also performed. To perform these analyses, we applied two widely adopted statistical strategies: (1) the Worlsey et al. (1992) method, using proportional global CBF normalization and pooled variance; and (2) statistical parametric mapping (SPM) with analysis of covariance (SPM-ANCOVA) adjustment or SPM-proportional scaling and local variance estimate (Friston et al., 1991, 1994). Our primary goal was to examine the effect of background subtraction on the analysis of activation data. However, by using three different methods of analysis, we also had the opportunity to compare their performance in the same data set.
MATERIALS AND METHODS
Subjects
Six healthy normal volunteers (ages 24, 26, 36, 68, 74, and 75 years) and three stroke patients (ages 65, 68, and 75 years) with subcortical infarcts located in the left internal capsule were studied with [15O]water and PET while they performed a motor task. Infarct location in the patients was determined by T1 and T2 magnetic resonance imaging. The protocol was approved by the National Institute of Neurological Disorders and Stroke Institutional Review Board; all subjects gave their written informed consent for the study. All subjects had physical examinations and medical histories.
Motor task
Both normal subjects and stroke patients performed the same motor task during the [15O]water PET acquisition. The subjects performed each of the three tasks with their eyes closed: finger extension of the left hand at 1 Hz, paced with a metronome; finger extension of the right hand at 1 Hz, paced with a metronome; and the rest condition, also with the sound of the metronome. Each task was repeated five times. All subjects had received one practice session 30 minutes before the actual study. Normal subjects performed the motor task before and during an actual study without any difficulty, while the stroke patients exhibited some difficulty performing the motor task with their right, affected hand. Performance accuracy was assessed by observation. The order of the different movements and rest tasks was completely randomized across all 15 scans in all subjects.
PET data acquisition
For each subject, 15 scans (5 scans for each of the three tasks described above) were collected using a GE Advance 3-D tomograph. Changes in rCBF were assessed using images obtained by summing the activity during 60 seconds after the first detection of radioactivity in the head after the intravenous bolus injection of 10 mCi of [15O]water. A 1-minute background scan was acquired starting ~90 seconds before each injection. The interscan interval between the injections was 6 minutes compared to the usual 10 to 12 minutes. The average times (± S.D.) between injections were as follows:
Subject No. 1: 6.05 ± 0.0 minutes
Subject No. 2: 6.00 ± 0.01 minutes
Subject No. 3: 6.01 ± 0.01 minutes
Subject No. 4: 5.99 ± 0.03 minutes
Subject No. 5: 5.99 ± 0.01 minutes
Subject No. 6: 5.98 ± 0.02 minutes
Subject No. 7: 6.00 ± 0.01 minutes
Subject No. 8: 5.99 ± 0.04 minutes
Subject No. 9: 6.01 ± 0.02 minutes
The metronome-paced task was initiated 30 seconds before injection of tracer. Arterial blood was not sampled.
Images were reconstructed using the reprojection algorithm of Kinahan and Rogers (1989). A Hanning filter (cutoff at 0.25 mm−1) was used in the transverse direction; a ramp filter (cutoff at the Nyquist frequency) was applied in the axial direction. The transverse and axial spatial resolutions with these filters were measured at 6.5 mm and 6 to 7 mm, respectively. The images were reconstructed into a 128 × 128 × 35 matrix with 2 mm × 2 mm × 4.25 mm voxels. A measured transmission scan was used for attenuation correction. Scatter correction was performed by Gaussian fitting of the projection data (Stearns, 1995). Random coincidences were measured by the delayed coincidence technique and subtracted in real-time. Corrections for detector normalization and deadtime were also applied. Background and [15O]water scans were decay-corrected to a common time.
PET image processing
The [15O]water and background scans of each subject were preprocessed as follows. The first PET scan was centered and rotationally corrected using an iterative automatic procedure based on a previously described method (Minoshima et al., 1992). The remaining scans were registered to this corrected first scan using another iterative method (Woods et al., 1992). Background scans were resampled using the same translations and rotations applied to the PET scan that immediately followed. Thus, all PET and background scans were co-registered; all scans were resampled exactly once.
To reduce noise, each background scan was first normalized to a mean of 1.0 and then all background scans were averaged. Background subtraction was performed in the following manner. Let “u” be the original uncorrected voxel value of the PET scan before background subtraction; “b” be the value of the voxel in the average background scan at the same spatial location; and nb be the normalization factor (i.e., the mean value) for the background scan that immediately precedes the water scan to be corrected. The corrected local tissue count, “c”, was then calculated as follows:

where Δt is the time difference between the midpoints of the background and [15O]water scans and 0.1 is the clearance rate (min−1) of the [15O]tracer due to washout. This rate was obtained by averaging the blood clearance rates of [15O]water for 4 to 8 minutes after injection in healthy normal subjects (Carson et al., 1987). The correction assumes that brain voxels (particularly gray matter) are clearing at the same rate as plasma, i.e., transient equilibrium. Note that the background corretion avoids introducing noise by using the average background image while maintaining an accurate correction because it uses the scale factor from each individual background scan. The correction was performed for all voxels in all PET scans, except for the first PET scan, generating scans corrected for residual activity from the preceding injection.
PET data analysis
The corrected and uncorrected data sets were spatially normalized and smoothed (15 mm full width half maximum) using the Statistical Parametric Mapping (SPM 95) software package (Friston et al., 1991, 1994, 1995). Then, single-subject analysis was performed on data from six normal subjects and three stroke patients. Group analysis was performed on the data from the same six normal subjects. All data sets were analyzed three times, using the following analytic strategies.
Proportional normalization (ratio) for global counts and pooled variance was used for the test statistics generation (Worsley et al., 1992). Briefly, normalization was accomplished by dividing each voxel by the average of all gray matter voxels for each PET volume. Gray matter voxels were identified by thresholding the average of each subject's 15 PET scans. Differences between motor and rest conditions were calculated and converted to t-statistic data using a pooled variance estimate, according to Worsley et al. (1992). However, the pooled variance was calculated from gray matter voxels alone rather than from all intracerebral voxels. Gray matter variance has been noted to be greater than white matter variance, and, as such, is a more conservative estimate of variance than whole brain variance (Grabowski et al., 1996). Furthermore, a pooled gray matter variance estimate better represents the variance of the brain areas most likely to exhibit meaningful CBF changes while preserving high effective degrees of freedom for t-statistic calculations. The effective degrees of freedom of the t-statistic computed with pooled gray matter variance are assumed to be sufficiently high so that the ensuing t-statistic can be treated as a Gaussian variate. Two tests were used to assess the regional significance: one to detect high-intensity signals (local maxima exhibiting t-statistic values exceeding a threshold of 4.0 were considered to reflect meaningful rCBF changes), and another was based on the spatial extent (the significance of the voxels exceeding a t value of 3.09 was then determined on the basis of the spatial extent of activation according to Friston et al.[1994]).
SPM 95, using proportional scaling for global CBF normalization and a local variance estimate, was used for the test statistic generation (Friston et al., 1991, 1994).
SPM 95, using ANCOVA adjustment for global CBF normalization (Friston et al., 1991, 1994) was also used.
Using SPM 95, single-subject analysis was performed using a within-subject Student's t-test (the single-subject replication of condition), while group analysis was performed using a blocked design (the multisubject replication). The resulting t-statistics from the models used in SPM are transformed to equivalent normal ordinates, “Z”, and as such, are directly comparable in terms of significance with the t-statistics from the Worsley approach. Because the SPM t-statistics are “Gaussianized,” and the Worsley t's are considered to have sufficient effective degrees of freedom to be normal, this equates to using identical thresholds: 4.0 for identification of “meaningful” rCBF changes, 3.09 for suprathreshold cluster identification. Those thresholds were applied for both single and group analyses.
To assess the influence of background subtraction on the ability to detect brain activation correctly, the following measures were used: (1) comparison of the spatial location of statistically reliable local maxima in the motor cortex (the three-dimensional distance between the locations of local maxima in corrected and uncorrected scans was calculated); and (2) comparison of the size of clusters of significantly activated voxels in background corrected and uncorrected scans. Statistically reliable differences in both location and cluster size were determined by paired Student's Mests.
RESULTS
Results of all analyses show excellent agreement between activation maps obtained from corrected and uncorrected data sets within a particular statistical method. An example of typical activation maps for corrected and uncorrected data sets of one normal volunteer is shown in Fig. 1; results of analysis of one stroke patient's data set are shown in Fig. 2. The results of the group analysis of six normal subjects are illustrated in Fig. 3. These figures show that all major brain structures that are typically activated during a motor task, such as the contralateral motor cortex (Brodmann area [BA] 4), supplementary motor area (BA 6, medial) and cerebellum, showed activation in both uncorrected and corrected data sets. In addition, excellent consistency between corrected and uncorrected data sets was observed for activation in brain structures such as the putamen, thalamus, and insula. This is shown in Fig. 4 where uncorrected and corrected data are compared in the case of significant activation of thalamus and insula in one normal subject and significant activation of putamen in another normal volunteer.
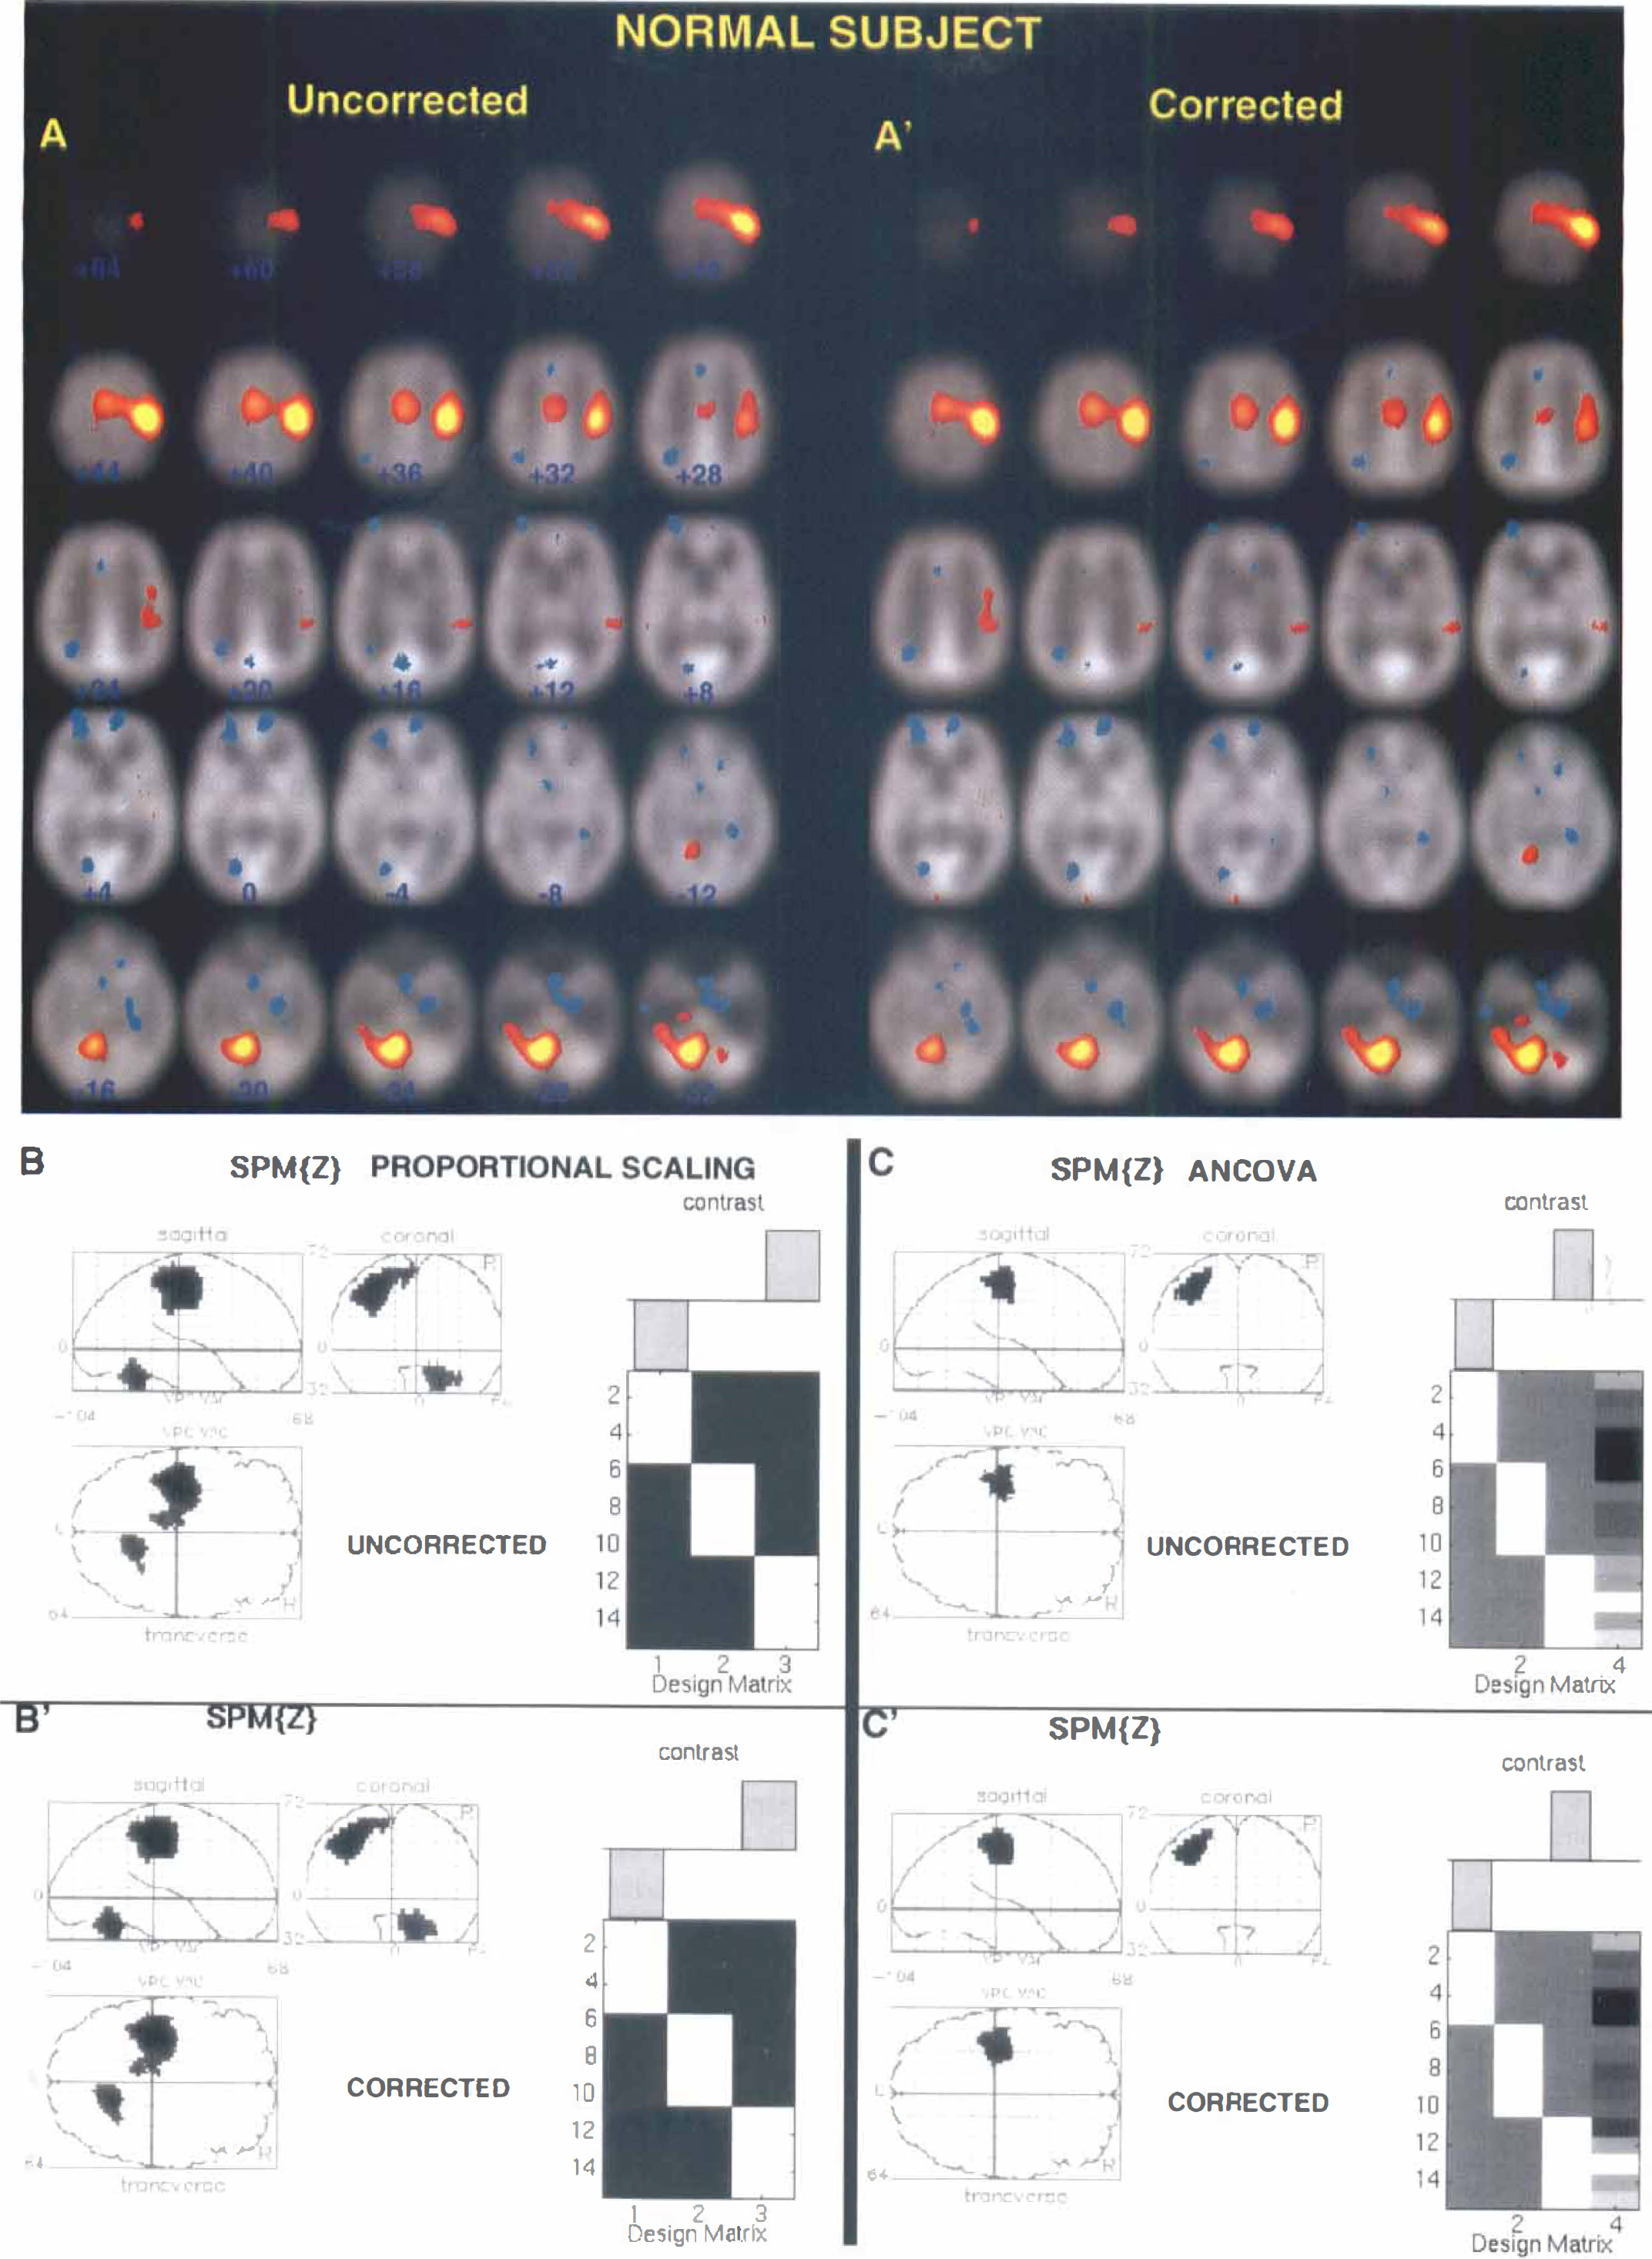
Comparison of the statistically significant brain activations in corrected and uncorrected positron emission tomography (PET) data sets of a single normal subject performing extensions of the right fingers. Results of a typical single-subject analysis using the pooled variance method (Worsley et al., 1992) in Fig. 1 A-A′; SPM 95-proportional scaling in Fig. 1B-B′; and SPM 95-ANCOVA in Fig. 1 C-C′, showing considerable consistency between activation maps obtained from corrected and uncorrected data sets within a particular statistical method. Activation images (increases in red and yellow) shown in Fig. A-A′, and B-B′, and C-C′ are thresholded at t = 3.09. Only in A-A′ is the subject's left on the reader's right. In A-A′, the statistically significant activation is superimposed on the average PET images of this subject. Talairach z-levels are indicated (Talairach and Tournoux, 1988).
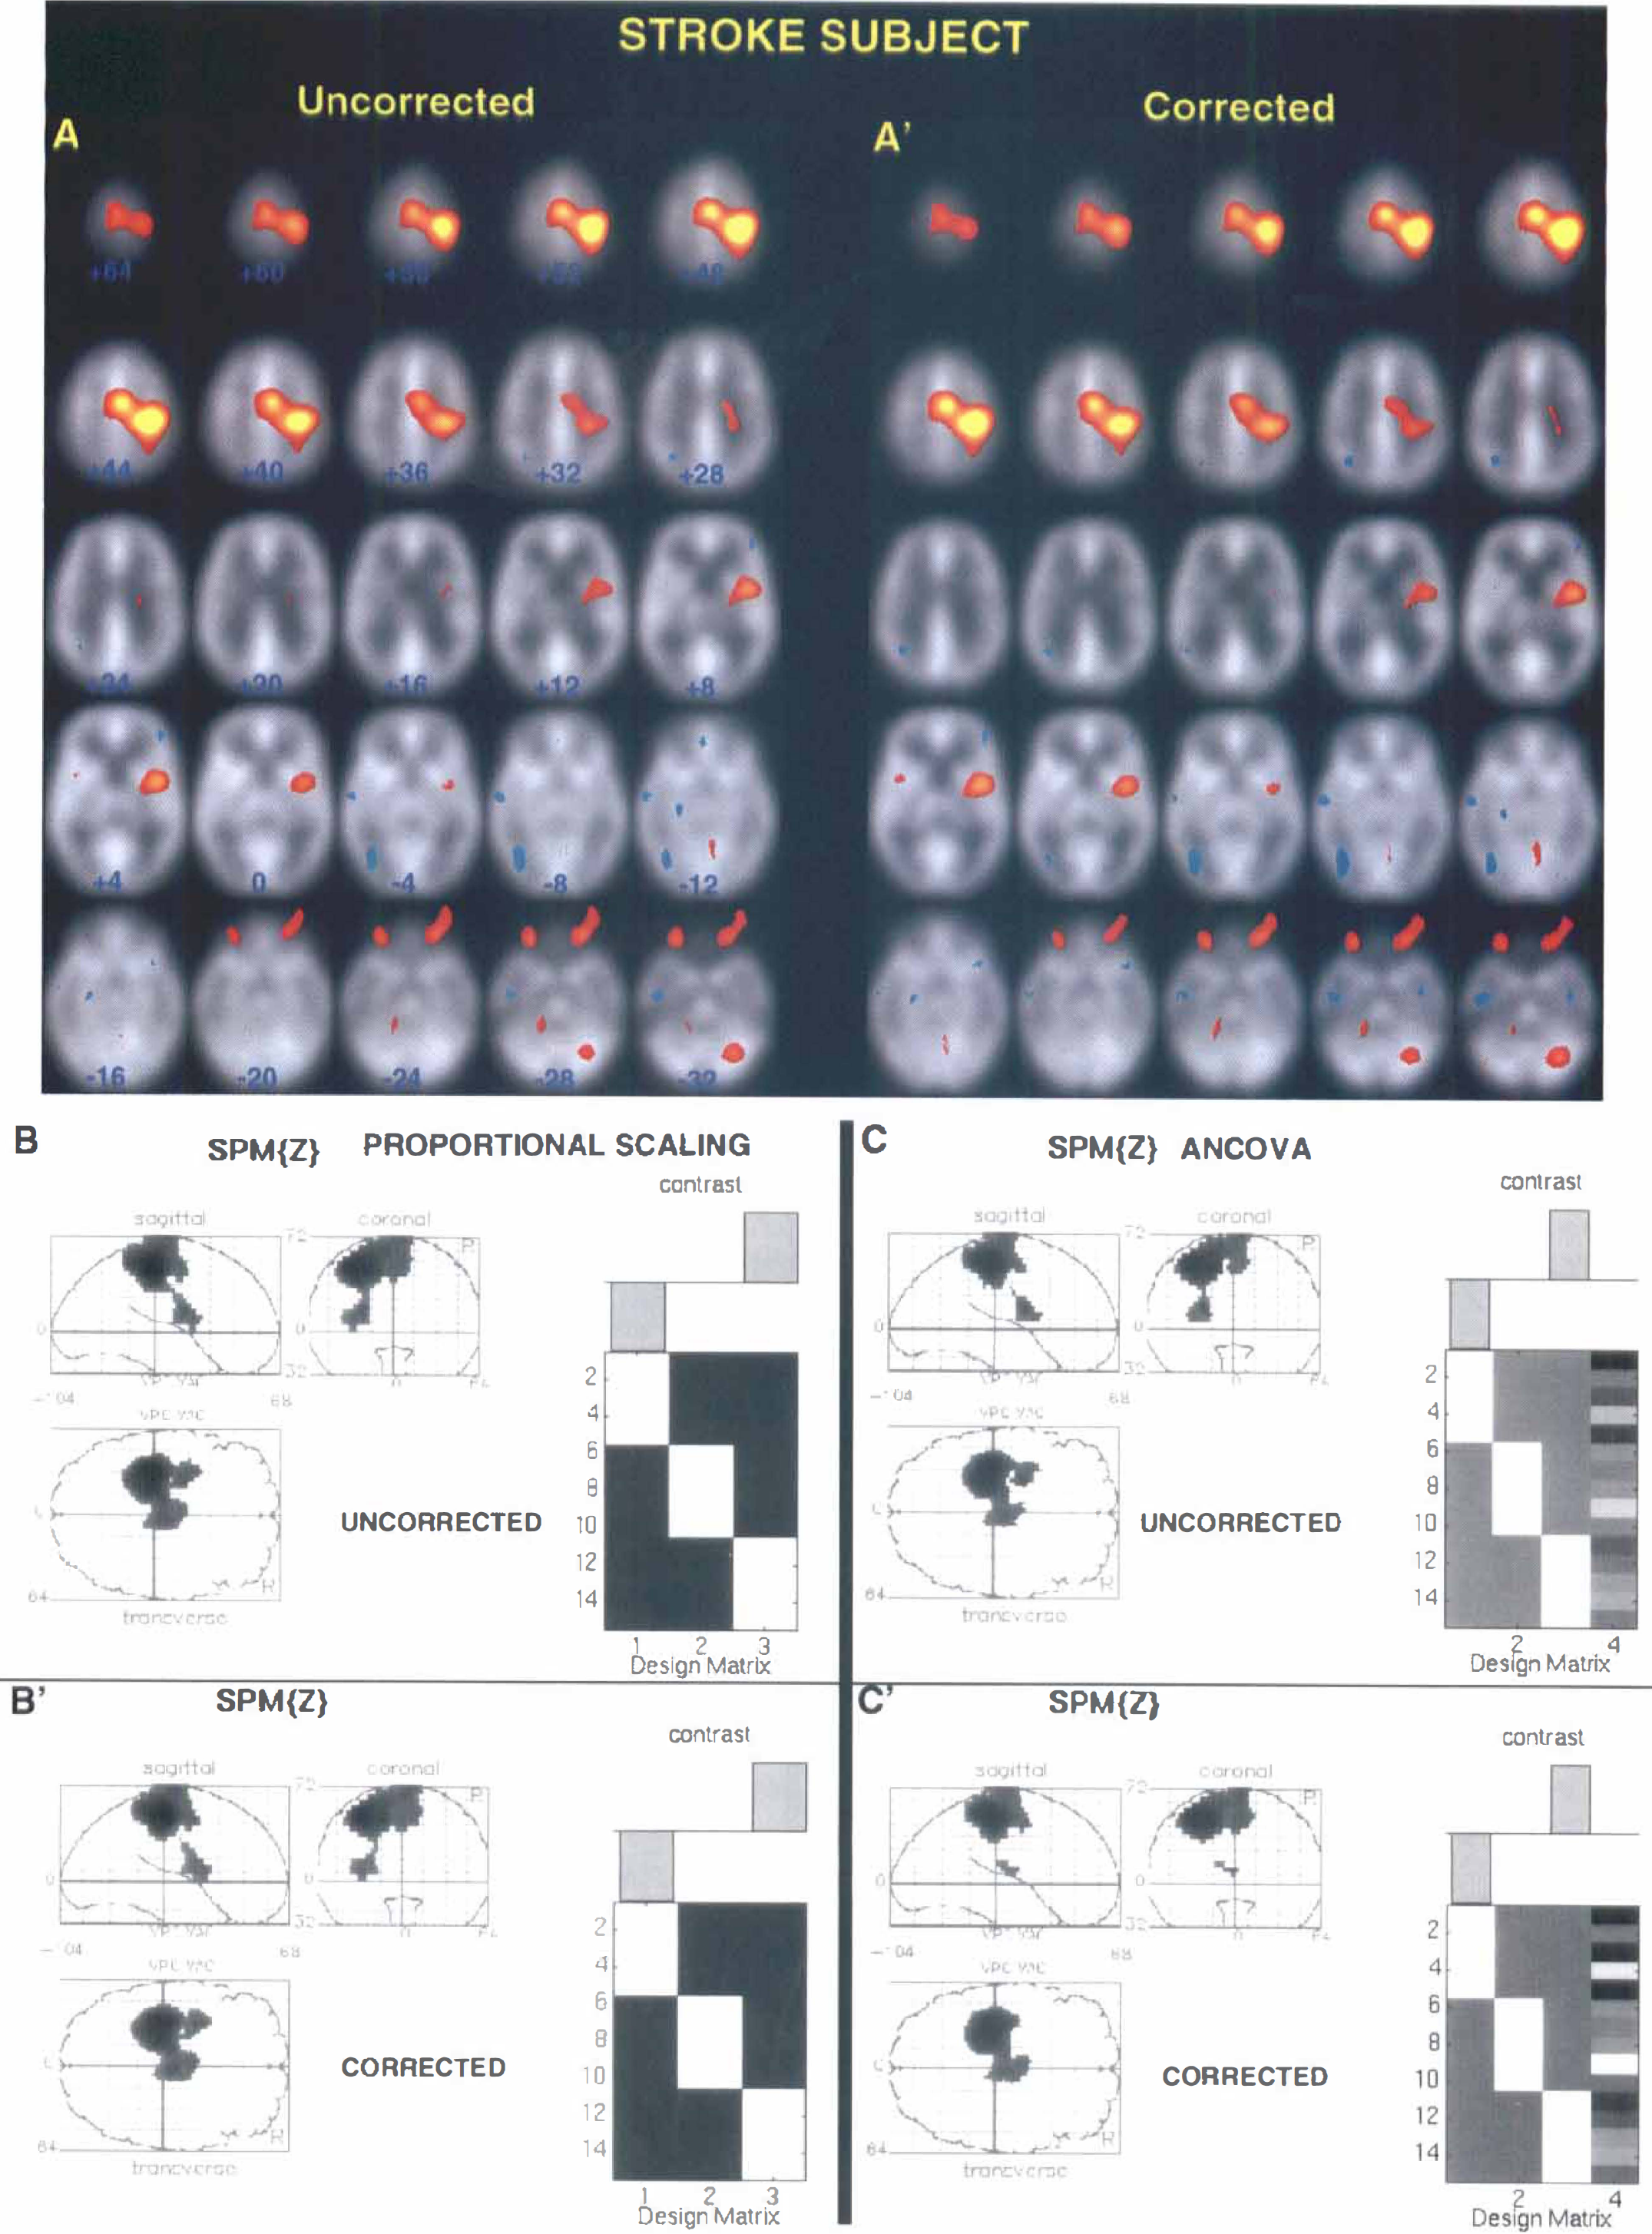
Comparison of the statistically significant brain activations in corrected and uncorrected positron emission tomography data sets of a single stroke subject with a subcortical lesion located in the left internal capsule, performing the motor task with the affected right hand. Results of single-subject analyses using: (1) pooled variance method in A-A′; (2) SPM 95-proportional scaling in B-B′; and (3) SPM 95-ANCOVA, in C-C′. The same format and thresholds as in Fig. 1 are used.
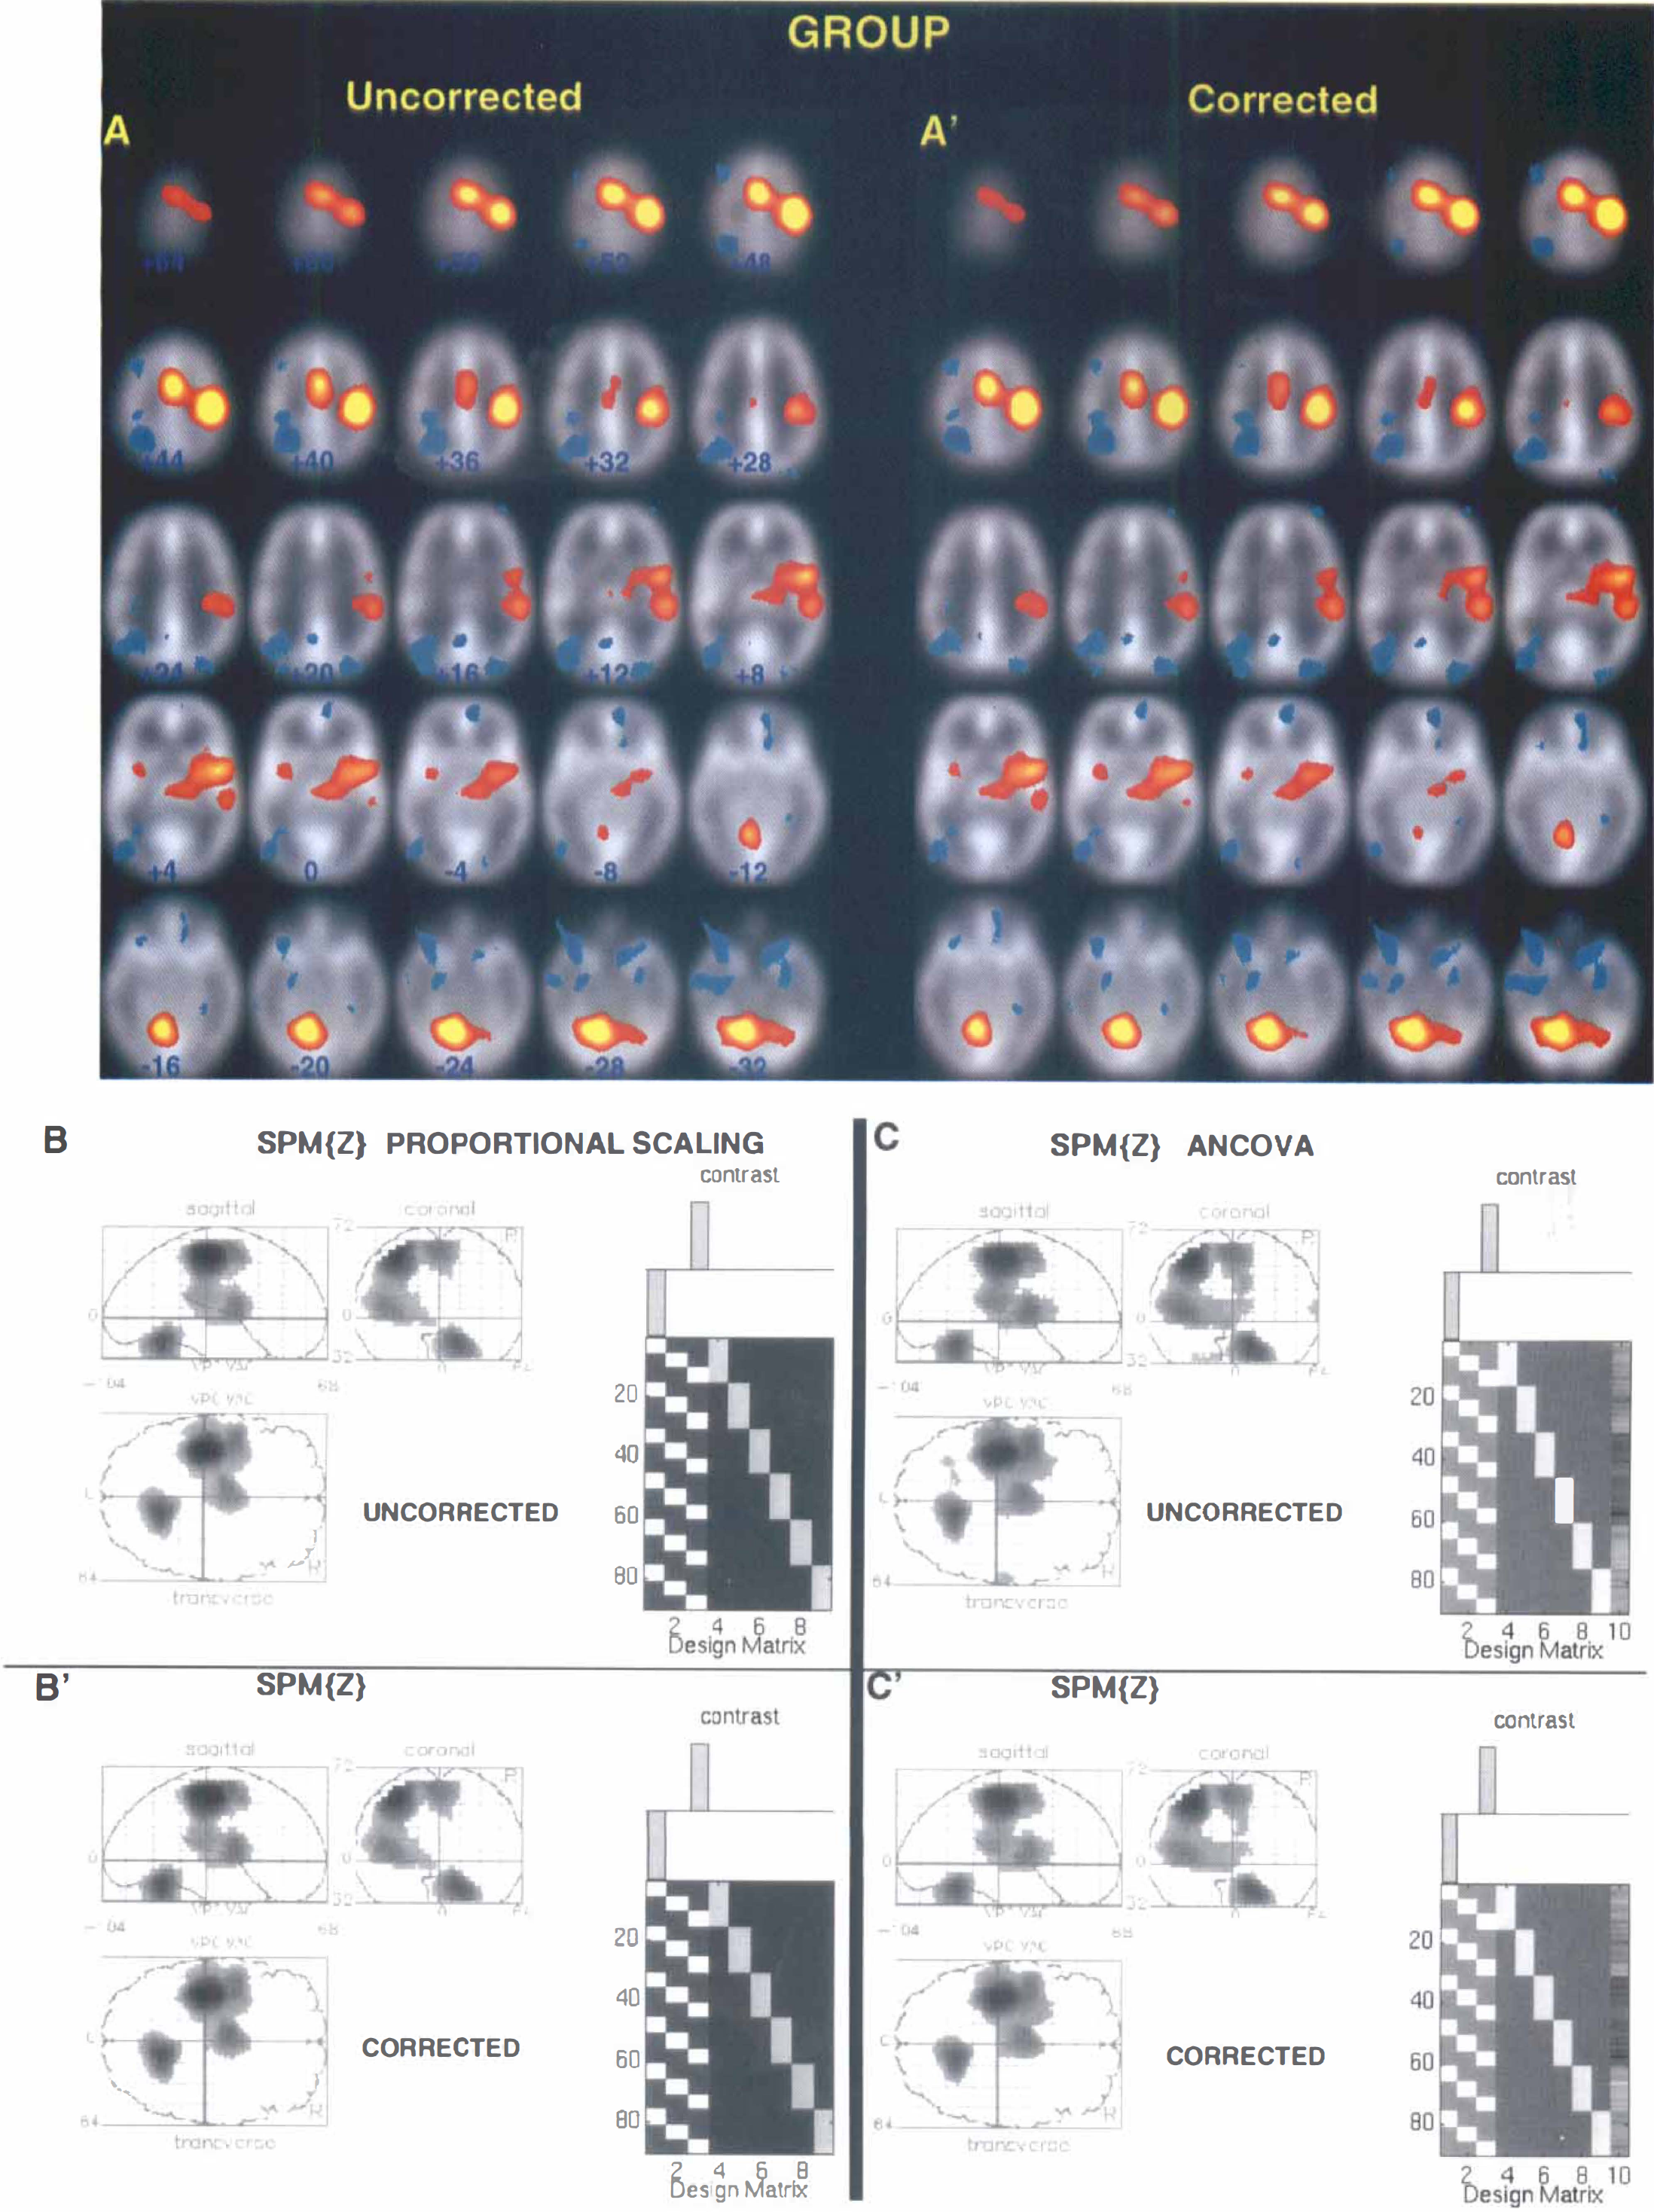
Comparison of the statistically significant brain activation in corrected and uncorrected positron emission tomography data sets of a group of six normal subjects performing extension movements of the right fingers. Results of a group analysis using: (1) pooled variance in Fig. 1A-A′; (2) SPM 95-proportional scaling in Fig. 1B-B′; and (3) SPM 95-ANCOVA in Fig. 1C-C′. The same format and thresholds as in Fig. 1 are used.
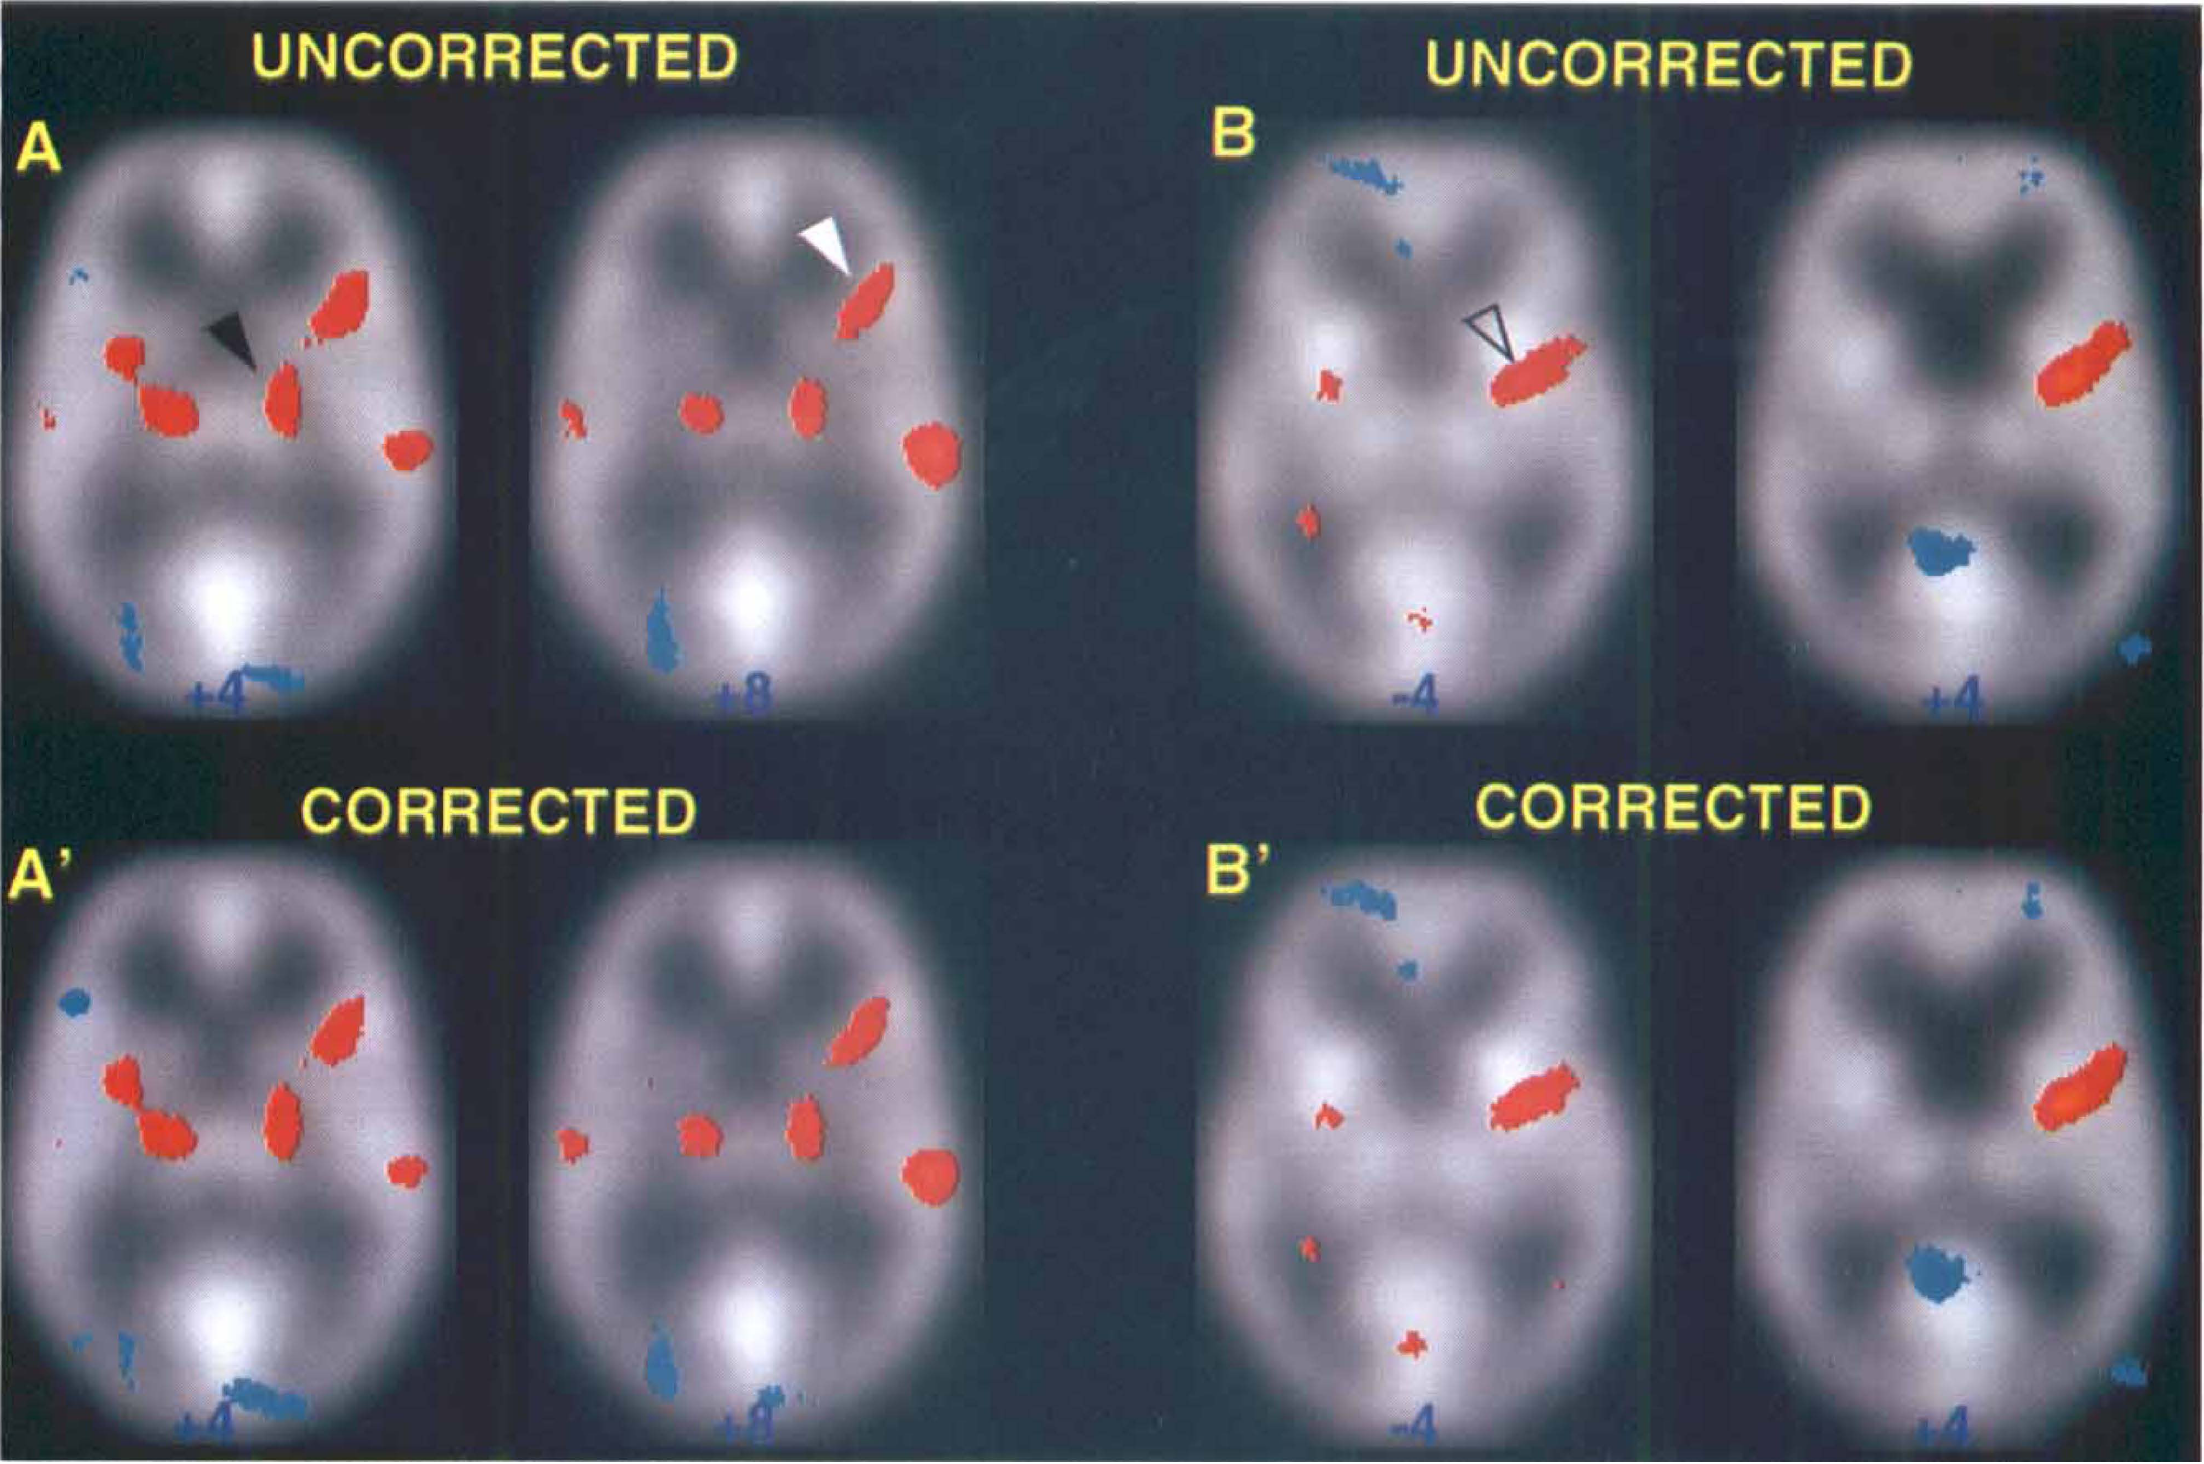
Comparison of the activation map in a case of small activations in uncorrected (Fig. 4A and B) and corrected (Fig. 4-A′ and -B′) positron emission tomography data sets of two individuals performing the left finger extension. Shown are results only from the pooled variance method. Significant activation of thalamus (marked with a black arrow on A-A′) and insula (marked with a white arrow on A-A′) is shown in the case of one subject and a significant activation of putamen (marked with an open arrow in B-B′) is evident in the case of a second subject.
Consistency was observed in the Talairach coordinates (Talairach and Tournoux, 1988) of activated brain structures; t or Z value of the peak intensity of a particular activated brain structure; and size of clusters of activated brain regions in the background corrected and uncorrected data sets within a particular statistical method. Tables 1 and 2 show the t or Z value of the peak intensity and the Talairach coordinates of two primary activated structures, i.e., the contralateral left (Table 1) and the contralateral right (Table 2) primary motor cortex (Brodmann area 4) following right and left hand motor tasks, respectively, in the corrected and uncorrected data sets across all nine individuals and also for the group of six normal subjects.
Left primary motor area (BA 4)-right hand movement
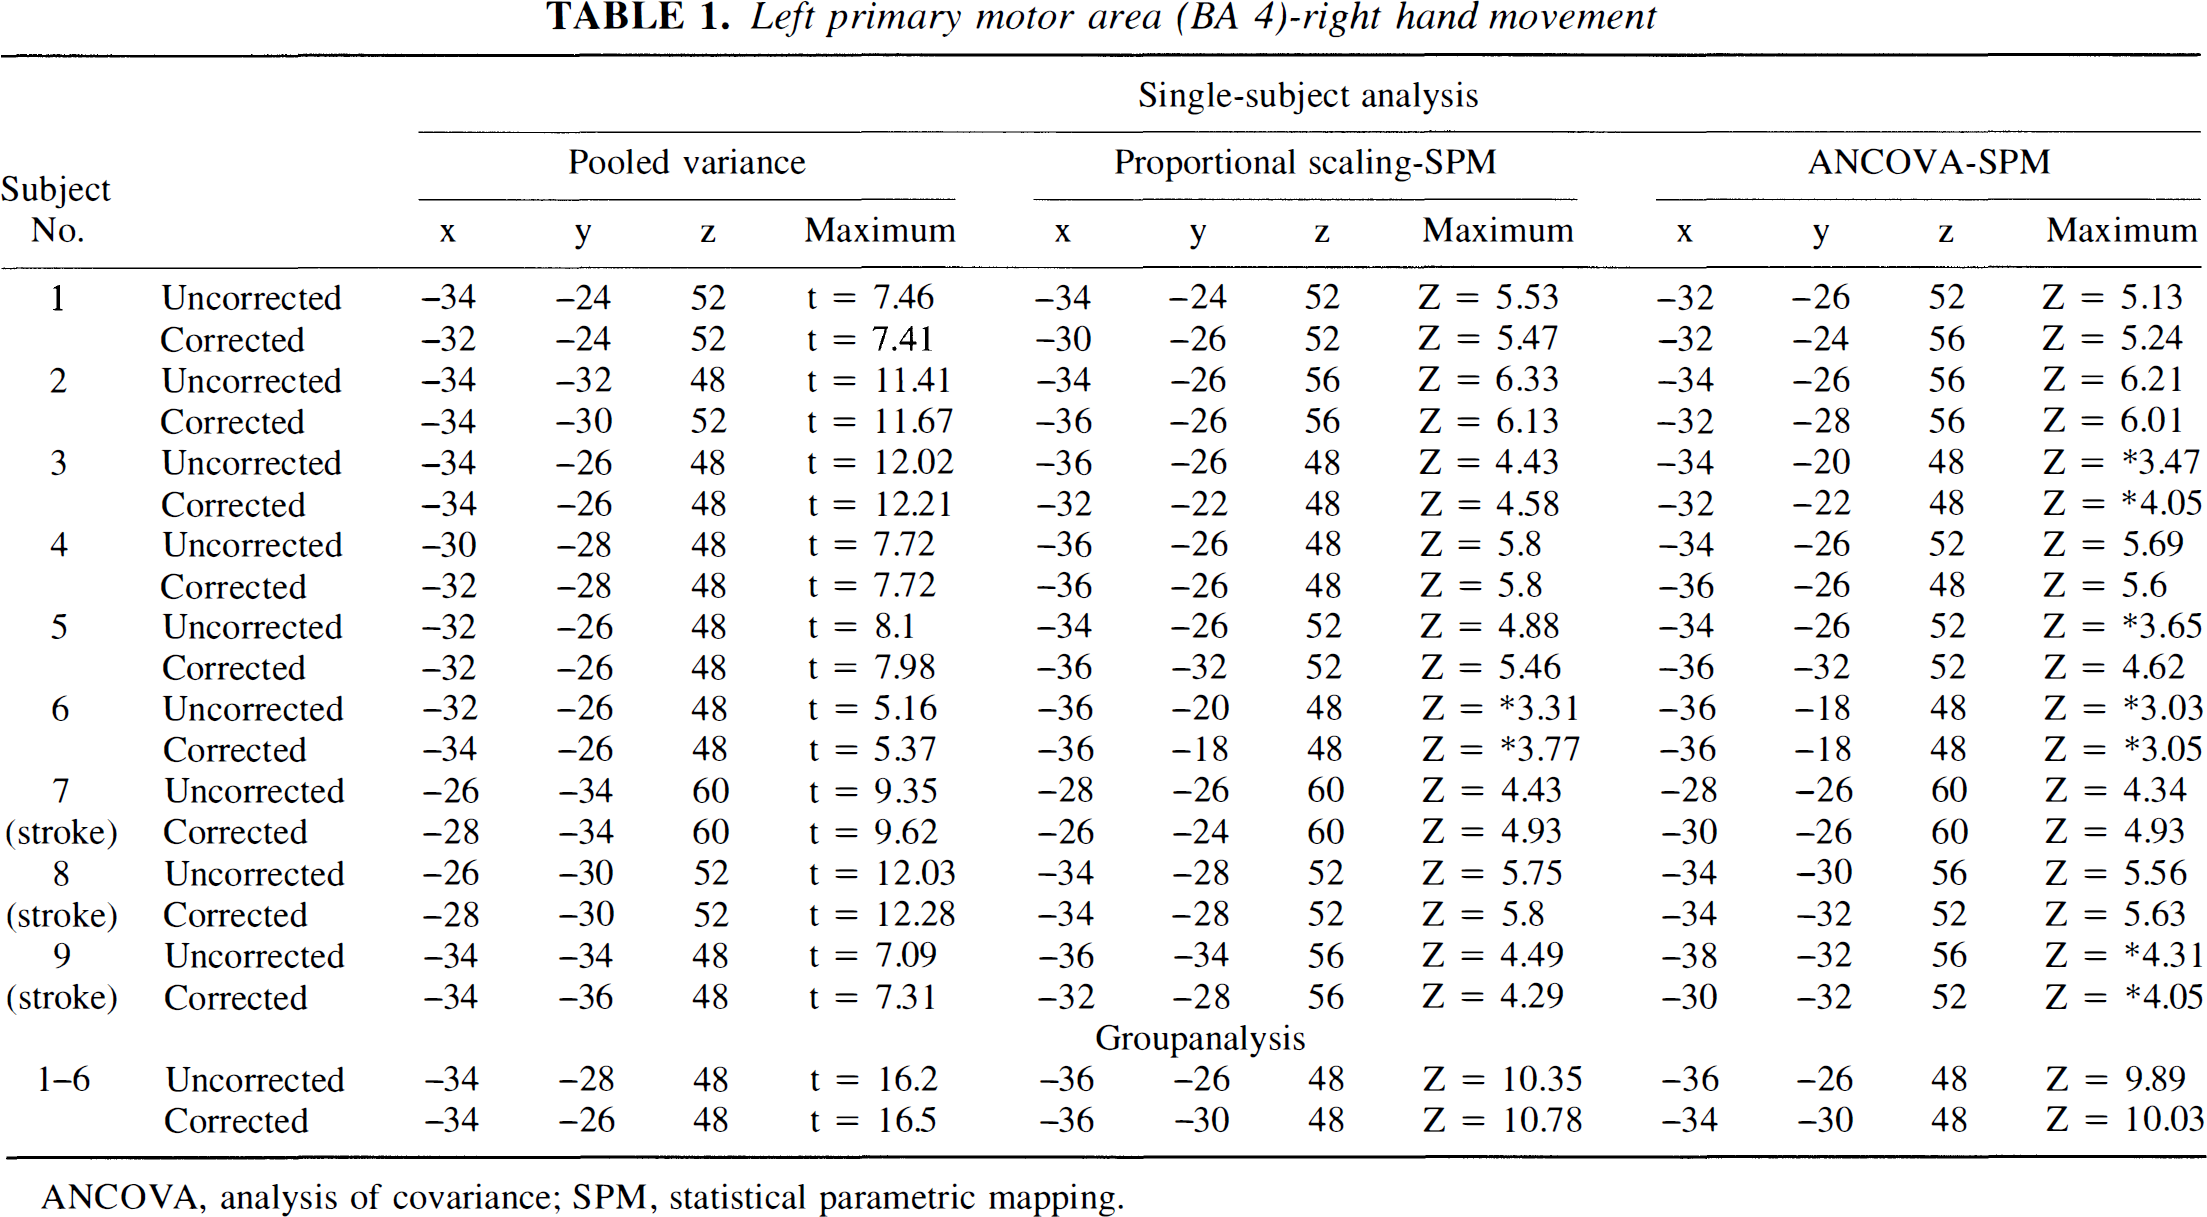
ANCOVA, analysis of covariance; SPM, statistical parametric mapping.
Right primary motor area (BA 4)-left hand movement
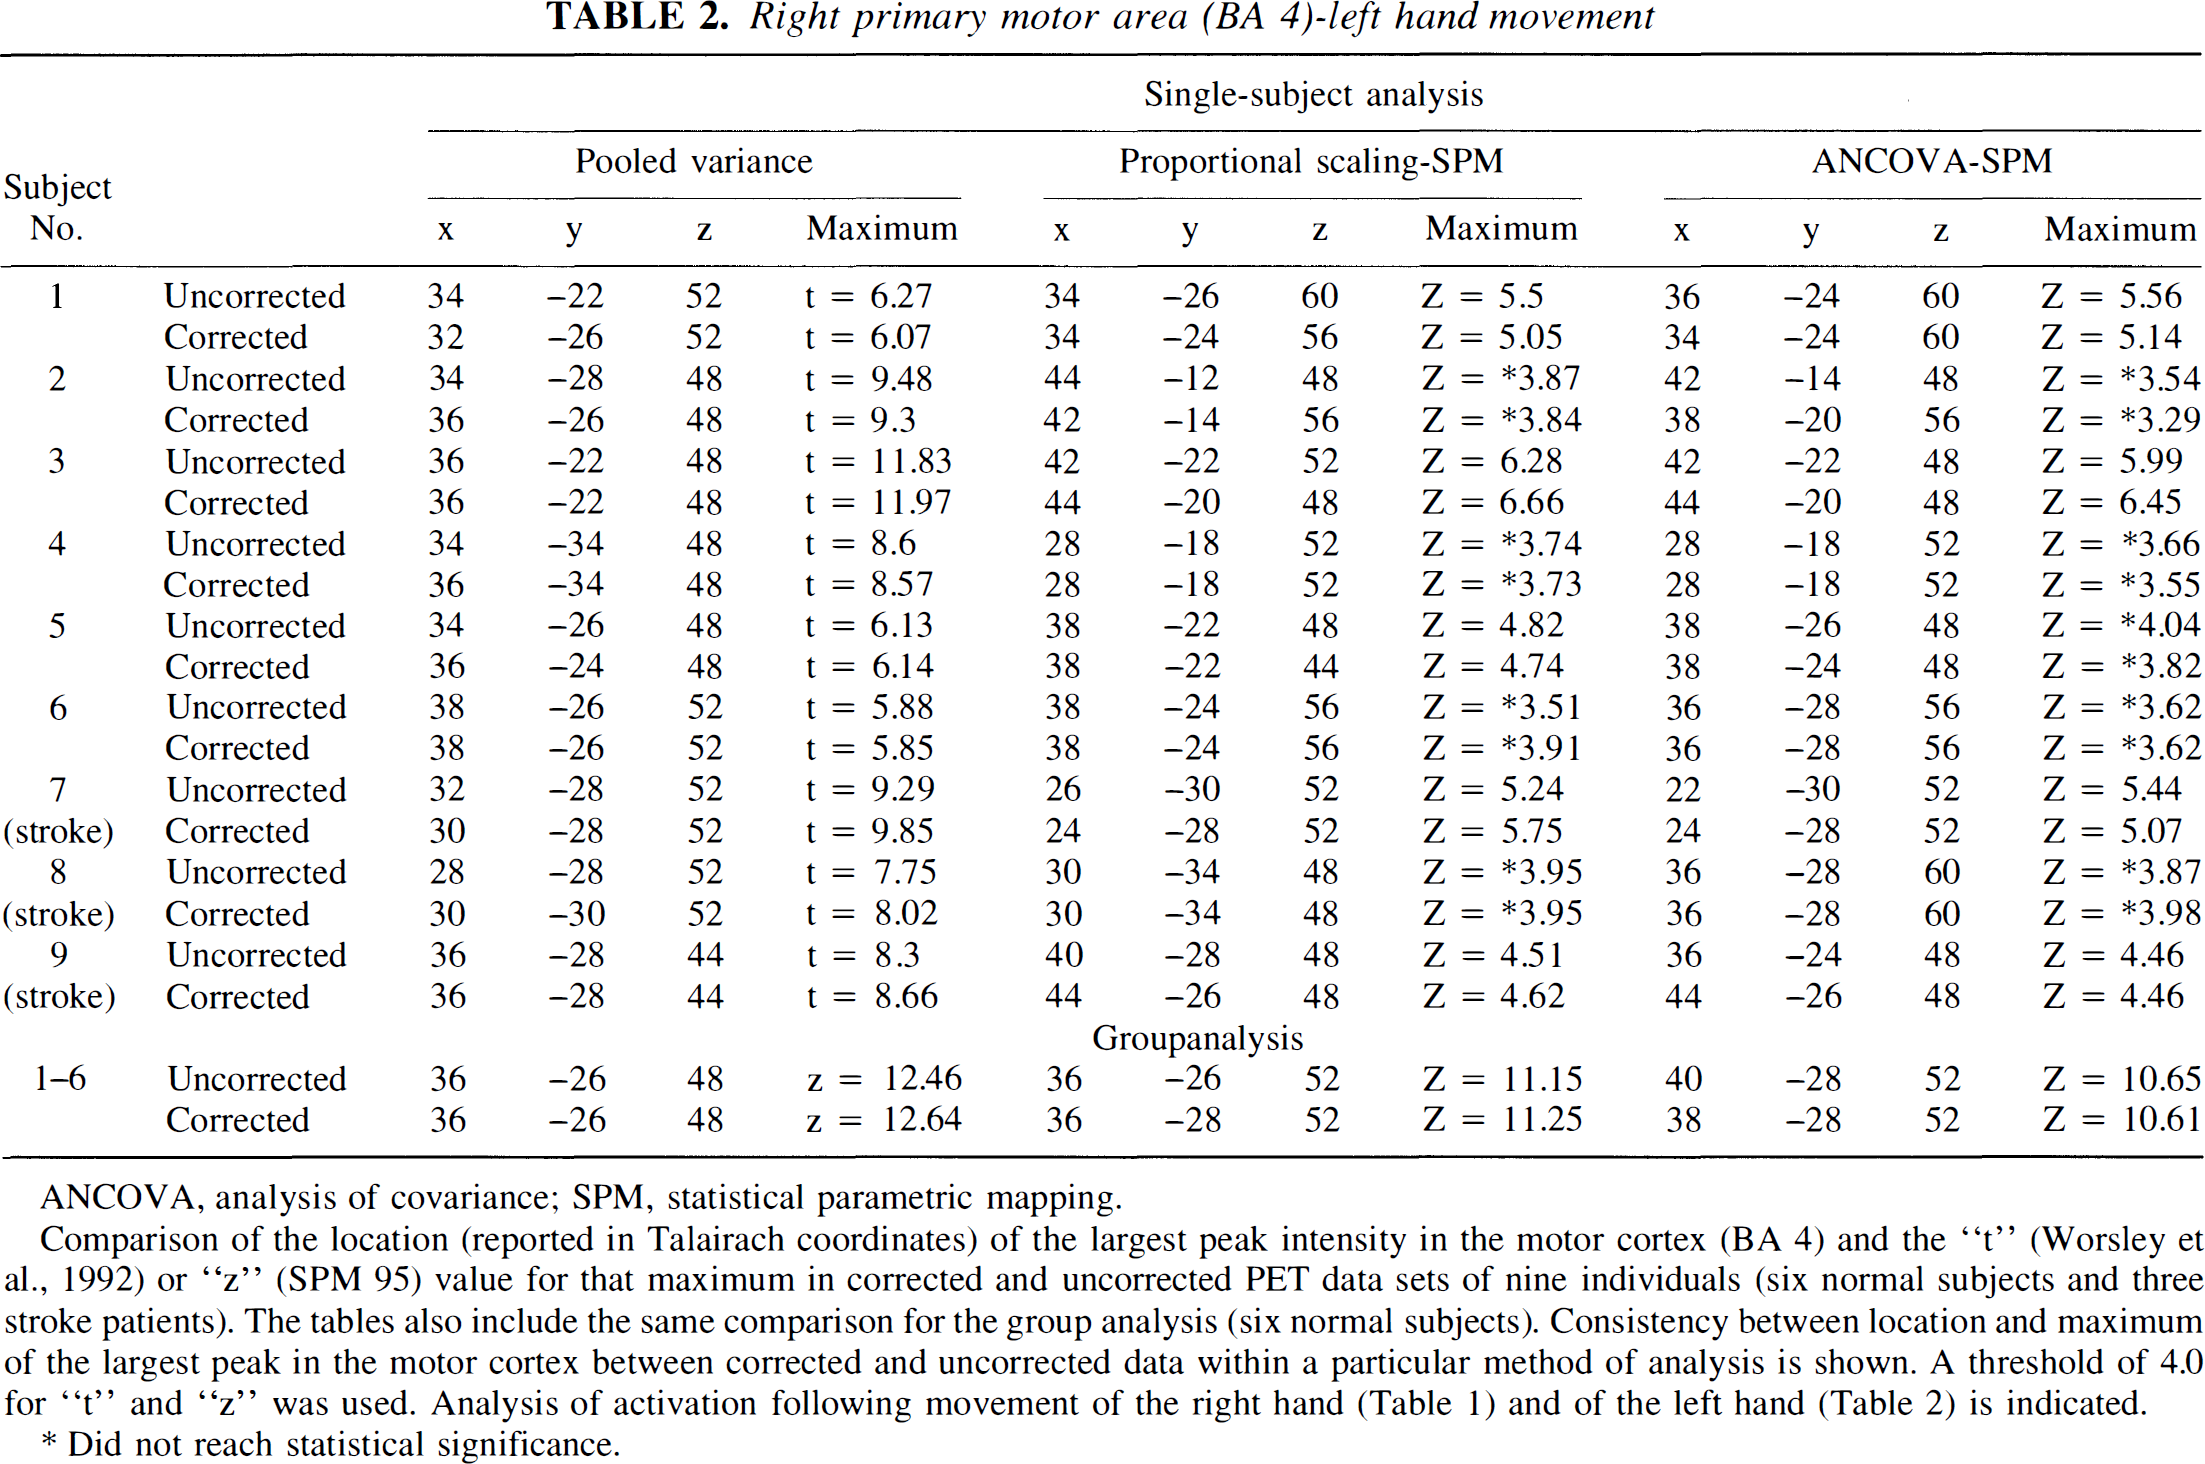
ANCOVA, analysis of covariance; SPM, statistical parametric mapping.
Comparison of the location (reported in Talairach coordinates) of the largest peak intensity in the motor cortex (BA 4) and the “t” (Worsley et al., 1992) or “z” (SPM 95) value for that maximum in corrected and uncorrected PET data sets of nine individuals (six normal subjects and three stroke patients). The tables also include the same comparison for the group analysis (six normal subjects). Consistency between location and maximum of the largest peak in the motor cortex between corrected and uncorrected data within a particular method of analysis is shown. A threshold of 4.0 for “t” and “z” was used. Analysis of activation following movement of the right hand (Table 1) and of the left hand (Table 2) is indicated.
Did not reach statistical significance.
In the single-subject analysis, very small differences were noted in the locations of local maxima in the primary motor cortex (Ml) between background corrected and uncorrected scans (Tables 1 and 2). These effects were evident in all three analytic methods; however, the pooled variance technique yielded the smallest mean location difference (left M1: 1.83 ± 0.43 mm t = 4.17, P < 0.0031; right M1: 1.88 ± 0.52 mm, t = 3.57, P < 0.0073). The fact that variation in the location of local maxima was greatest with SPM-ANCOVA and least with the pooled variance is to be expected and will be explained in the Discussion section. These differences are smaller than the size of a single voxel (2 × 2 × 4 mm, for “x”, “y”, “z”, respectively). Using the pooled variance technique, 5 of 18 individual comparisons (9 subjects × 2 motor tasks) showed no differences in locations of local maxima in corrected and uncorrected scans. Somewhat greater shifts in location were evident in the ratio normalized SPM data (left M1: 3.39 ± 0.88 mm, t = 3.81, P < 0.0051; right M1: 2.61 ± 0.69 mm, t = 3.76, P < 0.0055), and in ANCOVA-adjusted SPM data (left M1: 4.03 ± 0.86 mm, t = 3.00, P < 0.0171; right M1: 3.63 ± 1.21 mm). Similar, yet slight, location shifts between uncorrected and corrected data were also noted in the group analyses (pooled variance: left M1 2.0 mm, right M1 0 mm; ratio SPM: left M1 5.65 mm, right M1 2.82 mm; ANCOVA SPM: left M1 4.47 mm, right M1 2.0 mm). Very small differences were also noted in the locations of local maxima and their values in the case of small activations such as in putamen (uncorrected x = 30, y = 0, z = 4, and t = 4.28 and corrected: x = 28, y = 2, z = 4, and t = 4.30 in a normal subject shown in Fig. 4 A-A′; and uncorrected: x = 26, y = −6, z = 4, and t = 4.89 and corrected: x = 28, y = −6, z = 4, and t = 5.15 in a second normal subject shown in Fig. 4 B-B′); in thalamus (uncorrected: x = 16, y = −18, z = 8, and t = 4.27 and corrected: x = 14, y = −16, z = 8, and t = 4.19 in a subject shown in Fig. 4 A-A′) and in the insula (uncorrected: x = −34, y = 16, z = 8, and t = 4.23 and corrected: x = −34, y = 18, z = 8, and t = 3.79 in the subject shown in Fig. 4 A-A′).
Similarly, the local maxima in the single-subject analyses showed close values between corrected and uncorrected data sets, especially for the t value when pooled variance was applied and in the Z value, when SPM-proportional scaling was used (Tables 1 and 2).
The similarity of cluster size of the activated regions in uncorrected and corrected data sets is shown in Table 3 for one normal subject (Fig. 1), one stroke patient (Fig. 2), and the group of normals (Fig. 3), using all three types of analysis. Table 4 presents the cluster sizes of the activated motor structures of all nine single subject analyses, using the pooled variance method. When background corrected and uncorrected scans were directly compared in the nine subjects examined using the pooled variance method, no statistically reliable differences were found for cluster sizes of the activated motor structures. Background correction did not significantly increase cluster size (mean difference ± SEM) in either the cerebellum (right hand movement: 34.66 ± 36.62, left hand movement: −2.0 ± 21.22) or cortical motor regions (right hand movement: −10.00 ± 58.86, left hand movement: 6.5 ± 27.22).
Cluster size of activated brain structures
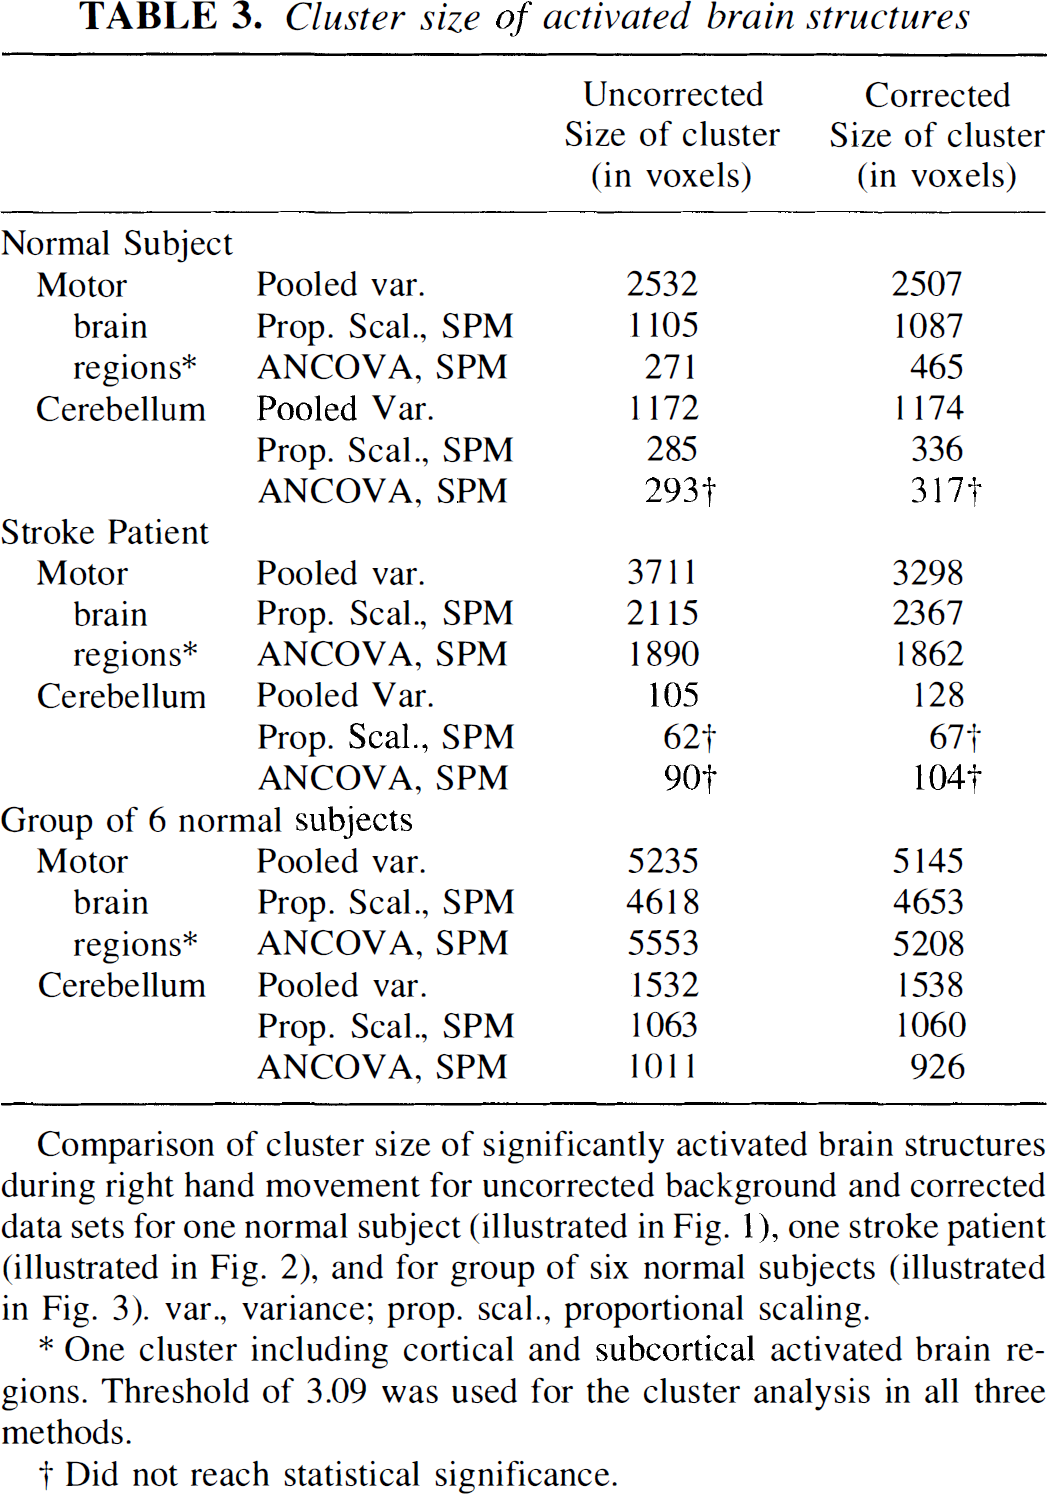
Comparison of cluster size of significantly activated brain structures during right hand movement for uncorrected background and corrected data sets for one normal subject (illustrated in Fig. 1), one stroke patient (illustrated in Fig. 2), and for group of six normal subjects (illustrated in Fig. 3). var., variance; prop. scal., proportional scaling.
One cluster including cortical and subcortical activated brain regions. Threshold of 3.09 was used for the cluster analysis in all three methods.
Did not reach statistical significance.
Cluster size of activated motor structures
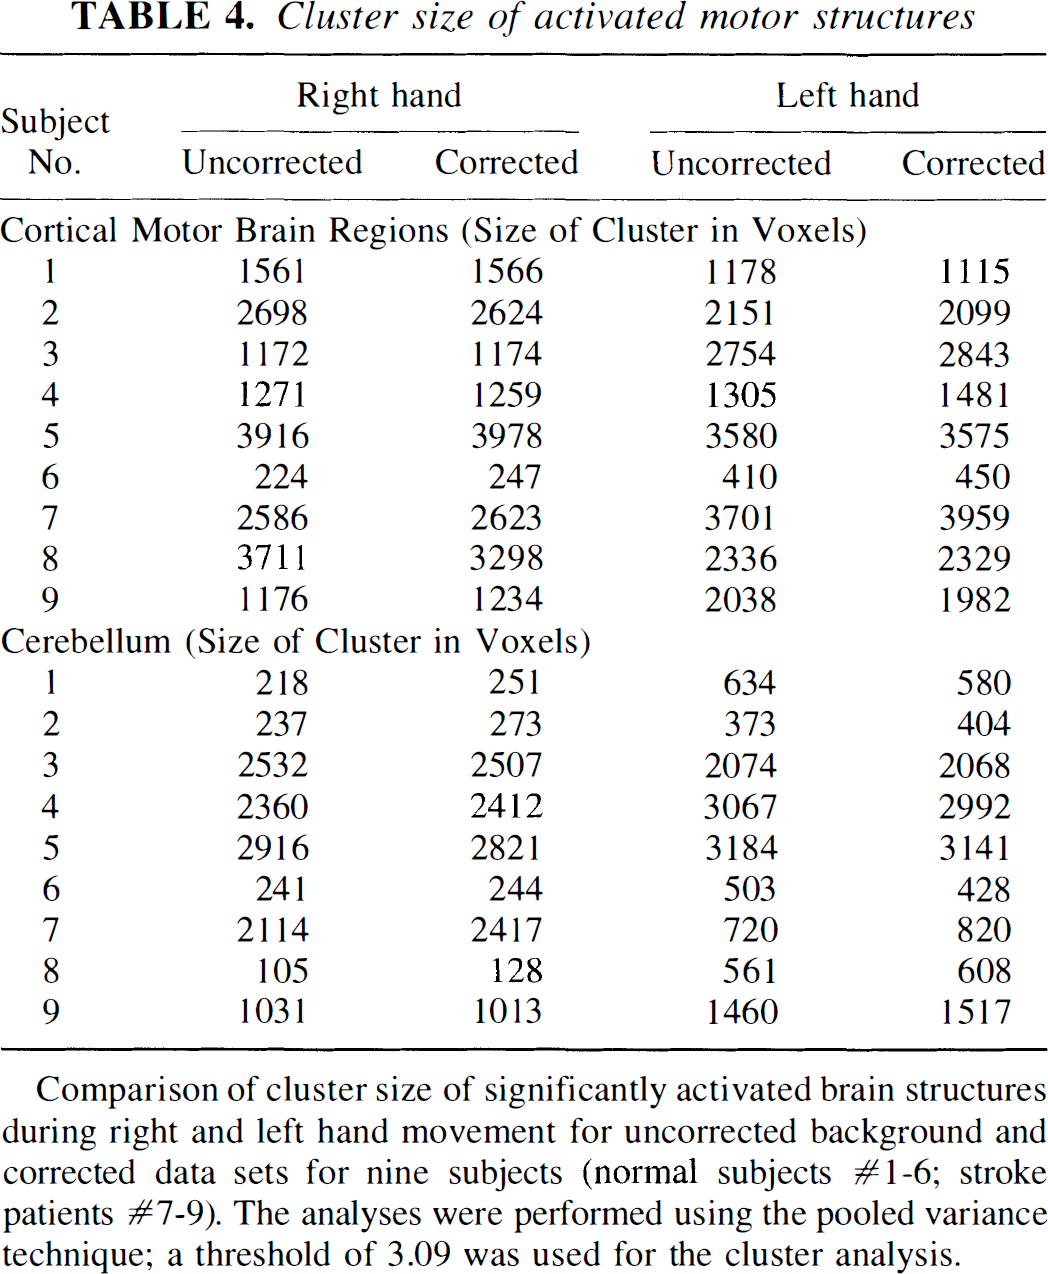
Comparison of cluster size of significantly activated brain structures during right and left hand movement for uncorrected background and corrected data sets for nine subjects (normal subjects #1-6; stroke patients #7-9). The analyses were performed using the pooled variance technique; a threshold of 3.09 was used for the cluster analysis.
Although comparison of the different methods of statistical analysis was not the purpose of this study, it should be mentioned that the activation maps for single subject studies obtained with three different individual analyses were less consistent, mainly in reproducibility of the same significantly activated structure. For example, when individual subjects were analyzed, the cerebellum showed significant activation during right hand movements in nine analyses of nine subjects using pooled variance; in four of nine using SPM-proportional scaling; and in two of nine using SPM-ANCOVA. For the left hand movements, the cerebellum shown activation in nine analyses of nine subjects using pooled variance; four of nine using SPM-proportional scaling; and two of nine using SPM-ANCOVA. More consistency in the number of significantly activated brain regions across the applied methods was observed in the group analysis; the cerebellum was found to be significantly activated in all three statistical analyses.
DISCUSSION
Short interscan [15O]water studies provide an opportunity to increase the number of scans substantially during a scan session, and thus the statistical power when performing a single-subject analysis of unique cases, such as stroke. In stroke cases, location of the infarct differs from subject to subject, causing possible intersubject physiologic differences that would be missed with a group analysis. The shorter interval also improves the subjects' cooperation and concentration, and minimizes time or habituation effects. Shorter interscan time is very important when examining poorly cooperative subjects, such as children. The question remained whether the background residual radioactivity should be subtracted when the scans are only 6 minutes apart. Both single-subject and group analyses were performed in our short interval interscan study to examine how much subtracting background versus not subtracting the background affects data analysis.
To perform individual and group analyses in our study, we chose two widely used statistical techniques, i.e., Worsley's method (Worsley et al., 1992) and the SPM technique with options of proportional scaling and ANCOVA (Friston et al., 1991, 1994). Our results from the single analysis of nine individual data sets and the group analysis show a great similarity in the activation maps between the corrected and uncorrected data sets within a particular statistical method. Both the spatial-extent—based analysis and the peak intensity analysis were performed on all data sets. The results indicate a very close similarity in both the size of significant clusters and in the t or Z value of the maximum intensity of a particular activated region in both data sets.
The locations of the peak activations within the primary motor cortex were highly consistent between background corrected and uncorrected data sets. In most cases, the location differed by one voxel or less (voxel size: 2 × 2 × 4 mm, for x, y, z, respectively). Also, analysis of the spatial extent of both MI and cerebellar activations revealed that background correction did not significantly increase the number of significantly activated voxels (Student's t-test, not significant).
The purpose of background correction is to remove the effects of residual radioactivity from the previous scan. However, because of the nature of the subtraction analysis, if the background activities were very similar from run to run, we would not expect the background to affect the statistical analysis, except perhaps for a small increase in noise. The excellent agreement in results found here between corrected and uncorrected data suggests that the residual activities were, in fact, very similar. This was probably due to the small variation in time between injections in these studies and the consistency of injected dose by using an automated [15O]water synthesis unit. Because there is no residual radioactivity in the first scan, the lack of background subtraction in the uncorrected data sets might have been expected to increase variability and thus reduce the statistical significance of the result. This did not occur in this study, presumably because (1) 15 injections were performed per subject, so the fraction of scans without background was small, and (2) task order was randomized.
It is not clear whether performing [15O]water scans with a short interscan interval will improve signal detection compared to conventional 10- to 12-minute interscan intervals. Increasing the total number of scans would be expected to improve statistical power. However, if the same number of injections are performed in a shorter time, it is not clear whether there will, in fact, be improved subject cooperation and attention resulting in less intersubject variance. Any such effect is likely to depend heavily on the nature of the task. Furthermore, the presence of background activity will increase noise in the data. While background subtraction should produce accurate measurements of signal magnitude, this subtraction process will increase noise even further. Here, we minimized the additional noise added by background subtraction by using a scaled average background scan, as described in the Methods section. The issue would be best addressed by empirical comparison of the standard and the short interscan interval protocols in a given experimental condition.
Comparison of the results obtained in single-subject analyses based on the application of a particular statistical technique was not the primary purpose of the present study. As one can see in Figs. 1 and 2, there are differences in activation maps obtained with the different statistical techniques applied in single-subject analyses and greater consistency in the activation map across the applied methods in the group analysis. Recent PET studies (Ford, 1995; Strother et al., 1995; McIntosh et al., 1996; Poline et al., 1996, 1997; Grabowski et al., 1996; Gold et al., 1997; Vitouch and Gluch, 1997) have discussed those factors that can influence the statistical interpretation of the result, such as sample size or the way in which the t-value is calculated. In both Worsley's method and SPM-proportional scaling, proportional global normalization of rCBF is performed to remove global fluctuations in rCBF, while in SPM-ANCOVA, an analysis of covariance is used. Worsley's method and the SPM technique differ mainly in how the SD used to calculate the t-value is estimated. In the first method, the average variance is obtained by pooling the SD from all the voxels in the search volume (assuming that the local variance is spatially homogeneous) while in SPM, the local variance estimate is used. However, Grabowski et al. (1996) reported in their [15O]water PET study that the variance was not constant across the brain and “… rCBF and changes in rCBF were more variable in gray matter than in white matter …, in activated regions than in non-activated regions.” The same investigators discussed using only a pooled gray matter variance, because “… this strategem would preserve an important benefit of the pooled estimate: the high effective degrees of freedom of the resulting t statistic.” In our study, we followed this suggestion, and we calculated pooled variance from only gray matter voxels, rather than whole brain voxels.
SPM statistical analysis depends on the local variance. Grabowski et al. (1996) reported in their study on the reliability of PET activation across statistical methods, subjects groups and sample sizes, that “… those methods dependent on local variance estimates were less powerful with small sample sizes and less stable.” Additionally, Gold et al. (1997) reported in their study on factors that influence the results in [15O] water PET studies that “… the largest peak activation reported in a study was found to be affected by the variability in sample size.” The issue of low statistical power when combining small sample sizes and parametric statistical tests has also been broadly discussed by Vitouch and Gluck (1996). All these studies provide an explanation for the discrepancy observed between activation maps in our single-subject analyses where, e.g., the cerebellum was found to be significantly activated with pooled variance but not with SPM analyses. In addition, variation in local maxima between corrected and uncorrected data were smallest for the pooled variance method. The statistics here all involve dividing by a variance image so the noise in the variance image makes it through to the statistic image, although the image of the effect might be well defined. Thus, the lower the degrees of freedom, the noisier the variance image, this noise affecting the statistic image. Short interscan interval studies are particularly relevant for single-subject investigations involving unique cases. Such studies frequently involve a relatively small number of repetitions for each condition, yielding a relatively low N for statistical analyses. These data confirm previous indications that under such low N conditions, pooled variance analytic methods exhibit greater statistical power than either ratio or ANCOVA-normalized SPM analyses, hence, they may be more appropriate for single-subject analyses. Group analyses showed consistency across the applied methods, being supported by the larger sample size when the SPM technique was applied. It should be mentioned that significantly activated motor regions found in our study (regardless of the comparison between data sets) due to the motor task are consistent with previous motor PET studies using both individual analysis (Grafton et al., 1991; Shibashaki et al., 1993) and group analysis (Colebach et al., 1991; Remy et al., 1994; Sadato et al., 1996).
A question arises regarding the reproducibility of the results between corrected and uncorrected data sets with different experimental tasks that produce activations smaller than those seen in primary motor areas in our task. When we compared the significantly activated structures in the background corrected and uncorrected data sets, we also found consistency for small activations in the putamen, thalamus, or insula, provided these activations were detected by the specific statistical technique applied.
In conclusion, when a 6-minute interval between [15O]water PET scans is used, the data obtained with our motor task produces similar results in both individual and group analyses whether or not the background has been subtracted. Thus, if injected doses and timing were very consistent, one can have the advantage of a short interscan interval without the added complexity of obtaining background scans and correcting for residual radioactivity.
Footnotes
Abbreviations used
Acknowledgments
The authors thank the members of the Positron Emission Tomography Department, Clinical Center, National Institutes of Health, for their expertise, and Devera G. Schoenberg, MS, OCD, National Institute of Neurological Disorders and Stroke, for skillful editing.