
Abstract
Vibrotactile stimulation of the hand elicits no increase in oxygen consumption commensurate with the increase in blood flow measured in human sensory cortex. To test the hypothesis that previous failures to detect a proportionate increase in oxygen consumption could be an artefact of the sequential bolus, or three-step, method used to measure this parameter in the human brain in vivo, the authors compared the measurements with the results of a novel single bolus, or one-step, method of measuring oxygen consumption. The time of completion of the three-step method was 40 to 50 minutes, whereas the one-step method lasted only 3 minutes. The baseline whole-brain oxygen consumption averaged 185 ± 32 μmol hg−1 min−1 by the three-step method and 153 ± 15 μmol hg−1 min−1 by the one-step method. Vibrotactile stimulation did not elicit a significant increase in oxygen consumption measured by either method. This finding rejects the hypothesis that failure to detect an increase of oxygen consumption could be an artefact caused by limitations of the method used previously. Conversely, it also rejects the hypothesis that observations of an increase of oxygen consumption by the new method are artefacts caused by limitations of the one-step method.
We presented a single-step method for the determination of CMR O 2 using inhalation of a single breath of radioactive oxygen and positron emission tomography (PET) (Ohta et al., 1992). This method permitted us to determine CMR O 2 in 3 minutes, a period more suited to the examination of short-lasting physiologic states than the previous three-step method (Mintun et al., 1984), which lasts 40 to 50 minutes as implemented in this laboratory (Meyer et al., 1987). To test the one-step method under realistic physiologic conditions, we determined the oxygen consumption of brain tissue in the postcentral gyrus during brief vibrotactile stimulation of the fingers of the right hand of normal volunteers. In defiance of physiologic dogma (Roy and Sherrington, 1890; Lassen, 1959), previous completions of this experiment revealed little increase in CMR O 2 in the relevant brain region, much smaller than the substantial increase in regional CBF (Fox and Raichle, 1986; Fox et al., 1988). Hypothetical physiologic reasons for the finding have been proposed (Gjedde et al., 1991; Gjedde, 1997). However, in theory, the finding also may, wholly or in part, reflect the time-consuming combination of three separate measurements of CBF, oxygen extraction fraction (E O 2 ), and cerebral blood volume (CBV) required to complete the three-step measurement. To rule out methodologic explanations of this important finding, we repeated the experiment of Fox and Raichle (1986) using the briefer single-step method to estimate CMR O 2 .
SUBJECTS AND METHODS
Simulations
Mathematical simulations were performed to determine the ability of the one- and three-step methods to detect changes in CMR O 2 . Simulated tissue time-activity curves were generated using the input functions described in Ohta et al. (1992) and model equations accounting for recirculating water (model 2 in Ohta et al., 1992). In the simulated baseline condition, we used values of 50 ml hg−1 min−1 for unidirectional water clearance (K H 2 O 1); 90 ml hg−1 for the partition volume of water in tissue (Ve); 2 ml hg−1 for the initial distribution volume (V0); 20 ml hg−1 min−1 for the unidirectional clearance of oxygen from blood to brain (K O 2 1); and a value of k O 2 2 equal to the ratio K H 2 O 1/Ve for the rate constant for washout of metabolized water from brain to blood. The volume V0 is defined as the volume occupied by the transmitted (i.e., nonextracted tracer) during the study. The magnitude depends on the extraction of the tracer and is therefore less than the total vascular volume occupied by whole blood (CBV).
Two activation conditions were simulated. For both, we used values of 75 ml hg−1 min−1 for K H 2 O 1 and 4 ml hg−1 for V0. We simulated increases in K O 2 1 of 5% and 25%. Time-activity curves for tissue radioactivity [M(T)] were simulated using:
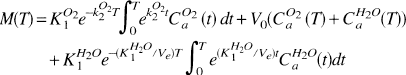
This equation is the convolution integral solution to equations (6) and (7) in Ohta et al. (1992). The magnitudes of K O 2 1 and CMR O 2 were recovered with the one- and three-step method equations applied to the simulated time-activity curves without added variability, and with added 5% Gaussian-distributed noise. Equations (13) and (5) in Ohta et al. (1992) were used as the operational equations for the one- and three-step methods, respectively. For each set of parameters described earlier, 100 time-activity curves with added variability were generated. The values for CBF used in the three-step method were the input values of K H 2 O 1 to which were added 5% Gaussian-distributed noise. Five percent Gaussian-distributed noise also was added to the values of CBV used in the three-step method, which were 4 ml hg−1 in the baseline state and 6 ml hg−1 for the first and 7 ml hg−1 for the second activation condition, respectively. The added noise accounted for only the noise found in individual tomographies and not the variability expected between the three sessions of the three-step method.
The values of CBV were chosen to be higher than the values of V0 because of the different distributions of whole-blood and oxygen in the vascular bed. To allow a realistic comparison, both V0 and CBV were increased during the simulated activations, but CBV was increased less than V0 (50% and 75% versus 100%, respectively). The same V0 was chosen for the two activations, whereas CBV was further increased for the second activation to account for hypothetical recruitment of capillaries when a major increase of oxygen consumption was simulated for the three-step method. This is in contrast to the one-step method in which recruitment of total volume must be counterbalanced by decreased transmission of oxygen tracer when a major increase of oxygen was simulated.
Subjects
The subjects were six right-handed men who completed a questionnaire that screened for neurologic deficits. Informed consent was obtained from each participant, and the protocol was approved by the Research Ethics Committee of the Montreal Neurological Institute. The subjects were positioned in the tomograph with their heads immobilized in a headrest. A short indwelling catheter was placed in the left radial artery for blood sampling. In all subjects, PET scans were performed in rapid succession after the bolus administration of radioactive water, carbon monoxide, and oxygen, in that order, with an interval of 15 to 20 minutes between successive tracer administrations, as described in detail by Meyer et al. (1987).
Radioisotope preparation and tomography
The radiolabeled tracers [15O] water and [15O]oxygen were prepared on site in a cyclotron (BC-107, Japan Steel Works, Yokohama, Japan). Tomography was performed using the Positome IIIp, a two-ring, three-plane head-tomograph with properties described in detail by Cooke et al. (1984), Thompson et al. (1986), and Ohta et al. (1992). The subjects were positioned in the tomograph with the image planes located 35, 53, and 71 mm above the inferior orbitomeatal reference line. Attenuation correction was performed using a projection thresholding method similar to that of Bergström and et al. (1982). For image reconstruction, a 12-mm FWHM Hanning filter was used. All subjects also underwent magnetic resonance imaging on a 1.5-T Philips Gyroscan. The magnetic resonance image volume consisted of 64 contiguous planes of 2 mm thickness and was coregistered with the PET data by the method of Evans et al. (1989).
Water study
For both the implementation of the three-step method described by Meyer et al. (1987) and the novel one-step method of Ohta et al. (1992), a bolus of approximately 1.6 GBq (40 mCi) of [15O] water was injected into the antecubital vein of the right arm. Arterial blood sampling and dynamic imaging began at injection time. A total of 21 frames with durations of 5 seconds (12), 10 seconds (6), and 20 seconds (3) were acquired over a period of 3 minutes and corrected for decay. Arterial blood samples were collected manually at approximately 5-second intervals and assayed in a well-counter calibrated to the tomograph. The delay in tracer arrival between the brain and the peripheral sampling site was corrected according to the global fitting method of Iida et al. (1988). For tracer dispersion, a time constant of 4 seconds (Iida et al., 1986; Meyer, 1989) was assumed. A regional water clearance (K H 2 O 1) map was generated according to the two-compartment model of Ohta et al. (1996). This method allowed us to measure water clearance without interference from intravascular radioactivity (Fujita et al., 1993, 1997). Estimates of CBF also were obtained using a one-compartment model as described by Meyer et al. (1987, 1989). This estimate of CBF subsequently was used in the conventional three-step method to determine CMR O 2 .
Carbon monoxide study
In the second step of the three-step method, carbon [15O]monoxide was used to measure CBV. After inhalation, 2 minutes were allowed for equilibration followed by a 3-minute PET scan, during which three arterial blood samples were withdrawn. The CBV was calculated by the method of Grubb et al. (1978) using a small-to-large vessel hematocrit ratio of 0.85.
Oxygen study
Using information from the water and carbon monoxide studies, we compared the implementation of the three-step method described by Meyer et al. (1987) with the one-step, single-breath inhalation method of Ohta and associates (1992). In the three-step method, [15O]oxygen inhalation is required to calculate the oxygen extraction fraction (E O 2 ). Radiolabeled oxygen gas was supplied from the cyclotron to a lead-shielded rubber bag of medical air at the subject's side, where it was mixed. After sufficient activity had accumulated, the nose-clamped subject inhaled the gas (2 to 3 GBq, 60 to 80 mCi) through a mouthpiece and a short connecting ventilator hose. Arterial blood sampling and tomography began at the time of inhalation with the same schedule used for the water study. Using each method, maps of regional CMR O 2 were generated using weighted integration (Ohta et al., 1992) with the tracer delay and dispersion corrections described earlier.
Vibrotactile stimulation
Subjects were studied under two conditions. In the baseline condition, ears were plugged, eyes covered, noise subdued, and room lights dimmed. In the activation condition, vibrotactile stimulation was performed with a mechanical vibrator (Model 91, Daito, Osaka, Japan), fixed to the fingertips of the right hand, at a frequency of 110 Hz and an amplitude of 2 mm. The vibrator was turned on for 1 second, then turned off for 1 second during the entire scan to avoid habituation. For each of the scans, stimulation was commenced at the time of isotope delivery.
Image analysis
The postcentral gyrus was identified by superposition of individually matched PET and MR images. The CBF and K H 2 O 1 images for the activation condition were analyzed by placing circular regions of interest with a diameter of 2 cm over the area with the highest focal change in the postcentral gyrus of the hemisphere contralateral to the hand stimulated. The center of each region of interest was identified as the pixel of maximum focal CBF or K H 2 O 1 change. The regions of interest so determined then were transposed under computer control onto the corresponding baseline CBF, K H 2 O 1, CBV, and CMR O 2 images. Mean values of CBF, K H 2 O 1, CBV, and CMR O 2 were obtained for the focus in the somatosensory cortex. In addition, the mean values of these parameters in intracerebral pixels within the entire brain section imaged by the three simultaneous slices (“whole brain”) were calculated. Normalization of the absolute values in the focus by mean whole brain values was performed to correct for global changes in the parameter under study. Both absolute and normalized values were compared pairwise-activation versus baseline condition-using two-tailed paired t tests. The Bonferroni correction was used to correct for multiple comparisons.
RESULTS
Table 1 shows the results of the three-step analysis, including the value of CBF according to the one-compartment model used for this analysis. Vibrotactile stimulation elicited an average increase in regional CBF of 27%, compared with 2% in the contralateral hand area. Regional CBV in the hand area also increased significantly by 15% during vibrotactile stimulation. No increase in regional CMR O 2 was detected by this method. Table 2 shows the results of the one-step analysis, including the value for unidirectional water clearance (K H 2 O 1) according to the two-compartment model. Vibrotactile stimulation elicited an average increase in K H 2 O 1 of 26% but no increase in regional CMR O 2 .
Regional CBF and CMR O 2 estimated with the 3-step method under baseline and activation conditions
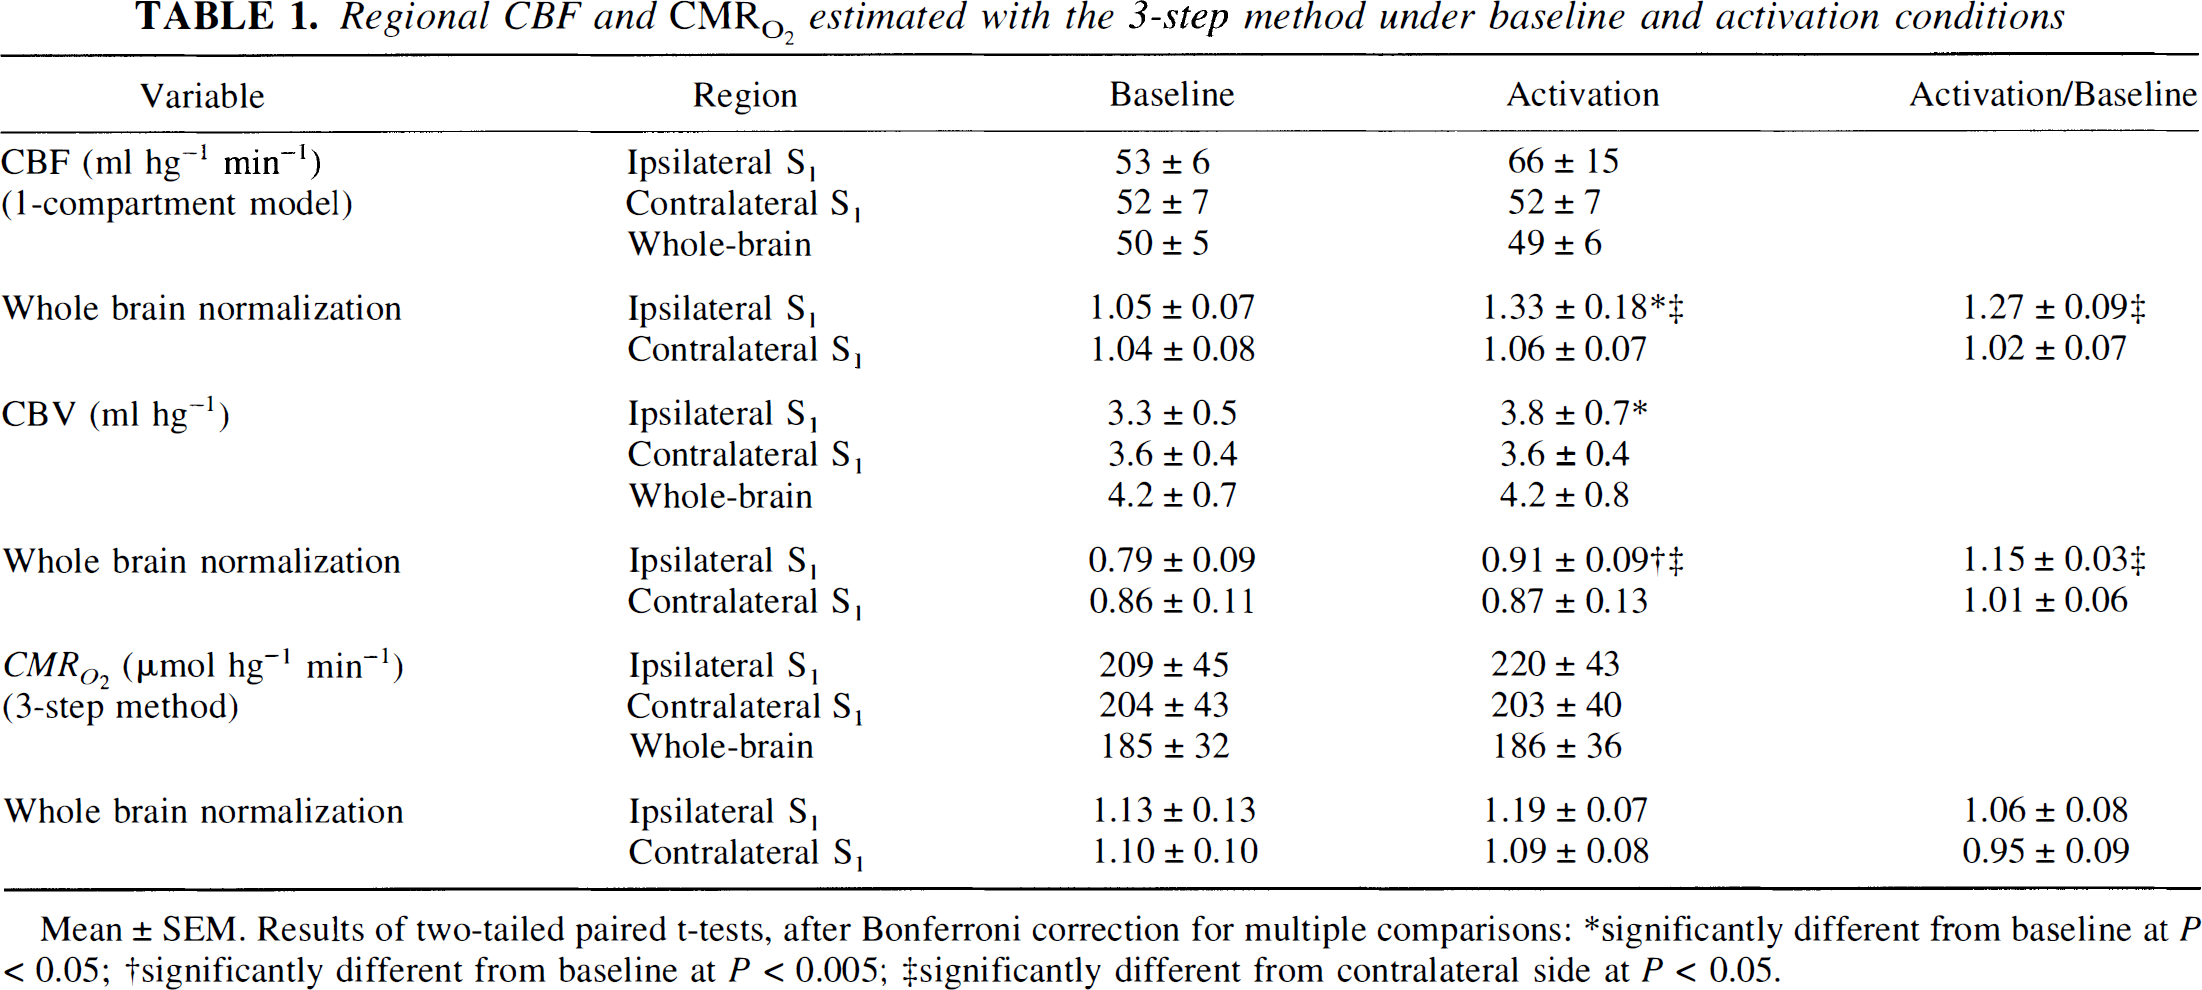
Mean ± SEM. Results of two-tailed paired t-tests, after Bonferroni correction for multiple comparisons:
significantly different from baseline at P < 0.05;
significantly different from baseline at P <0.005;
significantly different from contralateral side at P <0.05.
Regional K H 2 O 1 and CMR O 2 estimated with the 1-step method under baseline and activation conditions
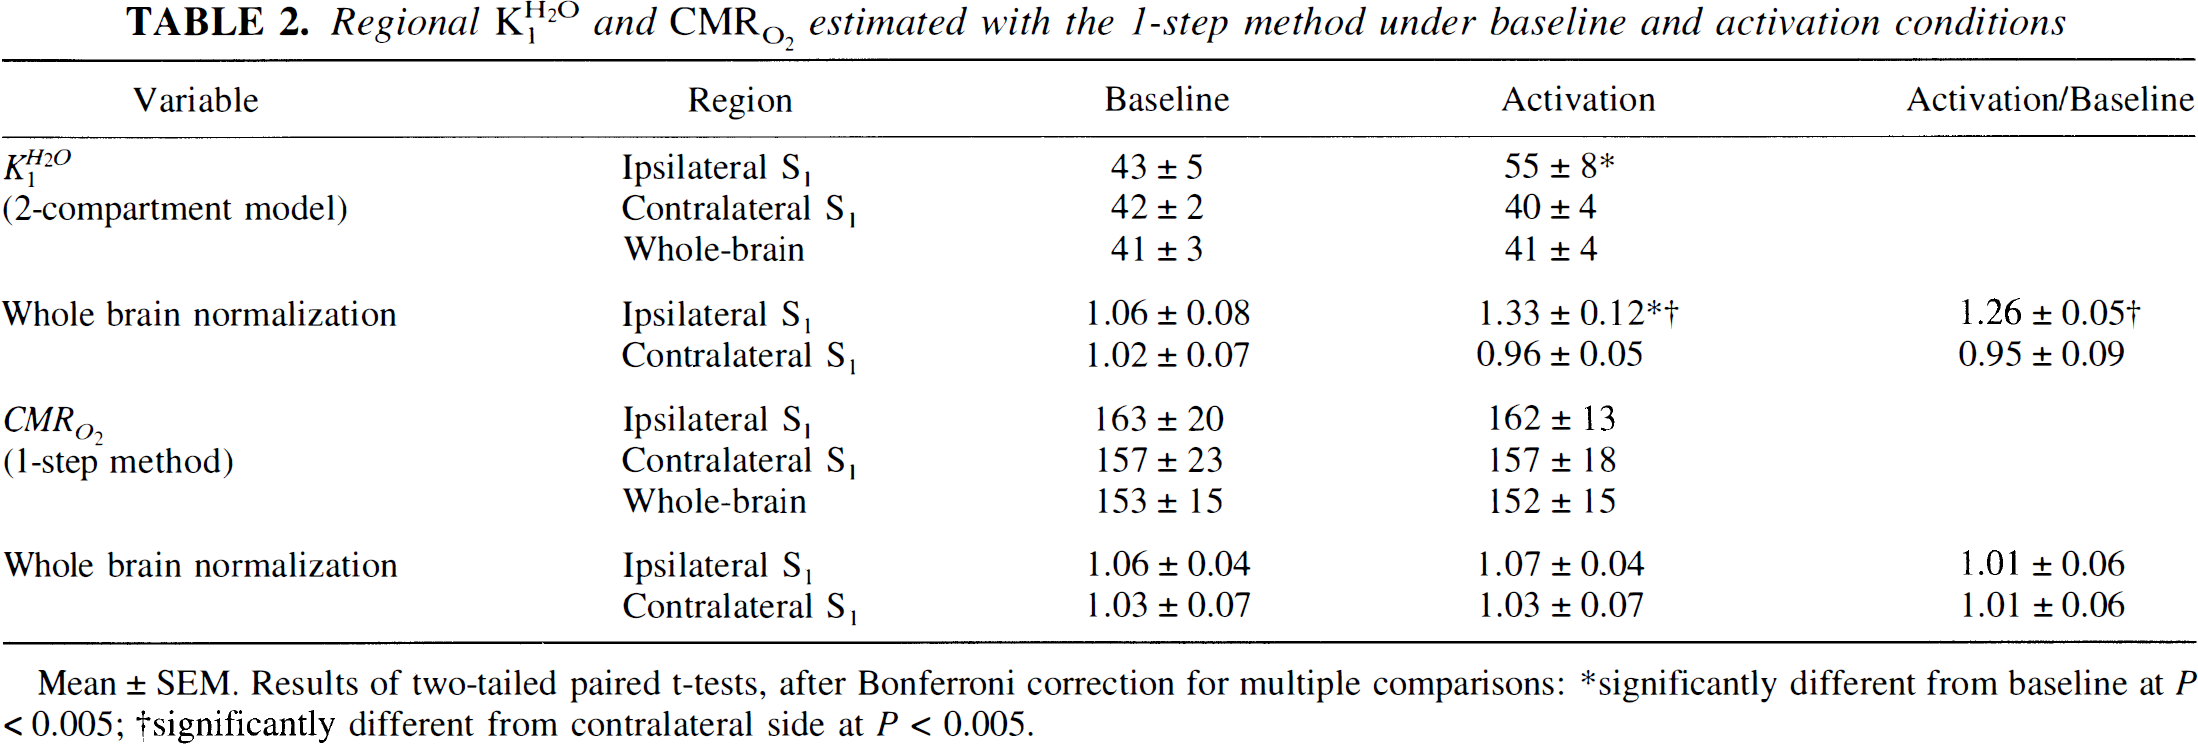
Mean ± SEM. Results of two-tailed paired t-tests, after Bonferroni correction for multiple comparisons:
significantly different from baseline at P < 0.005;
significantly different from contralateral at P <0.005;
Table 3 shows the results of the analysis of simulated data. For simulated increases in CMR O 2 of 5% and 25% the one-step method yielded increases of 4% and 25%, respectively, at a 5% noise level. The corresponding increases in CMR O 2 obtained with the three-step method were 5% and 26%.
Simulation results of CMR O 2 determinations with 3-step and 1-step methods under baseline and activation conditions (n = 100 simulations)
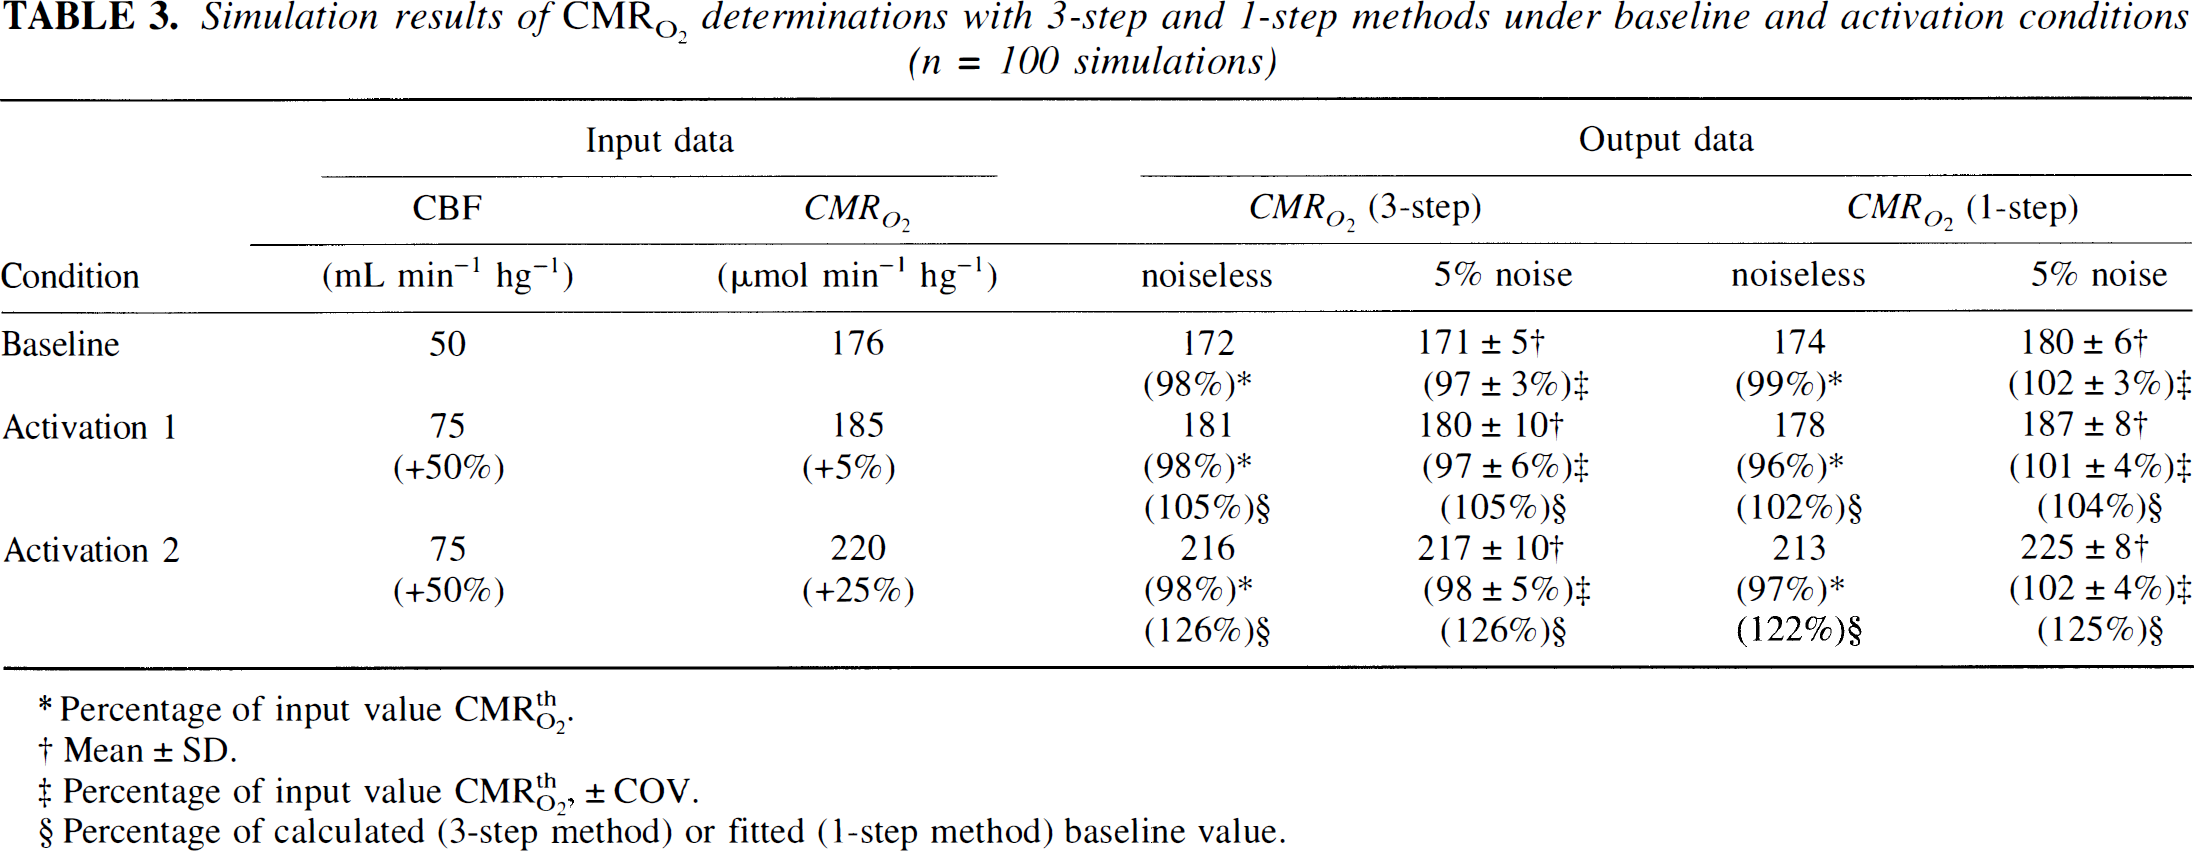
Percentage of input value CMRthO2.
Mean ± SD.
Precentage of input value CMRthO2, ± COV.
Precentage of calculated (3-step method) or fined (1-step method) baseline value.
DISCUSSION
In this study, we did not observe a significant increase in CMR O 2 , estimated with a novel one-step method, in the somatosensory cortex during vibrotactile stimulation. The results of the current study reject the hypothesis that the failure to detect an increase in the oxygen consumption of the human somatosensory cortex during vibrotactile stimulation is an artefact caused by the three-step methods used by previous workers (Frackowiak et al., 1980; Mintun et al., 1984). Our data concur with data on the magnetic resonance imaging blood oxygen level dependent signal, which also show the lack of an increase in CMR O 2 commensurate with the increase in CBF during functional activation of the brain (Ogawa et al., 1990).
The need to combine information from three separate PET studies for the calculation of oxygen consumption is a feature of both methods previously used for this purpose: the steady-state method (Frackowiak et al., 1980) and the sequential bolus method (Mintun et al., 1984). Both of these methods calculate the oxygen consumption from the equation
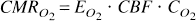
where CMR O 2 is the steady-state oxygen consumption rate, E O 2 the steady-state oxygen extraction fraction, CBF the steady-state blood flow, and C O 2 the steady-state concentration of native oxygen in arterial blood.
Equation (2) provides a summary of the factors in the three-step methods, which in theory might have contributed to artefactually low increases in oxygen consumption during vibrotactile stimulation. Mintun et al. (1984) validated the estimation of E O 2 with the three-step method against independent measurements in experimental animals. However, in unanesthetized human subjects, changes in the individual parameters between the separate measurements because of departures from steady state or movement of the subjects between the measurements may affect estimates of E O 2 . In addition, in the three-step method, labeled water generated from labeled oxygen is assumed to be freely exchangeable with extravascular water, leaving brain tissue at a rate equal to the ratio of water clearance and its equilibrium tissue-blood partition volume (Mintun et al., 1984). Furthermore, the three-step method uses estimates of CBF obtained using a one-compartment model, which ignores the effects of intravascular radioactivity. The influence of these factors is reflected in the difference between the average baseline estimates of oxygen consumption of the two methods. Although the two methods yielded similar estimates of the relative change in oxygen consumption with vibrotactile stimulation, changes in the individual parameters between the separate measurements may have been responsible for the large variability in CMR O 2 estimated with the three-step method. The doubling of the variance in the absolute measurements by the three-step method could therefore be attributed to run-to-run variation, suggesting that run-to-run variation is of the same magnitude as in tomography Gaussian noise. Run-to-run variation in the three-step method may differ among different tasks used to stimulate the neuronal activation.
The one-step method addresses the potential deficiencies of the three-step method by removing the requirement for measurements of CBF and CBV. The three-step method uses measurements of oxygen uptake, CBV, and CBF to determine E O 2 , only to multiply the latter two parameters to calculate the rate of oxygen consumption in equation (2). The product of E O 2 and CBF is a clearance, K O 2 1, equal to the ratio between the oxygen consumption rate and the arterial oxygen concentration
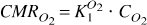
In principle, this clearance can be determined independently of the measurements of blood flow and blood volume, as described originally by Gjedde (1980, 1981) and for tracer oxygen by Ohta et al. (1992).
Both the three-step method and the one-step method assume that the net oxygen clearance in the steady state is equal to the initial clearance of labeled oxygen, that is, that tissue levels of oxygen are essentially nil, or that a transient equilibrium is instantaneously established, in which case the venous tension of oxygen equals the tissue tension. Between these extremes, tracer oxygen clearance would vary as a function of circulation time, and E O 2 in equation (2) would be incorrectly determined by both the sequential and single bolus methods. However, Ohta et al. (1992) summarized the evidence supporting the assumption that on its entry into the normal brain, oxygen is immediately metabolized to water, rendering tissue levels of oxygen negligible.
In conclusion, we present data showing that the failure to detect an increase in CMR O 2 in the human somatosensory cortex during vibrotactile stimulation is not an artefact of the three-step methods used by previous workers to estimate CMR O 2 . In this study, the one-step method addressed the potential deficiencies of the three-step method, allowing the estimation of CMR O 2 in 3 minutes without separate measurements of CBF and CBV. With this method, no significant increase in CMR O 2 was detected in the somatosensory cortex during vibrotactile stimulation. The results also reject the converse hypothesis, namely that observations of increased oxygen consumption by the one-step method could be artefacts caused by insufficient correction for increases of recirculating tracer water during conditions of increased blood flow (Marrett and Gjedde, 1997; Vafaee et al., 1998, 1999).
Footnotes
Acknowledgements
The authors thank the technical staff of the McConnell Brain Imaging Centre for their assistance.