We report regional rates of cerebral protein synthesis (rCPS) in 10 healthy young males, each studied under two conditions: awake and anesthetized with propofol. We used the quantitative l-[1-11C]leucine positron emission tomography (PET) method to measure rCPS. The method accounts for the fraction (1) of unlabeled leucine in the precursor pool for protein synthesis that is derived from arterial plasma; the remainder comes from proteolysis of tissue proteins. Across 18 regions and whole brain, mean differences in rCPS between studies ranged from 5% to 5% and were within the variability of rCPS in awake studies (coefficient of variation range: 7% to 14%). Similarly, differences in Λ (range: 1% to 4%) were typically within the variability of Λ (coefficient of variation range: 3% to 6%). Intersubject variances and patterns of regional variation were also similar under both conditions. In propofol-anesthetized subjects, rCPS varied regionally from 0.98 ± 0.12 to 2.39 ± 0.23 nmol g−1 min−1 in the corona radiata and in the cerebellum, respectively. Our data indicate that the values, variances, and patterns of regional variation in rCPS and Λ measured by the l-[1-11C]leucine PET method are not significantly altered by anesthesia with propofol.
The L-[1-11Clleucine PET method (Schmidt et al, 2005; Smith et al, 2005) for the determination of regional rates of cerebral protein synthesis (rCPS) is anticipated to have broad utility as a clinical and research tool. We have recently implemented the method in awake, healthy young men and shown that reproducible measurements of rCPS with low variability can be obtained (Bishu et al, 2008).
Such in vivo measurements of rCPS are likely to become valuable tools in the study of disorders such as fragile X syndrome (Hagerman et al, 2005), Rett syndrome (Chahrour and Zoghbi, 2007), Angelman syndrome (Jedele, 2007), tuberous sclerosis, and autism (Schmitz and Rezaie, 2008), which might be associated with dysregulation of cerebral protein synthesis, as suggested by abnormal rates of growth and hyper- and hypoplasticity. High quality PET data acquisition requires that patient motion in the scanner be minimized. However, many patient with these syndromes may not tolerate long periods of motionlessness while awake. It may therefore be necessary to study such subjects under sedation or anesthesia. This presents the potential problem that anesthesia itself may alter rCPS and may mask the measurable effects of the disease or the potential treatment under evaluation. Anesthetic/sedative agents are known to alter cerebral blood flow and cerebral metabolic rates for glucose (Alkire et al, 1995; Fiset et al, 1999). Moreover, both the regional extent and magnitude of effect(s) vary with the pharmacologic agent and possibly, with the depth of sedation/anesthesia (Alkire et al, 1995; Fiset et al, 1999; Lenz et al, 1999).
Our first study in humans established both the intersubject variability of rCPS in healthy awake adult males and the precision of the l-[1-11C]leucine PET method, by measuring rCPS twice in a single group of subjects under identical conditions (test-retest) (Bishu et al, 2008). We found good reliability with differences ranging from 9% in cortical areas to 15% in white matter regions for retest intervals ranging from 3 weeks to 10 months. As we plan to study subjects with neurodevelopmental disorders, we further require knowledge of the effect of the anesthetized state and anesthetic agent on rCPS to judiciously plan studies and accurately interpret data. The purpose of this study, therefore, was to determine the effects of anesthesia on rCPS. We studied 10 healthy young male volunteers who each underwent two l-[1-11C]leucine PET studies: awake and anesthetized with 2,3-diisopropylphenol (propofol). These subjects had not participated in our earlier l-[1-11C]leucine PET study (Bishu et al, 2008). Our measurements show no significant effects of propofol anesthesia on values of rCPS in all examined regions.
Materials and methods
Subjects
Ten right-handed healthy male subjects (mean age: 22 years, range: 20 to 24) were prospectively enrolled after evaluation by clinical history and physical examination. Exclusion criteria included (1) current or past diagnosis of a psychiatric, neurologic, or general medical condition; (2) family history of genetically transmissible neurologic disorder; (3) history of neurologic trauma; (4) history of harmful/paradoxical reactions to general and/or local anesthetics; (5) allergy to egg and soy proteins; and (6) HIV (human immunodeficiency virus) positivity. Psychiatric evaluation was performed using the structured clinical interview that identifies diagnoses based on the diagnostic and statistical manual of mental disorders IV criteria (Ventura et al, 1998). Each subject underwent two l-[1-11C]leucine PET studies, one awake and another with propofol anesthesia. Each subject also underwent one magnetic resonance imaging (MRI) scan of the brain. The order of awake and anesthetized studies was randomized; all studies were completed over a 13-month interval. The interval between scans was not fixed, as our earlier study had shown no relationship between test-retest reproducibility and interscan intervals ranging from 18 to 292 days (Bishu et al, 2008). In this study, the interscan interval ranged from 14 to 242 days with a median 41 days. The protocol was approved by the National Institutes of Health Combined Neuroscience Institutional Review Board and the National Institutes of Health Radiation Safety Committee. All subjects gave written informed consent before study enrollment.
Intelligence Quotient and Cognitive Testing
Clinical psychologists administered the Wechsler Adult Intelligence Scale, third edition, to all enrolled subjects at the time of screening to determine the intelligence quotient. As propofol has amnestic properties (Vanlersberghe and Camu, 2008), the effect of propofol anesthesia on verbal learning and memory was assessed with the Hopkins Verbal Learning Test-Revised (HVLT-R), which assesses immediate recall, delayed recall, and delayed recognition (Frank and Byrne, 2000). The test requires participants to recall and recognize a 12-word list, immediately and after a delay interval of 4h. The subjects were analyzed by the HVLT-R before the propofol anesthesia study and a different version was used before the awake study so that each subject could serve as his own control. As anxiety may confound the learning trials and affect the HVLT-R results, all subjects were administered the State-Trait Anxiety Inventory (STAI) to assess immediate and general levels of anxiety before each PET study (Gros et al, 2007).
Brain Magnetic Resonance Imaging
All subjects underwent a non-contrast T1-weighted MRI of the brain for region of interest (ROI) placement and to exclude structural brain abnormalities. Magnetic resonance imaging examinations were carried out using a head coil on a 1.5 T Signa (GE Medical Systems, Milwaukee, WI, USA). Images were reconstructed to voxel dimensions of 0.94 mm x 0.94 mm x 1 mm-1.2 mm or 0.87mm x 0.87mm x 1 mm, and were interpolated to isotropic voxel dimensions of (0.94 mm3) or (0.87 mm3). The regions of interest were placed on each MRI by visually identifying anatomic landmarks and manually outlining the individual regions and whole brain. The cerebellum ROI excluded the cerebellar peduncles and vermis.
L-[1-11C]Leucine Synthesis
D,L-[1-11C]Leucine was prepared from H11CN with a modified Strecker-Bucherer reaction (Studenov et al, 2003). Pure l-amino-acid was isolated from the racemic mixture by chiral HPLC (high performance liquid chromatography) using a Chirobiotic T column (10 mm x 250 mm; Advanced Separation Technologies Inc., Whippany, NJ, USA), mobile phase of ethanol/water: 5:95 (v/v), and a flow rate of 3 mL/min. Retention times of the l- and d-isomers were approximately 7 and 8 mins as determined by the corresponding standards. At the end of synthesis, l-[1-11C]leucine was obtained with a radiochemical purity of >99% and an estimated specific activity of 3 mCi/nmol. The measured specific activity at the time of injection was 0.65 ± 0.43 mCi/nmol (mean ± s.d.).
PET Studies
The procedure for l-[1-11C]leucine PET studies has been described in detail earlier (Bishu et al, 2008). Briefly, studies were carried out after an overnight 8-h fast. Arterial lines were placed in the radial artery, and intravenous lines were placed in the antecubital fossa and/or the wrist. In the propofol studies, separate intravenous lines were placed for radiotracer and anesthetic administration. After placements of targets for the Polaris® optical tracking system, subjects were placed in the scanner for a 3-min transmission scan to determine optimal bed positioning within the scanner field of view. This was followed by a 6-min transmission scan for attenuation correction. Head position information was continuously recorded throughout the scanning procedure by the Polaris System, which has an accuracy of 0.5 to 0.6 mm, to allow for motion correction of the emission data during image reconstruction (Carson et al, 2003). Ninety-minute dynamic emission scans were then initiated coincident with the intravenous infusion of l-[1-11C]leucine.
All studies followed similar procedures except that, during anesthesia studies, the subjects were removed from the scanner after the 6-min transmission scan for induction of anesthesia; they were subsequently repositioned in the scanner at the coordinates determined earlier. This was done to ensure safety because (1) induction may be associated with involuntary head movements that could result in head trauma if subjects were left inside the scanner and (2) it was necessary to have immediate access to the airway if propofol caused acute respiratory or cardiac complications during induction. Propofol was not administered until we had confirmation of successful l-[1-11C]leucine synthesis. Therefore, to minimize delays and maximize activity available for injection, while still allowing adequate time for safe induction of anesthesia, we obtained positioning and transmission scans before anesthesia administration; this necessitated the removal of subjects during induction.
For all scans, subjects received 18 to 31 mCi of l-[1-11C]leucine administered over 2 mins (excepting one study in one subject who underwent a 1-min infusion). The injected dose in awake and anesthetized subjects was 26.6 ± 3.5 (mean ± s.d.) and 26.2 ± 3.0 mCi, respectively. The administered doses were based on dosimetry data and were weight-based (awake: 0.32 ± 0.06 mCi/kg, sedated: 0.31 ± 0.06 mCi/kg). The goal was to maximize the dose within protocol-approved limits without exceeding the count rate of the HRRT (high resolution research tomograph).
Arterial blood gases were determined at baseline and 60 mins for awake studies and at baseline, 30, 60, and 90 mins for anesthesia studies. Baseline is defined as the time immediately before radiotracer administration (for awake studies) or before propofol and radiotracer administration (for anesthesia studies).
All studies were carried out on the ECAT HRRT (CPS Innovations, Knoxville, TN, USA). Data were acquired in list mode and reconstructed using the motion-compensated 3D (three-dimensional) ordinary Poisson ordered subset expectation maximum algorithm (30 subsets, 2 iterations) (Carson et al, 2003). Spatial resolution after reconstruction was ~2.6 mm full width at half maximum (FWHM) in the radial and transverse directions (Wienhard et al, 2002). Three-dimensional frames of data were reconstructed to 207 slices of 1.23 mm thickness (no interleaved slices) with a pixel size of 1.21 mm x 1.21 mm. The transverse and axial fields of view were 31.2 and 25.2 cm, respectively (Wienhard et al, 2002). Images were reconstructed as 42 frames of data (16 × 15, 4 × 30, 4 × 60, 4 × 150, 14 × 300 secs). All activities were decay-corrected to the time of radiotracer injection.
Propofol Anesthesia
During anesthesia studies, heart rate (electrocardiogram), blood pressure, oxygen saturation, capnography, and depth of anesthesia (Bispectral Index, A1050 BIS® monitor; Aspect Medical Systems, Newton, MA, USA) were monitored. Oxygen was administered through the nasal cannula throughout the study. Approximately 10 to 15 mins before l-[1-11C]leucine injection, anesthesia was administered with propofol. Upon loss of eyelash reflexes, to prevent airway obstruction, a nasopharyngeal airway was inserted in most subjects. Propofol was continuously infused intravenously and titrated to assure motionlessness, no response to verbal and tactile stimulus, and maintain BIS values below 60 (Gan et al, 1997). After completion of the emission scan, propofol was discontinued and the subjects were monitored in the postanesthesia care unit until fully awake.
Propofol Assay
Propofol and its derivatives were separated by means of reverse-phase HPLC on a C18 Spherisorb ODS 2 to 5 μm (25 cm x 4.6 mm) column with a C18 guard column. The mobile phase was water-acetonitrile-methanol (40:50:10, v/v/v) and the solvent flow rate was 2 mL/min. We used ultraviolet detection at 270 nm to determine concentrations of propofol in the column effluent. The assay was linear in the concentration range of 1 to 20 μg/mL (r = 0.999).
[11C]Leucine Blood Sample Analysis
Arterial blood sampling was initiated coincident with [11C]leucine infusion to determine the time courses of the concentrations of unlabeled and labeled leucine in plasma and total 11C and 11CO2 activities in whole blood. The samples were analyzed as described in detail earlier (Smith et al, 2008). Timed samples were hand drawn continuously (~1 sample/9 to 10 secs) for the first 4 mins and at increasing intervals thereafter for 40 samples per study. 11C activities in all samples were decay-corrected to the time of injection. Control samples were obtained before radiotracer and/or propofol administration.
PET Data Analysis
As described in detail previously (Bishu et al, 2008), for each study, a 3D volume, constructed from the average of the emission data acquired between 30 and 60 mins, was isotropically smoothed with a Gaussian filter (FWHM: 3 mm) and aligned to the respective MRI volume using the Flexible Image Registration Toolbox (Fischer and Modersitzki, 2004) with a 3D rigid body transformation. The resliced average PET image was visually reviewed for alignment with the MRI using VINCI software (Volume Imaging in Neurological Research, Co-Registration and ROIs Included; the Max Planck Institute for Neurological Research, Cologne, Germany). The transformation parameters were then applied to each frame of the PET study (without prior smoothing) to effect their alignment with the MRI volume. Regions of interest drawn on MRIs were transferred to l-[1-11C]leucine images to compute regional tissue time activity curves (TACs).
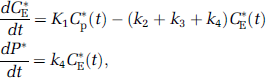
Kinetic Model
The model for the behavior of leucine in the brain has been described earlier (Schmidt et al, 2005) (Figure 1A). Briefly, the model includes five rate constants: K1 and k2 for carrier-mediated transport of leucine from plasma to brain and back from brain to plasma, respectively; k3 for metabolism of leucine to yield CO2; k4 for incorporation of leucine into protein; and k5 for the release of free leucine from proteolysis. The rate constants are identical for labeled and unlabeled leucine. We assume (1) steady state for unlabeled leucine and protein, (2) no significant breakdown of labeled protein in brain during the scanning interval (Lajtha et al, 1976), (3) negligible fixation of 11CO2 in brain during the scanning interval (Siesjo and Thompson, 1965), (4) instantaneous equilibration of 11CO2 between blood and brain (Buxton et al, 1987). Under these assumptions, the model can be reduced to a three tissue compartment model (Figure 1B), in which the concentration of 11C in the 11CO2 tissue compartment is known from measurements of 11CO2 in the blood and the equilibrium brain:blood distribution ratio for 11CO2 that was fixed at 0.41 (Brooks et al, 1984). The total concentration of 11C in the field of view of the PET camera at any time equals the sum of the tissue concentrations of free [11C]leucine, [11C]protein, and 11CO2, as well as activity in the blood in the brain.
Compartmental model for the l-[1-11C]leucine PET method. (A) The exchangeable leucine pool in the brain (unlabeled-CE or labeled-CE*) includes intracellular and extracellular free leucine and intracellular tRNA-bound leucine. K1 and k2 are the rate constants for carrier-mediated transport of leucine from plasma to tissue and back, respectively. k3 is the rate constant for the first two steps in leucine catabolism, transamination and decarboxylation. After an injection of leucine labeled on the carboxyl carbon, the only labeled metabolites in brain are α-ketoisocaproic acid (α-KIC), CO2, and products of CO2 fixation. As there is very little labeled ±-KIC in brain (Keen et al, 1989), this pool is not explicitly represented in the model, and k3 combines the transamination and decarboxylation reactions. k4 and k5 are the rate constants for leucine incorporation into protein and for the release of free leucine from proteolysis, respectively. Unlabeled leucine (CE) and protein (P) are assumed to be in a steady state. Labeled leucine is administered as a short infusion at the beginning of the study and is not in a steady state. Due to the long half-life of protein in the brain (Lajtha et al, 1976), it is assumed that there is no significant breakdown of labeled product (P*) during the experimental interval, i.e., k5P* ≈ 0. Labeled CO2 arises either through catabolism of labeled leucine in brain or through influx from blood after catabolism in other tissues. (B) We assume that fixation of 11CO2 is negligible during the experimental period (Buxton et al, 1987; Siesjo and Thompson, 1965), and that diffusible 11CO2 in brain rapidly equilibrates with the arterial blood (Buxton et al, 1987). Under these assumptions, the model for labeled leucine reduces to three tissue compartments, with the concentration in the tissue 11CO2 compartment known from the measurements of 11CO2 in the blood and the equilibrium brain:blood distribution ratio for 11CO2 (Schmidt et al, 2005). The total concentration of 11C in the field of view of the PET camera (CT*) includes CE*, P*, blood in the brain (VbCb*, where Vb is the fraction of the volume occupied by blood and Cb* the concentration of activity in whole blood) and 11CO2 in brain (VDCc*, where C*c is the 11CO2 activity in whole blood and VD the brain:blood equilibrium distribution volume of 11CO2), i.e.,
Time courses of CE* and P* are given by solution of the system of differential equations:
where Cp* is the plasma [11C]leucine concentration. In both panels A and B, the tissue is assumed to be homogeneous with respect to the concentrations of amino acids, blood flow, rates of transport and metabolism of amino acids, and rates of incorporation into protein.
Rate Constant Estimation
For each ROI, including whole brain, the rate constants (K1, k2 + k3, and k4) and blood volume (Vb) were estimated by means of a weighted, non-linear least-squares method to fit the model equation for total activity to the measured time courses of 11C activity in blood, 11CO2 in blood, free [11C]leucine in plasma, and the measured total activity in the ROI. Weights were inversely proportional to the standard deviation of the measured activity in each frame of data. According to Poisson statistics and assuming that the counts originate only in the region itself and that there are no other noise effects such as randoms or dead time, the variance (Var) was modeled as
where CT is the decay-corrected activity in the ROI, ti the midpoint of Frame i, γ the decay constant for 11C, Δti the length of Frame i, and N a coefficient of proportionality. The difference between the tracer arrival time in the brain and the arterial sampling site was estimated by shifting the blood curves from 0 to 20 secs, fitting the whole brain TAC, and selecting the delay time that produced the best fit of the data. Tracer appearance times in various parts of the brain differ from the mean of the brain as a whole by ± 2 secs (Iida et al, 1988); therefore, in each study, the whole brain tracer arrival delay value was used for all regions.
Determination of Λ and Regional Rates of Cerebral Protein Synthesis
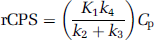
After estimation of the rate constants, rCPS was determined by the relationship
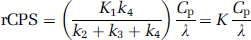
where Cp is the plasma concentration of unlabeled leucine. In terms of K, the net uptake rate constant for [11C]leucine, rCPS can also be expressed as
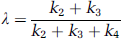
where Λ is the fraction of leucine in the precursor pool for protein synthesis derived from arterial plasma. Although rCPS may be directly calculated from Equation (2), the importance of Λ arises from its physiologic relevance. An effect on the value of Λ indicates a change in the relative fluxes of leucine into the precursor pool from the plasma and tissue proteolysis. Lambda (Λ) can be expressed in terms of the rate constants of the model as
(Schmidt et al, 2005). The accuracy of estimating Λ with the l-[1-11C]leucine PET method was confirmed in validation experiments in monkeys (Smith et al, 2005).
Statistical Analyses
Values reported are means ± s.d. in 10 subjects unless otherwise indicated. Differences between studies in psychologic test results, physiologic parameters, baseline plasma leucine concentration, estimated tracer arrival delay, regional estimates of K1,k2 + k3, and k4Vb, and half-life of the tissue exchangeable pool, and regional values of Λ and rCPS were tested for statistical significance by means of paired two-tailed Student's t-tests. With Bonferroni's corrections for comparisons in 18 regions and whole brain, a P-value of ≤ 0.0026 was our criterion for statistical significance. The reported percent differences between awake and propofol anesthesia are the means of the individual percentage differences for each region.
Results
All 10 subjects had normal or above average intelligence quotients (mean = 130 ± 14, 98th percentile). The STAI, administered before each PET study, measured both ‘trait’ (baseline) and ‘state’ (circumstance-dependent) anxiety. The subjects had trait and state anxiety scores in the low to average range (49th percentile or below for trait and 53rd percentile for state). We found no statistically significant difference in state anxiety scores measured before the awake and propofol anesthesia studies (P = 0.905). These results indicate that anxiety was unlikely to affect the assessment of memory. To test the effects of propofol anesthesia on memory consolidation, we used the HVLT-R 1.0 to 1.5 h before each PET study and tested the subjects 4.5 to 5.0 h later (approximately 2h after completion of the PET study). All subjects easily mastered the 12-word list, with scores in the average range (50th percentile). We found no statistically significant differences in the delayed recall of the word list between the awake and anesthetized studies (P = 0.334).
In anesthetized subjects, the mean arterial plasma propofol concentration over the 100- to 110-min period of propofol administration was 5.6 ± 1.2 (range: 4.2 to 8.1) μg/mL. Within a subject, propofol concentrations varied moderately over the study duration (mean coefficient of variation (CV): 24%). The time-weighted mean BIS value for subjects was 34 (range: 25 to 42), which is consistent with anesthesia (Gan et al, 1997). In keeping with variation in plasma propofol concentrations, there was moderate variation in BIS values over the course of any given study (mean CV: 17%).
There were no differences in physiologic variables measured before propofol administration (baseline) between studies (Table 1). The higher baseline arterial pO2 in Table 1 in sedated studies is because some measurements in this group were obtained after the administration of continuous nasal O2 (which was routinely done in all subjects before anesthesia induction). As expected, during propofol anesthesia, there were small increases in pCO2 and decreases in pH and mean arterial pressure (Vanlersberghe and Camu, 2008) (data not presented). There were also increases in heart rate, which were likely reflexive responses to decreases in the mean arterial pressure (data not shown). Across subjects, baseline unlabeled leucine concentrations in plasma were slightly higher (11% mean difference) in propofol anesthesia studies (mean ± s.d.: 118 ± 14, range: 98 to 148 nmol/mL) compared with those in awake studies (mean ± s.d.: 109 ± 21; range 72 to 156 nmol/mL) (nonsignificant, NS). Concentrations of the LNAAs (large neutral amino acids), that is, methionine, valine, isoleucine, leucine, tyrosine, and phenylalanine, which compete for entry into the brain through the l-amino acid transporter, were also measured over the course of each study, and the sum of the concentrations of the LNAAs, each weighted by its corresponding half-saturation constant for transport (km), was calculated (Smith et al, 2008). As km values in human brain are not known, the values determined in the adult rat were used (Smith et al, 1987). At baseline, the sums of the km-weighted plasma LNAA concentrations were slightly higher in anesthetized studies (mean ± s.d.: 11.9 ± 1.2; range: 10.3 to 14.5) compared with those in awake studies (mean ± s.d.: 11.2 ± 1.8; range: 8.3 to 14.7 nmol/mL) (NS). There was little fluctuation in plasma concentrations of unlabeled leucine throughout the duration of either the awake (CV: 1.3% to 7.4%) or propofol studies (CV: 2.6% to 6.1%) (NS). There was similarly little variation in the km-weighted LNAAs (awake CV: 0.4% to 5.7%, sedated CV: 0.6% to 4.7%) (NS). These data indicate that propofol anesthesia had no effect on either the plasma leucine concentration or competition for the blood-brain barrier transporter.
All values are intersubject means for 10 studies in 10 subjects except where indicated.
Normal range (fasting): 70–110 mg/dL.
Normal range: 40%–52%.
Normal range: 7.35–7.45.
Mean values for eight subjects.
Normal range: 35–45 mm Hg.
Normal range: 80–100 mm Hg.
Normal ranges represent population means.
The mean value is higher in the sedated group because all sedated subjects are routinely administered O2 (through nasal cannula), whereas all awake subjects were breathing only room air. The increased mean pO2 in the sedated group is therefore artifactual.
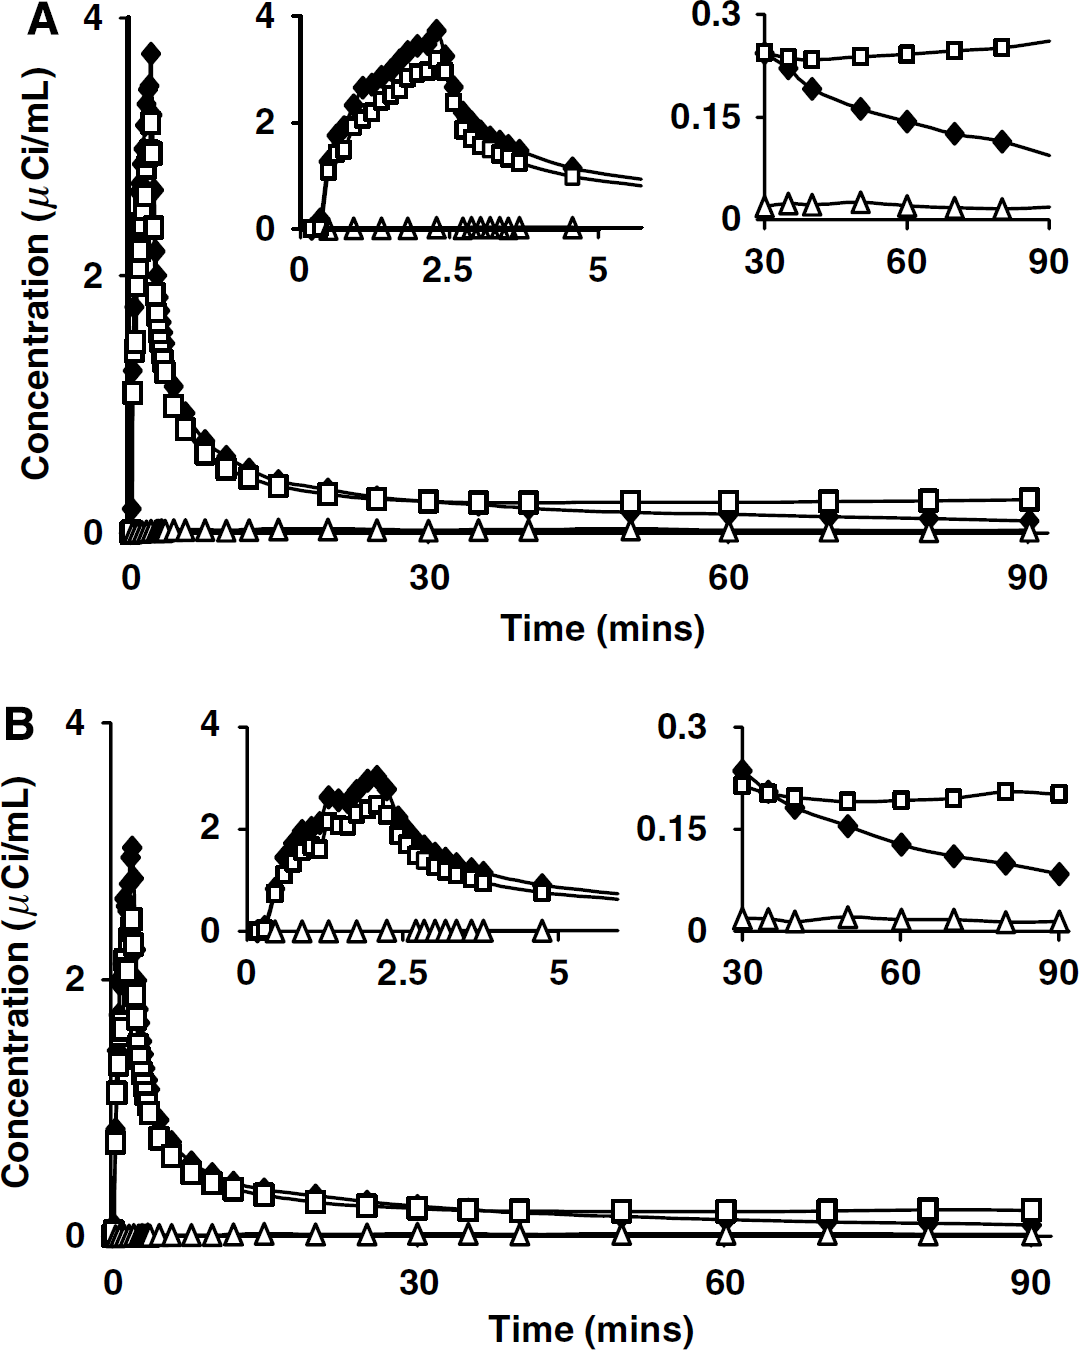
Time courses of the plasma [11C]leucine, whole-blood total 11C, and whole-blood 11CO2 concentrations from awake and propofol anesthesia studies in the same subject are shown in Figures 2A and 2B, respectively. Time courses of blood activities were similar in awake and anesthetized studies, except that plasma [11C]leucine and whole-blood total 11C activities typically appeared sooner and peaked slightly earlier in propofol anesthesia studies. After the initial peak, plasma [11C]leucine decreased for the remainder of the study. After reaching its peak, whole-blood activity also decreased rapidly for ~35 to 40 mins and slowly increased thereafter due to the incorporation in the liver of [11C]leucine into plasma proteins. Blood 11CO2 concentrations remained low throughout the study, and time courses were similar in awake and anesthetized conditions despite the slightly increased pCO2 associated with propofol administration. Assuming a brain:blood equilibrium distribution volume of 11CO2 (VD) of 0.41, the peak contribution of tissue 11CO2 to the total activity measured in the whole brain was 3.0% ± 0.7% (mean ± s.d.) in awake and 2.3% ± 0.5% in propofol studies. The very low contribution of tissue 11CO2 to the total activity indicates that kinetic model analyses should be quite robust with respect to changes in VD, that is, even relatively large changes in VD have little effect on estimated parameters. Therefore, we used the value of VD determined in awake subjects (Brooks et al, 1984) in the analysis of both awake and propofol studies.
Arterial clearance curves from (A) awake and (B) propofol-anesthetized studies in one subject. Closed diamonds (♦) represent plasma [11C]leucine concentration, open squares (□) represent whole blood total 11C concentration, and open triangles (Δ) represent whole blood 11CO2 concentration. Expanded abscissa (left inset) shows peak values of plasma [11C]leucine and whole-blood total 11C shortly after the end of the 2-min infusion. Expanded ordinate (right inset) shows clearance of plasma [11C]leucine and blood 11CO2, and slight increases in the whole-blood total 11C concentration after 40 mins. Injected doses were 26 mCi (awake) and 24 mCi (propofol).
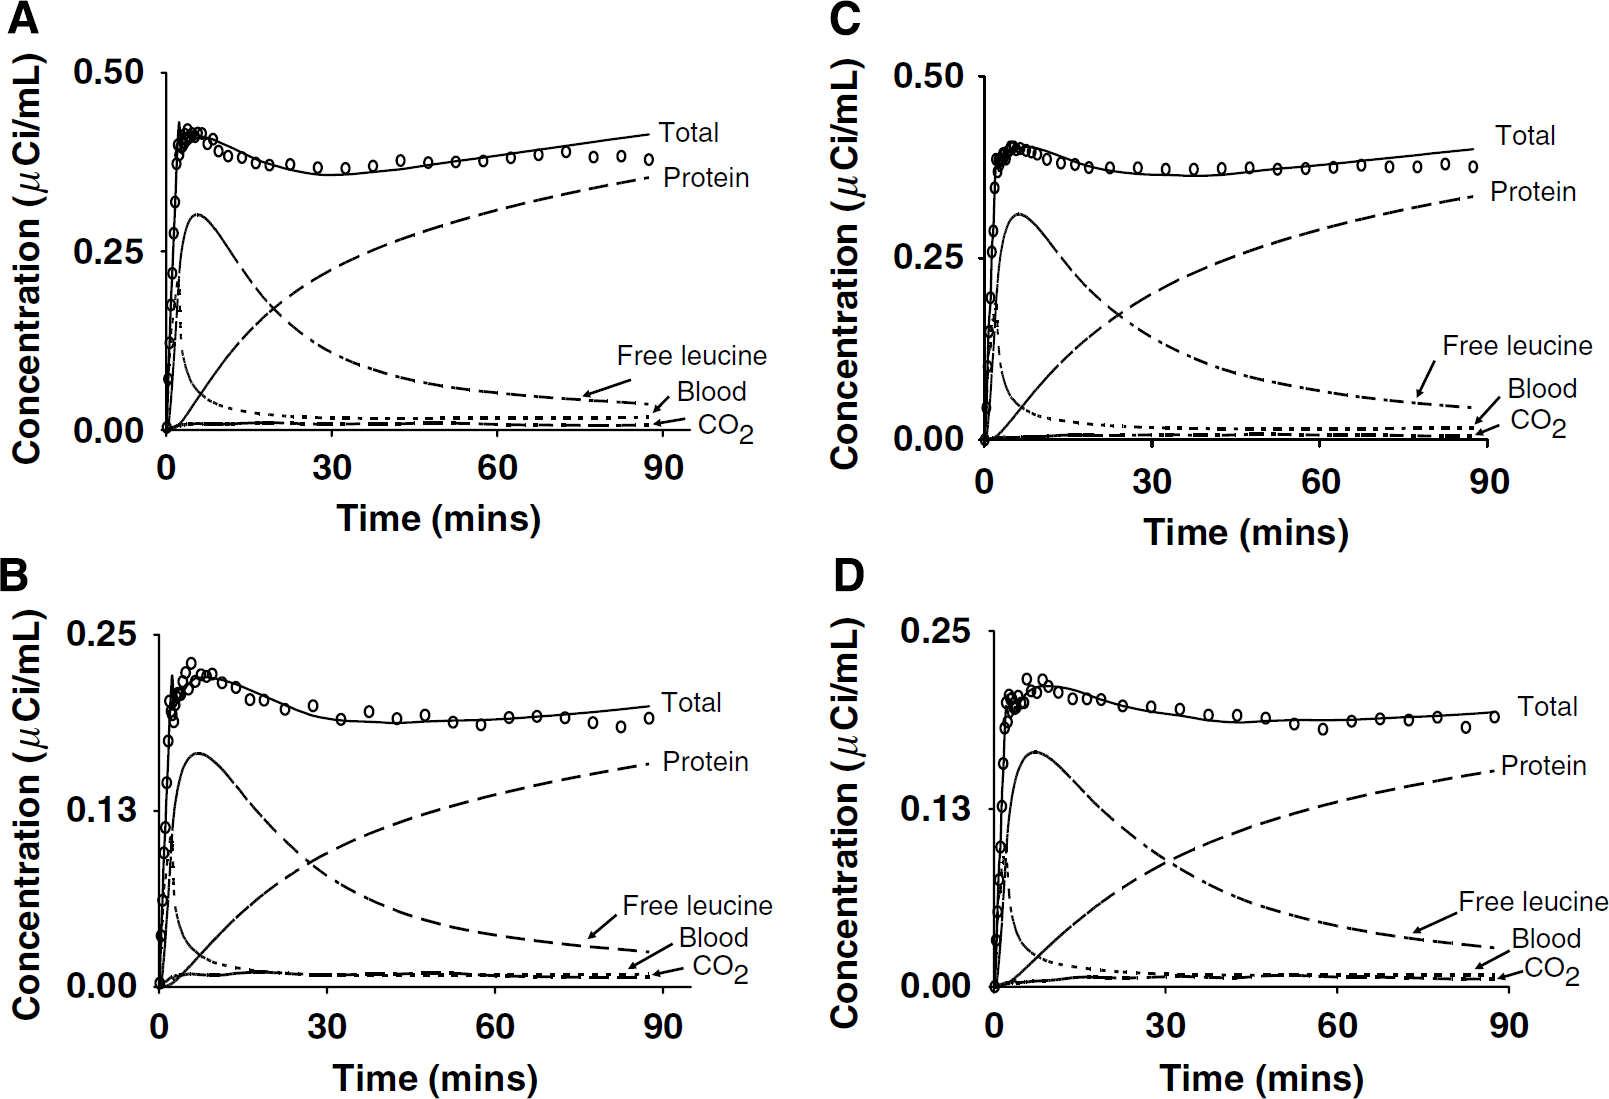
Time activity curves for a cortical and white matter region from a typical awake (Figure 3A and 3B, respectively) and propofol anesthesia study (Figures 3C and 3D, respectively) are shown. In general, TACs were similar between conditions in all regions examined, except that activity appeared slightly earlier in the propofol than in the awake studies. Total activity typically peaked within 5 to 7 mins and then decreased until reaching a nadir at 30 to 40 mins in most regions; thereafter, activity increased slowly or remained stable. In many ROIs, there was often a smaller, earlier peak corresponding in time to the peak in the whole blood total 11C activity (Figure 3A and 3B). Regional estimates of rate constants (Table 2) and Vb were used to calculate model-predicted time courses of 11C activity in tissue distributed among the blood, free [11C]leucine, 11CO2, and [11C]protein pools (Figures 3A to 3D). Clearance of the free [11C]leucine pool in tissue was generally slower in propofol anesthesia compared with that in awake; this is a function of the longer estimated half-life of free leucine in the tissue (ln2 [k2 + k3 + k4]) in propofol anesthesia studies (Table 2). Activity in the blood represented a large fraction of the total activity in each ROI at early times, but then decreased rapidly comprising ~4% to 5% by 90 mins. Model-predicted values of [11C]protein, [11C]leucine, and 11CO2 in the brain were approximately 80% to 85%, 9% to 11%, and 1% to 4%, respectively, of the measured total 11C activity in a ROI at 90 mins.
Time activity curves from the temporal cortex and corona radiata from typical awake (A and B, respectively) and propofol-anesthetized (C and D, respectively) studies in one subject. Open circles (O) and solid line represent the measured and fitted total activity in the ROI, respectively. As indicated in the figure, dashed and dotted lines represent model estimates of total 11C in blood in the brain, and concentrations of labeled protein, leucine, and 11CO2 in tissue. Parameter estimates in the temporal cortex were K1 = 0.041 mL g−1 min−1, k2 + k3 = 0.090 min−1, k4 = 0.036 min−1, and Vb = 0.066 in the awake study, and K1 = 0.048 mL g−1 min−1, k2 + k3 = 0.080 min−1, k4 = 0.029 min−1, and Vb = 0.071 in the propofol anesthesia study. Lambda (Λ) was 0.71 and 0.73 in the awake and propofol study, respectively; rCPS was 1.83 and 2.02 nmolg−1 min−1 in the awake and propofol study, respectively. Parameter estimates in the corona radiata were K1 = 0.022 mLg−1 min−1, k2 + k3 = 0.073 min−1, k4 = 0.026 min−1, and Vb = 0.035 in the awake study, and K1 = 0.027 mLg−1 min−1, k2 + k3 = 0.073 min−1, k4 = 0.023 min−1, and Vb = 0.041 in the propofol anesthesia study. Lambda (Λ) was 0.74 and 0.76 in the awake and propofol study, respectively; rCPS was 0.86 and 0.98 nmol g−1 min−1 in the awake and propofol study, respectively. Tracer delay was 4 secs and 1 sec in the awake and propofol anesthesia study, respectively. The poor fit, particularly evident in the temporal cortex, is consistent with the effects of tissue heterogeneity (Schmidt et al, 1991, 1992). Time activity curves are from the same studies for which the arterial clearance curves are shown in Figure 2. Note that the ordinate scales for the temporal cortex and white matter differ.
All values are means ± s.d. for 10 subjects, except where indicated.
Values for nine subjects.
Statistically significantly different from awake, paired Student's t-tests. The criterion for statistical significance with the Bonferroni correction for 19 comparisons was P≤0.0026.
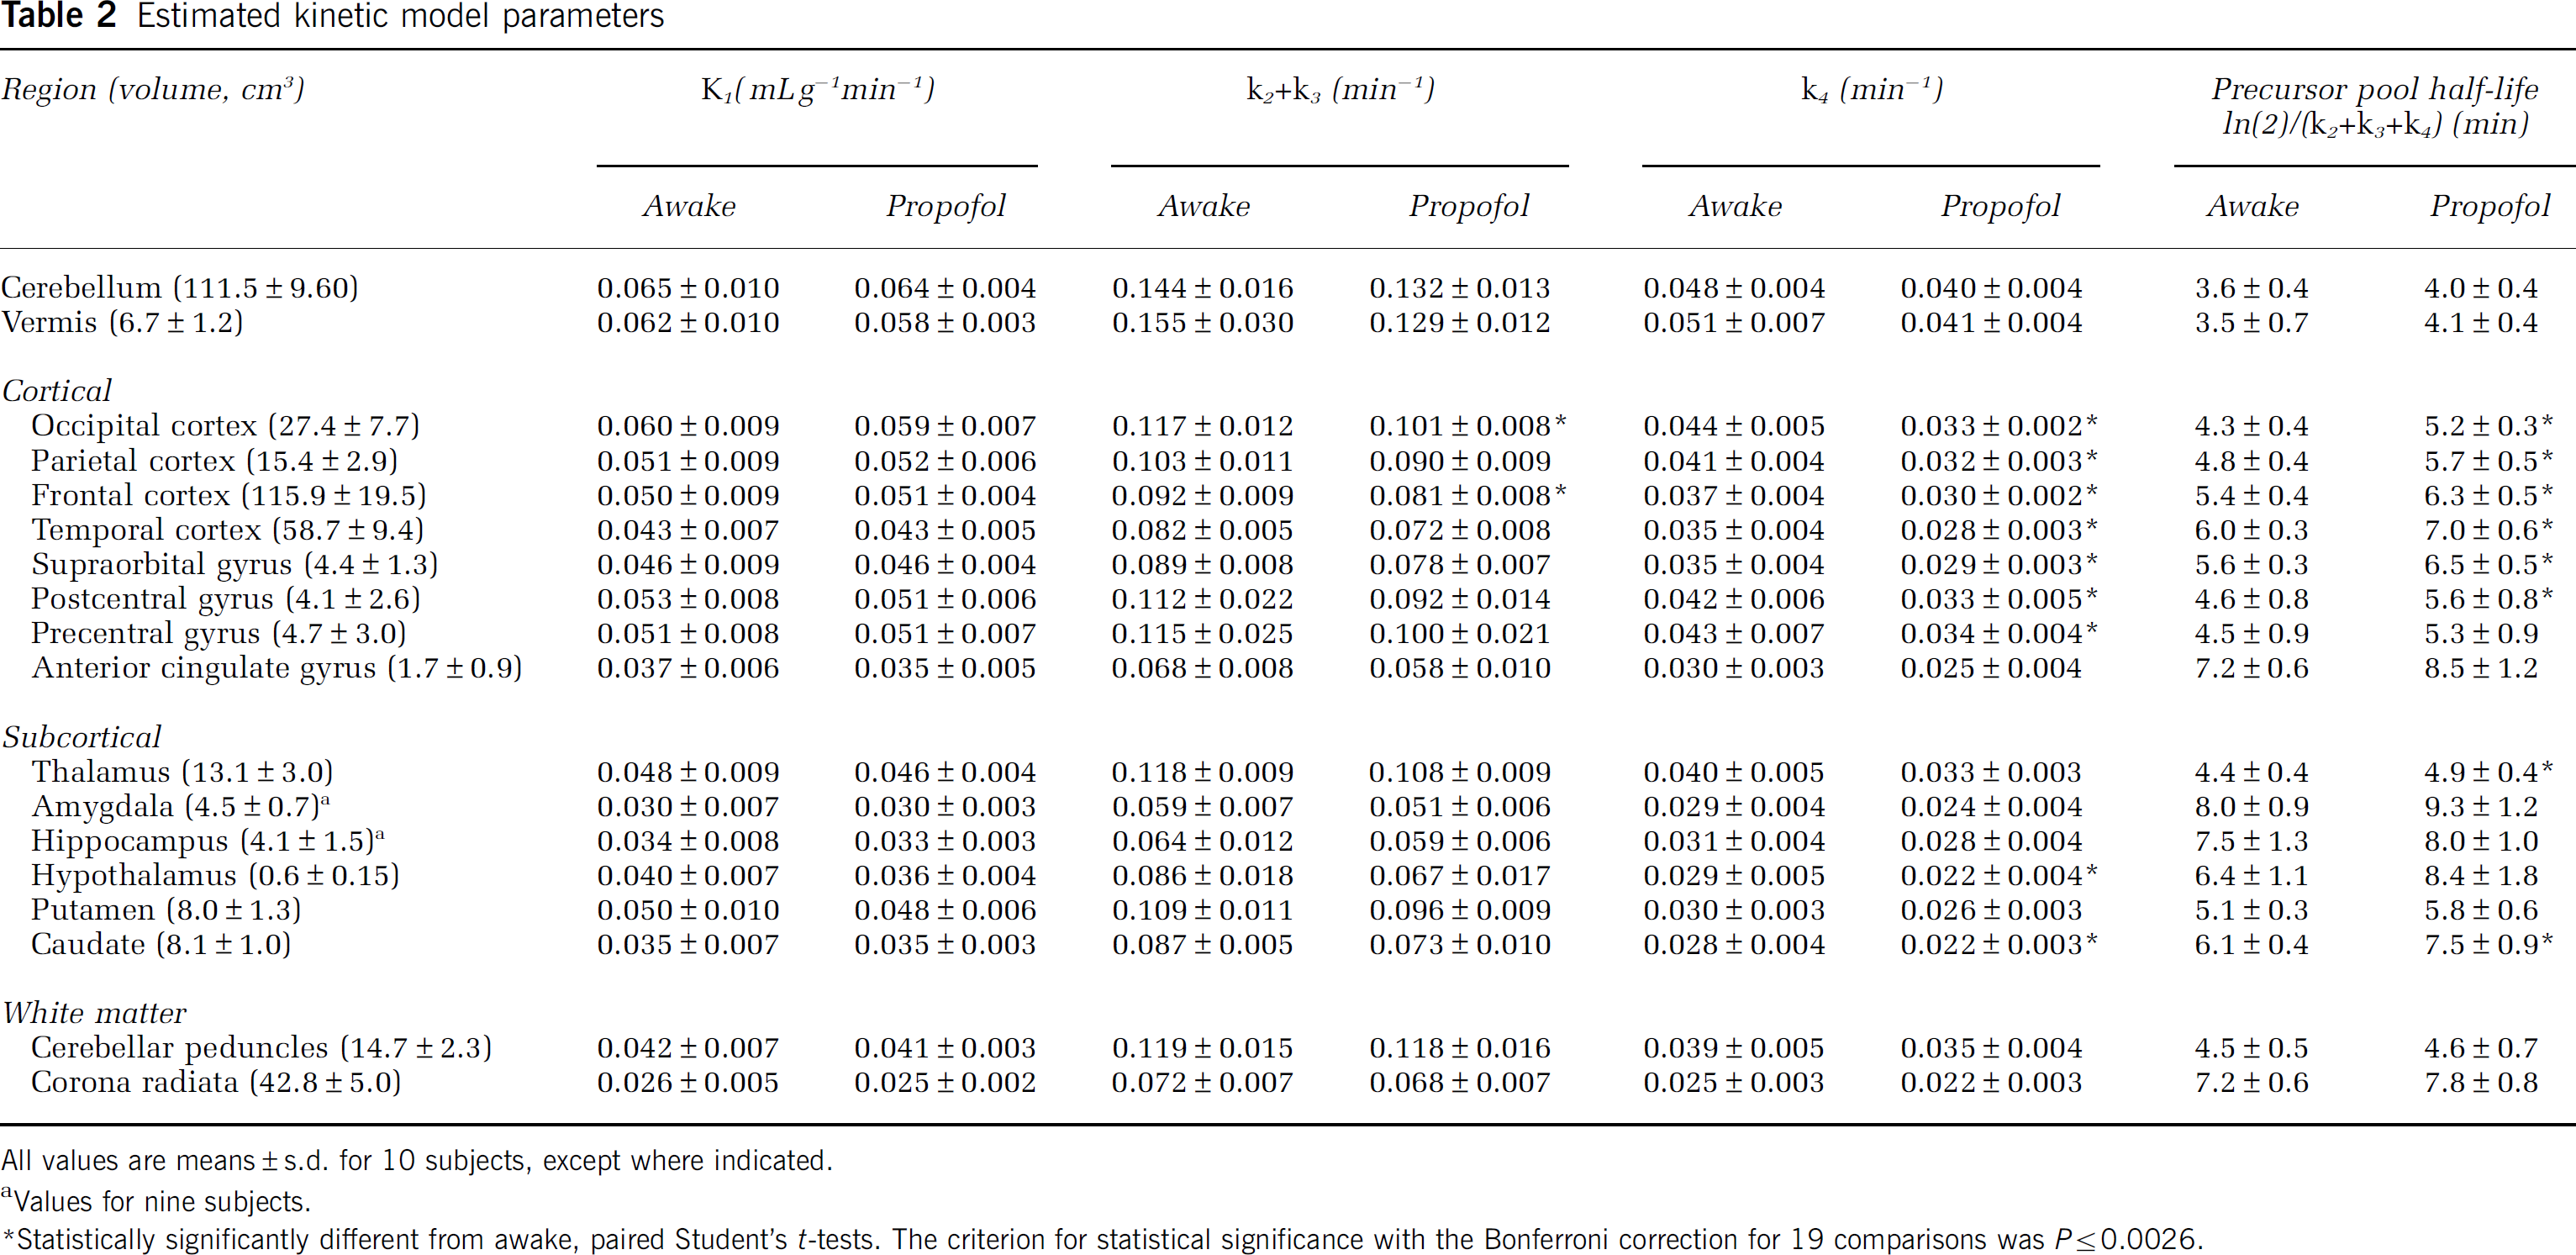
The patterns of regional variation in rate constant estimates were similar under both awake and propofol anesthesia conditions (Table 2). Rate constants were typically highest in the cerebellum and vermis followed by cortical regions, and were lowest in the corona radiata. Estimates of K1 were similar in both awake and propofol anesthesia studies, whereas the estimates of k2 + k3 and k4 tended to be lower in the propofol anesthesia studies by 11% and 17%, respectively. Differences between conditions in estimates of k2 + k3 were statistically significant in the frontal and occipital cortices. Estimates of k4 were statistically significantly lower in the propofol anesthesia studies in seven of the eight cortical regions and two of the six subcortical regions examined. In 8 of the 18 regions (6 areas of the cortex, thalamus, and caudate), the half-life of free leucine in the tissue was statistically significantly higher (P ≤ 0.002) during propofol anesthesia compared with that during awake (mean difference: 19%; range: 13% to 24%). Estimates of Vb tended to be higher in the propofol anesthesia studies, but differences were statistically significant only in the anterior cingulate gyrus. Estimates of tracer arrival delay in the whole brain were statistically significantly different between studies (awake: 9.1 ± 6.2 secs, propofol anesthesia: 3.3 ± 5.0 secs) (P = 0.03). Estimated tracer arrival delay in the awake studies was similar to that found in a separate group of subjects who underwent two awake studies on separate days (Study 1: 8.9 ± 4.7 secs, Study 2: 9.8 ± 3.7 secs, mean ± s.d., n = 10; Bishu et al, 2008). A decrease in tracer arrival delay would be expected when there is an increased cardiac output; this may have occurred during the propofol studies, as subjects were administered additional fluids and many experienced an increase in heart rate after the initiation of propofol infusion. In the whole brain, the mean estimates of K1 across subjects for awake and propofol anesthesia were 0.045 ± 0.008 and 0.045 ± 0.003 mLg−1 min−1, respectively. Estimates of k2 + k3 (awake: 0.097 ± 0.008 min−1, propofol anesthesia: 0.088 ± 0.008 min−1) and k4 (awake: 0.037 ± 0.004 min−1, propofol anesthesia: 0.030 ± 0.003 min−1) were both statistically significantly different between studies (P = 0.001). Computed half-lives of the free leucine pool in the whole brain were on average 14% longer in the propofol anesthesia studies (P < 0.0001). Mean estimates of Vb in whole brain were 0.068 ± 0.010 (awake) and 0.069 ± 0.009 (propofol anesthesia). Whole brain volume was 1,397 ± 139 cm3 for the 10 subjects.
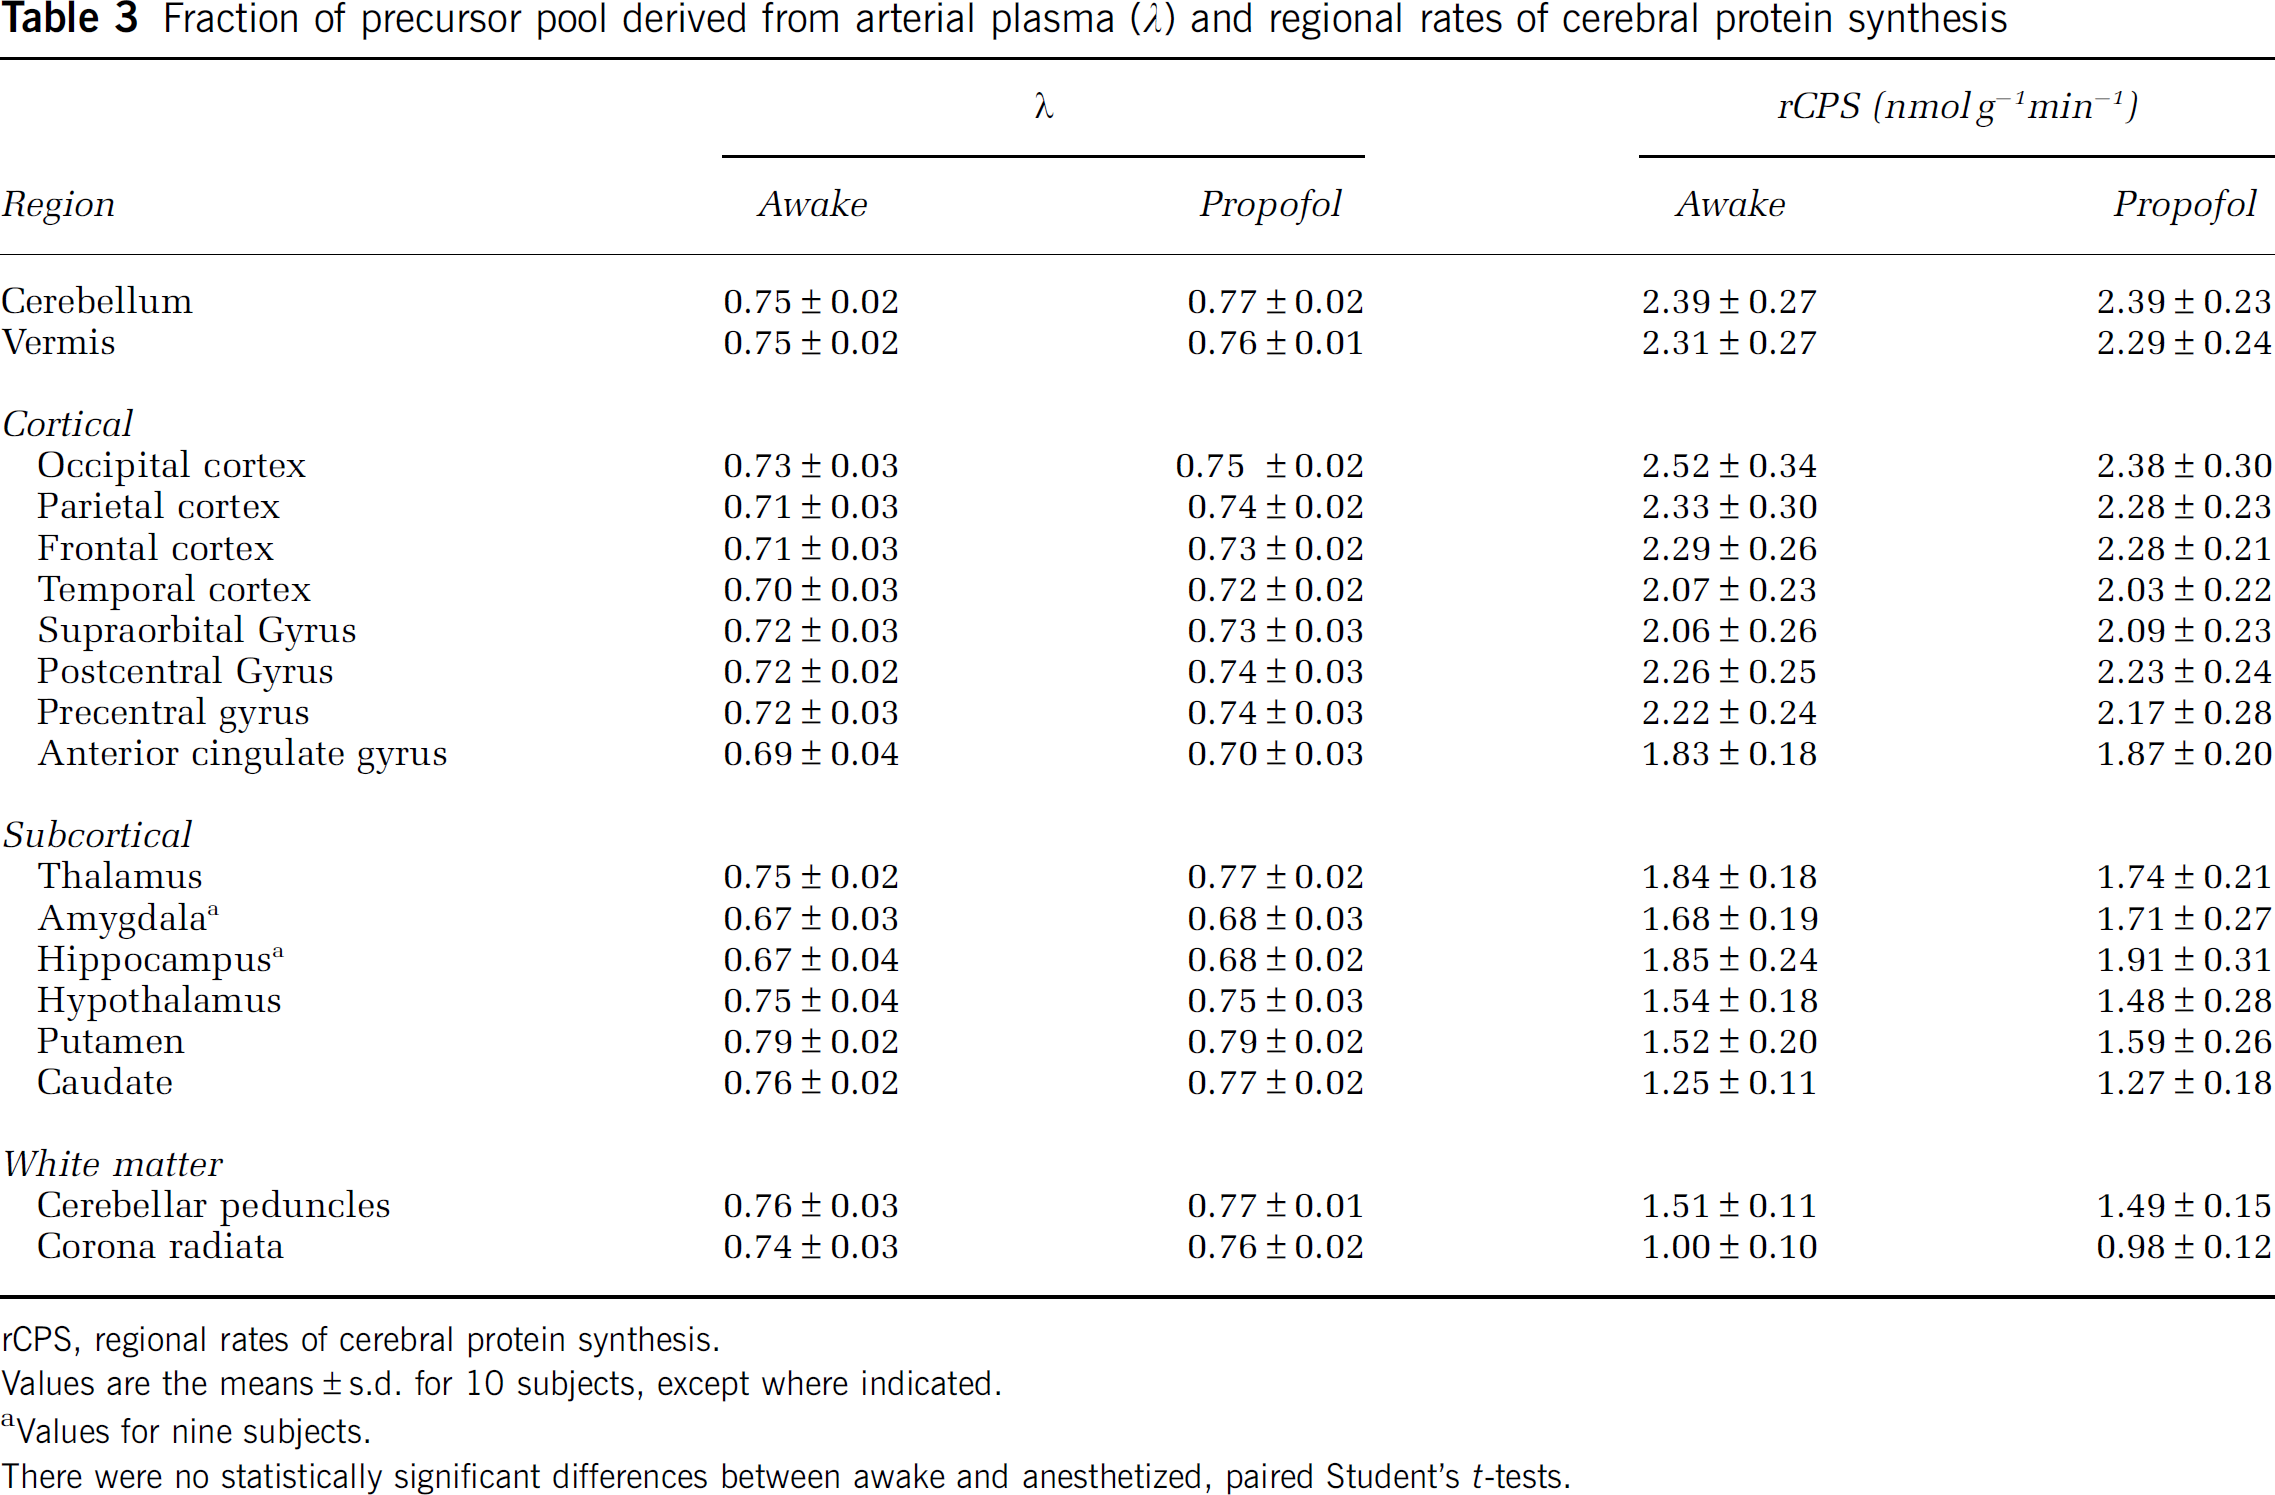
Values of Λ were slightly higher (1% to 4%) in the propofol anesthesia studies in whole brain (awake: 0.72 ± 0.03; propofol anesthesia: 0.74 ± 0.02 (NS) and in all regions, but none of the differences was statistically significant (Table 3). The pattern of regional variation was similar under both awake and propofol anesthesia conditions; values were highest in the striatum and lowest in the amygdala and hippocampus. Intersubject variability was low in both states, (awake CV range: 2% to 5%, anesthetized CV range: 2% to 4%), showing that propofol anesthesia had no effect on variability in Δ. The percentage differences in Δ between studies were similar for cortical (3%), subcortical (2%), and white matter regions (2%).
Fraction of precursor pool derived from arterial plasma (Λ) and regional rates of cerebral protein synthesis
rCPS, regional rates of cerebral protein synthesis.
Values are the means ± s.d. for 10 subjects, except where indicated.
Values for nine subjects.
There were no statistically significant differences between awake and anesthetized, paired Student's t-tests.
Regional rates of cerebral protein synthesis were similar between studies as was the pattern of regional variation; rCPS was typically highest in cortical regions followed by subcortical and white matter regions (Table 3). There were no statistically significant differences in rCPS between studies in any region. Mean percent differences between conditions were similar for cortical (−1%, range: −5% to 3%), subcortical (−1%, range: −5% to 5%), and white matter (−1%, range: −1.4 to −0.8%) regions. Intersubject variability in the propofol anesthesia studies (mean CV: 12%, range: 9% to 19%) was similar to that in the awake state (mean CV: 11%, range: 7% to 14%). Whole brain rates of cerebral protein synthesis were 1.94 ± 0.18 and 1.91 ± 0.19 nmolg−1min−1 in awake and anesthetized states, respectively (NS) (Figure 4).
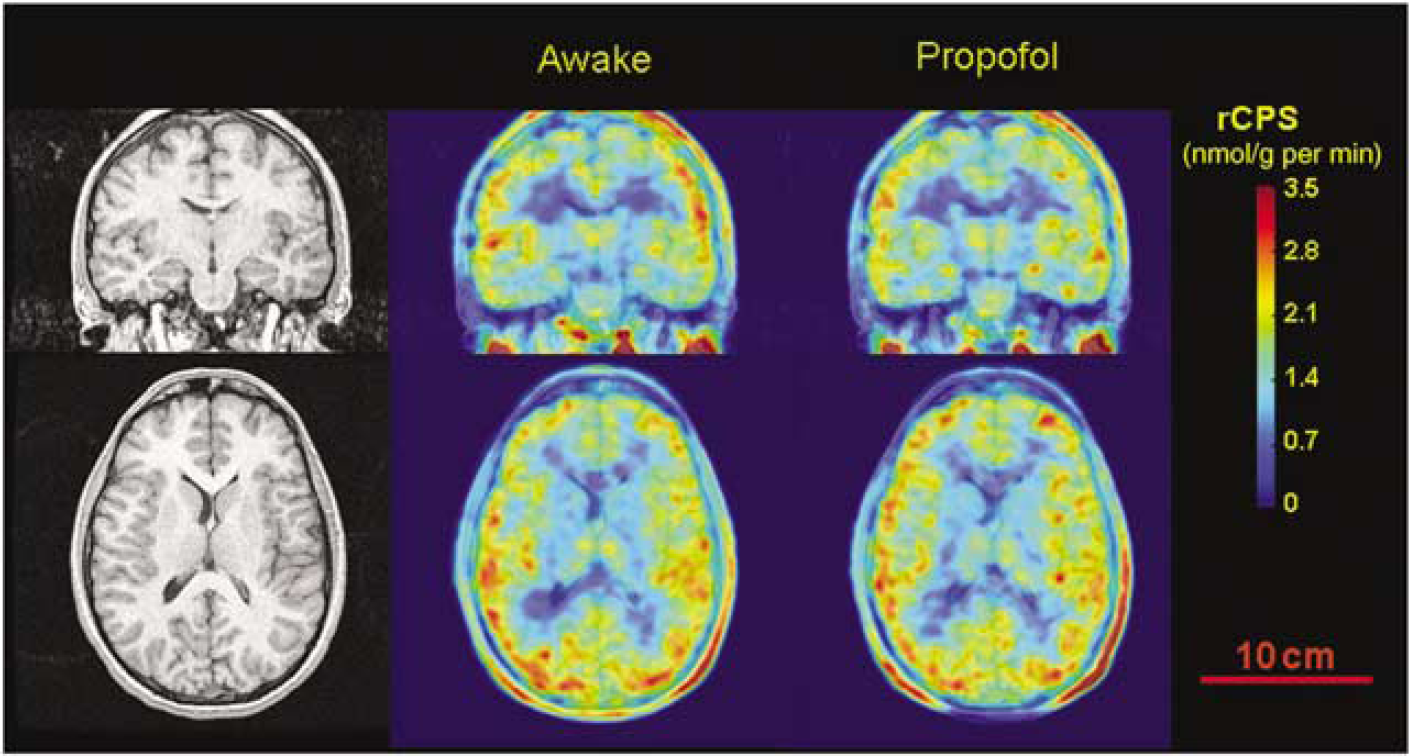
Magnetic resonance (left) and l-[1-11C]leucine PET (center and right) images from the study of a 23-year-old male. Awake study is shown in the center column, and propofol-anesthetized study is shown at right. Coronal view at the level of the thalamus is shown in the top row, and axial view is on the bottom. [11C]Leucine PET images are color-coded for rCPS; color bar is to the right of the PET images. Slice thickness is 0.94 mm. Regional rates of cerebral protein synthesis were computed from the total activity in each voxel in each 5-min frame of data between 60 and 90 mins using an alternate equation for rCPS (Equation (3) in Smith et al, 2005) and whole-brain rate constants and Λ estimated from this subject's dynamic PET study. For the awake study, K1 = 0.045 mL g−1min−1, k2 + k3 = 0.094 min−1, k4 = 0.040 min−1, Λ = 0.70, and Vb = 0.053; for the propofol anesthesia study, K1 = 0.041 mLg−1min−1, k2 + k3 = 0.078 min−1, k4 = 0.031 min-1, 2 = 0.71, and Vb = 0.057. Regional rates of cerebral protein synthesis is the average of rCPS in the six frames of data. Weighted average whole-brain rCPS was 1.90 and 1.91 nmolg−1 min−1 in the awake and propofol studies, respectively. Positron emission tomography images have been smoothed with a Gaussian filter (3.9 mm FWHM). Bar in the lower right corner is 10 cm and applies to all six images.
Discussion
We find that rCPS and X determined with the l-[1-11C]leucine PET method are not affected by propofol anesthesia in healthy young men. Propofol anesthesia also had no effect on the patterns of regional variation in rCPS and Λ or on the intersubject variances of rCPS and Λ. These results indicate that the l-[1-11C]leucine PET method can be applied to healthy adult male subjects under propofol anesthesia without altering the results.
Memory function as assessed by the HVLT-R was unaffected by the 100- to 110-min period of propofol anesthesia. Numerous studies have examined the effects of propofol on memory function during anesthesia (Kerssens et al, 2005; Veselis et al, 2004), and most reports conclude that even with evidence of some awareness during sedation, memory of the events is not preserved. We found that anesthesia with propofol had no effect on the memory consolidation of a task learned 1 to 1.5 h before induction. Assuming that protein synthesis is required for memory consolidation, our finding that rCPS was invariant with propofol is therefore consistent with the results of memory testing (HVLT-R). However, it may be that consolidation had already taken place in the interval (~1.5 h) between training and propofol administration. A study in which 20 words were repeated to subjects immediately before a 76-min propofol infusion showed that recall tested about 4 h later was on average 12% (Lequeux et al, 2003), well below the recall in our study.
The l-[1-11C]leucine PET method (Schmidt et al, 2005; Smith et al, 2005) is the first fully quantitative method for the measurement of rCPS with PET. The method is fully quantitative because it takes into account recycling of unlabeled leucine derived from tissue protein breakdown into the precursor pool for protein synthesis. Effects of leucine recycling are accounted for by the factor Λ, which is calculated as a ratio of parameters (Equation (4)) estimated from a fit of the model to measured blood and tissue TACs. The validity of this kinetic modeling approach was established by comparison of PET and biochemical determinations in the same monkeys (Smith et al, 2005). If only net uptake of labeled leucine were determined in an individual PET study, and rCPS calculated by Equation (3) with either Λ = 1 or a population-derived estimate of Λ, errors in Λ will result in inversely proportional errors in rCPS. Although Λ does not appear explicitly in Equation (2), and rCPS may be calculated solely from the estimates of K1, k2 + k3, and k3 and the unlabeled plasma leucine, as was done in this study, changes in Λ reflect physiologic changes in leucine uptake and metabolism and/or changes in protein breakdown.
Estimates of rate constants, values of Λ, and measurements of rCPS in the awake subjects agree well with previously published results (Bishu et al, 2008). In the whole brain, estimates of parameters were within 5% of those reported previously; the value of Λ was identical to, and the rate of protein synthesis was 5% higher than values reported previously. In all 18 regions examined, values of Λ were almost identical and rCPS values were 1% to 16% higher than those reported previously. The agreement between this and our previous study shows the reproducibility and stability of the l-[1-11C]leucine PET method.
Despite the stability of values of rCPS and Λ during propofol anesthesia, estimates of rate constants were altered by propofol. The half-life of CE, the tissue exchangeable leucine pool, was statistically significantly increased in six of the eight cortical regions, caudate, and thalamus by an average of 19%. The estimated size of CE was also increased in the propofol anesthesia studies in seven of the eight cortical regions, amygdala, and striatum by an average of 30%. These results indicate that there were demonstrable effects of propofol anesthesia in our analyses and that they occurred primarily in the cerebral cortex. In an earlier study on the effects of thiopental anesthesia on rCPS in rats (Smith et al, 1998), our data indicated that the turnover of CE was slower compared with that in conscious animals.
The effects of anesthesia to slow the turnover of CE in brain are in accord with the general effects of anesthesia to decrease neural function and energy metabolism (Sokoloff, 1981). Both propofol and thiopental anesthesia are accompanied by decreases in cerebral metabolic rates for glucose (Dam et al, 1990; Sokoloff et al, 1977). Metabolism of leucine is linked to neural activity, probably through the key role it plays in the shuttling of glutamate between neurons and astrocytes (Yudkoff, 1997). Moreover, leucine undergoes rapid oxidation in neural tissue through a highly regulated branched-chain α-ketoacid dehydrogenase complex. Metabolites of leucine oxidation can be further oxidized through the tricarboxylic acid cycle for energy production. During sedation/anesthesia, all of these processes are likely slowed. The decreased rate of turnover of the free leucine pool in tissue found in this study is consistent with a decreased rate of energy metabolism in anesthesia.
We had anticipated that rCPS might be affected by anesthesia, as it has been shown to suppress protein synthesis in extracerebral tissues (Flaim et al, 1983; Horber et al, 1988; Rannels et al, 1982). Halothane affects translation initiation and synthesis of secreted and retained proteins in a dose-dependent manner in the liver (Flaim et al, 1983). Studies in yeast indicate that one of the factors affecting halothane-induced inhibition of translation initiation is the phosphorylation of eIF2α (Palmer et al, 2006). Propofol anesthesia has been shown to suppress protein synthesis in skeletal muscle, a response that can be partially reversed by the administration of amino acids (Yamaoka et al, 2006). Effects of anesthetics on core body temperature may also influence protein synthesis (Planel et al, 2007; Yamaoka et al, 2006). In contrast, little is known about the in vivo effects of anesthetics on cerebral protein synthesis. Earlier animal studies have reported generalized decreases in rCPS with barbiturate anesthesia (Gaitonde and Richter, 1956; Lestage et al, 1987), but methodological issues may limit interpretation of these studies. A study with the autoradiographic [1-14C]leucine method found small decreases in rCPS (1% to 11%) (Smith et al, 1998) with thiopental anesthesia. Nevertheless, this is the first study to evaluate the effect of propofol anesthesia on cerebral protein synthesis in normal human volunteers.
Propofol is an anesthetic agent often used to facilitate the acquisition of diagnostic imaging studies in children and adults who, because of their age and/or disease, might be unable to remain motionless for prolonged periods of time. The use of propofol anesthesia is particularly helpful in patients with neurodevelopmental disorders, who are characterized by impairment in language and cognitive functions, which make imaging studies in awake patients rather challenging or simply impossible (Hagerman et al, 2005; Jedele, 2007). As some of these imaging studies are used to characterize anatomic and metabolic parameters over the course of the progression of neurodevelopmental disorders, it is important to know the effects of anesthetic agents on the variables studied. Here, we examined the effect of a commonly used anesthetic agent, propofol, on cerebral protein synthesis in healthy human volunteers. Our finding that propofol anesthesia has no significant effect on rCPS in healthy young men is of critical importance for future applicability of the l-[1-11C]leucine PET method in the study of subjects with neurodevelopmental and neurodegenerative disorders.
Our results indicate that the l-[1-11C]leucine PET method may be applied to study adult patients who may require propofol anesthesia to undergo imaging studies without significantly altering rCPS.
Footnotes
Acknowledgements
We thank the following members of the PET Department: S Conant, G Jacobs, S Sestrich, B Furmanek, K Chung, M Der (RPh), J Kusmierz (R. Ph), C Barker (PhD), and S Thada; the Department of Anesthesia and Surgical Services: William Kammerer (MD) and Ning Miao (MD); and the Office of the Clinical Director, NIMH: E Ballard and R Prengler.
The authors declare no conflict of interest.
References
1.
AlkireMTHaierRJBarkerSJShahNKWuJCKaoYJ (1995) Cerebral metabolism during propofol anesthesia in humans studied with positron emission tomography. Anesthesiology82:393–403; discussion 27A
2.
BishuSSchmidtKCBurlinTChanningMConantSHuangTLiuZ-HQinMUntermanAXiaZZametkinAHerscovitchPSmithCB (2008) Regional rates of cerebral protein synthesis measured with l-[1-11C]leucine and PET in conscious, young adult men Normal values, variability, and reproducibility. J Cereb Blood FlowMetab28:1502–13
3.
BrooksDJLammertsmaAABeaneyRPLeendersKLBuckinghamPDMarshallJJonesT (1984) Measurement of regional cerebral pH in human subjects using continuous inhalation of 11CO2 and positron emission tomography. J Cereb Blood Flow Metab4:458–65
4.
BuxtonRBAlpertNMBabikianVWeiseSCorreiaJAAckermanRH (1987) Evaluation of the 11CO2 positron emission tomographic method for measuring brain pH. I. pH changes measured in states of altered PCO2. J Cereb Blood Flow Metab7:709–19
5.
CarsonRBarkerWLiowJ-SJohnsonC (2003) Design of a motion-compensation OSEM list-mode algorithm for resolution-recovery reconstruction for the HRRTIEEE Nucl Sci Symp Conf Rec5:3281–5
6.
ChahrourMZoghbiHY (2007) The story of Rett syndrome: from clinic to neurobiology. Neuron56:422–37
7.
DamMOriCPizzolatoGRicchieriGLPellegriniAGironGPBattistinL (1990) The effects of propofol anesthesia on local cerebral glucose utilization in the rat. Anesthesiology73:499–505
8.
FischerBModersitzkiJ (2004) Intensity-based image registration with a guaranteed one-to-one point match. Methods Inf Med43:327–30
9.
FisetPPausTDalozeTPlourdeGMeuretPBonhommeVHajj-AliNBackmanSBEvansAC (1999) Brain mechanisms of propofol-induced loss of consciousness in humans: a positron emission tomographic study. J Neurosci19:5506–13
10.
FlaimKEJeffersonLSMcGwireJBRannelsDE (1983) Effect of halothane on synthesis and secretion of liver proteins. Mol Pharmacol24:277–81
11.
FrankRMByrneGJ (2000) The clinical utility of the Hopkins Verbal Learning Test as a screening test for mild dementia. Int J Geriatr Psychiatry15:317–24
12.
GaitondeMKRichterD (1956) The metabolic activity of the proteins of the brain. Proc B Soc Lond B Biol Sci144:83–99
13.
GanTJGlassPSWindsorAPayneFRosowCSebelPManbergP (1997) Bispectral index monitoring allows faster emergence and improved recovery from propofol, alfentanil, and nitrous oxide anesthesia. BIS Utility Study Group. Anesthesiology87:808–15
14.
GrosDFAntonyMMSimmsLJMcCabeRE (2007) Psychometric properties of the State-Trait Inventory for Cognitive and Somatic Anxiety (STICSA): comparison to the State-Trait Anxiety Inventory (STAI). Psychol Assess19:369–81
15.
HagermanRJOnoMYHagermanPJ (2005) Recent advances in fragile X: a model for autism and neurodegeneration. Curr Opin Psychiatry18:490–6
16.
HorberFFKrayerSRehderKHaymondMW (1988) Anesthesia with halothane and nitrous oxide alters protein and amino acid metabolism in dogs. Anesthesiology69:319–26
17.
IidaHHiganoSTomuraNShishidoFKannoIMiuraSMurakamiMTakahashiKSasakiHUemuraK (1988) Evaluation of regional differences of tracer appearance time in cerebral tissues using [150] water and dynamic positron emission tomography. J Cereb Blood Flow Metab8:285–8
18.
JedeleKB (2007) The overlapping spectrum of Rett and Angelman syndromes: a clinical review. Semin Pediatr Neurol14:108–17
19.
KeenREBarrioJRHuangSCHawkinsRAPhelpsME (1989) In vivo cerebral protein synthesis rates with leucyl-transfer RNA used as a precursor pool: determination of biochemical parameters to structure tracer kinetic models for positron emission tomography. J Cereb Blood Flow Metab9:429–45
20.
KerssensCOuchiTSebelPS (2005) No evidence of memory function during anesthesia with propofol or isoflurane with close control of hypnotic state. Anesthesiology102:57–62
21.
LajthaALatzkovitsLTothJ (1976) Comparison of turnover rates of proteins of the brain, liver and kidney in mouse in vivo following long term labeling. Biochim Biophys Acta425:511–20
22.
LenzCFrietschTFuttererCRebelAvan AckernKKuschinskyWWaschkeKF (1999) Local coupling of cerebral blood flow to cerebral glucose metabolism during inhalational anesthesia in rats: desflurane versus isoflurane. Anesthesiology91:1720–3
23.
LequeuxPYCantraineFLevarletMBarvaisL (2003) Absence of explicit and implicit memory in unconscious patients using a TCI of propofol. Acta Anaesthesiol Scand47:833–7
24.
LestagePGononMLepetitPVittePADebillyGRossattoCLecestreDBobillierP (1987) An in vivo kinetic model with l-[35S]methionine for the determination of local cerebral rates for methionine incorporation into protein in the rat. J Neurochem48:352–63
25.
PalmerLKRannelsSLKimballSRJeffersonLSKeilRL (2006) Inhibition of mammalian translation initiation by volatile anesthetics. Am J Physiol290:E1267–75
26.
PlanelERichterKENolanCEFinleyJELiuLWenYKrishnamurthyPHermanMWangLSchachterJBNelsonRBLauLFDuffKE (2007) Anesthesia leads to tau hyperphosphorylation through inhibition of phosphatase activity by hypothermia. J Neurosci27: 3090–7
27.
RannelsDERoakeGMWatkinsCA (1982) Additive effects of pentobarbital and halothane to inhibit synthesis of lung proteins. Anesthesiology57:87–93
28.
SchmidtKMiesGSokoloffL (1991) Model of kinetic behavior of deoxyglucose in heterogeneous tissues in brain: a reinterpretation of the significance of parameters fitted to homogeneous tissue models. J Cereb Blood Flow Metab11:10–24
29.
SchmidtKLucignaniGMorescoRMRizzoGGilardiMCMessaCColomboFFazioFSokoloffL (1992) Errors introduced by tissue heterogeneity in estimation of local cerebral glucose utilization with current kinetic modes of the [18F]fluorodeoxyglucose method. J Cereb Blood Flow Metab12:823–34
30.
SchmidtKCCookMPQinMKangJBurlinTVSmithCB (2005) Measurement of regional rates of cerebral protein synthesis with l-[1-11C]leucine and PET with correction for recycling of tissue amino acids: I. Kinetic modeling approach. J Cereb Blood Flow Metab25:617–28
31.
SchmitzCRezaieP (2008) The neuropathology of autism: where do we stand?Neuropathol Appl Neurobiol34:4–11
32.
SiesjoBKThompsonWO (1965) The uptake of inspired 14CO2 into the acid-labile, the acid-soluble, the lipid, the protein and the nucleic acid fractions of rat brain tissue. Acta Physiologic Scandanavia64:182–92
33.
SmithCBEintreiCKangJSunY (1998) Effects of thiopental anesthesia on local rates of cerebral protein synthesis in rats. Am J Physiol274:E852–9
34.
SmithCBSchmidtKCBishuSChanningMABaconJBurlinTVQinMLiuZHXiaZHuangTVuongBKHerscovitchP (2008) Use of acute hyperphenylalaninemia in rhesus monkeys to examine sensitivity and stability of the l-[1-11C]leucine method for measurement of regional rates of cerebral protein synthesis with PET. J Cereb Blood Flow Metab28:1388–98
35.
SmithCBSchmidtKCQinMBurlinTVCookMPKangJSaundersRCBacherJDCarsonREChanningMAEckelmanWCHerscovitchPLavermanPVuongBK (2005) Measurement of regional rates of cerebral protein synthesis with l-[1-11C]leucine and PET with correction for recycling of tissue amino acids: II. Validation in rhesus monkeys. J Cereb Blood Flow Metab25:629–40
36.
SmithQRMommaSAoyagiMRapoportSI (1987) Kinetics of neutral amino acid transport across the blood–brain barrier. J Neurochem49:1651–8
37.
SokoloffL (1981) Relationships among local functional activity, energy metabolism, and blood flow in the central nervous system. Fed Proc40:2311–6
38.
SokoloffLReivichMKennedyCDes RosiersMHPatlakCSPettigrewKDSakuradaOShinoharaM (1977) The [14C]deoxyglucose method for the measurement of local cerebral glucose utilization: theory, procedure, and normal values in the conscious and anesthetized albino rat. J Neurochem28:897–916
39.
StudenovARSzaldaDEDingYS (2003) Synthesis of no-carrier-added C-11 labeled d- and l-enantiomers of phenylalanine and tyrosine for comparative PET Studies. Nucl Med Biol30:39–44
VenturaJLibermanRPGreenMFShanerAMintzJ (1998) Training and quality assurance with the Structured Clinical Interview for DSM-IV (SCID-I/P). Psychiatry Res79:163–73
42.
VeselisRAFeshchenkoVAReinselRADnistrianAMBeattieBAkhurstTJ (2004) Thiopental and propofol affect different regions of the brain at similar pharmacologic effects. Anesth Analg99:399–408; table of contents
43.
WienhardKSchmandMCaseyMEBakerKBaoJErikssonLJonesWFKnoessCLenoxMLercherMLukPMichelCReedJHRicherzhagenNTreffertJVollmarSYoungJWHeissWDNutt (2002) The ECAT HRRT: performance and first clinical application of the new high resolution research tomograph. IEEE Trans Nucl Sci49:104–10
44.
YamaokaIDoiMNakayamaMOzekiAMochizukiSSugaharaKYoshizawaF (2006) Intravenous administration of amino acids during anesthesia stimulates muscle protein synthesis and heat accumulation in the body. Am J Physiol290:E882–8
45.
YudkoffM (1997) Brain metabolism of branched-chain amino acids. Glia21:92–8