
Abstract
Subacute and long-term stability of measurements of D2 dopamine receptor density (Bmax), affinity (Kd) was studied with positron emission tomography in eight healthy male volunteers. [11C]-Raclopride and the transient equilibrium method were used to measure D2 receptor characteristics. The interval between measurements (scan pairs) was 3 to 7 weeks (subacute) for four subjects and 6 to II months (long-term) for four subjects. A test-retest analysis of quantitative measurements of D2 receptor Bmax and Kd was compared with that done on binding potential (BP, Bmax/Kd) measures. In addition, the effect of error in defining the transient equilibrium time (tmax) in the parameter estimation procedure was explored with simulations. The subacute test-retest indicates good reproducibility of D2 receptor density, affinity, and BP ratio measurements with intraclass correlation coefficients of 0.90, 0.96, and 0.86, respectively. The variability of the measurements after 6 to 11 months was slightly higher than that seen in a subacute testing for Kd and more clearly so for binding potential and Bmax. The absolute variability in Bmax (14.5%) measurements was consistently higher than that of Kd (8.4%) or BP (7.9%) both in subacute and long-term measurements. Simulations indicated that the Bmax and Kd estimation procedure is more sensitive to error in the tmax than that for the BP. The results indicate a good overall stability of the equilibrium method with [11C]raclopride for measuring dopamine D2 receptor binding characteristics in the striatum. The BP approach is more stable than Kd and especially Bmax measurements. Error in defining the tmax in particular in the low specific radioactivity scan may be one source of greater variability in Bmax versus BP. However, a higher intraindividual variability in measurements of the D2 receptor Bmax also may include a component of continuous regulation of this parameter over time. These methodologic aspects should be considered in the design and interpretation of longitudinal studies on D2 dopamine receptor characteristics with [11C]-raclopride.
Quantitative measurements of neurotransmitter receptor binding characteristics have been described for many receptors in the human central nervous system and, in particular, for dopamine D2 receptors (Wong et al., 1986a; Farde et al., 1989; Ito et al, 1998). The two best known examples for a more detailed quantification of striatal dopamine D2 receptor binding characteristics are those using [11C]-raclopride (Farde et al., 1989) and [11C]-N-methylspiperone (Wong et al., 1986a) with equilibrium and kinetic modeling, respectively. Both methods include administration of a subsaturating dose of a D2 receptor antagonist, which is necessary for calculating the receptor binding characteristics (i.e., receptor density and affinity separately). This constellation is complex from a methodologic point of view, since high D2 receptor occupancy with low signal-noise ratio is induced in the low specific activity/blocked state scan. Moreover, significant occupancy (blockade) of D2 receptors produces clear-cut pharmacologic effects (Farde, 1992) and most likely triggers feedback mechanisms regulating the synaptic dopamine concentrations in the brain during the positron emission tomography (PET) scan. These procedures have been used extensively for studies measuring D2 binding characteristics in a variety of neuropsychiatric disorders, especially schizophrenia, with conflicting results (Wong et al., 1986b; Farde et al., 1990; Tune et al., 1993; Hietala et al., 1994a; Nordström et al., 1995). Yet, the reliability of the methods for quantitative striatal D2 receptor measurements has not been explored. We now report test-retest data for measurements of D2 receptor binding characteristics with [11C]-raclopride in healthy volunteers in a subacute and a long-term setting. The equilibrium model (Farde et al., 1989) involving studies with high and low specific activity were used for measurements of D2 receptor density and affinity. D2 receptor binding potential measures (BP) derived from a single high specific activity scan with [11C]-raclopride have previously been shown to be reliable (Volkow et al., 1993) and also were extracted from the data for comparison.
SUBJECTS AND METHODS
The study protocol was approved by the Ethical Committee of the Turku University/University Hospital, Turku, Finland. Eight male right-handed controls (age 28 ±7 years, mean ± SD), free of physical or mental illnesses, were recruited for the study. All were nonsmokers. Informed consent was obtained in every case. The weight and height of the subjects were 182 ± 8 cm and 78 ± 5 kg, respectively (means ± SD). All had normal 1.5 T magnetic resonance imaging or computed tomography scans (two subjects). Four subjects were scanned with an interval of 3 to 7 weeks. These test-retest results were considered to reflect predominantly methodologic variability. The interval was at least 3 weeks to avoid possible residual effects of the intermediate dose of raclopride given intravenously in the low specific activity scans (191 ± 28 µg, mean ± SD, n = 16). Two subjects were scanned with an interval of 6 months and two with an 11-month interval. The data from these subjects also are likely to reflect additional factors involved in variability of D2 receptor binding over time. Therefore, conventional measures for method stability were not calculated for this group of subjects.
Positron emission tomography scanning
The quantification of striatal D2 receptor density and affinity and binding potential (Bmax/Kd = BP) was done with [11C]raclopride as a radioligand with assumptions described previously (Farde et al., 1989; Hietala et al., 1994b). [11C]Raclopride was prepared as described in detail by Hietala and colleagues (1994a). The BP definition used here is not exactly the same as that originally described by Mintun and associates (1984): BP = Bmax/Kd' f2 (f2 refers to radioligand fraction free from nonspecific binding and was assumed to be unity in our study).
The PET experiments were performed using a whole-body PET scanner (ECAT 931/08-12, CTI, Nashville, TN, U.S.A.) with 15 slices and with a spatial resolution of 6.1 mm on the plane and an axial resolution of 6.7 mm (Spinks et al., 1988). Each subject underwent two scans within the same day between 10 am and 16 pm at least 2 hours apart. The injected dose was, on average, 3.0 mCi. The first scan was done with a high specific radioactivity of [11C]raclopride (348 ± 168 Ci/mmol, mean ± SD) and the second with a low specific radioactivity (5,4 ± 1.3 Ci/mmol, mean ± SD). The weight of injected raclopride dose ranged from 2 to 241 µg (high- and low-specific activities, respectively). There was no systematic attempt to adjust low specific activity/mass of raclopride injected to be the same in both sessions. The ratio of low specific activity in first and second sessions was, however, close to unity (1.06 ± 0.28, mean ± SD, n = 8).
The calibration of the PET scanner was done on weekly basis with a uniform phantom filled water and Ge68. The plane-by-plane calibration factor was defined against the well counter. The maximum coefficient of variation in this calibration factor for one plane was 1.5% over the 1.5-year period when the test-retest study was completed.
Head fixation was done using an individually molded head holder system with positioning based on orbitomeatal-lines and laser lights, as described by (Hietala and associates 1994a,b). A reproducible head positioning was achievable even after 11 months (Fig. 1). Before each experiment, a transmission scan was performed with a 68Ge-filled removable ring system. [11C]Raclopride was given as a rapid intravenous bolus injection and flushed with saline.
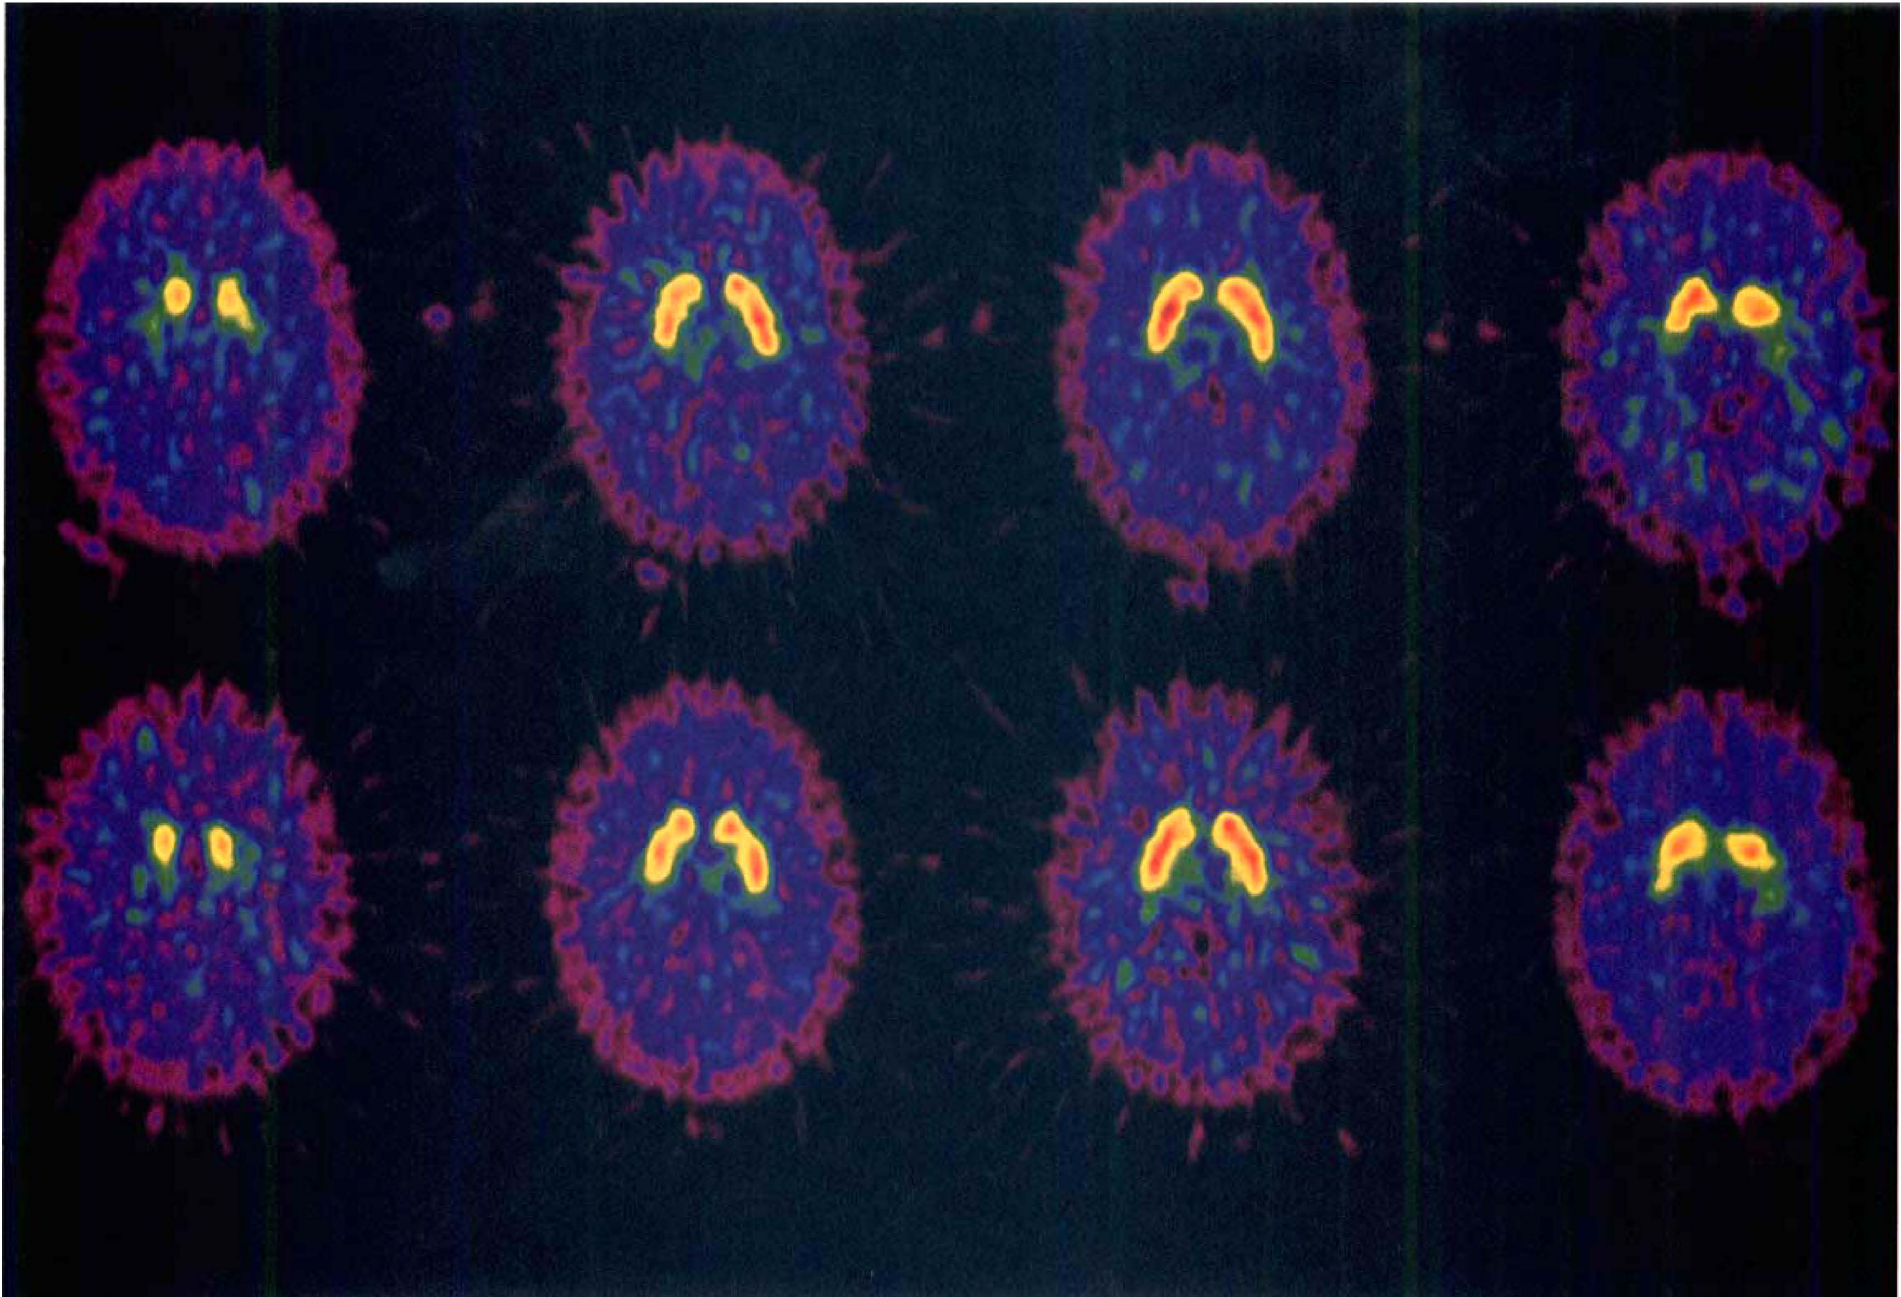
Two positron emission tomography (PET) scans with [11C]raclopride (specific radioactivities 205 and 425 Ci/mmol at the time of injection) of the same subject showing the head repositioning at test 1 (top panel) and test 2 (bottom panel) 11 months later. Four slices transversing the striatum are shown for each study; the two middle most slices were used for analysis of binding characteristics.
[11C]Raclopride uptake in the brain was measured for 49 minutes using 24 time frames. Striatal regions of interest were drawn on integrated images from 10 to 49 minutes using the two middle most planes transversing the striatum. The average decay-corrected levels of radioactivity contained in the left and right striata and cerebellum were plotted against time, and the data were analyzed using the cerebellum as a receptor-free reference region.
Simulations
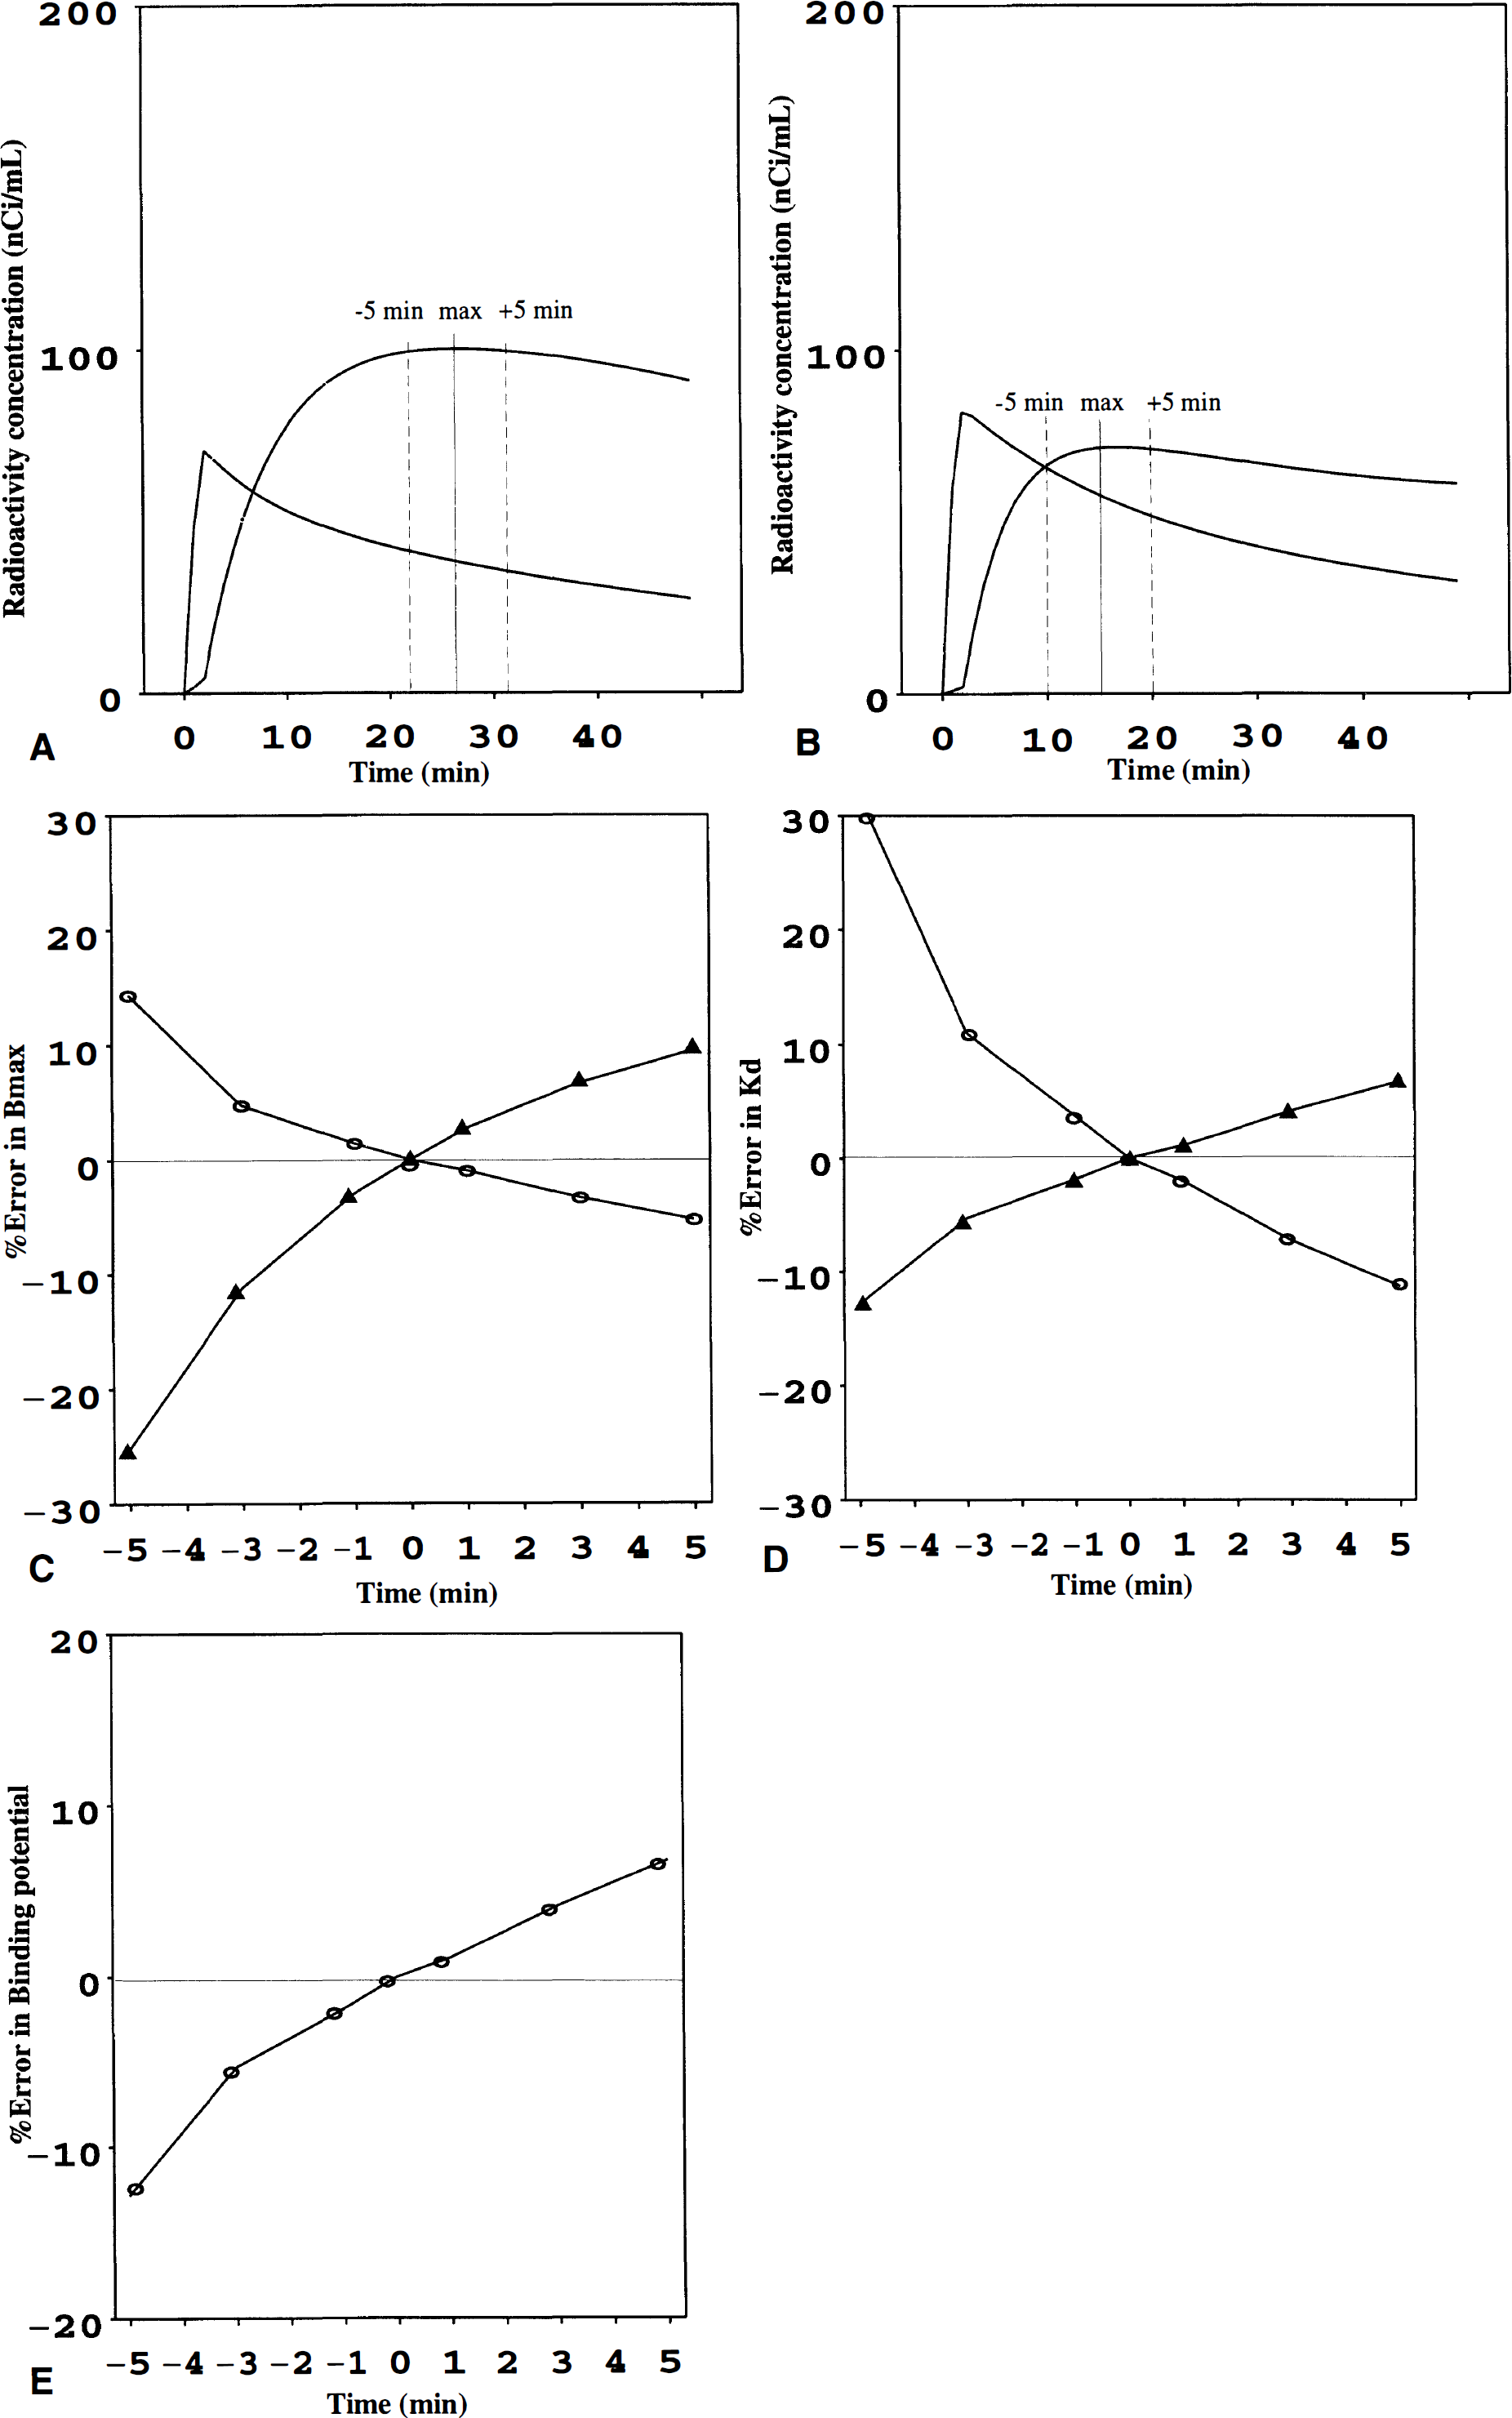
The estimates for Bmax and Kd are clearly dependent on the accuracy of defining the time point where dB/dt = 0 (B = specific binding to D2 receptors), that is, the “transient equilibrium” time point (tmax). This may be especially critical in the [11C]raclopride low specific activity scan where signal-noise ratio is relatively low. To explore this, we introduced 1-, 3-, and 5-minute errors into the tmax in both high specific activity and low specific activity scan and tested how this affects the Bmax and Kd estimates. According our experience, a 5-minute error in tmax can be regarded as an unusual and a high error (e.g., 30% to 40% error in the low specific activity scan). For comparison, similar simulations were done for the Bmax/Kd determination from the high specific activity scan.
Statistical analysis
The between-subjects and within-subjects variation was calculated and used for determining the intraclass correlation coefficients (Zar, 1984). This coefficient generally is used for estimating the stability of the method (0, no stability; 1, excellent stability). Pearson's correlation coefficient was used to explore the relations between D2 receptor binding characteristics and other variables.
RESULTS
The measures of Bmax and Kd and BP showed expected features, with positive correlations between Bmax and Kd, as well as between Bmax and BP, whereas Kd did not correlate with BP (Fig. 2). In this limited age range from 20 to 40 years, no significant age effect on binding measurements was observed.
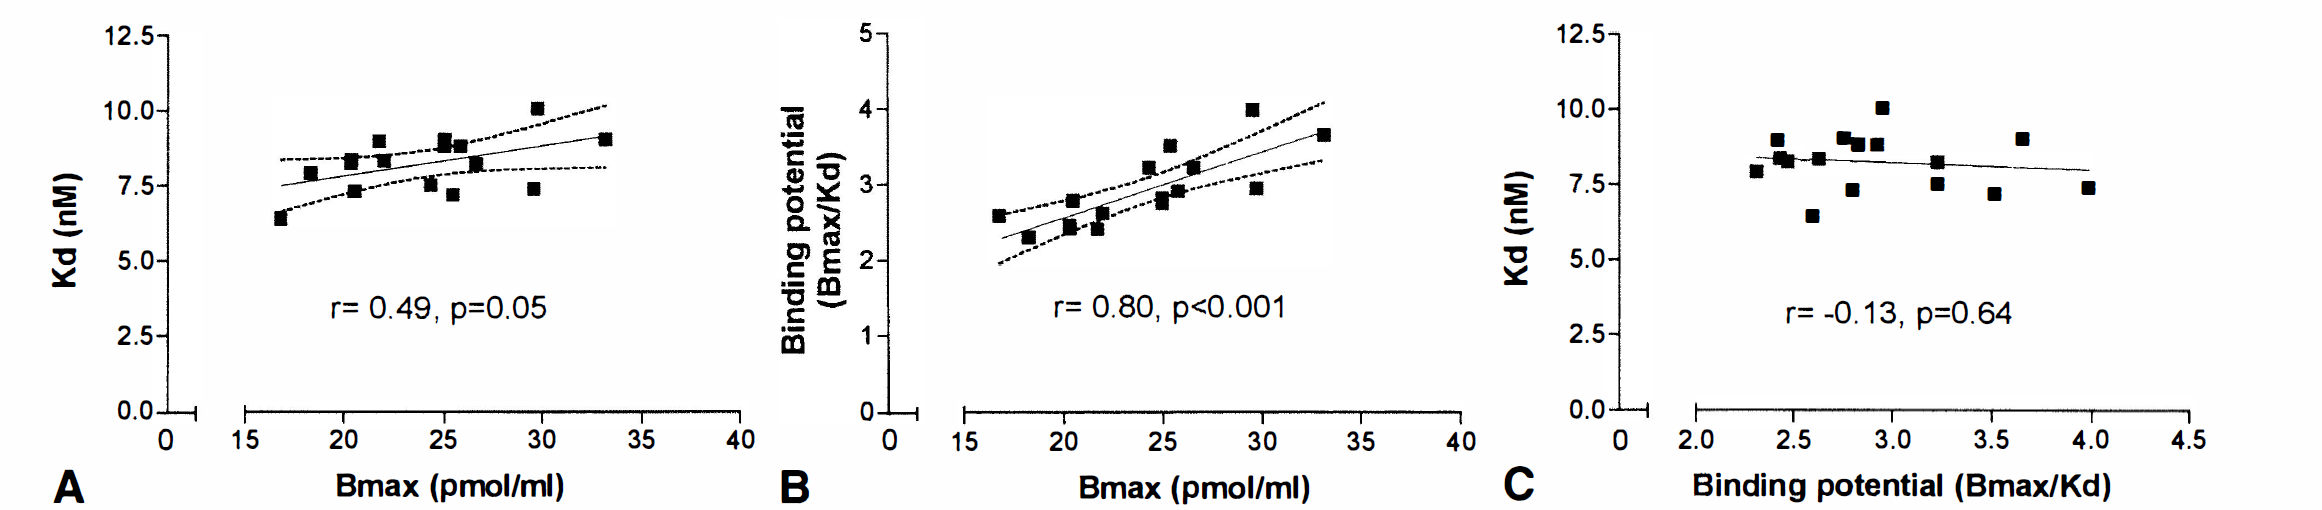
Relations between D2 dopamine receptor density (Bmax), D2 dopamine receptor affinity (Kd), and binding potential (BP). Dashed lines denote the 95% confidence limits of the regression line.
Subacute test-retest
The results are summarized in Table 1. All measurements with an interval of 3 to 7 weeks showed good stability with high intraclass correlation coefficients. Despite this, the absolute variability in BP measures was slightly lower than that of Kd and about twofold lower than that of Bmax (Table 1). Both Bmax and Kd values were slightly higher at the second session in all subjects, but the differences were small and not statistically significant (P = 0.08).
Test-retest on D2 receptor binding measurements with a 3- to 7-week interval (N = 4)
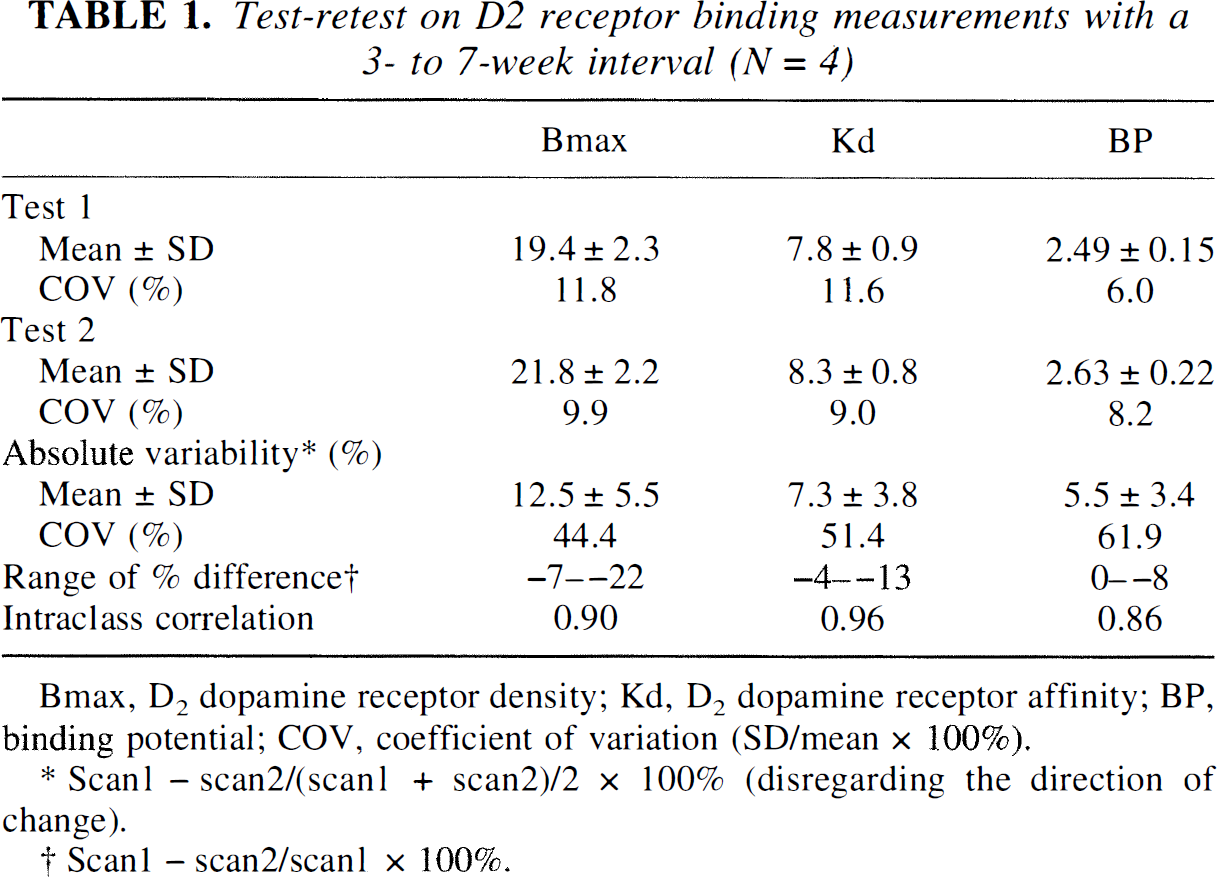
Bmax, D2 dopamine receptor density; Kd, D2 dopamine receptor affinity; BP, binding potential; COV, coefficient of variation (SD/mean × 100%).
Scan1 − scan2/(scan1 + scan2)/2 × 100% (disregarding the direction of change).
Scan 1 − scan2/scan1 × 100%.
Long-term test-retest
The results are summarized in Table 2. After 6 to 11 months, the variability increased in all measures by 2% to 5%, but the same pattern persisted, indicating highest variability in Bmax. In Bmax, the interindividual variation was slightly lower than the intraindividual variation in this sample of four subjects. Taking long-term and subacute data together, the variability in Bmax (14.5 ± 8.6%, mean ± SD) was significantly higher than that in BP (7.9 ± 3.9%, P = 0.04) or Kd (8.5 ± 5.1%, P = 0.05, Dunnett's test). Highest variability was noted in a 20-year-old subject with an 11-month interval between scan pairs. Notice that even if the Bmax and Kd measurements differed 27% and 17%, respectively, the BP method changed only 12% in this subject.
Test-retest on D2 receptor binding measurements with a 6- to 11-month interval (N = 4)
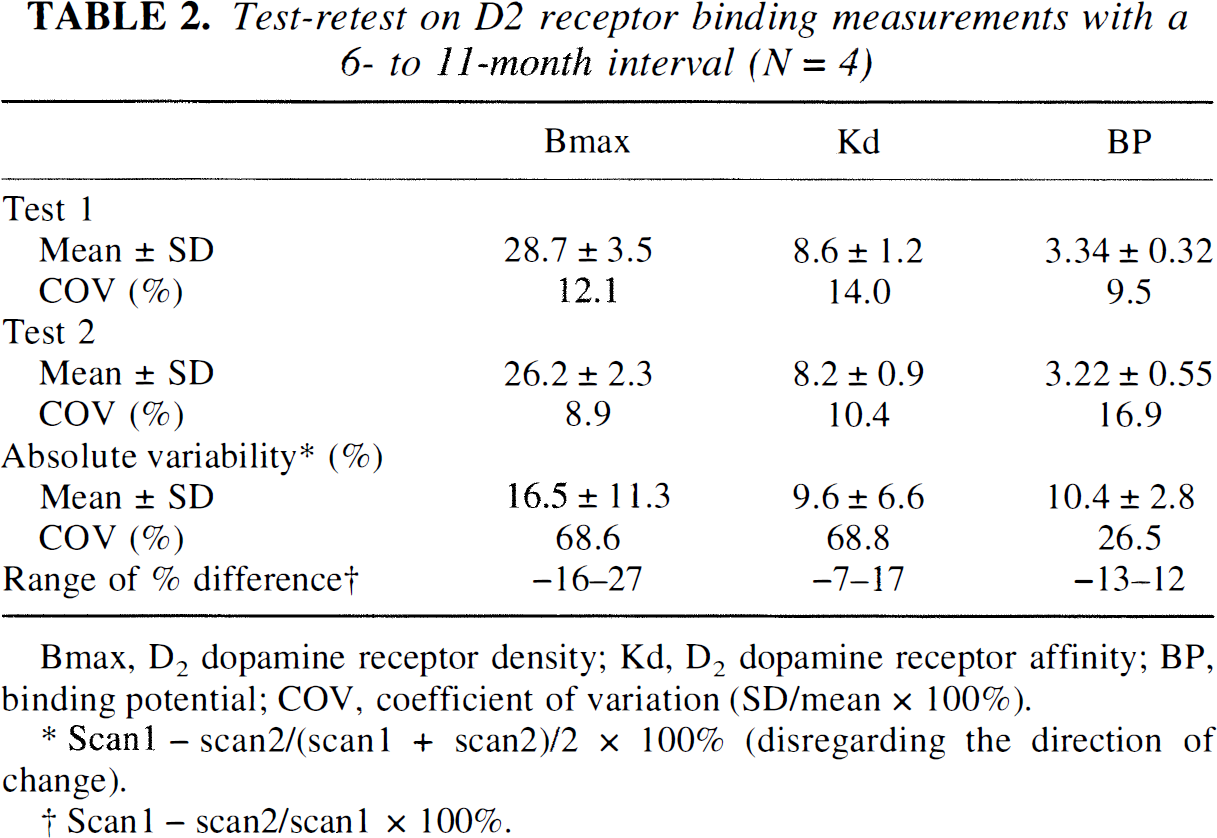
Bmax, D2 dopamine receptor density; Kd, D2 dopamine receptor affinity; BP, binding potential; COV, coefficient of variation (SD/mean × 100%).
Scan1 − scan2/(scan1 + scan2)/2 × 100% (disregarding the direction of change).
Scan1 − scan2/scan1 × 100%.
Variability and additional factors
Age of the subject or difference in the low specific activity or injected raclopride mass per kilogram between the two sessions (expressed as ratio) did not correlate significantly with variability in Bmax, Kd, or BP (P between 0.14 and 0.80).
The results of simulations are shown in Fig 3. A reasonable 3-minute error in tmax (maximal specific binding), regardless of the direction of the error, resulted in up to a 4% to 12% error in Bmax and Kd estimates. On the other hand, a variation of 3 minutes in tmax resulted in only a 4% to 5% error in BP. A tmax error in the low specific activity scan affected more clearly the Bmax estimate. The Kd value was less sensitive to error in tmax in low specific radioactivity scan, but a 3-minute under-estimation of tmax in the high specific activity scan resulted in a relatively high (11%) overestimation in Kd. Similar results were obtained from simulations based on other corresponding data sets.
Panels
DISCUSSION
This study provides test-retest data on quantitative measurements of receptor density and affinity with [11C]-raclopride. The short- and long-term test-retest analyses provide important information on the power of this method to detect true biological differences and are a prerequisite for exploring state-dependent or episodic phenomena in the brain in longitudinal studies. The equilibrium method for determining Bmax and Kd with a two-point Scatchard analysis is complex and includes extensive nonlinear curve-fitting and determination of transient equilibrium time points for specific binding in high and in low specific activity scans. In addition, the model includes an intrinsic D2 receptor challenge (receptor blockade), and the brain responses to D2 receptor blockade also may vary over time. Thus, the two-point Scatchard method can be expected a priori to be more sensitive to experimental error compared with more simple methods like striatum-cerebellum ratios, where specific and nonspecific binding may be derived from longer time interval by using “time integral” approaches.
Subacute stability of D2 receptor binding characteristics
In studies involving injection of a subsaturating dose of D2 receptor antagonist, the test-retest preferably should take place after a few weeks to avoid possible residual effects of even a single dose of the D2 antagonist. We used a 3- to 7-week interval between the measures and consider these data to represent predominantly methodologic variability. The intraclass correlation coefficient suggested good to excellent stability of the measures. The variability in BP was lowest, showing a maximal difference of 8%, whereas corresponding figures for Bmax and Kd were 22% and 13%. Although the differences between scans 1 and 2 were relatively small, the second scan resulted in higher Bmax and Kd values in all subjects. This should be interpreted with caution because of the small number of subjects but should be explored further, since prolonged effects of neuroleptics, even after a single dose, has been suggested in experimental studies (Antelman et al., 1986). Previously, Volkow and coworkers (1993) have provided data on acute reproducibility for striatal D2 receptor binding measures in healthy volunteers with a 1-day interval between high specific activity [11C]raclopride scans. In that study, a distribution volume ratio (striatum-cerebellum) was used as a method to estimate striatal D2 receptor binding, whereas we chose the transient equilibrium approach for striatal BP calculations. Despite slightly different analysis methods and the longer time between scans in this study, the percent differences in D2 receptor binding measures appear to be in the same range (−7% to 8%). A study by Nyberg and associates (1996) lends further support for high stability of putamen/cerebellum ratios with [11C]-raclopride on the same day in neuroleptic-treated patients, despite the low P/C ratios due to high receptor occupancy.
Long-term stability
In these studies, the time interval between scan pairs was from 6 to 11 months, which introduces an additional risk for methodologic errors (see later). However, variability over a long time also may include other factors regulating D2 receptor binding characteristics in vivo in man. Aging is known to decrease Bmax and BP but not Kd by 2% to 3% per decade (Rinne et al., 1993) and thus has only a modest effect on receptor binding characteristics within time intervals of up to 11 months. The variability increased slightly in Kd and BP and more so in Bmax, with maximal percent differences of 17%, 13%, and 27%, respectively. Despite the relatively high variability in Bmax, the method should be able to detect the twofold increases in D2 receptor density in schizophrenia originally suggested by Wong and colleagues (1986a) using the [11C]NMSP method. The also BP seems to be the most reliable binding parameter in long-term studies. Our results agree well with those of Nordström and others (1993) who studied long-term reproducibility of putamen-cerebellum ratios, but not density and affinity, using the [11C]-raclopride. Those studies indicate scan 2-scan 1 ratios between 0.89 and 1.12 after 1 month to 5 years.
Differences in variability of D2 receptor binding characteristics
Both in subacute and long-term studies, there was a more pronounced variability in Bmax than what was found for Kd and BP. This is surprising, since it would be expected that as Bmax and BP would change equally because these two show high positive correlation with each other and are affected in a similar way by age (Rinne et al., 1993). The variability pattern is further complicated by the positive correlation between Bmax and Kd using the transient equilibrium method and Scatchard equation (Farde et al., 1995; Pohjalainen et al, 1998). The reasons for this positive correlation are not known, but they may derive from biological phenomena affecting receptor-ligand interaction in vivo and from the parameter estimation procedure. Since the BP is, in a way, a Kd-adjusted Bmax, the BP measures may result in lower variability because of this interdependency in vivo. Nevertheless, despite the limited number of subjects in this study, there appear to be differences in Bmax and Kd variability. The differences may partly result from methodologic reasons like the determination of the transient equilibrium time (see simulations later). However, considering the plasticity and dynamics of the human brain, it is reasonable to assume that the D2 receptors are not static but may be continuously regulated in vivo, that is, that there also is intraindividual variation in addition to the well described interindividual variability in D2 receptor density (Farde et al., 1995). This might be happening at receptor density level by possible regulatory elements in the D2 receptor gene (Pohjalainen et al., 1998). The BP has been suggested to be sensitive to manipulations of endogenous levels of dopamine (Seeman et al., 1989; Dewey et al., 1993; Volkow et al., 1994). Moreover, the Kd should be influenced by dopamine competition in a reversible ligand-receptor interaction by law of mass action. If there is a major variation of endogenous dopamine levels, it appears not to be reflected in pronounced variability in the Kd or BP measures.
Considerations on the error in defining the transient equilibrium time point in [11C]raclopride positron emission tomography scans
As stated earlier, the definition of the transient equilibrium time point is critical for the bound/free and bound values in the [11C]raclopride Scatchard analysis. By definition, tmax is influenced by the specific radioactivity of [11C]raclopride. Problems in defining this time point can be expected, especially in the low specific activity scan where the striatal signal-noise ratio is relatively low. Our simulations suggest, however, that the Bmax and Kd estimates are affected by about 10%, assuming a reasonable (up to 3-minute) error in the tmax both in high and low specific radioactivity scans. A high 5-minute error in tmax results in large errors in Bmax and Kd. In particular, the underestimation of tmax (too early tmax) affects more the Bmax and Kd values. This is logical, since the cerebellar (reference tissue) time-radioactivity curve changes more in the early parts of the scan. It appears that there are no dramatic differences in the tmax error sensitivity between Bmax and Kd. The BP was, as expected, relatively insensitive for errors in tmax, further supporting the robustness of this parameter (Ito et al., 1998). We did not simulate a combined tmax error in both high and low specific activity scans. Depending on the direction of the error in tmax, combined errors may cancel each other out or be additive in the estimates for Bmax and Kd. Overall, the test-retest data on this limited sample of subjects show, however, that large errors in Bmax and Kd are unlikely, even after a long time between the scan pairs, and suggest that the transient equilibrium time point can be defined in a relatively reliable manner with nonlinear curve fitting.
Considerations on the low specific activity
The equilibrium method used here includes a pharmacologic challenge with a D2 receptor antagonist raclopride. Even the low doses of raclopride used here may trigger feedback mechanisms, affecting dopamine levels and D2 receptor binding. However, the difference in injected mass was not predictive for high variability, which is supported by linear five-point Scatchard in normal subjects for up to 400 µg of raclopride in the low specific activity scan (Farde et al., 1995). The highest mass of raclopride injected in this study was 271 µg. Nevertheless, this does not exclude the possibility that the same dose could have quantitatively different effects at different times. The linearity of the [11C]raclopride Scatchard plots has been verified for normal subjects but not, for example, for schizophrenic patients. The stability of the method in schizophrenic patients with possible functional disturbances in the dopamine system (Hietala et al., 1995) currently is unknown.
Considerations on positron emission tomography camera calibration and head repositioning
The calibration of the PET scanner was done every week, and the results indicate a maximum coefficient of variation of 1.5% in the calibration factor per plane. Thus, even in the worst case, the variation in the calibration of the PET scanner contributes little to the variation seen in receptor binding characteristics. A reproducible head positioning was achieved by the current method, even after a long time. The positioning is based on an individual head support and reproducing the OM-lines and camera/bed settings. The plane matching was checked by visual inspection. The slice thickness of the current camera is 6.75 mm, and small errors in x-, y-, z-directions cannot be excluded, but these should not be of major importance for a relatively large structure like striatum. No systematic correction for partial volume effects was attempted, but by selecting the two middle most planes of striatum, these effects can be expected to be less marked.
CONCLUSION
We show evidence for stability of the [11C]raclopride equilibrium method for measuring striatal D2 receptor density and affinity in normal controls. In the long-term setting, other factors contributing to additional variability may occur. In addition to the previously reported significant interindividual variability in D2 receptor density but not affinity, the current results suggest higher intraindividual variability of D2 receptor density compared with those of affinity and BP. The BP can be measured with a relatively simple protocol, and the overall stability of the BP method is high, supporting the use of this parameter in routine clinical research. However, despite the problems in estimating receptor density and affinity separately in vivo, such efforts should not be discouraged, since a more detailed interpretation of the receptor binding process is possible only with information on both receptor density and affinity. Optimal balance between absolute quantitation and method precision should, nevertheless, be achieved. This is especially important when exploring biological factors in common psychiatric disorders where effect sizes can be expected to be small (15% to 20%) because of extensive clinical heterogeneity within these disorders.
Footnotes
Acknowledgment
The authors thank the staff in the Turku PET Center and Department of Radiology for their help.