
Abstract
The relation between striatal dopamine D2 receptor binding and aging was investigated in rhesus monkeys with PET. Monkeys (n = 18, 39 to 360 months of age) were scanned with 11C-raclopride; binding potential in the striatum was estimated graphically. Because our magnetic resonance imaging analysis revealed a concomitant relation between size of striatum and age, the dynamic positron emission tomography (PET) data were corrected for possible partial volume (PV) artifacts before parameter estimation. The age-related decline in binding potential was 1% per year and was smaller than the apparent effect if the age-related change in size was ignored. This is the first in vivo demonstration of a decline in dopamine receptor binding in nonhuman primates. The rate of decline in binding potential is consistent with in vitro findings in monkeys but smaller than what has been measured previously in humans using PET. Previous PET studies in humans, however, have not corrected for PV error, although a decline in striatal size with age has been demonstrated. The results of this study suggest that PV correction must be applied to PET data to accurately detect small changes in receptor binding that may occur in parallel with structural changes in the brain.
Declines in dopaminergic neurotransmission are a robust feature of mammalian aging (Roth and Joseph, 1994) and are believed to underlie losses of neural functions such as motor abilities. Age-related declines in binding to D2 dopamine receptors in the neostriatum have been reported for a variety of nonhuman species including rodents, dogs, and monkeys, primarily by in vitro assay of receptor concentrations. Human studies also demonstrate an age-related decline in striatal D2 receptor binding, using the radioligands 11C-raclopride and N-[11C]methyl-spiperone with positron emission tomography (PET) (Wong et al., 1984; Antonini et al., 1993; Rinne et al., 1993; Volkow et al., 1996; Wong et al., 1997). These studies used various techniques, including equilibrium and graphical analysis for estimating binding parameters (Farde et al., 1989; Logan et al., 1990). We performed a PET study on a controlled sample of male rhesus monkeys to examine age-related differences in striatal D2 receptor binding potential (BP). In the only previous study of D2 receptors conducted in rhesus monkeys to examine effects of age, Lai and colleagues (1987) observed approximately a 2% loss of D2 receptors per year in caudate nucleus and putamen in vitro using binding assays with 3H-spiroperidol.
Changes in receptor density are of interest inasmuch as they reflect alterations in neurotransmission; however, other simultaneous changes occurring in the brain with advancing age cannot be ignored. In particular, the size of the human striatum has been shown with magnetic resonance imaging (MRI) to decline with age (McDonald et al., 1991). Such structural changes, if not acknowledged, can confound the interpretation of neurochemical findings obtained with PET. Because PET image reconstruction is sensitive to the size of small structures (e.g., caudate nucleus and putamen), it is important to take size into account in quantitative studies. Age differences in the size of a structure could appear to be differences in its ligand concentration, or worse, its degree of receptor binding. Whereas PET images of human striata may be less susceptible to error than those of the monkey, there is undoubtedly some underestimation (i.e., partial volume [PV] error) in the PET measurements of tissue radioactivity in the striata of both species. None of the human PET studies of receptor ligand binding and age, cited earlier, address the age-related differences in striatal size. We have done so by implementing a simple technique, based on measurements of MRI data and analysis of simulated PET images, for correcting the PV error. Our goals were to investigate the possible decline of striatal D2 receptor density in nonhuman primates and to differentiate neurochemical from structural factors.
METHODS
Number of subjects/housing
Eighteen male rhesus monkeys (Macaca mulatta), aged 39 to 360 months, were studied. All animals belonged to a preexisting primate population that is part of a longitudinal study on dietary manipulation and aging being conducted at the National Institutes of Health Animal Center (Poolesville, MD, U.S.A.; Ingram et al., 1990; Lane et al., 1992). Lighting cycles were 12 hours on/12 hours off (6 am to 6 pm); temperature was maintained between 22° and 28°C, and humidity was held at 50% to 60%. Monkeys were fed ad libitum on a diet that has been described previously (Ingram et al., 1990). The study was approved by the Animal Care and Use Committees of the National Institute on Aging and the Johns Hopkins Medical Institutions. The Primate Unit of the National Institutes of Health Animal Center is fully accredited by the American Association for Accreditation of Laboratory Animal Care.
Magnetic resonance imaging procedure
Magnetic resonance imaging was performed in a 1.5 T GE Signa MR (Milwaukee, WI, U.S.A.) unit. During the scanning procedure, the animals were anesthetized using telazol (Aveco, Fort Dodge, IA, U.S.A.), 6 mg/kg, intramuscularly, and acepromazine (Ayerst, New York, NY, U.S.A.), 0.05 to 0.1 mg/kg, intramuscularly. The animals were placed in a MRI-compatible stereotaxic frame. After a sagittal scout scan (echo time = 8 msec, repeat time = 500 msec, number of acquisitions = 1, flip angle = 90 degrees, 15 slices with 6.5-mm thickness), a volumetric SPGR (spoiled gradient recall acquisition in the steady state) scan, containing 124 transaxial slices, was obtained parallel to the orbitomeatal line (echo time = 6.1 msec, repeat time = 15.2 msec, number of acquisitions = 2, flip angle = 30 degrees, 1.0-mm slice thickness). The field of view was 10 cm.
Positron emission tomography procedure
The PET scans were performed on a GE PC4096 Plus 15-slice whole-body PET scanner (7-mm resolution, in-plane [full width at half maximum], 6.5-mm slice thickness). The images were reconstructed with a Hann filter (FWD = 6 mm; cutoff frequency = 1/6 mm−1). The reconstructed resolution (full width at half maximum) was 8.1 mm in-plane and 4.5 (cross-slice) to 6 mm (direct slice) axially at the center of the field (Rota Kops et al., 1990). The monkeys were anesthetized with intramuscular and intravenous Saffan (alphaxalone/alphadolone from Arnolds Veterinary Products, Shropshire, U.K.) (6 to 9 mg/kg/h). Two intravenous lines were inserted: one in the left femoral vein for Saffan infusion, and the other in the right antecubital vein for injection of the radiotracer. An individually molded thermoplastic face mask was made for each animal and secured to a head-holder board. The head then was positioned in the gantry with the aid of two orthogonal laser lines so that image planes would be acquired parallel to the canthomeatal line. Before radiotracer injection, transmission scans were obtained for use in attenuation correction. Vital signs were monitored continuously throughout the PET study and the 2-hour recovery period.
11C-Raclopride was synthesized according to the method of Ehrin and coworkers (1987). Dynamic emission scans were acquired, beginning immediately after bolus injection and continuing for 62 minutes. The dose of raclopride to each subject (in terms of mass) was 0.165 ± 0.056 µg/kg. A series of 28 emission scans was obtained with graduated duration (30 seconds at earliest times to 240 seconds at latest times). No blood samples were taken.
Two-scan procedure versus one-scan procedure
On a scan day, monkeys were subjected to either one (n = 11) or two (n = 7) injections of 11C-raclopride followed by dynamic acquisition. The first injection to each animal in the two-scan procedure group also was pooled with the single injection studies of the one-scan group. For this cohort of 18 studies, the specific activity was 2326 ±1112 mCi/µmol and the radioactivity dose per body weight was 0.99 ± 0.43 mCi/kg. If two injections were performed, the second always followed the first by 2 hours. In the interim, the monkey remained anesthetized in the scanner. This precaution was taken to avoid repositioning artifacts. The two injections were intentionally specified to deliver different masses of raclopride (per body weight). The results associated with each pair of mass doses (dose I: 0.14 ± 0.028 µg/kg; dose 2: 0.35 ± 0.072 µg/kg) were used to eliminate the effect of radioligand mass on our analyses (see the section on mass correction later).
Data analysis
Magnetic resonance imaging
Slice selection and striatal size measurement. Six contiguous axial slices, corresponding roughly to the PET slice in which the striatum was examined, were used to determine a size index of the structure. We chose to measure the width of the putamen in axial view as an index of overall striatal size. The “width” of the putamen was defined as the short-axis length of an approximate ellipse encompassing the putamen. Repeated measurements of putamen width were made on a subset of the data by two independent raters (S. I. C., E. D. M.), who were blind to the identity of the monkeys. The average width was calculated as the mean of bilateral measurements on the six MRI slices. The criteria for choosing the six slices were as follows: moving axially through the MRI data volume from the apex, we identified the first slice that contained the putamen and selected that slice and the subsequent five slices for analysis.
Putamen volume measurements. Three-dimensional putamens were segmented bilaterally from the entire three-dimensional MRI data set of the monkey head as follows: volumetric SPGR data were converted into a volume image file in ANALYZE (Biomedical Imaging Resource, Mayo Foundation, Rochester, MN, U.S.A.) format. The scans were resized to achieve isotropic voxels, and the data were resliced to a standard orientation in which the transaxial plane was parallel to the anterior commissure-posterior commissure line and perpendicular to the interhemispheric fissure.
Volume of the putamen (in cubic millimeters) was measured in two steps: (I) the outline of the putamen was drawn bilaterally using the ANALYZE trace tool on every fifth coronal section and saved as an object mark, and (2) the final tracings were performed in the transaxial plane on every slice that contained the putamen. The guide marks from the coronal sections were used to determine the inferior and medial borders of the putamen. The segmented left and right putamen were saved as an object map for volume rendering and volume measurement. Volume measurements were performed by a third rater (J. A. M.).
Positron emission tomography
Slice selection
In most PET image volumes, the striatum appeared in three slices. In these cases, the middle slice was chosen for drawing of regions. In the chosen slice, the striatum appeared as opposing crescents of activity appearing to reflect the shape of the putamen more than the caudate nucleus. In cases where the striatum appeared in four slices, the comparable slice (which was the second-most inferior slice) was chosen. (Notice: When referring to MRI data, we use the term putamen because that is the structure that was identified; when referring to PET data, we use the term striatum because caudate nucleus and putamen were not easily distinguished.)
Regions of interest drawing and processing
Four 6 × 6 mm2 regions of interest (ROI) were drawn on the striatum. Large rectangular background regions were drawn on the same slice to measure the activity in the tissue adjacent to the striatum. The measured foreground to background activity ratio (“contrast”) was calculated as the ratio of mean ROI activity to mean background activity at each time point. The ROI were drawn on the cerebellum (approximately 12 × 12 mm2), which appeared in a different slice from the striatum, as a measure of activity in a reference (i.e., receptor-free) tissue.
Time-activity curves and partial volume correction
Time activity curves (TAC) for the striatum were constructed as the mean radioactivity (nCi/mL) of four ROI (“caudate” and “putamen,” bilaterally) at the midpoint in time of every scan. Background TAC were means of four regions, described earlier. Mean cerebellum curves were based on the average of two regions.
Because the size of the drawn ROI was on the same order as the striatum in axial view and because the striatum is small relative to the in-plane resolution of the camera, the concentration of radioactivity in those ROI had substantial PV error. In contrast, the cerebellum and background areas were large compared with the resolution and ROI size. Consequently, the PV effects in those regions were neglected. Each time point in the mean striatal TAC was corrected for PV error according to (1) striatal size (see earlier) and (2) foreground-to-background contrast. This step was accomplished using a simulation-generated lookup table (see next section), which mapped “measured” contrast to “true” contrast for various widths of elliptical objects.
Creating a lookup table to model partial volume error
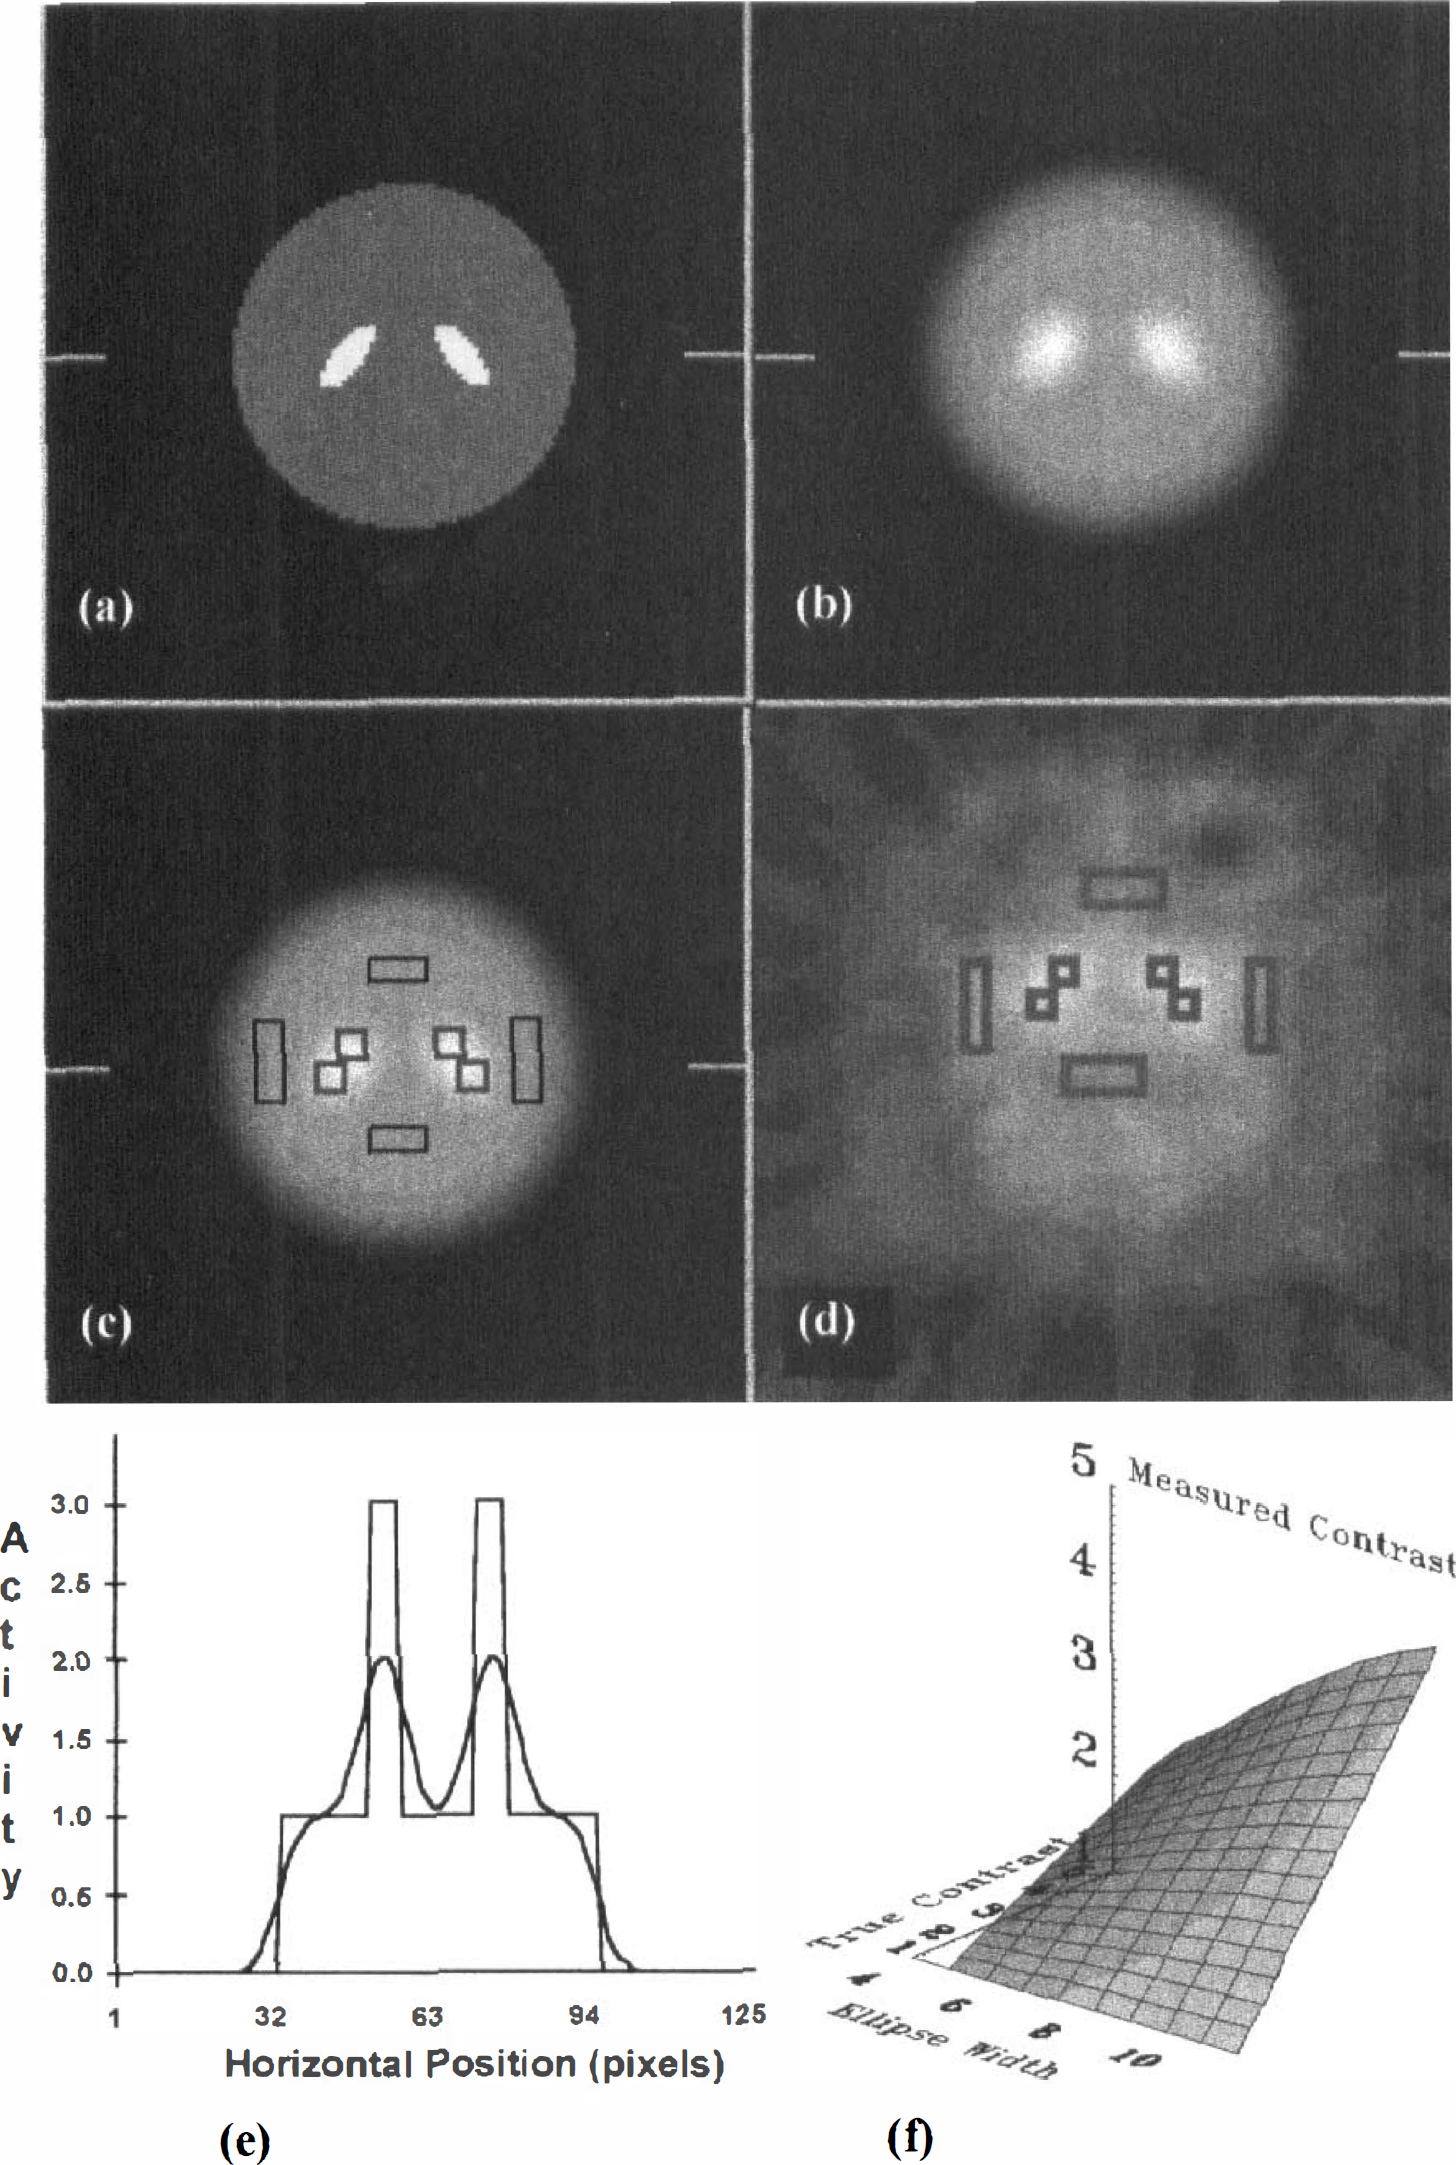
Known two-dimensional objects (Fig. 1A) were used to construct simulated images (Fig. 1B) by analytically computing the projection data for ellipses of various sizes (but constant aspect ratio) placed at the locations typically occupied by the striatum in the image plane. The ROI were placed on the structures in these images (Fig. 1C) in the manner described earlier for monkey images (Fig. 1D; for more details see the section on ROI drawing and processing). The imperfect recovery of radioactivity concentration because of PV error is illustrated by the activity profiles shown in Fig. 1E, which correspond to activity values along the indicated horizontal raster lines in Figs. 1A and B, respectively. For each ellipse size, the measured contrast (based on ROI analysis) was plotted as a function of the known (i.e., true) contrast to create a surface of PV correction values (Fig. 1F). A mathematical description of our method, which is similar to one taken by Zubieta and associates (1995), is given in the appendix.
Creation of a lookup table to correct for partial volume error in striatum and its application to real data.
Graphical estimation of binding potential
Binding potential values were calculated based on the graphical method of Logan and colleagues (1996). This method does not require blood data but uses a reference region (cerebellum) TAC as an input function. The slope of the normalized plot yields the distribution volume ratio (DVR) where BP is equal to DVR-l. The BP estimates were based on PV-corrected data (see earlier) from 20 to 62 minutes.
Mass correction
To avoid bias in our measurements of BP, we corrected for injected mass by linearizing the equilibrium binding equation (Michaelis and Menten, 1913). This correction, which required two estimates of BP measured at different injected masses to extrapolate to the theoretical BP at zero mass (Morris et al., 1998), was performed only on animals that had undergone the two-scan procedure.
RESULTS
Putamen size versus age
A significant correlation was found between the mean bilateral putamen width and age. This relation was of concern as a possible confound to the observed relation between the experimental variable of interest, BP, and our independent variable, age. Accordingly, we accounted for this effect as described in Methods.
Figure 2A displays the average putamen width of each monkey on the MRI slices corresponding to the plane of the PET image. The range of average widths over the six MRI slices examined was 4.8 to 6.4 mm. By contrast, the maximum lengths in the same planes were 18.1 to 22.9 mm (data not shown). If we consider all data as a whole, the correlation between putamen size and age is mild (R = −0.42, P < 0.05). This does not necessarily preclude an effect of age. It is possible that the relation between age and size is nonlinear. As support for this view, notice that the mean value in old animals (n = 6, aged 293 to 360 months) was 10% smaller than in young ones (n = 7, aged 39 to 45 months), whereas the mean putamen size of middle-aged animals (n = 5, aged 164 to 180 months) was 15% less than that of the young group. This nonlinear phenomenon has been found in preliminary measurements of putamen and caudate volumes also (Matochik et al., 1998).
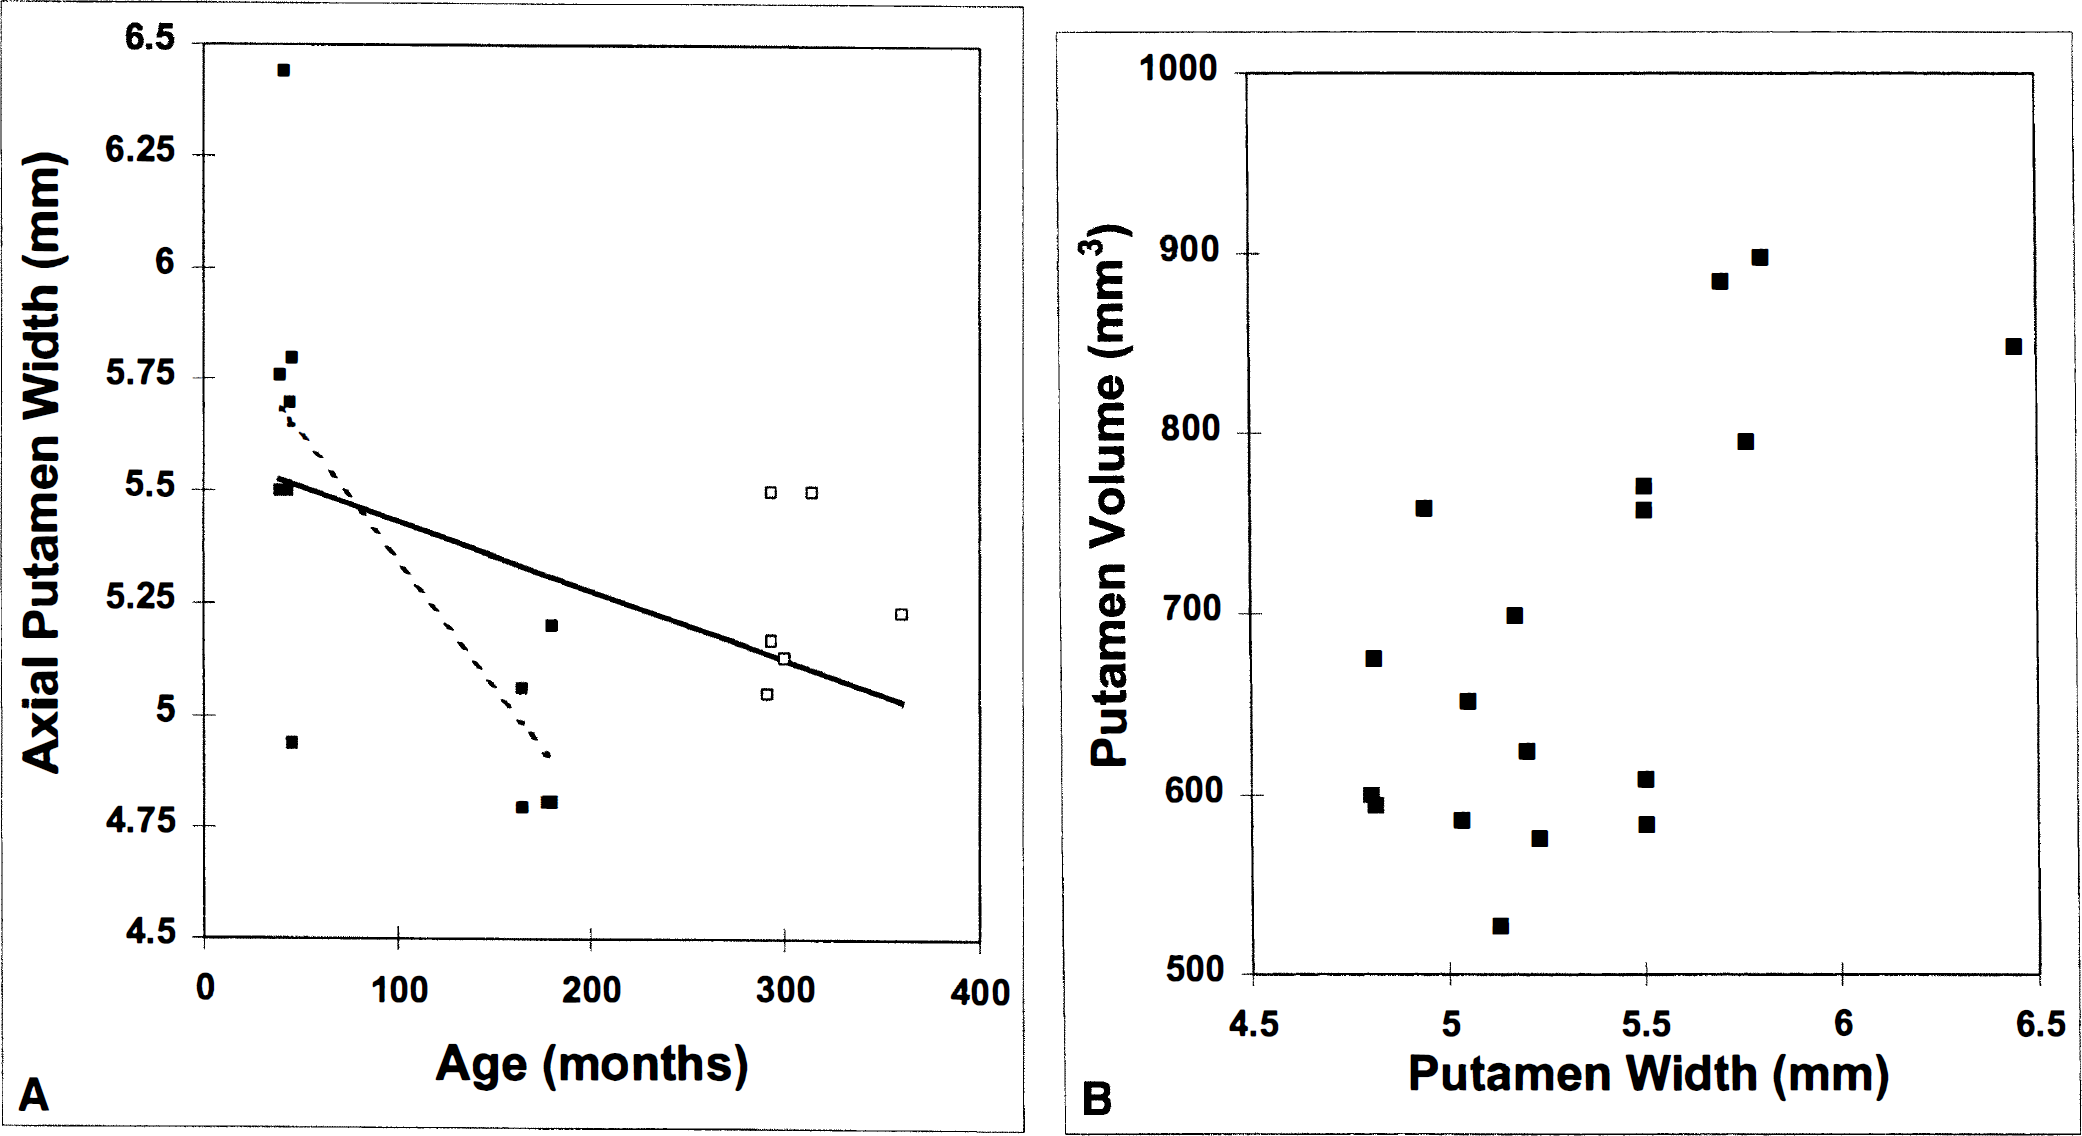
As a check on the robustness of our index of putamen size, Fig. 2B demonstrates a consistent relation between putamen width and putamen volume. We have not presented a line of best fit on the plot because we would not expect a linear relation between length and volume.
The correlation between putamen width and age leads to two questions: (1) Are the structural differences in the putamen across subjects sufficient to cause substantial biases in the measurement of tissue radioactivity? and if so, (2) What is the impact of theses biases on BP?
Sample time-activity curves
The first question can be answered by examining the dynamic PET data with and without taking into account the size of the structure being analyzed. The bottom three TAC in Fig. 3 correspond to the following: background radioactivity, cerebellar activity, and striatal activity. The top curve is the striatal data after correction for partial volume error as described in Methods. These data are from the second of two 11C-raclopride injections administered to monkey 22; the dose was 1.46 mCi/kg.
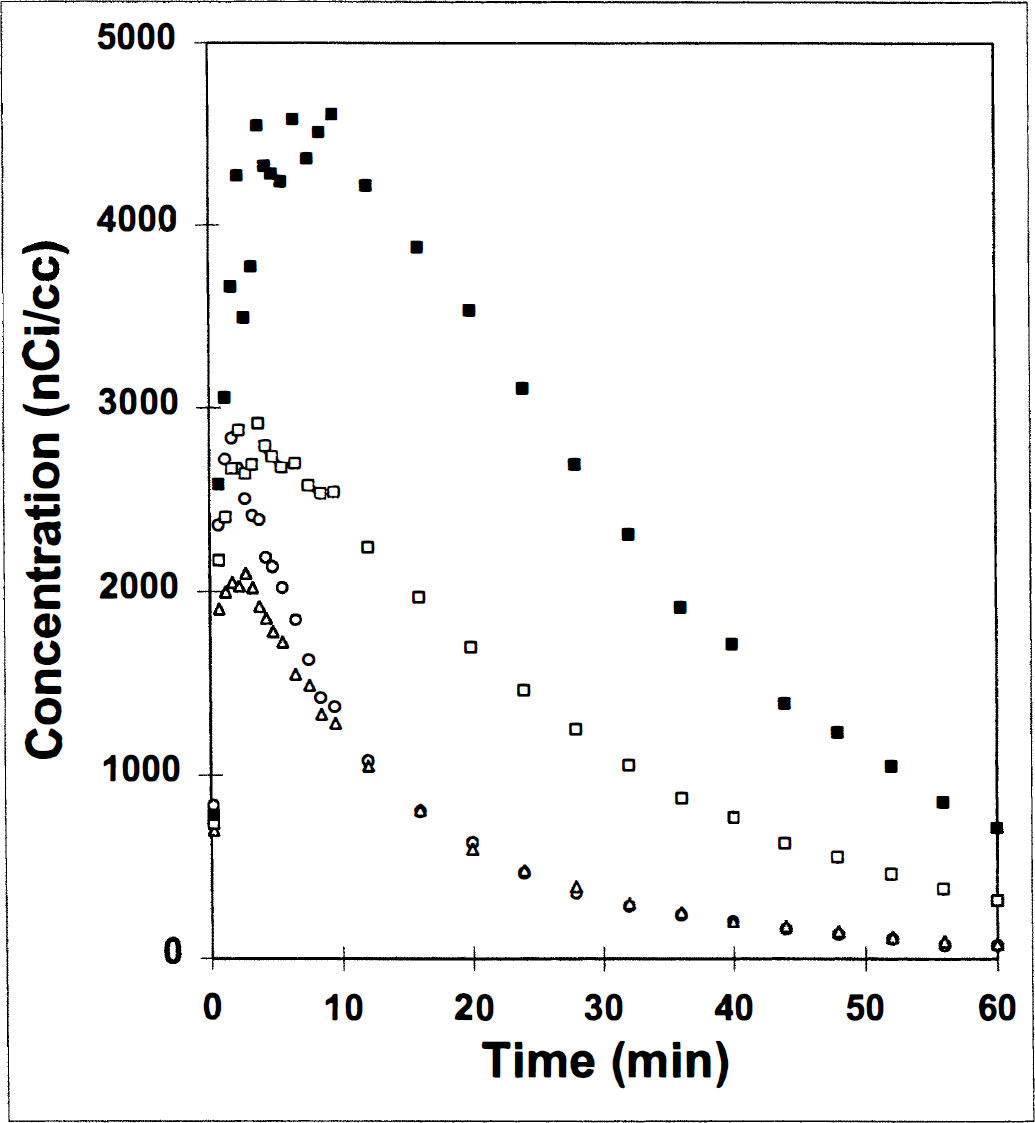
Effect of partial volume correction on a typical TAC (time-activity curve) for striatum. Uncorrected striatum curve (□) is transformed point-by-point into corrected striatum curve (■) based on the ratio of the striatal activity to that in the background (▲) at every time and a simulation-generated lookup table described in Methods. Cerebellum TAC (○), which is necessary for the estimation of binding potential, is provided for comparison with background.
First, we observe the great differences between the corrected and uncorrected striatal TAC. As predicted by the theory, underestimation of true tissue radioactivity was considerable at all times throughout the acquisition (although the percentage underestimation varied). The concentration of radioactivity in the tissue appeared to peak at less than 5 minutes after injection. However, PV correction reveals that peak uptake actually occurred closer to 10 minutes; although washout initially is comparable, the long-term component of washout appears to be slower in the corrected data. The curves were not corrected for radioactive decay.
Correlation of binding potential and putamen width
The question of the impact of the PV error on measurement of BP is addressed in Fig. 4. The lower curve (in Fig. 4A) shows the uncorrected BP estimate for each animal (n = 18) plotted against its measured putamen width (millimeters). The BP values are based on a single high specific activity injection (i.e., the one-scan protocol). The correlation between increase in uncorrected BP and increase in width was significant (R = 0.64, slope = 0.85 BP unit/mm, P < 0.005). This correlation, coupled with the decline of putamen size with age (Fig. 2A), suggests that striatum size could confound the relation between BP and age.
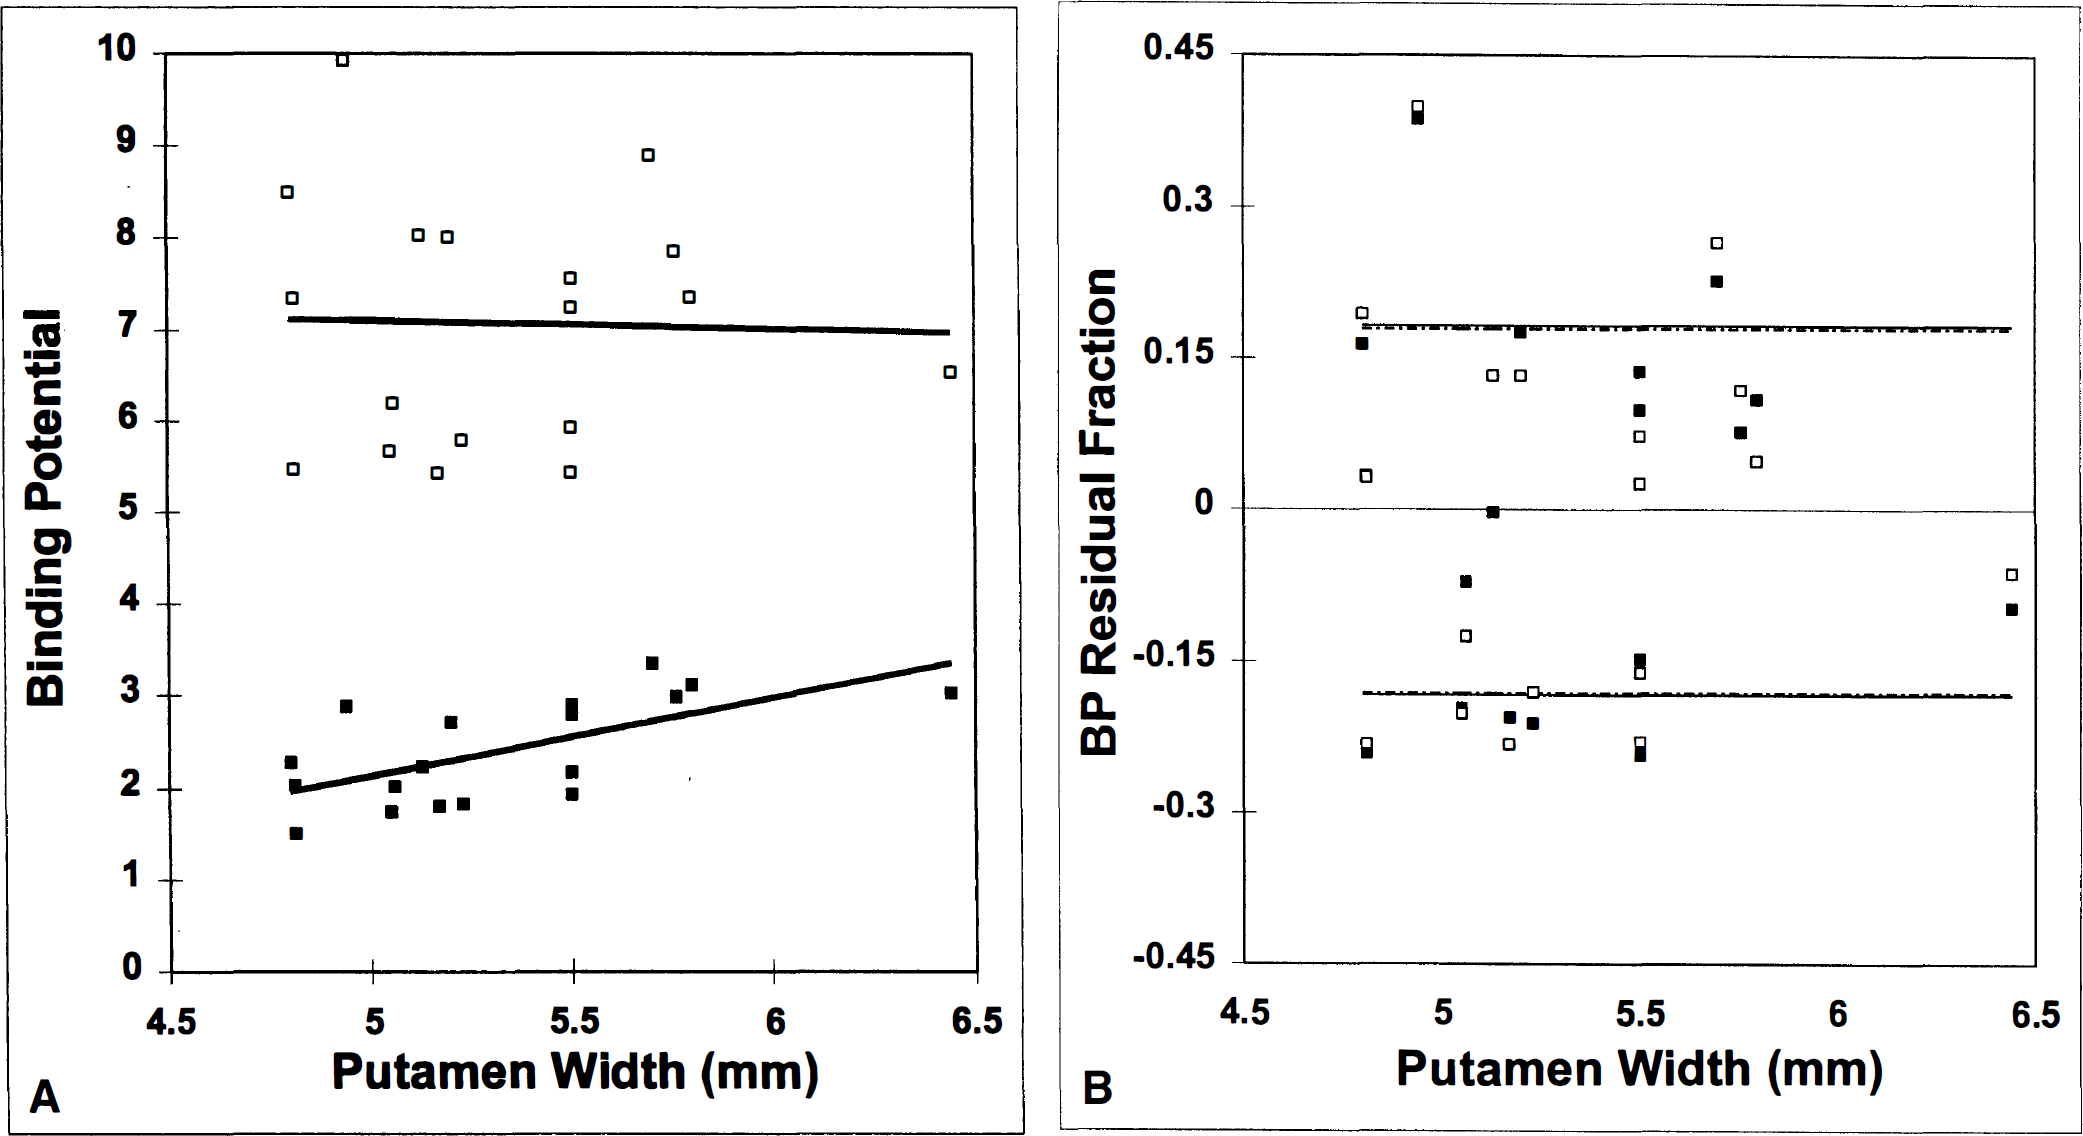
(A) Correlation between binding potential (BP) and putamen width before (lower curve,) and after correction (upper curve, ‘) for partial volume effect. Significant increase in BP with putamen size is eliminated by partial volume (PV) correction.
The upper curve in Fig. 4A shows that we could eliminate the confounding correlation with size before calculation of BP. This curve plots the estimated BP for each monkey versus its putamen width using the PV-corrected TAC. After PV correction (see Methods), the BP estimates are not correlated with putamen width (R = −0.03, slope = 0.09 BP unit/mm). Figure 4B is a plot of the normalized residuals, (BPmeasured − BPfitted)/BPfitted, versus putamen size for the two curves in Fig. 4A. The lines demarking 1 SD above and below the two fitted lines in Fig. 4A are nearly indistinguishable. Thus, the correction does not appreciably increase the variability of our BP estimates.
Randomized delivery of mass with age
Before concluding our analysis, we also checked that the mass of raclopride injected was not spuriously correlated with age, since it has been shown previously that mass dose of ligand per body weight can bias estimation of BP in monkey-sized animals (Carson et al., 1997; Morris et al., 1998) and in rats (Hume et al., 1995). Figure 5 shows a plot of mass of raclopride in micrograms per kilogram of body weight versus age in months. The figure confirms that no significant artifact was introduced into our analysis by a skewed administration of mass doses to monkeys of different age. The slope of the fitted line is −0.000037 µg/kg/mo. The correlation coefficient, R, is 0.08. Therefore, from the standpoint of eliminating artifact, it would not have been necessary to correct our data for mass-of-ligand effects. However, mass correction, like PV correction, adds an offset to the data as well as a reranking of the subjects. We believe that it was worthwhile to examine the BP values with and without correction for mass. Any change in the scale or offset of BP could affect the calculation of percentage change in BP per decade, which is an often-reported number in the literature (Suhara et al., 1991; Volkow et al., 1996; Wang et al., 1996; Ichise et al., 1997). In our case, mass correction (Morris et al., 1998) after PV correction (n = 7) was not different from PV correction alone (data not shown).
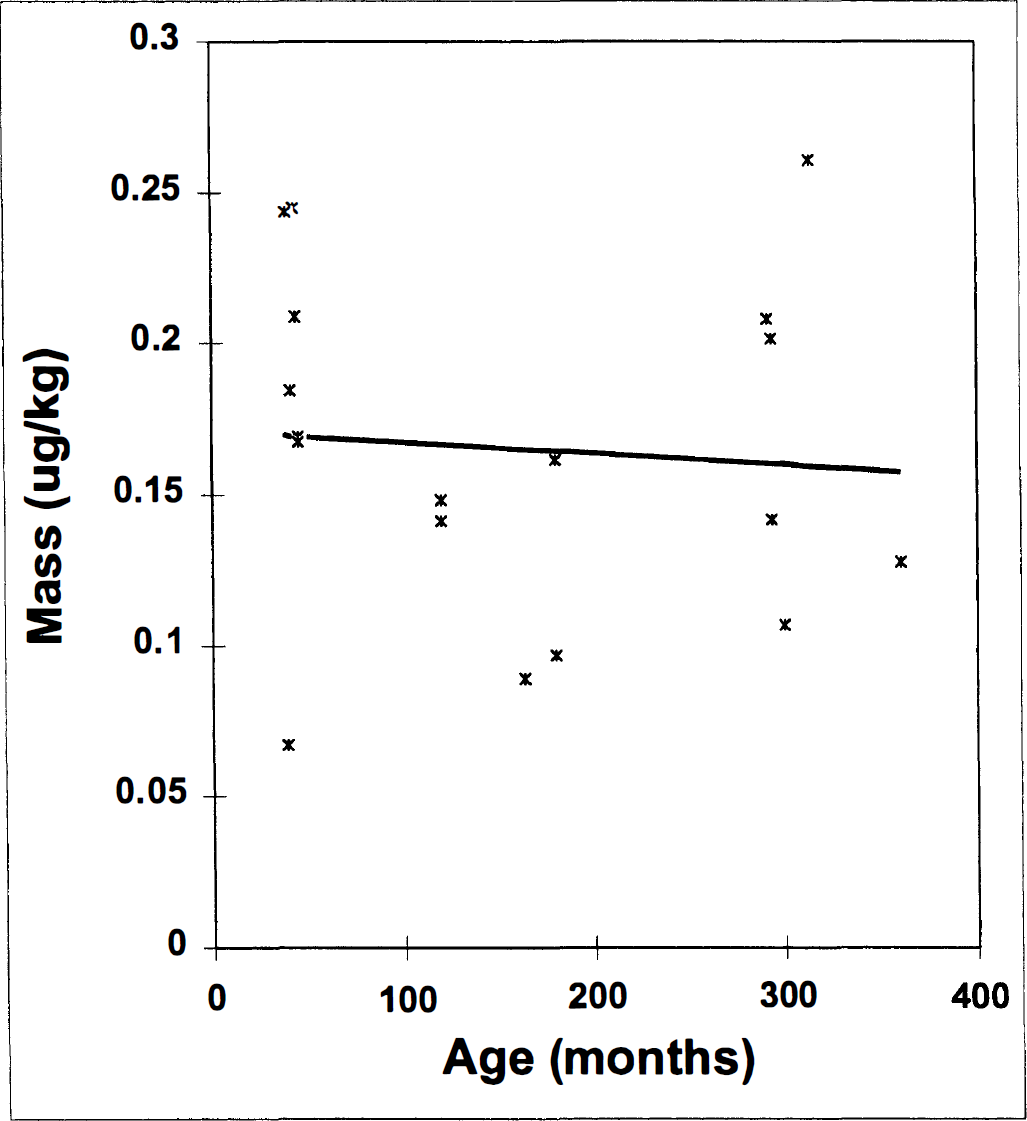
Correlation between mass of injected raclopride per body weight and age. No correlation was observed, indicating a lack of experimental bias.
Binding potential versus age
Figure 6 plots the BP estimates (with and without PV correction) versus age. Because the corrections (for both PV and mass effects) changed the scale of the BP values, we normalized all BP estimates by the intercept of their respective regression lines. The dotted line is a normalized fit to 18 BP values estimated from uncorrected TAC data (R = −0.82, P < 0.0005). The decline in uncorrected BP would be equivalent to 1.5 ± 0.27% per year. The solid line is a normalized fit to the 18 corresponding estimates of BP after PV correction (R = −0.57, P < 0.005). The decline in BP is 1.0 ± 0.33% per year. The BP estimates after correction for both PV and mass effects (R = −0.50, not significant) yielded the same rate of decline with age (1.1 ± 0.83% per year, data not shown). As mentioned previously, mass correction requires two dynamic studies; only seven animals were studied using the “two-scan procedure.”
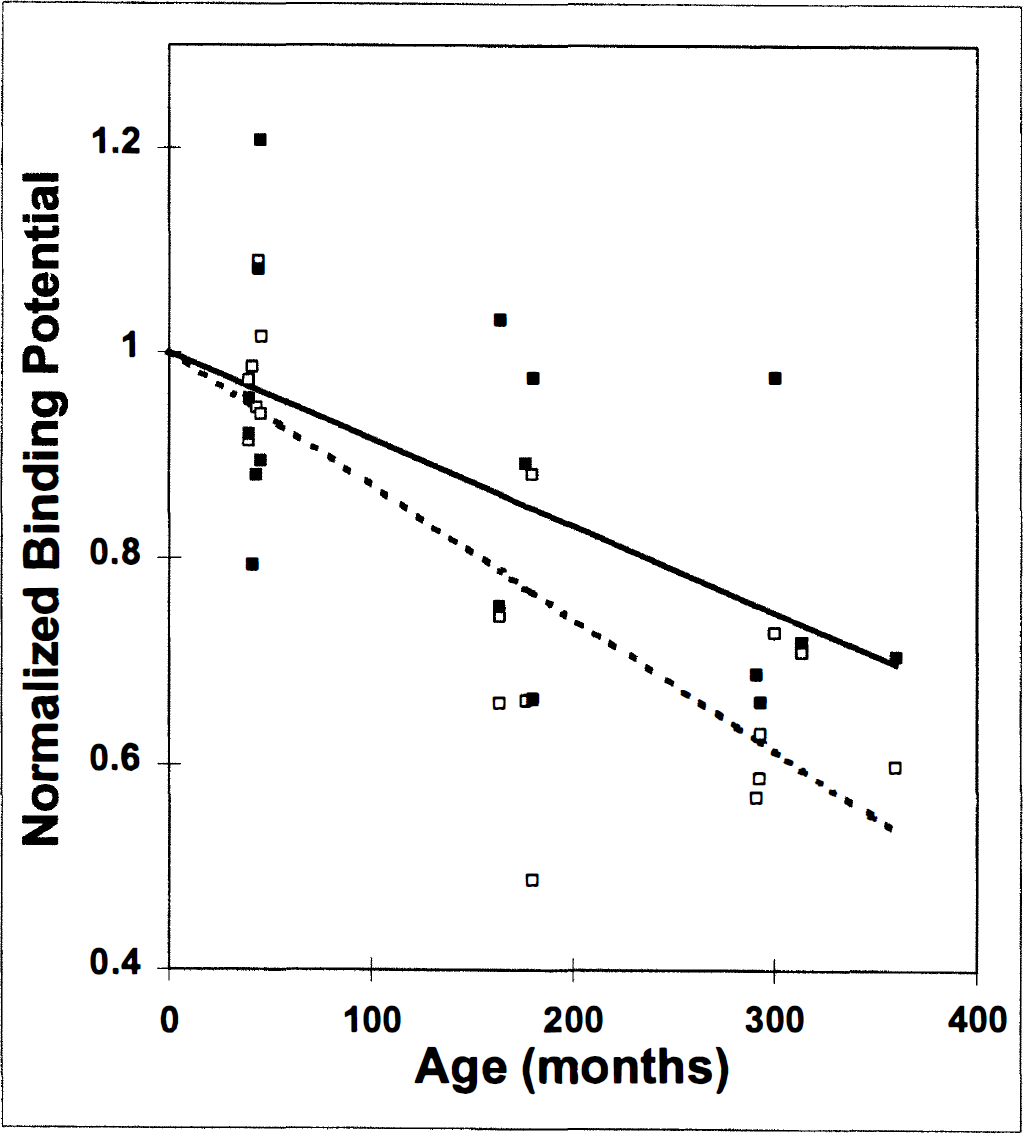
Correlation of normalized BP with age. The BP estimates were normalized by their respective fitted y intercept value so that the slope reflects the fractional change of BP with age. Normalized BP based on uncorrected data (n = 18; dashed fitted line, open symbols) declines significantly with age. Normalized BP based on PV-corrected data (n = 18; solid fitted line, filled symbols) also declines significantly with age.
Whereas all three methods of calculating BP show a decline in D2 binding with age, the rates of decline (i.e., the slopes) are different. The scaled estimates of BP after correction for either one or two potential artifacts are in good agreement. The corrected data suggest smaller rates of decline in the number of D2 receptors with age than do the uncorrected data.
DISCUSSION
We have demonstrated a decline with age in BP at striatal D2 receptor sites in rhesus monkeys using PET. Our findings are consistent with previous ones in vivo (Wong et al., 1984; Wong et al., 1988; Antonini et al., 1993; Rinne et al., 1993; Volkow et al., 1996; Wang et al., 1996; Wong et al., 1997; Ichise et al., 1997) and postmortem in humans (Rinne, 1987; Rinne et al., 1990), and with a single finding in rhesus monkey brains (Lai et al., 1987). There are, however, some areas of disagreement that are worth examining. If careful attention is paid to what is being measured, the discrepancies between in vitro and in vivo, and between monkey and human data can be resolved.
In vivo versus in vitro studies
The single aging study of monkey brain in vitro (Lai et al., 1987) found larger declines in dopamine D2 receptor densities (Bmax) in both the caudate nucleus and putamen than those reported here. Specifically, Lai and associates (1987) found that receptor density, Bmax, declined 2.1% per year in caudate and 1.7% in putamen. Their work was based on 3H-spiperone binding, which is less selective for D2 receptors than 11C-raclopride, but this is probably not the primary source of the difference. In vitro assays, which involve the preparation of tissue homogenates, measure the total number of receptor sites in a given tissue volume, Bmax. In contrast, in vivo assays with PET measure something related to the steady-state concentration of available receptors, Bʹmax. Nevertheless, many reports on in vivo studies refer to the parameter that has been measured with PET as Bmax (Farde et al., 1989; Logan et al., 1990). In our case, we measured BP (Mintun et al., 1984), which is proportional to Bʹmax, provided that the ligand is introduced in true tracer amounts (Morris et al., 1998). Unlike the concentration of total receptors, the concentration of available receptors is a parameter that is sensitive to the concentration of endogenous ligand (Logan et al., 1991), which, in our case, was dopamine. If there were a decline in endogenous dopamine level with age that paralleled the decline in receptor density, the available receptors would be preserved. Thus, Bmax (in vitro) would decline, but Bʹmax and BP (in vivo) might not.
Why use binding potential?
Although BP (= Bʹmax/KD) is proportional to, rather than equivalent to Bʹmax, it is generally considered to be a more robust measure of available receptors when blood samples are unavailable. By attributing changes in BP solely to changes in Bʹmax, we agree to accept two assumptions: (1) that the affinity of the radioligand for the D2 receptor, KD, is not affected by age; and (2) that the basal level of synaptic dopamine also is not related to age. Scatchard analysis of D2 binding with 3H-spiroperidol in human postmortem striatal samples (Rinne, 1987; Rinne et al., 1990) implies that assumption 1 may be true for raclopride. On the other hand, there is evidence that assumption 2 is not true. McGeer and others (1977) demonstrated age differences in tyrosine hydroxylase (the rate-limiting enzyme in dopamine synthesis) in humans brain samples at autopsy. Volkow and coworkers (1994) demonstrated that the responsiveness of the dopamine system to stimulants also is diminished with age. As we suggest, a violation of assumption 2 could lead to a discrepancy between in vivo and in vitro findings. Nevertheless, we chose to accept the burden of these two assumptions to avoid taking arterial blood samples from our monkeys.
Studies using humans versus monkeys
Some PET researchers report rates of decline (0.8% to 1.0% per year) in available D2 receptors in humans, measuring BP or Bʹmax (Wong et al., 1988; Volkow et al., 1996; Wang et al., 1996; Wong et al., 1997), comparable with the rate demonstrated in this report. However, it is probably inappropriate to compare human data to monkey data on a per-year basis. If we calculate decline in D2 receptor binding per one twelfth of maximal life span (approximately 120 years for humans (Rockstein et al., 1977); approximately 36 years for monkeys (Bowden and Williams, 1984), then the human binding appears to decline more rapidly than that of the monkey. However, previous PET studies of age effects have not accounted for a possible confound from decline in striatal size with age. The schematic in Fig. 7 summarizes and attempts to reconcile the main findings on differences in D2 binding with age based on human and monkey data in vivo and in vitro. Figure 7A represents the hypothetical observation that Bmax and Bmax decline comparably with age. If this were the case, one could conclude that assumptions 1 and 2 (cited earlier) regarding the constancy of KD and dopamine were satisfied. In reality, the relation between the monkey data in this report and those of Lai and colleagues (1987) correspond to the plot in Fig. 7B (left). The larger decline per year found in vitro can be explained by a parallel decline in endogenous dopamine, which would mitigate some of the decline in available receptors measured by PET. In contrast, the human data are addressed in Fig. 7C. Rinne and associates (1990) found a smaller decline per year in D2 Bmax (in vitro) than did Wong and others (1997) using the same ligand in vivo. The simplest explanation for this reversal between monkey and human findings would be to assert that endogenous dopamine must rise with age in humans, but such an assertion would be in direct conflict with the observations of McGeer and coworkers (1977) regarding tyrosine hydroxylase and age. Furthermore, Wong and others (1986) used blocking doses of haloperidol in an attempt to extrapolate their measurements to Bmax, which would not be sensitive to changes in dopamine. For these reasons, a more likely explanation is that dopamine declines with age but striatal size does as well (McDonald et al., 1991), leading to an apparent decline in Bʹmax, which overwhelms the effect of dopamine.
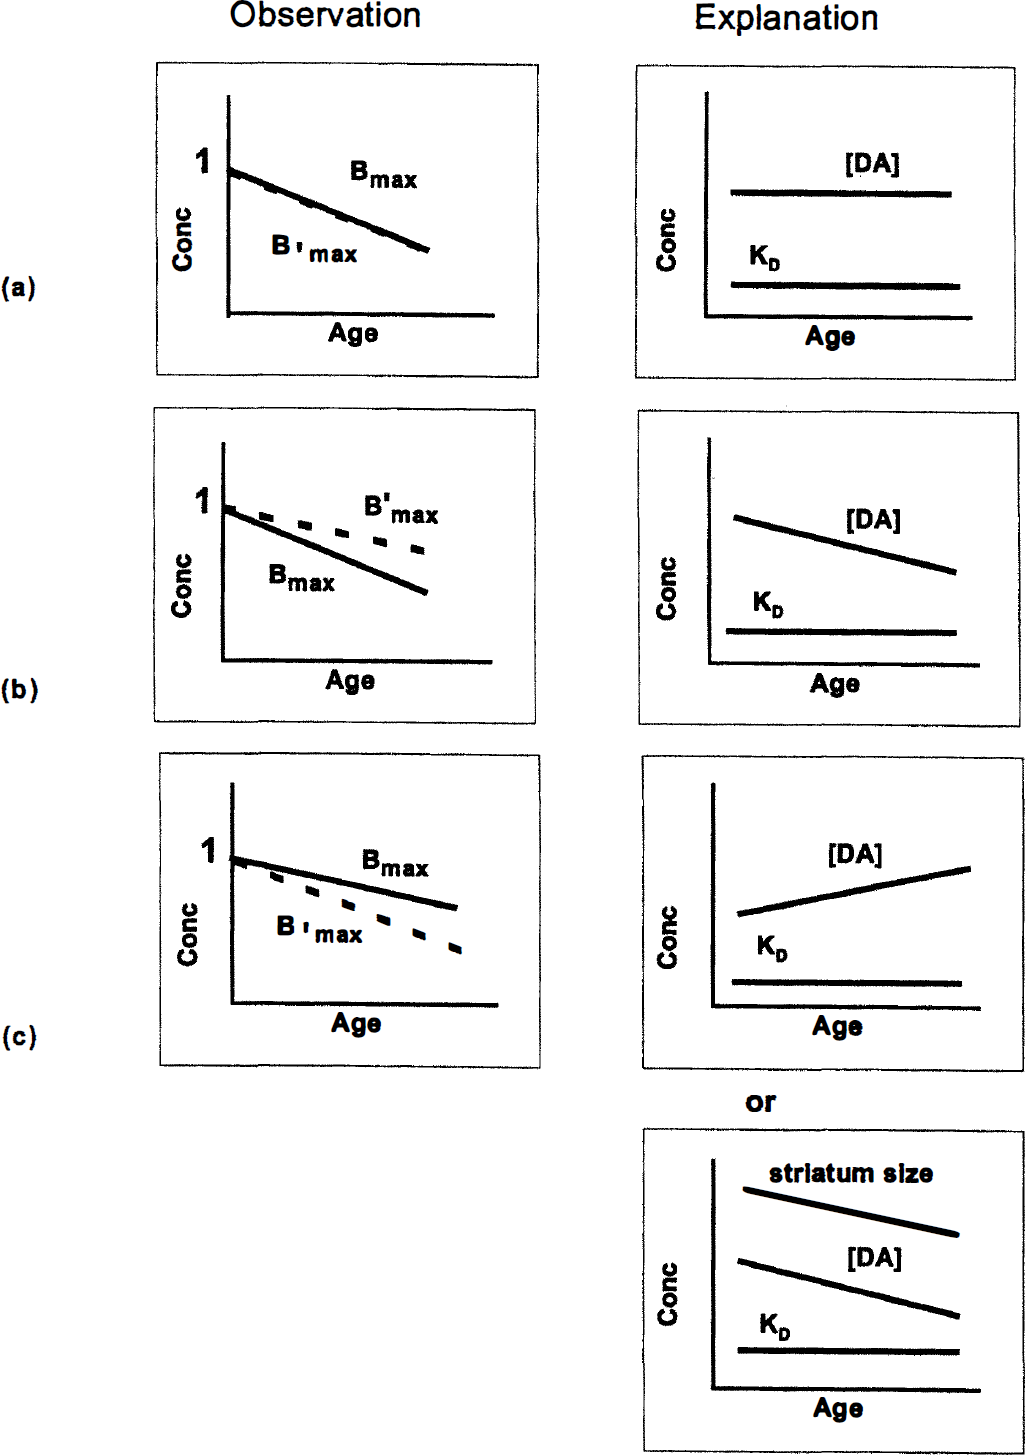
Schematic indicating possible interpretation of observed trends in D2 receptor concentration with increasing age of subject that are consistent with both in vitro and in vivo data from monkeys and humans.
We observe the following instance of agreement. Human data—not corrected for PV effect—from a PET study with 11C-raclopride by Rinne and colleagues (1993) are consistent with our monkey data after normalization for life span. The Finnish group found a 4.6% decline in Bʹmax per decade, whereas we found a 4.6% decline in BP per “monkey decade” (i.e., 3 years) before PV correction.
Partial volume correction
Much methodologic work has been done in PET (with either phantoms or simulations) to understand how object size affects measured radioactivity (Hoffman et al., 1979; Kessler et al., 1984; Bendriem et al., 1991; Rousset et al., 1993; Links et al., 1996). Many methods have been suggested to correct for the inability of the PET image reconstruction process to “recover” the true radioactivity in structures that are small relative to the resolution of the camera. The incomplete recovery cannot be corrected by scaling all of the PET data by a single recovery coefficient; rather, the ROI activity at each time point must be corrected relative to the activity of the adjacent background (Links et al., 1996). The most sophisticated of the correction methods currently in use are pixel-by-pixel and require a full three-dimensional volume of MRI data that has been segmented into gray matter, white matter, and CSF for each subject (Muller-Gartner et al., 1992; Meltzer et al., 1996; Rousset et al., 1996). Since we were only interested in D2 receptor binding in the striatum, which is a well-defined gray matter structure surrounded by white matter, we chose to take a simpler approach to PV correction, which did not require a fully trisegmented MRI volume.
Our method (see the appendix), which is based on simulated images of right elliptical objects surrounded by uniform tissue of varying relative concentration, does correct each PET data point individually. Nevertheless, it relies on two major assumptions, which affect the interpretation of our results. First, the striatum is a homogeneous structure of uniformly distributed activity. If this is not completely true, then the inhomogeneity should not be a function of age. We have modeled all striata as solid objects of uniform activity to predict the appropriate recovery coefficient for each image frame of each animal. If the distribution of receptors were to become more heterogeneous with age, a further drop in recovery might increase the apparent decline of receptor binding with age. Second, the striatum is infinitely long in the z axis (i.e., perpendicular to the PET slice). This assumption clearly is false. The point is that our model accounts for the imperfect recovery of radioactivity in the plane (which is caused by reconstruction) but not across planes, which results from the nonconstant sensitivity of detectors in the axial direction, (i.e., the “slice profiles”). Because the z axis extent of a monkey striatum is approximately 10 to 16 mm (our data not shown; Szabo and Cowan, 1984; Martin and Bowden, 1996), we assume that loss of size in this direction is not the primary contributor to PV error. A PET study of modeled basal ganglia by Bendriem and coworkers (1991), using a realistic brain phantom, confirmed that axial mispositioning is a secondary cause of PV error compared with size and shape of the structure (in the plane). Nevertheless, some loss of recovery is likely to occur because of z-axis blurring, and more sophisticated three-dimensional methods of PV correction eventually must be applied to the problem.
Why bother with partial volume correction at all?
As we have seen, loss of PET signal with age could result from decline in the number of receptors per volume of tissue or to loss of the tissue. Either way, one could claim to have demonstrated an age-related decline of dopaminergic receptor BP. We believe that it is important to distinguish these two interpretations. There are two issues at stake. One is the distinction between neurochemical and “structural” changes in the brain. Although the distinction is arbitrary, it has implications for future research for instance: Why develop drugs to prevent loss of D2 receptors if the problem is loss of neurons from the striatum? The second issue concerns proper quantitation. We have shown that PV correction eliminates an unwanted correlation of BP with size of striatum. After this correction, which accounts for size of brain structure and camera resolution, the data indicated less of an age effect on D2 receptor binding than before correction (1.0 ± 0.33% versus 1.5 ± 0.27% decline per year, P < 0.09). Ideally, the data we present here will be compared with data in other species and acquired on other cameras. Unfortunately, without correcting for PV error, an identical loss of receptor density with age would appear smaller either in a species whose striatum is larger than the monkey's, or on a camera whose resolution is better than that of the PC4096 Plus. We recommend that PV correction of PET data for aging studies be standard procedure. It is our hope that this work establishes the magnitude of the age effect on primate D2 receptors against which interventions can be tested.
Footnotes
Acknowledgments
The authors thank colleagues in the Division of Nuclear Medicine at Johns Hopkins School of Medicine (Hayden T. Ravert, PhD, William B. Mathews, PhD, John L. Musachio, PhD, Robert C. Smoot, CNMT, David J. Clough, CNMT, Karen Edmonds, CNMT, Paige Finley, VT, and Fuji Yokoi, MD) for their expert technical assistance. The authors also thank Drs. Elena Rota Kops and Hans Herzog of the Institute of Medicine, Nuclear Research Center, Juelich, F.R.G., for sharing original data that we used to construct simulations consistent with the performance of the PC4096 Plus scanner; and Dr. Mike Casey of Siemens-CTI, who provided software routines for projection and image reconstruction.