
Abstract
In an exposition of the technique of calculating distribution volumes from laser-scanning confocal microscopic (LSCM) data, three-dimensional images of the distribution of one or two fluorescent markers in mouse brain specimens were generated by LSCM and processed by a system developed for morphometric analysis of fixed and stained serial brain histologic samples. To determine the volume of perfused cerebral capillaries, one of two fluorescent plasma markers, either fluorescein isothiocyanate (FITC)-dextran or Evans blue, was intravenously administered to mice subjected to 1 hour of embolic middle cerebral artery (MCA) occlusion (n = 9) and to mice that were not operated on (n = 3); after 1 minute of circulation, brains were removed, immersion-fixed, and processed for LSCM. In some of these animals (n = 5), the volume of endogenous microtubule-associated protein-2 (MAP2) fluorescence was also determined using immunohistochemical staining. For mice that were not operated on, this methodology yielded highly localized volumes of (1) microvascular plasma, which agree with those determined for rodents by other techniques, and (2) MAP2 expression, which appears physiologically and morphologically reasonable. After 1 hour of MCA occlusion, the MAP2 volumes of distribution were less than 10% of normal in the ipsilateral hemisphere in which plasma perfusion essentially ceased. In conclusion, precise colocalization and quantitation of early ischemic neuronal damage and cerebral plasma perfusion deficit can be done with this three-dimensional, microphysiologic and microanatomic methodology.
Laser-scanning confocal microscopy (LSCM) is an imaging technology that entered the armamentarium of biomedical researchers about 10 years ago and has since become a popular method for in vitro and in vivo physiologic studies (Paddock, 1996). It can be used to optically section serial tissue sections without a knife and produce three-dimensional pictures of two or three fluorescent markers simultaneously. As to practical application, sets of fluorescent markers for cellular identification and specific protein expression can be selected to obtain concurrent, colocalized anatomic and physiologic information in normal and damaged tissue by LSCM. Until now, this technology has been sparsely applied to investigations of cerebrovascular pathophysiology and stroke, and its usage has been limited to providing pictures-but not quantitation-of anatomic, biochemical, and physiologic features.
In the present study, LSCM was used to section mouse brain specimens serially and produce three-dimensional images of the distribution of one or two fluorescent markers, as has been done by others. To carry the technology further, the volumes of distribution were quantitated from these images by means of a system developed for three-dimensional analysis of fixed and stained serial brain histologic samples (Davies et al., 1996). To determine the volume of perfused cerebral capillaries, one of two fluorescent plasma markers (either high-molecular-weight fluorescein isothiocyanate (FITC)-dextran or Evans blue, which labels albumin) was intravenously administered to mice that were not operated on or to mice that were subjected to 1 hour of middle cerebral artery (MCA) occlusion by a clot (Zhang et al., 1997). One minute later, the brains were removed, immersion-fixed, and processed for LSCM. In addition to plasma marker fluorescence, immunohistochemical staining of microtubule-associated protein-2 (MAP2) was assayed in many of the samples. This methodology permits quantitative comparison of plasma perfusion and MAP2 expression in normal brain tissue and precise correlation of early ischemic neuronal damage to cerebral perfusion deficit.
MATERIALS AND METHODS
All experimental procedures have been approved by the Care of Experimental Animals Committee of Henry Ford Hospital.
General preparation
Male C57B/6J (n = 12) mice weighing 29 to 35 g were used in the experiments. Animals were anesthetized with 3.5% halothane; subsequently anesthesia was continued with 1.0% halothane in 70% N2O and 30% O2. Rectal temperature was maintained at 37° ± 1.0°C throughout the surgical procedure by means of a feedback-regulated water heating system. The right femoral artery was cannulated with a PE-10 catheter for measurement of blood gases (pH, PaO2, and PaCO2).
Animal model
Focal cerebral ischemia was induced by placement of an embolus at the origin of the MCA as previously reported (Zhang et al., 1997). Briefly, a single, intact, fibrin-rich, 24-hour-old homologous clot (0.2 μL) was positioned at the origin of the MCA through an 8-mm length of modified PE-50 catheter.
Monitoring of relative erythrocyte flow velocity
Relative erythrocyte flow velocity (REFV) was measured by laser-Doppler flowmetry (LDF) in the tissue under the LDF probe. A PeriFlux PF4 flowmeter (Perimed AB, Stockholm, Sweden) was used, and REFV was recorded in perfusion units. After reflecting the skin overlying the calvarium and subsequently carefully avoiding pial vessels, two probes were positioned on the intact skull 2 mm posterior to the bregma and 6 mm to each side of midline. Because the skull and subarachnoid space are very thin in the mouse, reliable REFV measurements can be made without craniotomy (Zhang et al., 1997). Relative flow velocities were simultaneously measured on both hemispheres before and immediately after injecting the clot and then repeatedly over the next hour. The data were continuously stored on computer and analyzed using the data acquisition and analysis system provided (Perimed AB). The postischemic flow velocities were expressed as a percentage of the preischemic baseline values.
Fluorescent probes, tissue processing, and immunohistochemistry
One hour after placement of the embolus, one of two fluorescent plasma markers, either FITC-dextran (2 × 10⁶ molecular weight, Sigma, St. Louis, MO, U.S.A.; 0.1 mL of 50 mg/mL; n = 5) or Evans blue (Sigma; 2% buffered saline solution, 0.2 mL/100 g body weight; n = 4), was administered intravenously. In addition, three mice that were not operated on received FITC-dextran (n = 2) or Evans blue (n = 1) as a control group. In addition to their obvious size differences, FITC-dextran remains dissolved and free in plasma water, whereas Evans blue is virtually completely bound to plasma proteins (Hultstrom et al., 1983; Theilen and Kuschinsky, 1992). Both dyes circulated for 1 minute. The anesthetized animals were then killed by decapitation. The brains were rapidly removed from the severed heads and placed in 4% paraformaldehyde at 4°C for 24 hours. Coronal sections (150 μm) were cut on a vibratome.
Immunohistochemical staining for the neuronal cytoskeletal protein, MAP2, was performed for evaluation of early ischemic neuronal damage. Adjacent vibratome sections from the FITC-dextran group were incubated with a monoclonal antibody to MAP2 (1:50; clone AP20, Boehringer Mannheim Biochemicals, Indianapolis, IN, U.S.A.) for 3 days at 4°C. Texas red conjugated to anti-mouse immunoglobulin antibody (Vector, Burlingame, CA, U.S.A.) was used as a secondary antibody.
Distribution volumes of plasma markers and MAP2 immunoreactivity
The sections were analyzed with a Bio-Rad MRC 1024 (argon and krypton) laser-scanning confocal imaging system mounted onto a Zeiss microscope (Bio-Rad; Cambridge, MA, U.S.A.). Microscopic data were acquired with a 10× objective with a numerical aperture of 0.3 and also a 40× oil-immersion objective lens with a numerical aperture of 1.3. Green (FITC-dextran-labeled microvessels) and red (Evans blue-labeled microvessels) fluorochromes on the sections were excited by a laser beam at 488 and 568 nm, respectively, and emissions were detected with a photomultiplier tube through 522- and 585-nm emission filters, respectively. For sections stained with MAP2 antibody, green (FITC-dextran-perfused microvessels) and red (MAP2 immunoreactive neurons) fluorochromes on the sections were excited by a laser beam at 488 and 568 nm; emissions were simultaneously acquired with two separate photomultiplier tubes through 522- and 605-nm emission filters. Laser intensity was set as 30% of laser power and black level was zero for all data acquisition. Electronic gain ranged from 930 to 980 for FITC and from 1,000 to 1,500 for Evans blue or Texas red. The iris (confocal aperture) was adjusted from 2.0 to 2.2. Because the size of the fluorescent spots in a two-dimensional image depends on the laser power, iris, gain, and duration of sampling time, these parameters were fixed within the same section during the acquisition of data.
Tissue sites for LSCM analysis were chosen to cover a range of distribution volumes and thereby assess the sensitivity of the measurements. To accomplish this, three brain areas, the parietal and piriform cortices and the caudate-putamen, were selected and studied in both control (not operated on) and ischemic (MCA-occluded) mice. With the tissue samples from control mice, 10 sections from interaural 6.38 mm to interaural 1.00 mm (Franklin and Paxinos, 1997) were screened under a 10× objective lens and the areas of interest located. With the tissue samples from the ischemic mice, a similar set of 10 sections were examined, and the ones that showed the greatest contrast in the plasma marker distribution, presumably the result of the placement of the embolic clot, were selected from each animal. The analysis was then done on these areas of interest on the ipsilateral side and homologous areas on the contralateral side.
For both groups of mice, the tissue areas of interest were scanned in 512 × 512 pixel (1042.4 × 1042.4 μm) format in the x-y direction using a 4× frame-scan average, and 20 thin, optical sections along the z-axis with a 5-μm-step size under a 10× objective were acquired. The dimensions of the volume imaged were 1042.4 × 1042.4 × 100 μm3. High-resolution imaging from the area found in the 10× objective was acquired with 50 to 70 thin, optical sections along the z-axis with a 1-μm-step size under a 40× objective lens. The tissue volume or image size was 260.6 × 260.6 × 50 μm3 or 260.6 × 260.6 × 70 μm3. A total of 106 images were acquired from nonoverlapping fields.
All images acquired from LSCM were imported into an MCID image analysis system (Imaging Research, St. Catherines, Canada). A single composite three-dimensional image (dimensions given above) was reconstructed from the distribution of FITC-dextran or Evans blue. For the tissue samples with FITC-dextran, MAP2 immunoreactivity was also assessed; two sets of three-dimensional images were constructed, each one representing the distribution of a different fluorescent marker. Since the z-step position was kept intact, the resulting reconstructions covered identical tissue volumes and could be overlayed to produce composite images.
A fixed gray-scale display cutoff was then applied to the model to ensure that the three-dimensional reconstruction was an accurate rendering of the original tissue staining pattern. The total volume of staining present in the rendered cube of tissue was then calculated in cubic micrometers and divided by the total tissue volume (3,395,618 μm3 or 4,753,865 μm3 for 50- and 70-μm-thick samples, respectively) to determine the percentage of tissue volume that was fluorescently marked.
Statistics
Data were analyzed using Mann-Whitney rank sum test. Student's t test was performed for analyzing REFV. All values are presented as means ± SD. Statistical significance was set at P < 0.05.
RESULTS
Physiologic parameters
Blood gases were within normal ranges for both control and ischemic mice anesthetized with halothane. For example, 1 hour after embolization, the mean values (± SD) for the ischemic mice were pH, 7.31 ± 0.07; PaCO2, 33.8 ± 7.2 mm Hg; and PaO2, 137 ± 13 mm Hg.
Relative erythrocyte flow velocity
For 1 hour after MCA occlusion, REFV was significantly (P < 0.05) reduced on the ipsilateral parietal cortex (22% ± 8% of the preischemic flow velocity) but was essentially unchanged on the contralateral parietal cortex.
Distribution of plasma markers and MAP2 immunoreactivity
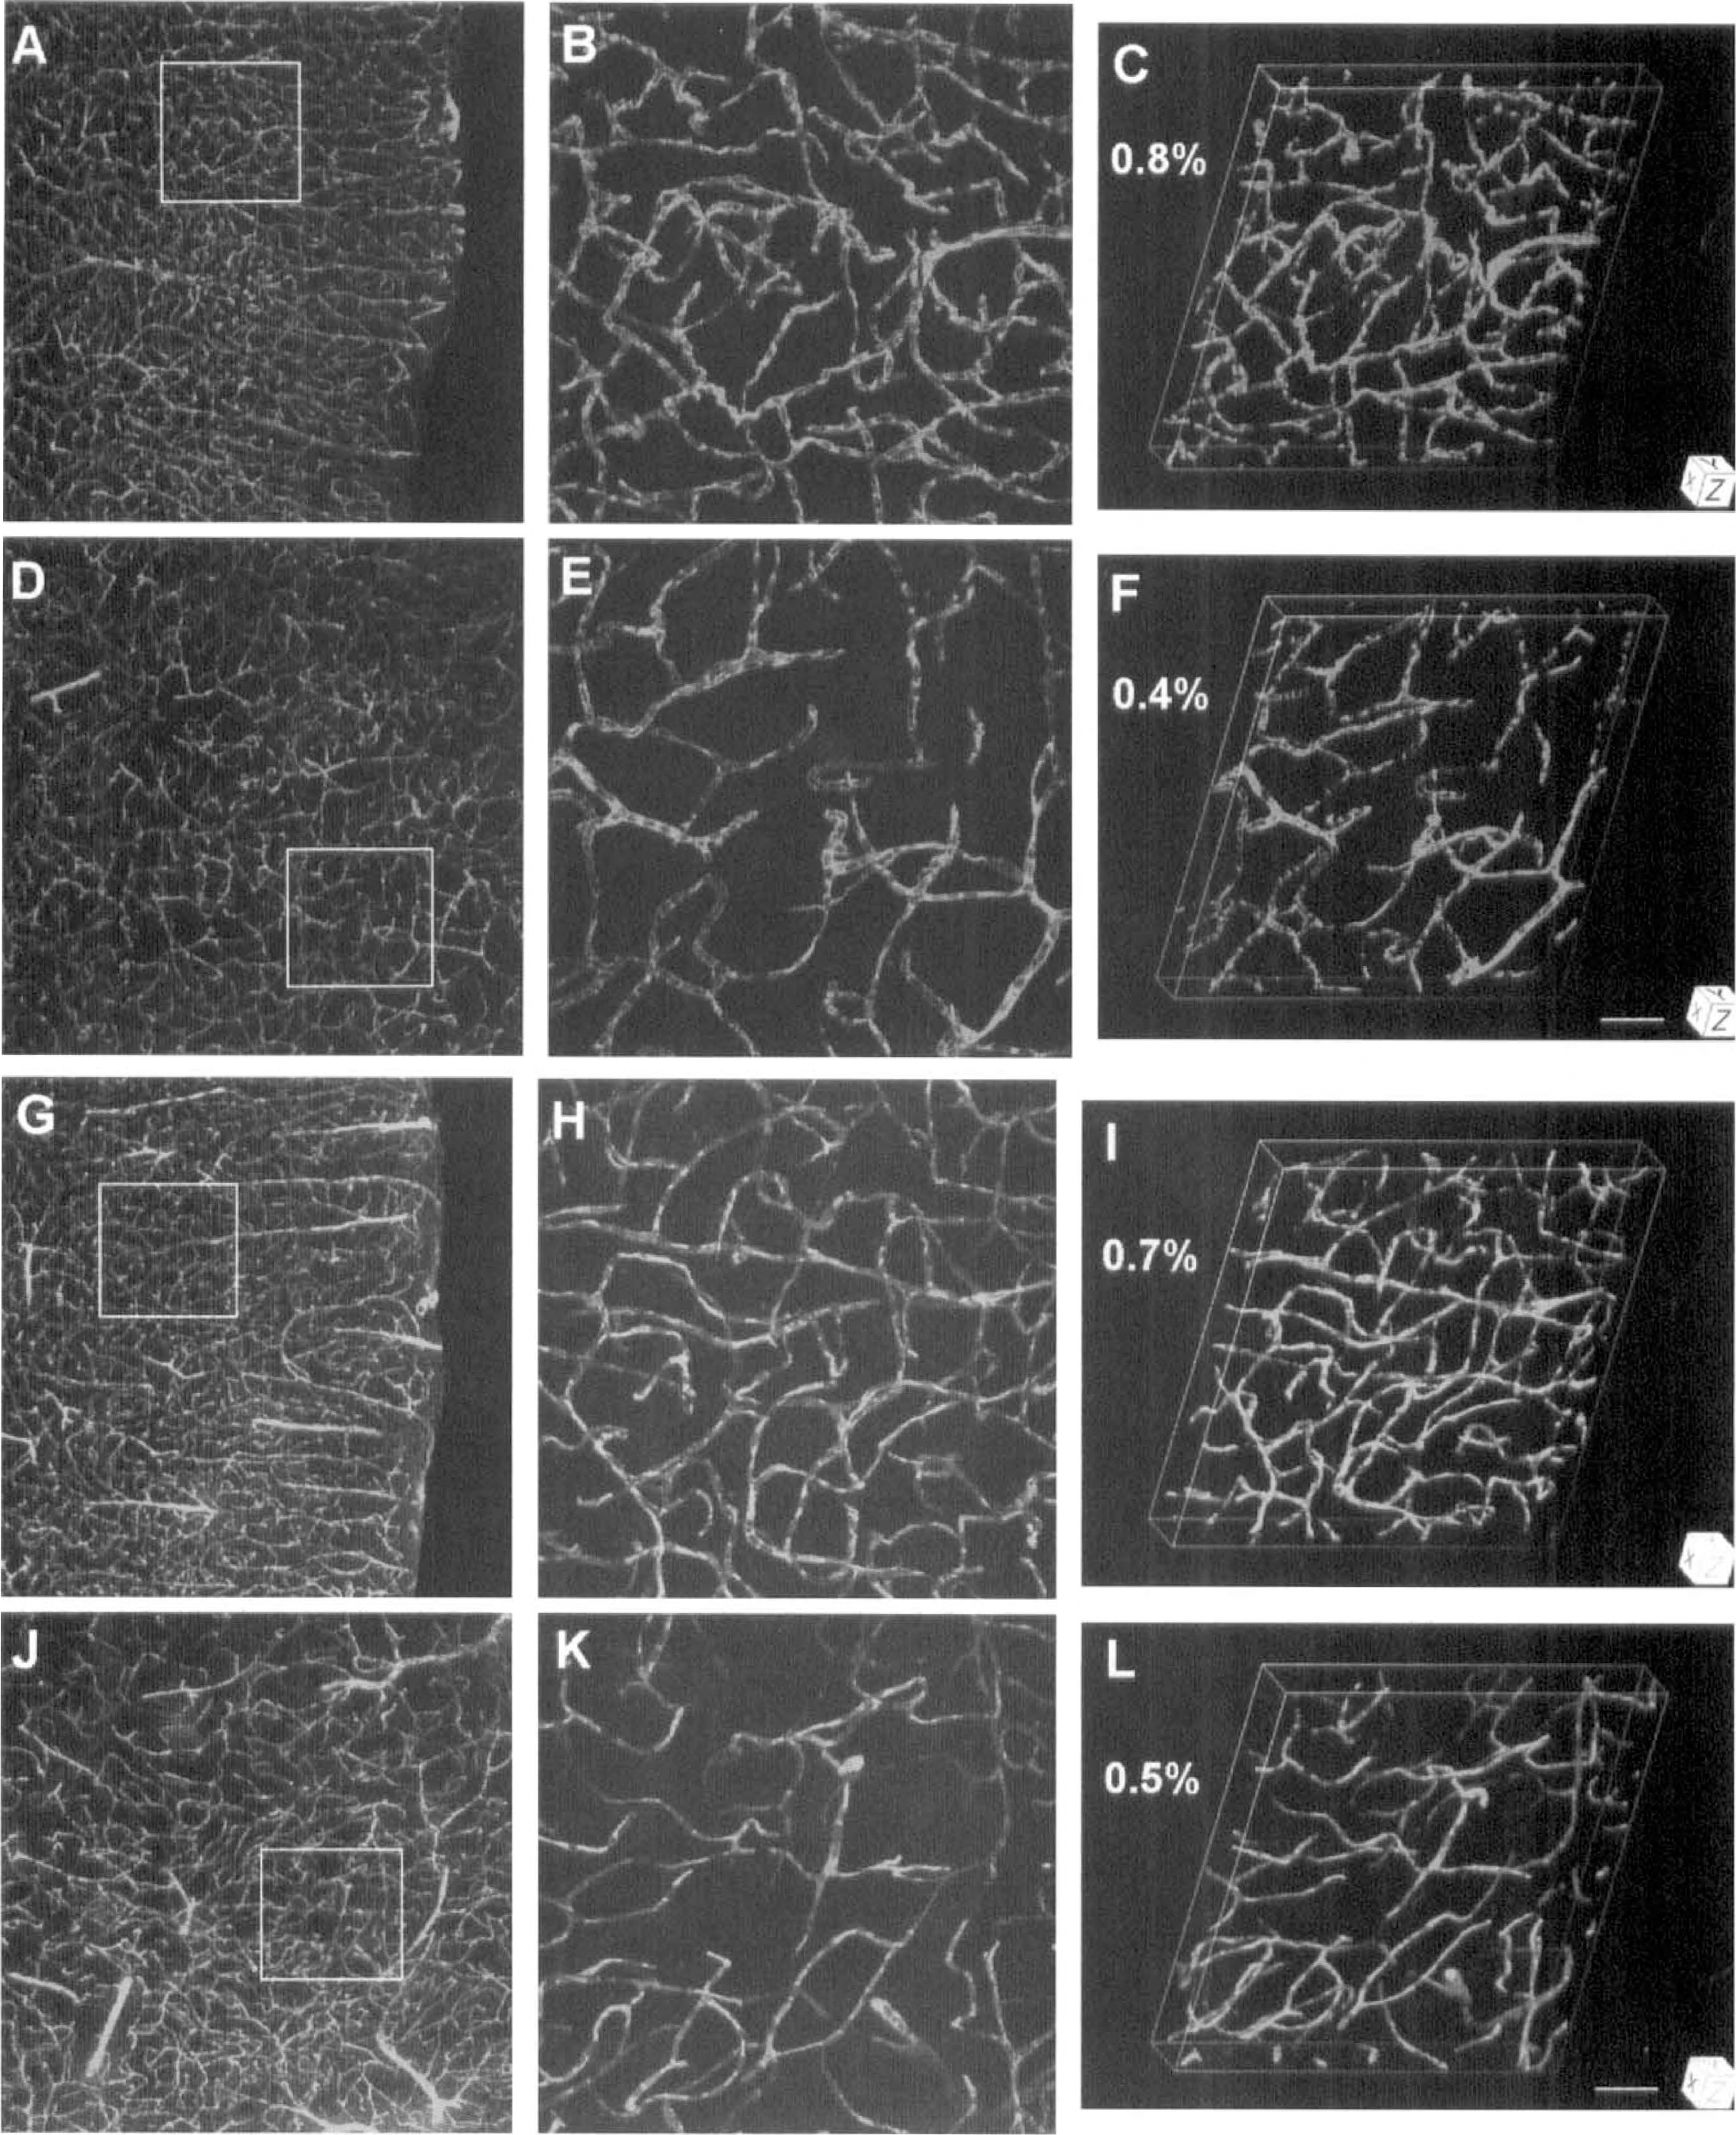
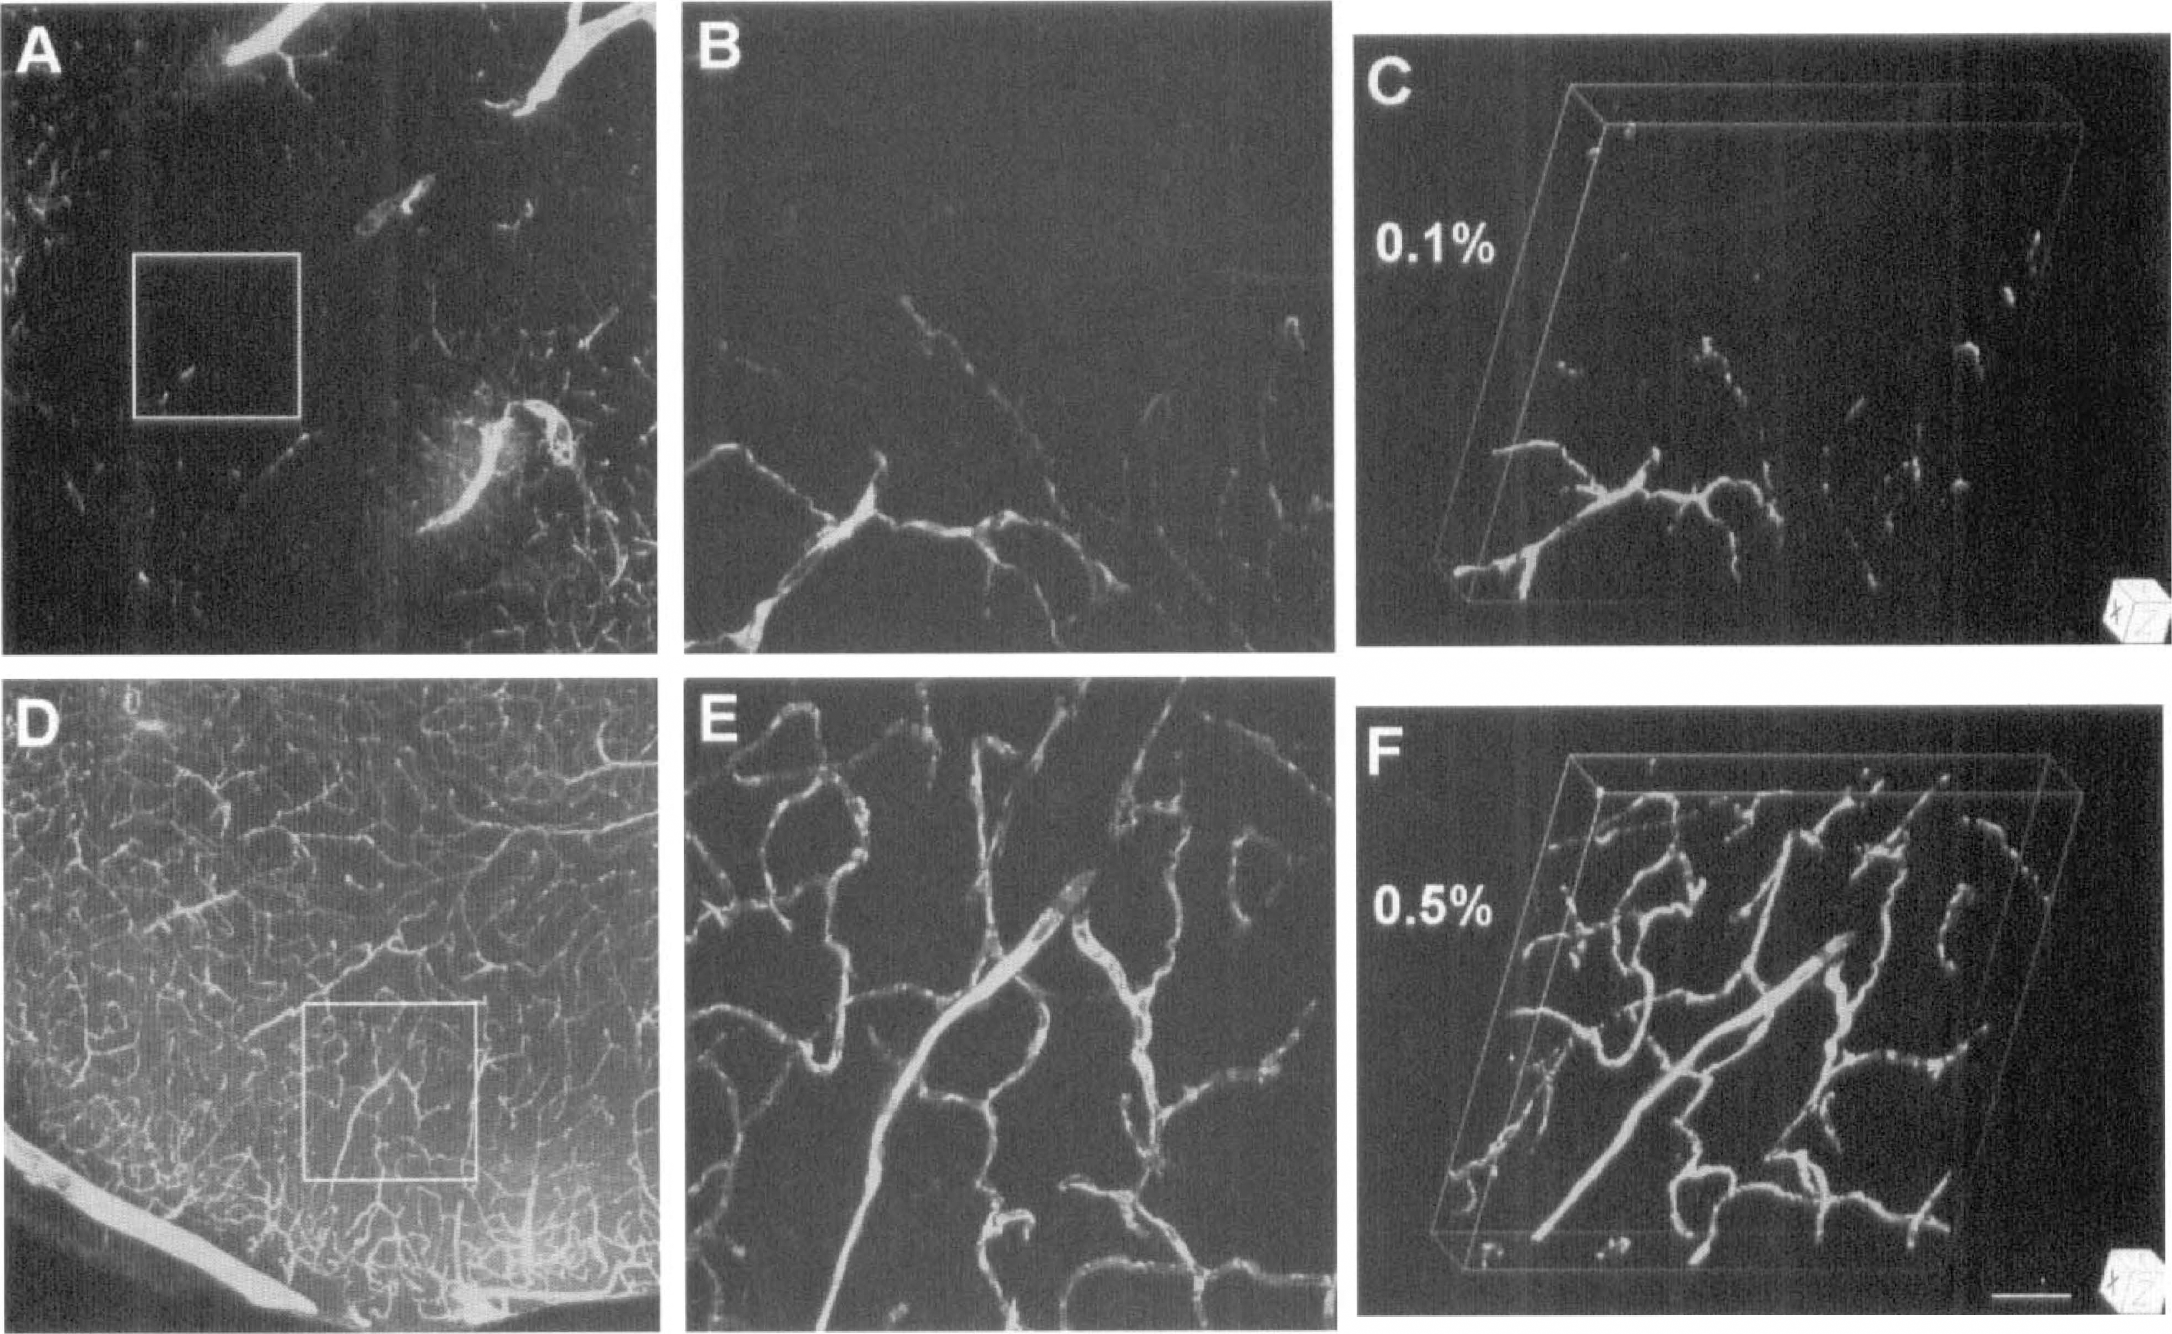
As seen by intraluminal FITC-dextran (Fig. 1A–1F) or Evans blue (Fig. 1G–1I) fluorescence, the capillary systems of the cortex and caudate-putamen of control mice are composed of a complex, twisting array of tubes. Intravascular blood cells were visible at high magnification in the x-y projections as dark oval figures filling the microvascular lumina (Fig. 1B,E,H,K). Since all capillaries appear to be plasma-perfused in rodent brain under normal conditions (Villringer et al., 1994), we assume that these patterns of plasma and erythrocyte distribution show the entire capillary system in this section of mouse brain. For controls and the contralateral side of the ischemic mice, the mean volume percentages of FITC-dextran and Evans blue were virtually identical in both the cortex and striatum (Table 1).
The distribution volumes of plasma markers (%) in perfused capillaries
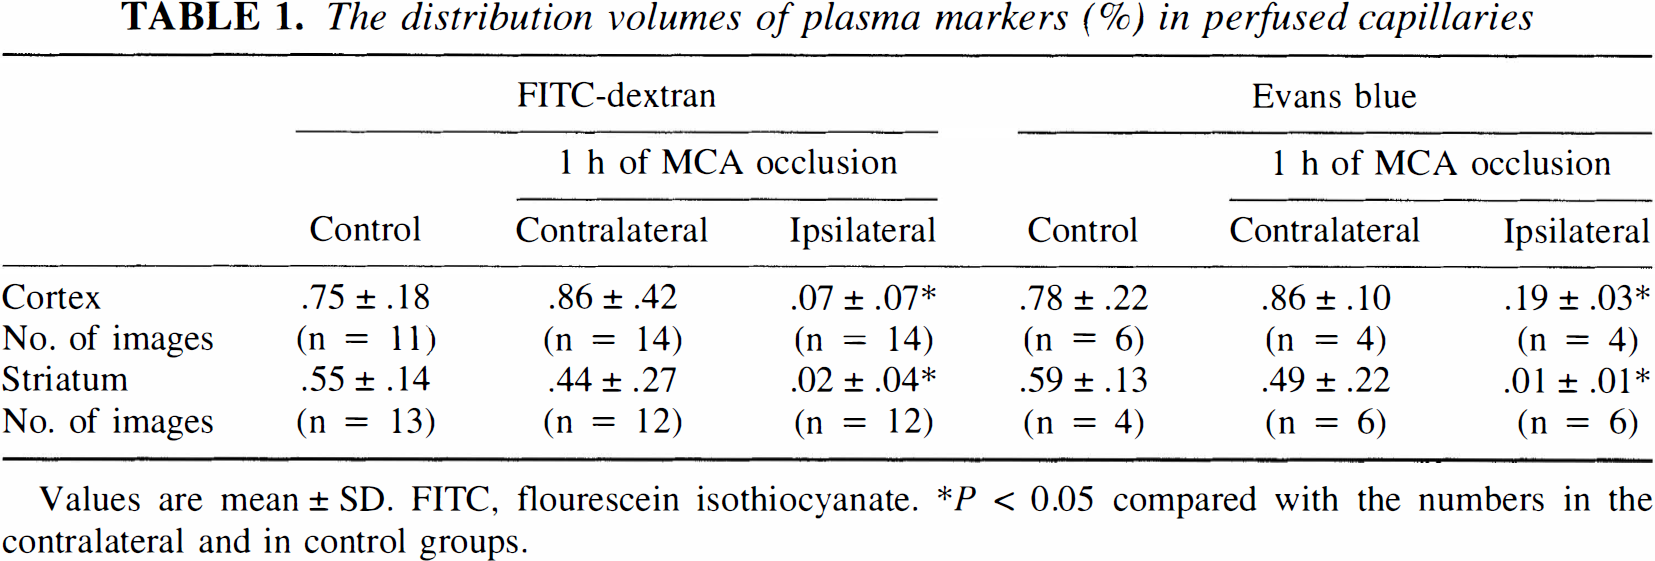
Values are mean ± SD. FITC. flourescein isothiocyanate.
P < 0.05 compared with the numbers in the contralateral and in control groups.
Three-dimensional reconstructions of plasma perfusion in capillary networks from the somatosensory cortex
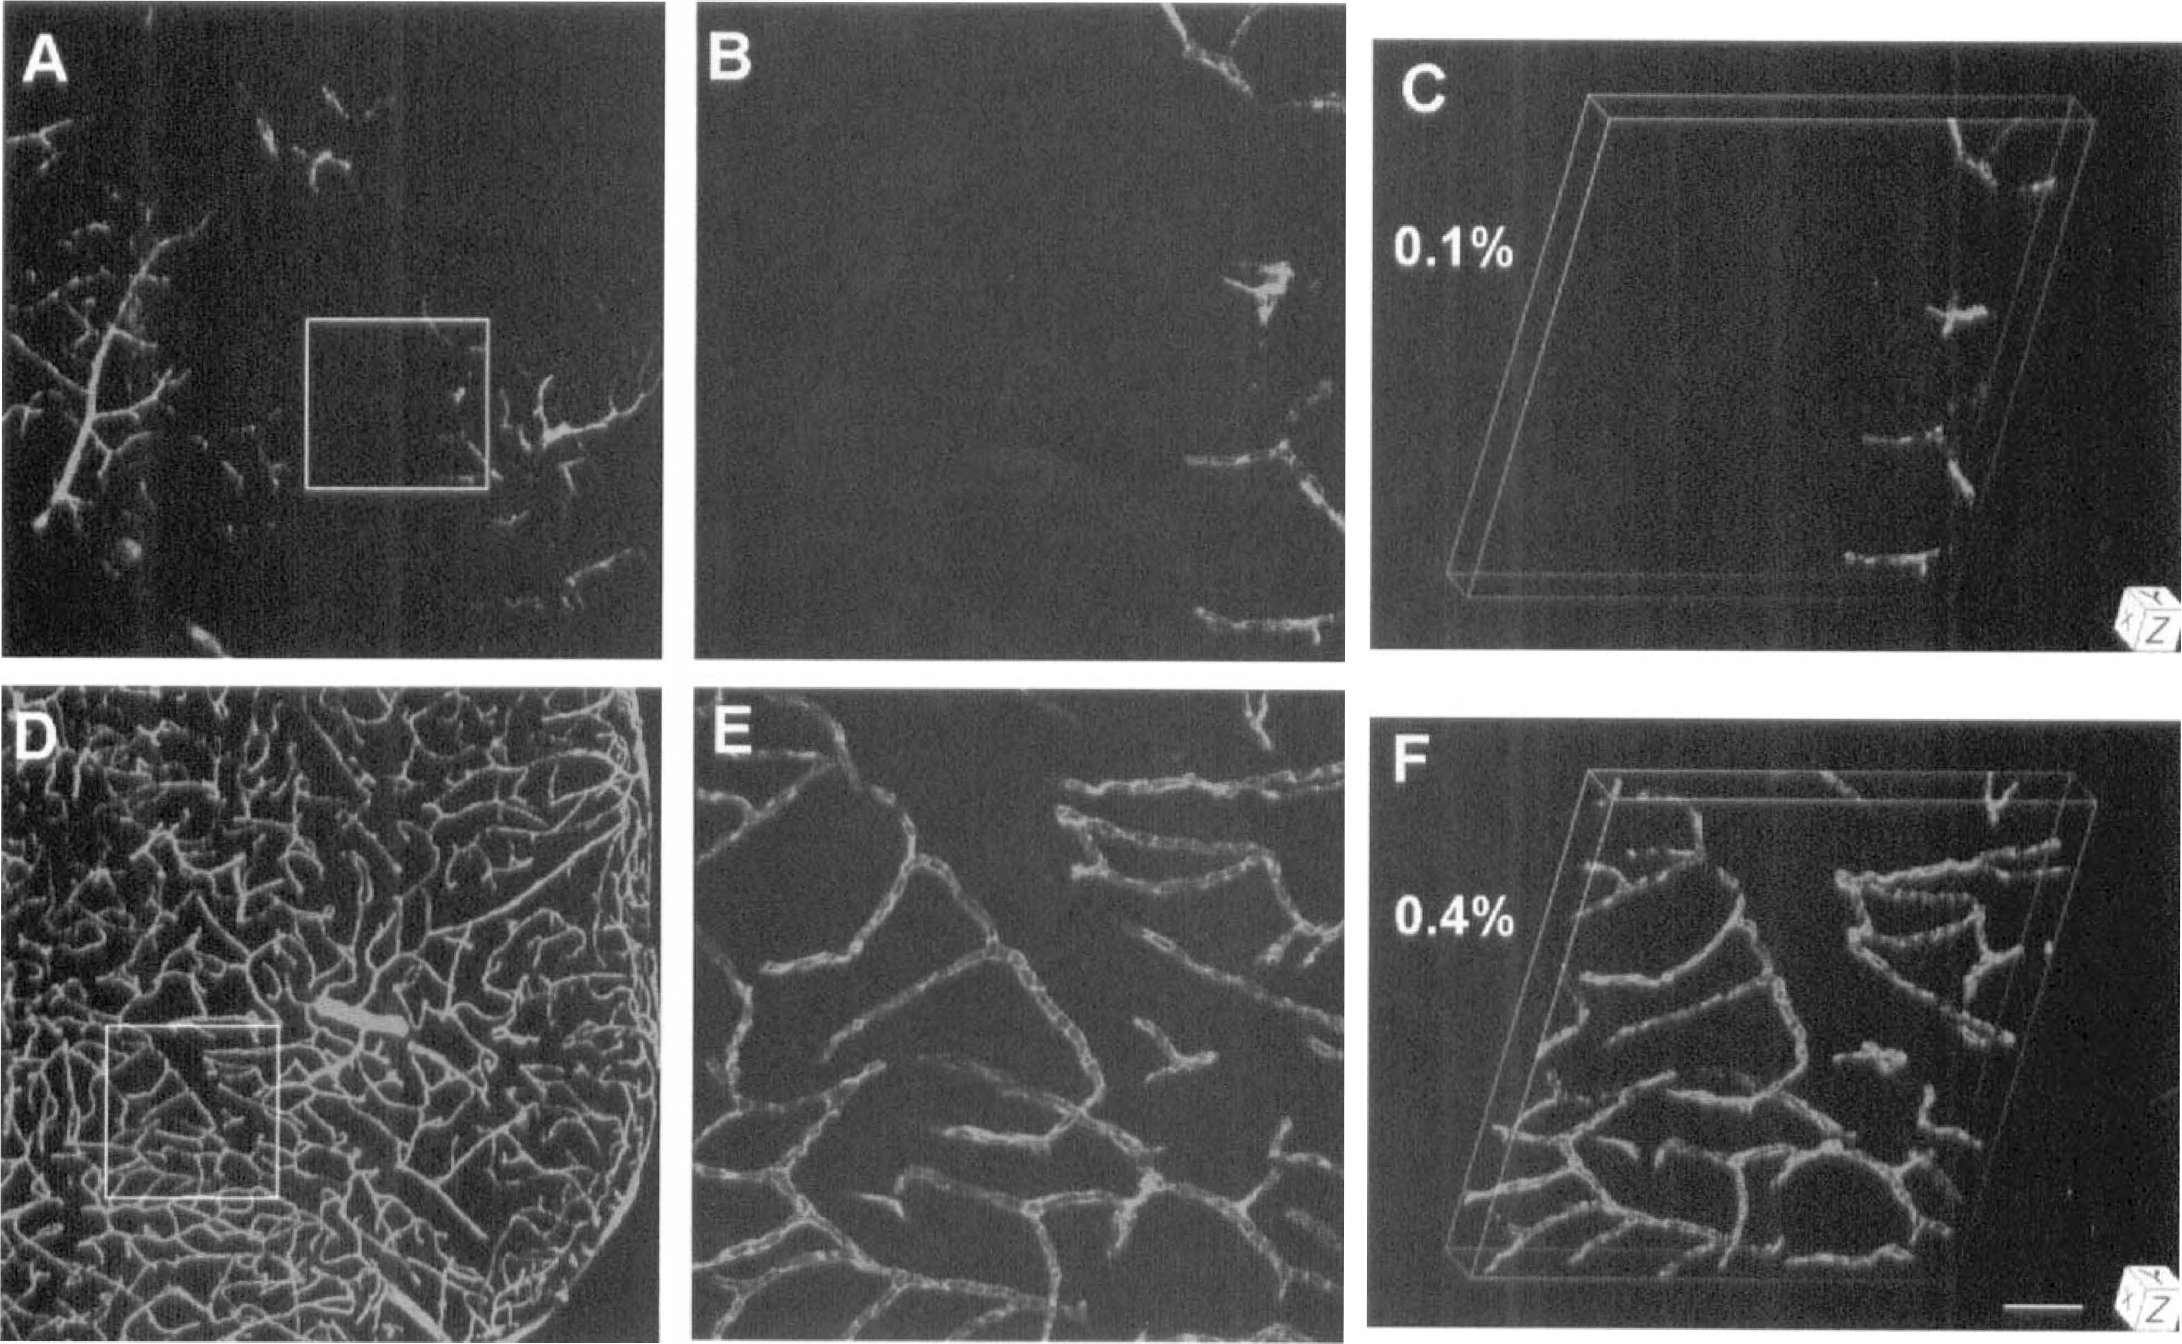
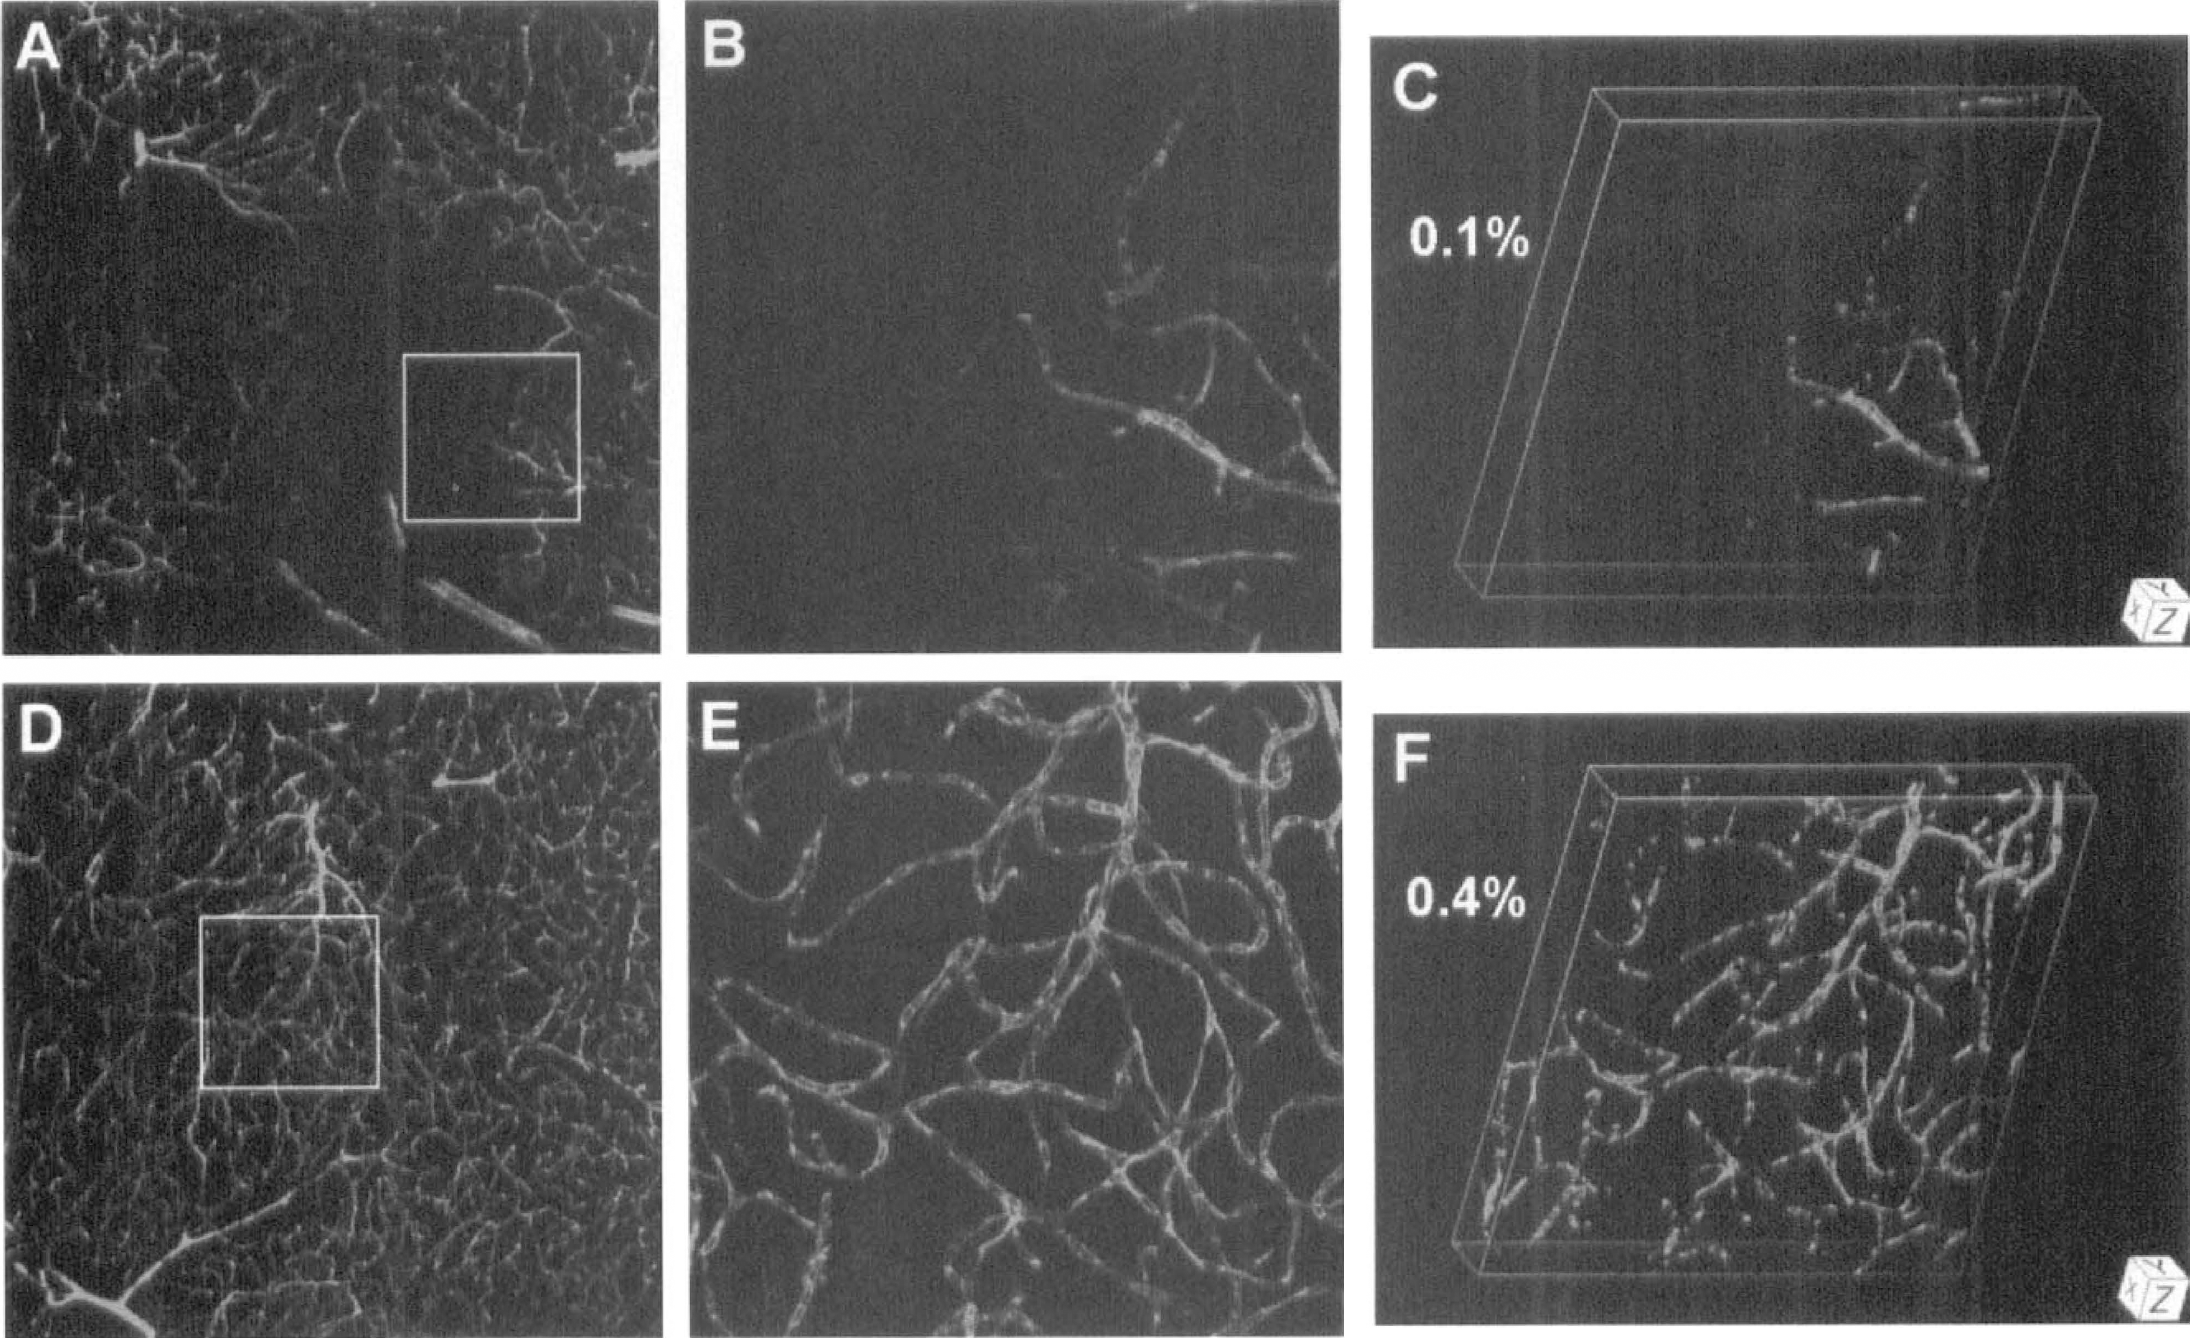
In the ipsilateral cortex and striatum of the ischemic animals, plasma patterns were different than those of controls and of the contralateral side and were characterized by large areas of little or no FITC-dextran (Figs. 2 and 3) and Evans blue (Fig. 4) fluorescence. Clearly indicating unperfused and underperfused tissue, the mean plasma volumes on the ipsilateral side were less than 20% of those on the contralateral side and in controls (Table 1). The differences in plasma marker volumes between ipsilateral and contralateral sides after 1 hour of occlusion and between ipsilateral side and control were significant (P < 0.05). As viewed at high magnification, plasma flow often seemed to terminate abruptly within capillaries on the ipsilateral side, suggesting highly localized blockage (Figs. 2B, 3B and 4B).
Three-dimensional reconstructions of plasma perfusion in capillary networks of the ipsilateral (panels
Three-dimensional reconstructions of plasma perfusion in capillary networks of the ipsilateral (panels
Three-dimensional reconstructions of plasma perfusion in capillary networks of the ipsilateral (panels
Showing differential subcellular distribution, MAP2 immunoreactivity in control mice and in the contralateral hemisphere was prominent and organized in bundles within most apical dendrites but was only faintly visible in neuronal perikarya (Fig. 5D). In the contralateral hemisphere, the distribution volumes were normal for FITC-dextran (Fig. 5E) and MAP2-fluorescence (Fig. 5F).
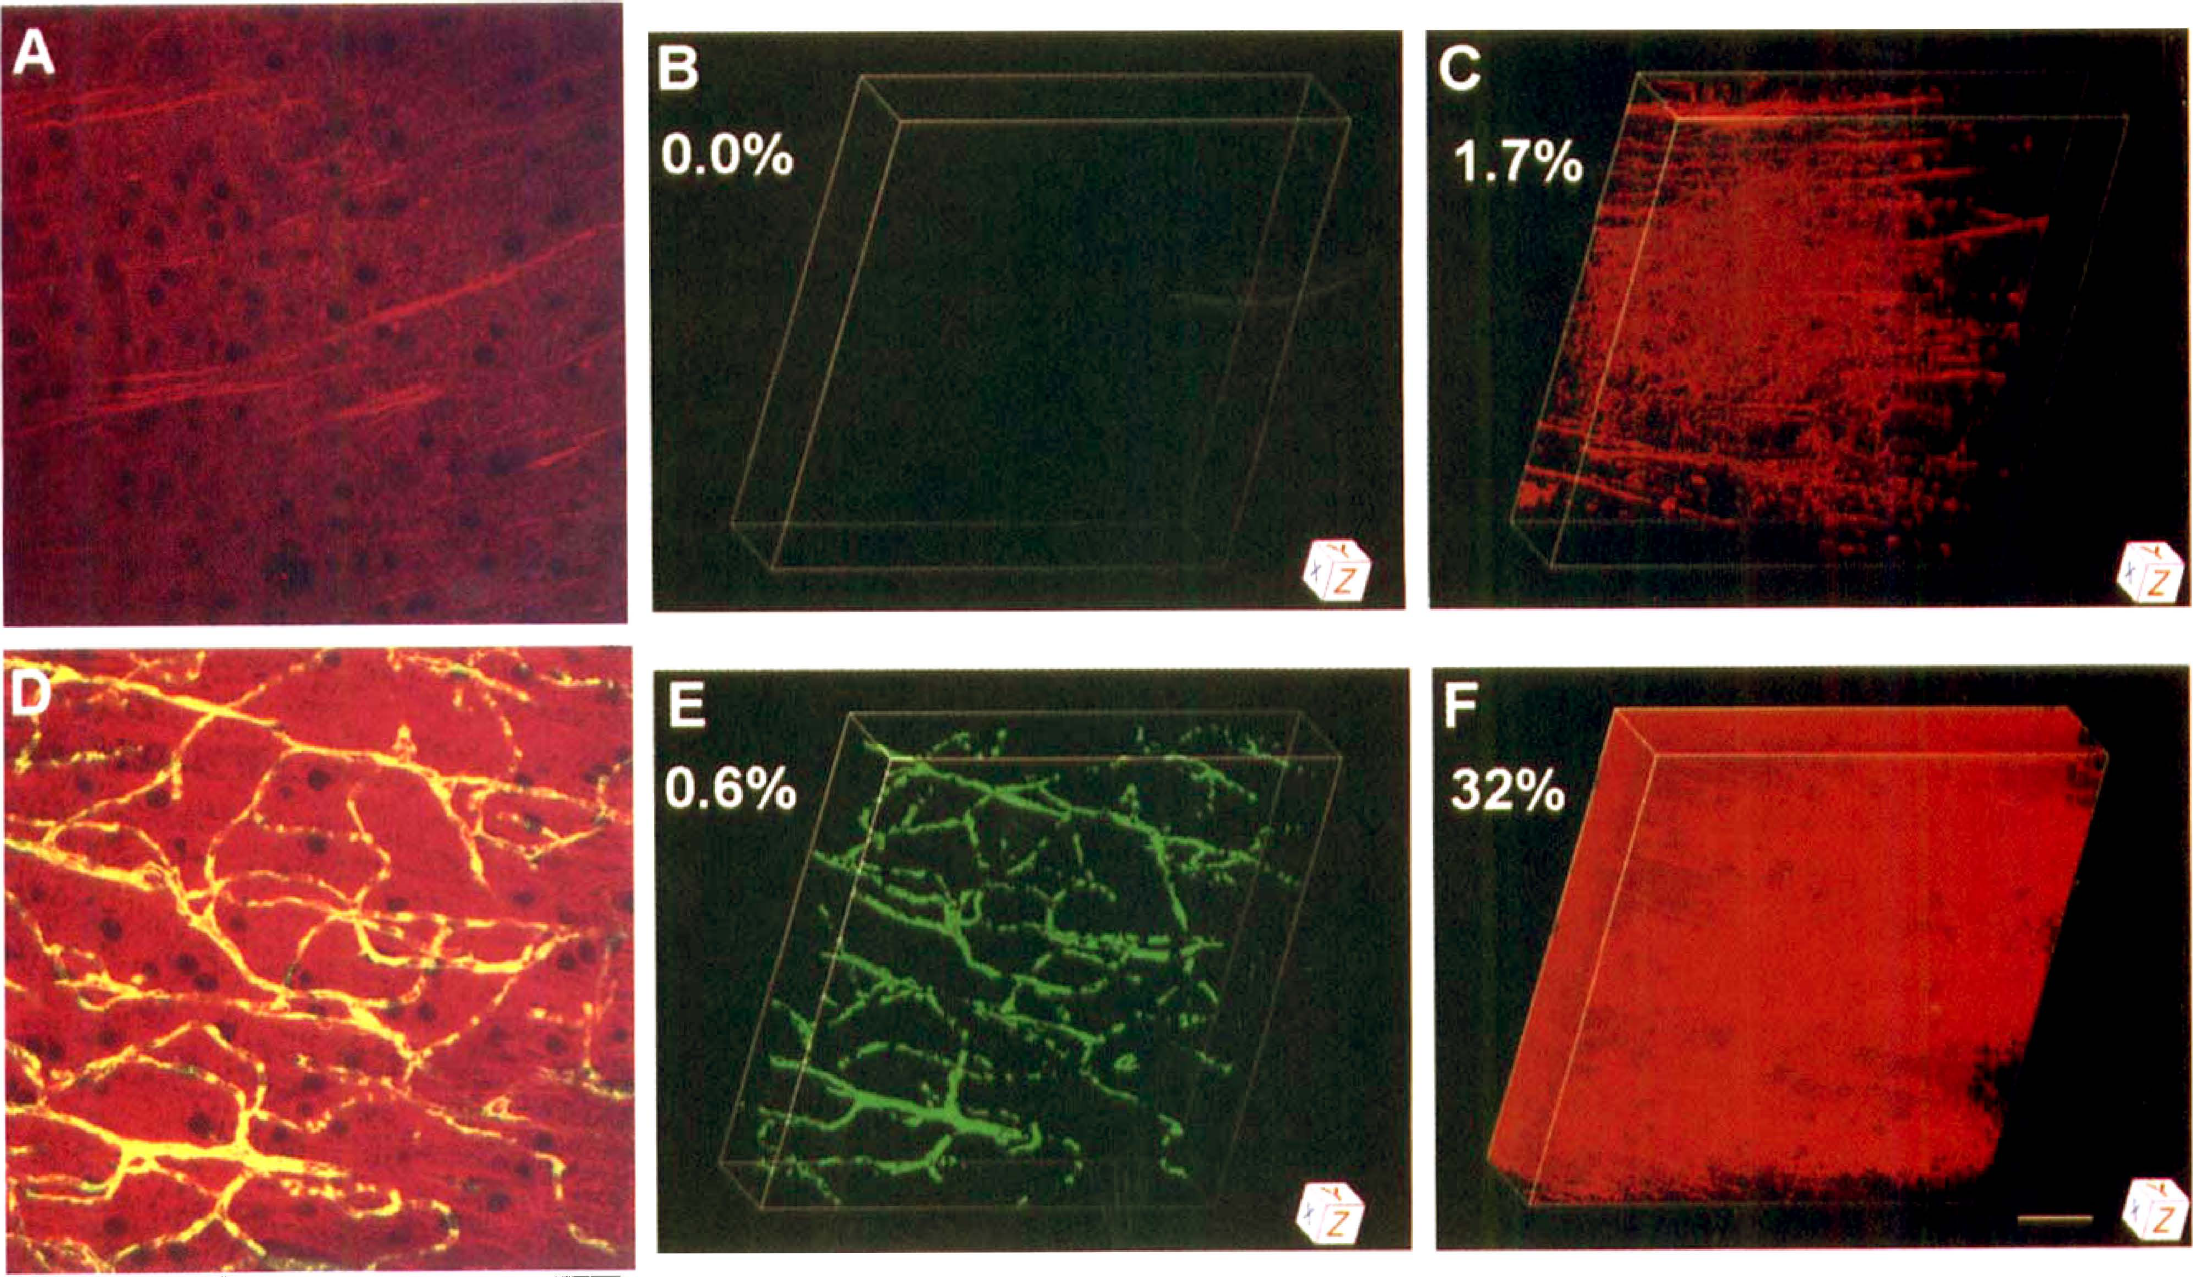
Three-dimensional images of FITC-dextran distribution (plasma perfusion) and microtubule-associated protein-2 (MAP2) immunoreactivity derived from the somatosensory cortex 1 hour after unilateral MCA occlusion. Panels
As for the ipsilateral cortex 1 hour after injection of the embolus, MAP2 immunoreactivity was broken up or discontinuous (Fig. 5A) and very faint (Fig. 5C) in areas unlabeled by FITC-dextran (Fig. 5B) and unperfused by plasma. Changes of MAP2 immunoreactivity in areas of no FITC-dextran were also detected in the ischemic striatum. Both mean FITC-dextran and mean MAP2 volumes were very low on the ipsilateral side of ischemic mice; the ipsilateral-contralateral differences in MAP2 immunoreactivity and in FITC-dextran-labeled plasma were significant for the cortex and striatum (P < 0.05; Fig. 6).
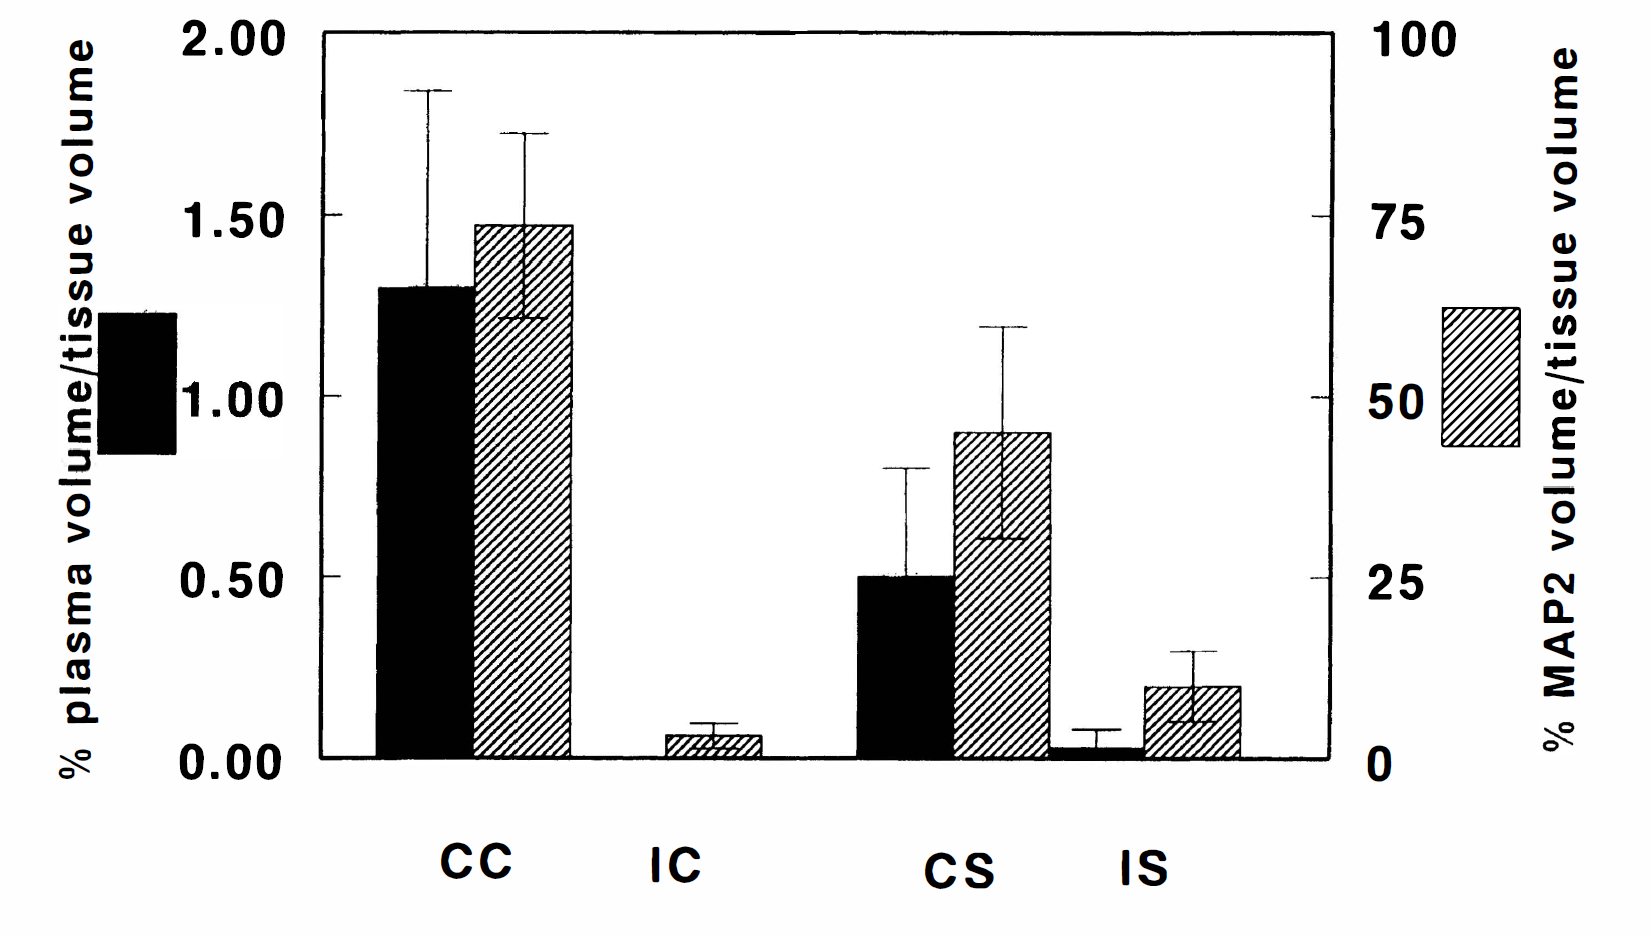
Mean (± SD) volume percentages of MAP2 immunoreactivity and plasma perfusion in mice subjected to 1 hour of embolic MCA occlusion for the contralateral and ipsilateral cortex (CC and IC, respectively) and the contralateral and ipsilateral striatum (CS and IS, respectively). The volumes of perfused capillaries and MAP2 immunoreactivity were significantly lower on the ipsilateral side vis-a-vis the contralateral homologous areas (P < 0.05).
DISCUSSION
Three-dimensional morphometric analysis
Three-dimensional images produced by the LSCM are actually composite renditions created by superimposing all of individual z-axis images onto one compressed picture. Although this LSCM rendition shows a surface view of the three-dimensional structure, it does not compensate for overlapping structures, and direct volume measurements from such a composite picture are inaccurate. For example, consider two identically sized blood vessels, one traveling horizontally and one directed vertically in the tissue block. In a LSCM-produced composite image, the horizontally directed vessel appears as a long cylinder, whereas the vertically directed vessel is seen as a small circle. Even though the vessels are iden tical in diameter and length, their volumes would be calculated to be different from the LSCM image.
To avoid the errors produced by a single composite image, an MCID system was used to calculate tissue volumes. Each individual z-axis LSCM section was imported into the MCID system as a single 256-gray-scale, TIF-formatted image. The pixels from each LSCM image were converted to cubic voxels by applying a linear intensity interpolation to create the missing pixels between the sections. Segmentation of relevant features from the background was performed by density threshold automatic detection techniques. To calculate structural data, the MCID system used a volume interpolation algorithm that counts every surface-connected voxel within the structure. Measurements were based on complete voxel counts and not cross-sample estimations. Visualization of the complete structure was accomplished by surface rendering (Udupa and Herman, 1991), in which the object surface is made up from the surfaces of boundary voxels.
Plasma volume measurement of a structure is by definition an all or none determination and does not, therefore, take into consideration the intensity of the fluorescent marker. Although all the z-axis image files produced include 256-gray-level data, a single gray level must be picked and all pixels greater than that level included in the volume; of course this procedure excludes from the volume measurement all pixels with a value less than the cutoff gray level. To determine the proper gray scale cutoff for this experiment, 256 images were produced, each representing a different gray scale cutoff value between 0 and 255. Each image was simultaneously compared with the LSCM image, and the gray scale cutoff that produced the best rendition was used. In the case of FITC-dextran, the gray scale cutoff was 60. That is, if a voxel had a gray scale value of 60 or greater, it was included in the volume measurement.
Quantification of laser-scanning confocal microscopic data
Laser-scanning confocal microscopy optically sections tissue samples by a scanning laser beam. In the past this approach has been used to produce pictures of fluorescence and qualitative distributional results but, to the best of our knowledge, little or no quantitative data (Villringer et al., 1994; Lindsberg et al., 1997). By processing three-dimensional, LSCM-derived data with a three-dimensional morphometry system developed for serial histologic data, we were able to estimate volumes of fluorescence in minute brain tissue volumes. It is possible that similar studies may be performed using a conventional fluorescence microscope combined with a deconvolution algorithm.
To date we have been able to quantitate the volumes of fluorescence of both two (present study) and three emissions of differing wave lengths in the same tissue sample. This capability allows the colocalization of two or three markers in tiny volumes of normal and perturbed brain tissue and the assessment of the proximity and possible linkage between or among them on a microscopic scale. Although they can be evaluated as indicated above, the intensity of the emission per pixel and the amount of the fluorescently tagged material per unit tissue volume were not included in the data presented.
Plasma markers and their circulation times
High-molecular-weight FITC-dextran was selected as a plasma marker because of its large size (2 million molecular weight and 27 nm in effective diffusional diameter) and previous usage as an intravascular marker (D'Amato et al., 1993; Wesolowski and Smith, 1994). Moreover, FITC-dextran remains free and in solution in plasma water, does not bind to or enter blood cells, and does not diffuse across the normal blood-brain barrier (BBB) nor out of brain capillaries at an early stage of cerebral ischemia (Hultstrom et al., 1983; D'Amato et al., 1993).
In contrast, on entering the blood stream, Evans blue combines rapidly and essentially completely to albumin, which has a molecular weight of 68,000 Da and an effective diffusional diameter of 15 nm (Gobel et al., 1990). Because albumin is lipid-insoluble and does not cross the intact BBB, Evans blue-tagged albumin is often used as an indicator of BBB opening during and after stress, albeit usually in a nonquantitative way (Vinores, 1995). With modest opening of the BBB, Evans blue-tagged albumin, because of its smaller size, would be expected to diffuse from blood to brain more rapidly than FITC-dextran (Hultstrom et al., 1983; Vinores, 1995; Belayev et al., 1996). If the BBB opens extensively and edema fluid is being formed at an appreciable rate, then both plasma markers may, however, pass from blood to brain at similar rates. In the present experiments, the short circulation time, 1.0 minute, optimized the demarcation of the plasma volume in the microvessels but precluded the accurate assessment of BBB opening and edema fluid formation.
The selection of a circulation time of 1 minute was based on previous studies (Gobel et al., 1990; Villringer et al., 1994). In normal, awake rats, intravascularly injected red cells and radiolabeled albumin rapidly mix throughout the circulatory system and reach a steady-state of distribution in brain microvessels within 15 seconds (Tajima et al., 1992). In an in vivo LSCM study with rats, the capillary bed demarcated 20 seconds after sodium fluorescein (which binds to albumin) injection was identical to that visible 10 minutes later (Villringer et al., 1994). Virtually all capillaries within rat brain were found to be filled with Evans blue within 5 seconds of intravenous injection (Gobel et al., 1990; Theilen and Kuschinsky, 1992). A 1-minute circulation time for control and ischemic mice would, thus, seem to be sufficient for Evans blue-albumin and FITC-dextran to mix throughout the vascular system and label all cerebral microvessels that are effectively plasma-perfused.
Artifacts and the loss of plasma tracers from fixed tissue
The large dark or blank spots within the three-dimensional images from the ischemic hemisphere could have been the result of tracer loss during the course of tissue processing for LSCM analysis. We have explored the trapping of plasma and plasma markers in cerebral capillaries in several studies including the present one. Bereczki et al. (1992) found that freezing the brain either within the decapitated head or after rapid but careful removal from the head effectively trapped the blood in the small parenchymal microvessels (apparently all those with luminal diameters less than 50 μm). Our preliminary studies with the freezing approach indicated, however, small streaks of low-level staining adjacent to the microvessels. Such movement of Evans blue and FITC-dextran out of the microvessels and into the parenchyma of frozen coronal sections does not, of course, represent loss from the tissue but was troubling for clear capillary viewing and quantifying plasma labeling. Since we had demonstrated earlier (Tajima et al., 1992) that immersion fixation appears to trap red cells and plasma proteins in small parenchymal microvessels in rat brain, immersion fixation in paraformaldehyde was subsequently tried. It was anticipated that immersion fixation with paraformaldehyde would be less likely to trap FITC-dextran than Evans blue-labeled albumin because dextrans are water-soluble and difficult to immobilize with fixatives (Hultström and Svensjo, 1979; Hultstrom et al., 1983). There were, however, no signs of extravasation of either plasma tracer in all brain tissue examined; microvascular trees were well preserved and could be traced with ease from the surface into the deeper tissue in the three-dimensional images of control mice and the contralateral side of ischemic mice.
Comparisons of these volume data with those from other studies obtained using other techniques suggest that plasma markers are highly retained with immersion fixation. In normal and hypertensive rats, the luminal or whole blood volumes of the small microvessels (assumed to be capillaries) were assessed on perfusion-fixed tissues and were reported to be about 1.3% for the parietal cortex and 1.0% for the striatum (caudate-putamen and globus pallidus) (Gesztelyi et al., 1993). Assuming microhematocrits of around 30% (Bereczki et al., 1992), these morphometric results suggest plasma volumes of about 0.9% and 0.7%, respectively, in fair agreement with the plasma volume data listed for controls in Table 1, 0.75% to 0.78% for the cortex and 0.55% to 0.59% for the striatum. In experiments with 125I-labeled serum albumin in awake rats, the plasma distribution spaces ranged from 0.74% to 0.8% for several cortical regions and 0.45% to 0.66% for the various parts of the striatum (Bereczki et al., 1992). In summary, immersion fixation yields reasonable estimates of capillary plasma volume in brain tissue, and the differences in these volumes between cortex and striatum are consistent with the findings of others. However, we cannot rule out the possibility that the lack of FITC-dextran in the ischemic areas may be caused by an amount of fluorescent label below the detection threshold of the system used in the present study.
Reduced capillary perfusion after MCA occlusion
One hour of MCA occlusion resulted in a significant reduction of perfused capillaries in the ischemic territory of mouse brain. The perfusion deficits, demonstrated relative to control and corresponding homologous areas from the contralateral hemisphere, were detected by two different fluorescent markers and were limited to the areas served by the MCA. Some investigators have made similar observations, but others have conflicting results.
Theodore et al. (1990) reported for monkeys that 30 minutes of MCA occlusion reduced the number of perfused capillaries by 70%. Since perfused capillaries were stained by a postmortem transcardial injection of carbon or India ink in gelatin, the postmortem perfusion method may not detect all capillaries perfused in vivo. Using a method involving intravenous injection of FITC-dextran and subsequently staining histologic sections for all capillaries, Weiss and colleagues found in rats that 50% to 60% of capillaries were not perfused in the ischemic regions 1 hour after MCA occlusion (Weiss, 1988; Weiss et al., 1982; Buchweitz-Milton and Weiss, 1988). Ennis et al. (1990) demonstrated with intravenously administered FITC-albumin that the number of perfused capillaries was lowered by 54% after 3 hours of occlusion of one common carotid artery in gerbils. In contrast, Kuschinsky and colleagues reported in experiments with rats and Evans blue injection that the drastic reduction of CBF 1 hour after MCA occlusion was not accompanied by a corresponding drop in the number of plasma-perfused capillaries (Gobel et al., 1990; Theilen et al., 1994). These contradictory findings are likely to be related, in part, to differences in (1) fluorescent tracers used (FITC-dextran, FITC-albumin, and Evans blue); (2) methods of tissue fixation (alcohol impregnation versus air drying); (3) counterstaining procedures for demarcating the existing capillaries (alkaline phosphatase versus fibronectin); and (4) durations and models of ischemia.
In the present study, there were some capillaries or capillary segments that were still perfused in the areas supplied by the occluded MCA. Suggestive of intracapillary blockage in addition to MCA occlusion, plasma appeared to flow up to a point and then abruptly stop in these instances (Figs. 2A, B, 3A, B, and 4A, B). Since the proximal MCA was occluded by a clot, fragments of the clot may be formed by endogenous thrombolysis and enter the arterial-arteriolar tree and the associated capillary network downstream from the MCA. Because the time (1 hour) was too short for endogenous thrombolysis, intraluminal plugging by clot fragments is an unlikely explanation for this capillary blockage. Platelet aggregation and leukocyte adhesion have been implicated in the development of perfusion deficits (Kochanek and Hallenbeck, 1992). Since astrocytic foot processes envelop more than 95% of the abluminal surface of the capillaries, perivascular glial swelling may compress capillaries and cause microcirculation obstruction (Little et al., 1975; Pardridge, 1997). Finally, blood elements may accumulate in the microvessels after acute embolic MCA occlusion, and the coagulation system of platelets and endothelial cell surfaces within low-to-nil flow microvessels may change from an anticoagulation to a procoagulation state. We suggest that the latter change plus parenchymal cell swelling, primarily that of astrocytes, shut off plasma flow and exacerbated the primary perfusion deficit.
Our quantitative analysis of FITC-dextran density and MAP2 immunoreactivity shows that a significant reduction in FITC-dextran density coincided with a sizable diminution in MAP2 immunoreactivity. Incidentally, such a reduction in MAP2 immunoreactivity was only detected in unperfused areas. Microtubule-associated protein-2 was selected for study because of its sensitivity to ischemic insult (Kitagawa et al., 1989; Dawson and Hallenbeck, 1996; Pettigrew et al., 1996) and its common use as a marker of neuronal injury (Tucker, 1990). Our finding of MAP2 loss after MCA occlusion is consistent with previous reports that 15 to 60 minutes of focal and global cerebral ischemia results in reductions in MAP2 levels (Kitagawa et., 1989; Inuzuka et al., 1990; Yanagihara et al., 1990; Dawson and Hallenbeck, 1996). Therefore, our results imply that neuronal damage is spatially linked to local microvascular obstruction and flow.
In summary, three-dimensional measurement of perfused capillaries using LSCM demonstrates that acute MCA occlusion results in a significant capillary perfusion deficit in the ipsilateral hemisphere and that MAP2 immunoreactivity drops sizably in such unperfused areas. In addition, our results demonstrate that the LSCM method of simultaneous quantitative analysis of FITC-dextran density and MAP2 immunoreactivity can be applied to study the relationship in three dimensions between cerebral microvascular network function and parenchymal cell activity.
Footnotes
Acknowledgements
The authors thank Denice Janus for manuscript preparation.