
Abstract
A new method for studying brain microcirculation is described, Both fluorescently labeled erythrocytes and plasma were visualized on-line through a closed cranial window in anesthetized rats, using laser-scanning two-dimension confocal microscopy, Video images of capillaries, arterioles, and venules were digitized off-line to measure microvessel diameter and labeled erythrocyte flow and velocity in parenchymal capillaries up to 200 μm beneath the brain surface, The method was used to analyze the rapid adaptation of microcirculation to a brief decrease in perfusion pressure, Twenty-second periods of forebrain ischemia were induced using the four-vessel occlusion model in eight rats, EEG, arterial blood pressure, and body temperature were continuously controlled, In all conditions, labeled erythrocyte flow and velocity were both very heterogeneous in capillaries, During ischemia, capillary perfusion was close to 0, but a low blood flow persisted in arterioles and venules, while EEG was flattening, The arteriole and venule diameter did not significantly change, At the unclamping of carotid arteries, there was an instantaneous increase (by about 150%) of arteriole diameter. Capillary erythrocyte flow and velocity increased within 5 seconds, up to, respectively, 346 ± 229% and 233 ± 156% of their basal value, No capillary recruitment of erythrocytes was detected, All variables returned to their basal levels within less than 100 seconds after declamping, The data are discussed in terms of a possible involvement of shear stress in the reperfusion period.
Keywords
The regulatory mechanisms of cerebral microcirculation have not yet been entirely elucidated (Villringer and Dirnagl, 1995). Metabolic, neurogenic, endothelial, and myogenic factors are putative mediators of the local regulation of CBF, but their respective roles in the CBF changes under physiologic and pathologic conditions remain to be determined. The hemodynamic processes, in terms of vasoreactive segments, capillary recruitment, blood cell velocity and flow, underlying adaptive changes in cerebral microcirculation are also still a matter of debate.
To further investigate the microcirculation within the brain parenchyma, we developed a new method enabling us to study the rapid phenomena that occur in various segments of the microvascular tree in vivo. Our original approach was based on the use of a confocal microscope with high-speed resolution in two dimensions combined with fluorescently labeled erythrocytes and plasma. This approach is an advance on the investigation of capillary blood flow using one-dimensional confocal microscopy on a single capillary (Dirnagl et al, 1991), and epifluorescent microscopy of a capillary network (Hudetz et al, 1992).
To show the interest of this new approach, we studied the microcirculatory events occurring in the rat neocortex during very brief transient global circulatory arrests. These experiments were performed to determine the microvascular consequences of an extreme decrease in perfusion pressure and to evaluate the dynamic changes in erythrocyte velocity and flow, and in microvessel diameter during the post-ischemic reperfusion period, in order to better understand how CBF is regulated at the microvascular level.
MATERIALS AND METHODS
All experimental procedures were performed in accordance with the National Institute of Health guide for the care and use of laboratory animals. Experiments were performed under permit No. 02934 from the French Ministry of Agriculture.
Experimental protocol
Eight male Wistar rats weighing 280 to 330 g (Iffa-Credo) were used in this study. They had access to food and water ad libitum and were housed in individual cages.
Animal preparation. The rats were prepared for transient global ischemia using the four-vessel occlusion model (Pulsinelli and Brierley, 1979). On the day before the experiment, they were anesthetized with sodium pentobarbital (50 mg/kg intraperitoneally) and placed in a stereotaxic frame (David Kopff). The skin and muscles over the first two cervical vertebrae were incised and separated from the midline. Both vertebral arteries were electrocauterized after exposition of the alar foramina under a surgical microscope (Zeiss).
On the day of the experiment, the rats were again anesthetized with sodium pentobarbital (thiopental, 50 mg/kg, intraperitoneally) and maintained with hourly injections (10 mg/kg). The bilateral common carotid arteries were isolated from surrounding tissues through a midline neck incision and silk ligatures were placed loosely around them. Arterial and venous catheters were placed into the femoral vessels to respectively measure arterial blood pressure (ABP), blood gases, and pH and to inject the fluorescent tracers.
The rats were then placed in a stereotaxic apparatus (David Kopf). The scalp and connective tissue were removed above the frontoparietal cortex. Silver electrodes were fixed to the cranial bone with dental cement to record the EEG. The cranial bone was thinned to translucency by means of a water-cooled dental drill. The thinned bone was carefully removed over an area of 10 mm2 and the dura mater was then lifted with the tip of an in-house tool. Small incisions in the dura enabled it to be reflected at the cranial window periphery. Any contact with the brain or any bleeding led to disposal of the animal under study. A 150-μm thick quartz microscope coverglass was cut to a size corresponding to the cranial window and was sealed to the bone by means of dental cement (Palaferm, Kulzer) to make the preparation waterproof.
Global ischemia. The rat was placed under a confocal microscope on a custom-built stereotaxic device closely fitting the confocal microscope stage. Electrodes were connected to a polygraph (ECEM) for continuous EEG recording. The arterial catheter was connected to a pressure transducer (Statham) for continuous recording of ABP (Gould). Arterial blood was regularly sampled to check blood gases and pH (Corning). Hematocrit was measured before and after injecting the tracers. Body temperature was kept at 37°C by a homeothermic blanket control unit (Harvard Apparatus) throughout the experiment.
Fluorescein isothiocyanate (FITC)—dextran diluted in 0.9% NaCl (2.5 mg/mL, i.e., about 0.7 mg/kg) was injected into the blood circulation to visualize microvessels and measure their diameter. FITC-labeled red blood cells (RBC) were injected via the same route at a tracer dose. They allowed direct counting of labeled erythrocytes in individual capillaries per unit time and measurement of their velocity.
Microvessels, including capillaries, were observed down to a depth of 200 μm beneath the surface of the brain. The capillaries analyzed in our measurements were located within 50 to 100 μm of the parenchyma. The actual thickness of optical slices in which the image was sharp enough for quantitative analysis was 10 μm with a ×40 objective. A region of interest (ROI) was defined to avoid large venules and focus on dense capillary networks with rather long straight segments. The microcirculation was video-recorded before, during, and after a 20-second arrest of the cerebral circulation. A control image of the ROI under basal conditions was stored and permanently exhibited on a television screen to permit the exact repositioning of the brain in case of some displacement.
Forebrain ischemia was induced under the microscope by occluding the common carotid arteries by tightening the silk sutures. The completeness of ischemia was confirmed by a flattened EEG, After 20 seconds of ischemia, reperfusion was performed under the microscope by releasing the silk sutures, This procedure was repeated twice in each rat at 20-minute intervals. Fluorescence confocal microscopy was used intermittently within these intervals to avoid any focal damage possibly due to persistent laser illumination.
Labeling of red blood cells
Fluorescein isothiocyanate Isomer I was used to label erythrocytes with a method modified from Sarelius and Duling (1982). Arterial blood (1 mL) obtained from a donor rat using a heparinated syringe was centrifuged at 2000 g/min for 7 minutes at 20°C. The supernatant was removed and the cells washed twice in phosphate-buffered saline containing ethylene diamine tetraacetic acid (EDTA) (10 g/L). The cells were incubated for 2 hours at room temperature in phosphate-buffered saline- and edetic acid-containing FITC (10 mg/mL), pH 8, removed by centrifugation and washed four times with phosphate-buffered saline and EDTA.
Confocal microscopy
A BioRad Viewscan confocal laser-scanning unit attached to a Nikon Optiphot-2 microscope was used. A home-made stage was adapted onto the microscope for positioning the animal. The scanning unit scanned 50 fields per second. The objective was either a Nikon dry lens (×10 magnification), or a Nikon water immersion lens (×20 and ×40 magnification). The numerical apertures were 0.40 and 0.55, and the working distances were 1.8 mm and 2.0 mm, respectively. The light source was an argon-krypton laser whose wavelengths were 488, 568, and 647 nm. An appropriate filter was used for fluorescence microscopy of fluorescein. Images were recorded at video speed, i.e., at 50 frames per second, with an SIT camera (Hamamatsu) and a PAL-VHS video recorder (Panasonic). Images were digitized and analyzed off-line to determine the vessel diameters and the number and velocity of erythrocytes in capillaries. Appropriate in-house software was developed in the Optimas environment (version 5.2, Bioscan, on a PC, Windows 3.11) for video monitoring, image digitization, semi-automated analysis, and calculations.
Measurement of labeled erythrocyte flow and velocity
The density profiles of labeled erythrocytes along capillary segments about 100 μm long (range, 50 to 120 μm) were recorded in successive digitized images, thus forming new images of the labeled erythrocyte trails along these segments, These new images were filtered and analyzed for automatic extraction of trails and measurement of their numbers and slopes. The numbers of trails were used to calculate flow, and their slopes to calculate velocity.
The data are presented in two ways: the mean changes with time and the frequency distribution of the flow and velocity values at different periods because of the great dispersion of measurements due to the heterogeneity of capillary flow. The mean changes with time are expressed as a percent of values at baseline. They were evaluated throughout the measurement period of 150 seconds. The mean of all velocity or flow values measured during a 20-second basal condition was taken as 100%.
The distribution frequency of flow and velocity values was computed for 20-second periods in four conditions: (1) at baseline, (2) during ischemia, β) in the hyperemic phase of reperfusion, and (4) during the recovery, i.e., at 90 seconds after common carotid arteries unclamping.
The labeled RBC velocity (mm/sec) was measured in 24 capillary segments in five rats. The numbers of velocity measurements reported in histograms were 96, 177, and 115 in basal, reperfusion, and recovery conditions, respectively.
The labeled RBC flow (number per second) was measured in 32 capillaries in seven rats. The numbers of flow measurements reported in histograms were 128, 111, and 108 in basal, reperfusion, and recovery conditions, respectively.
Labeled RBC velocity and flow were measured only on sharp contrast images, which explains the differing numbers of reported values.
Vessel diameter measurement
Regions of interest were selected from the video recording to include a rectilinear portion of a vessel. They were delimited by the investigator on the first image of a sequence, filtered, and the threshold set for automatic detection of vessel wall limits on successive digitized images. Successive internal diameters were then calculated. The mean value of each vessel diameter during the 20-second basal condition was taken as 100%. Mean diameters of arterioles (n = 17) and venules (n = 12) as a function of time are expressed as percentages of values at baseline. Arterioles were grouped according to their internal diameter: 11 to 45 μm (n = 13), 56 to 75 µm (n = 4), in order to distinguish third- and second-order arterioles.
The venules had internal diameters of 47 to 127 μm.
The distribution frequency of the arteriolar diameter was measured in eight rats under basal (n = 86), ischemic (n = 86), reperfusion (n = 86), and recovery (n = 68) conditions.
Materials
Fluorescein isothiocyanate-dextran (molecular weight 150,000) and FITC Isomer I were purchased from Sigma.
Professional video tapes (XG model, SVHS) were purchased from JVC.
Statistical analysis
The changes with time are expressed as mean ± SD. The mean basal value was calculated in all vessels. Statistical analysis was performed using nonparametric analysis of variance followed by Dunnett's test on ranks. The first value was taken as the control value. Distributions of labeled erythrocyte velocity and flow were compared by means of the chi-squared test.
Values of P < .05 were considered significant.
RESULTS
Basal conditions
All rats were in similar physiologic condition with mean values for physiologic parameters of: ABP =111 ± 8 mm Hg, Pa
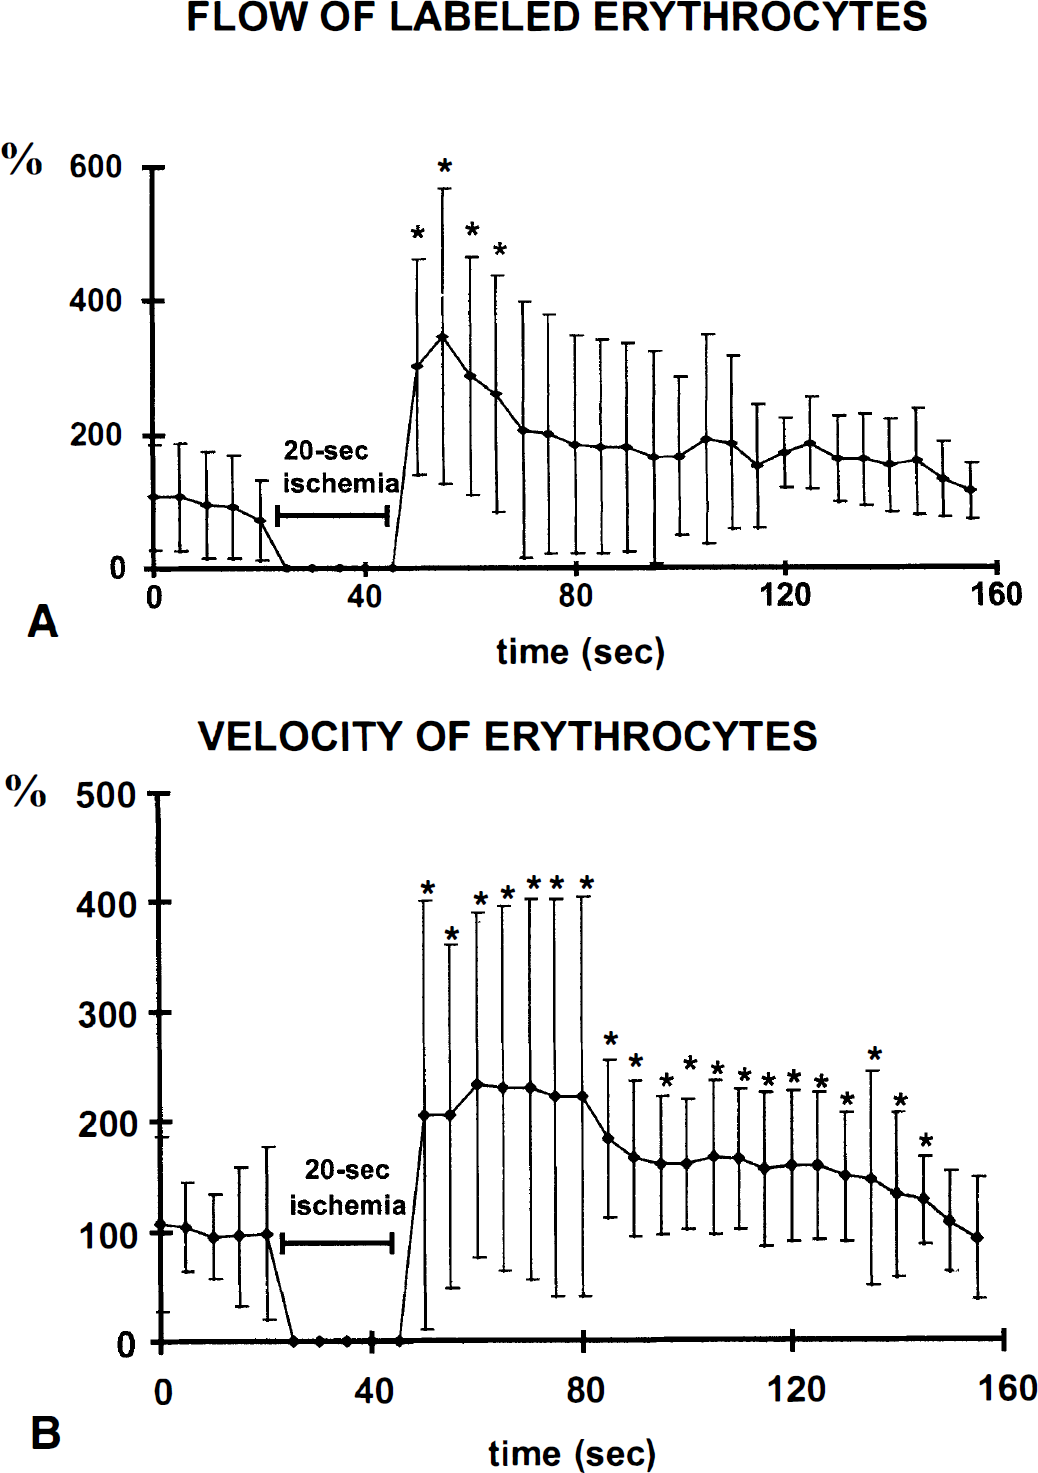
The mean labeled RBC (lRBC) flow in capillaries was 2.8 ± 2.4 IRBC/s and their velocity was 0.39 ± 0.27 mm/s. The flow and velocity of lRBC varied greatly, resulting in large SD (Fig. 1). The lRBC flow is only a fraction of the total RBC flow in the respective capillary because only a small number of RBC was labeled.
Changes in flow (
The distribution frequency of arteriole diameters under basal conditions shows the two groups of arterioles (Fig. 2).
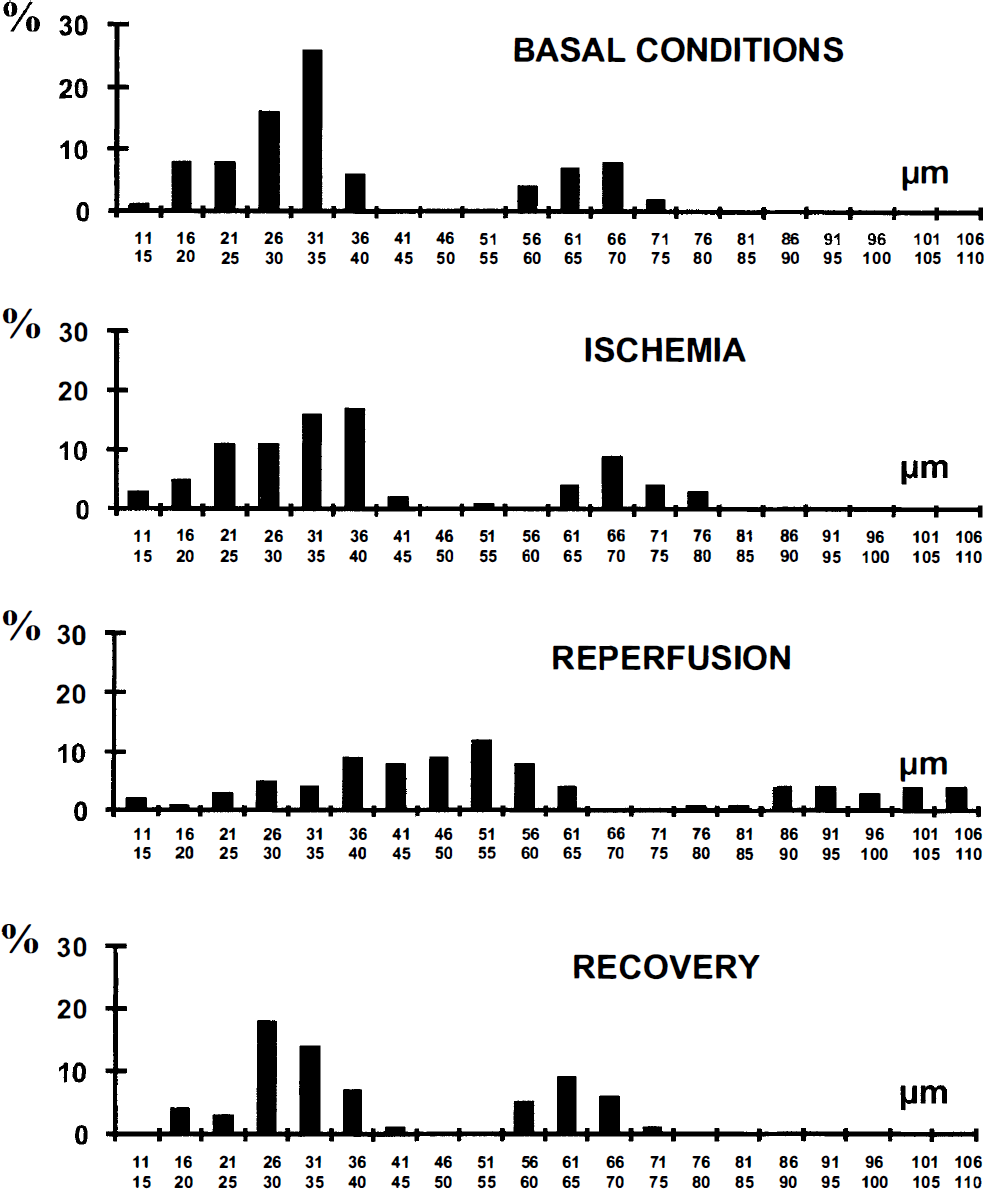
Frequency distribution histograms of arteriole diameters at the same periods of interest as in Fig. 4.
Ischemic conditions
Mean ABP significantly increased by 25 ± 5% during ischemia and returned to its basal level as soon as the carotid sutures were released. In all rats, the EEG became flat at the end of each ischemic episode.
There was a very low persistent blood flow in all arterioles and venules throughout each ischemic episode, whereas the capillary lRBC flow and velocity became too low to be measured, close to O. The diameters of the arterioles and venules did not change significantly (Fig. 3), and there was no significant change in the distribution frequency of arteriole diameters throughout the period of ischemia (Fig. 2).
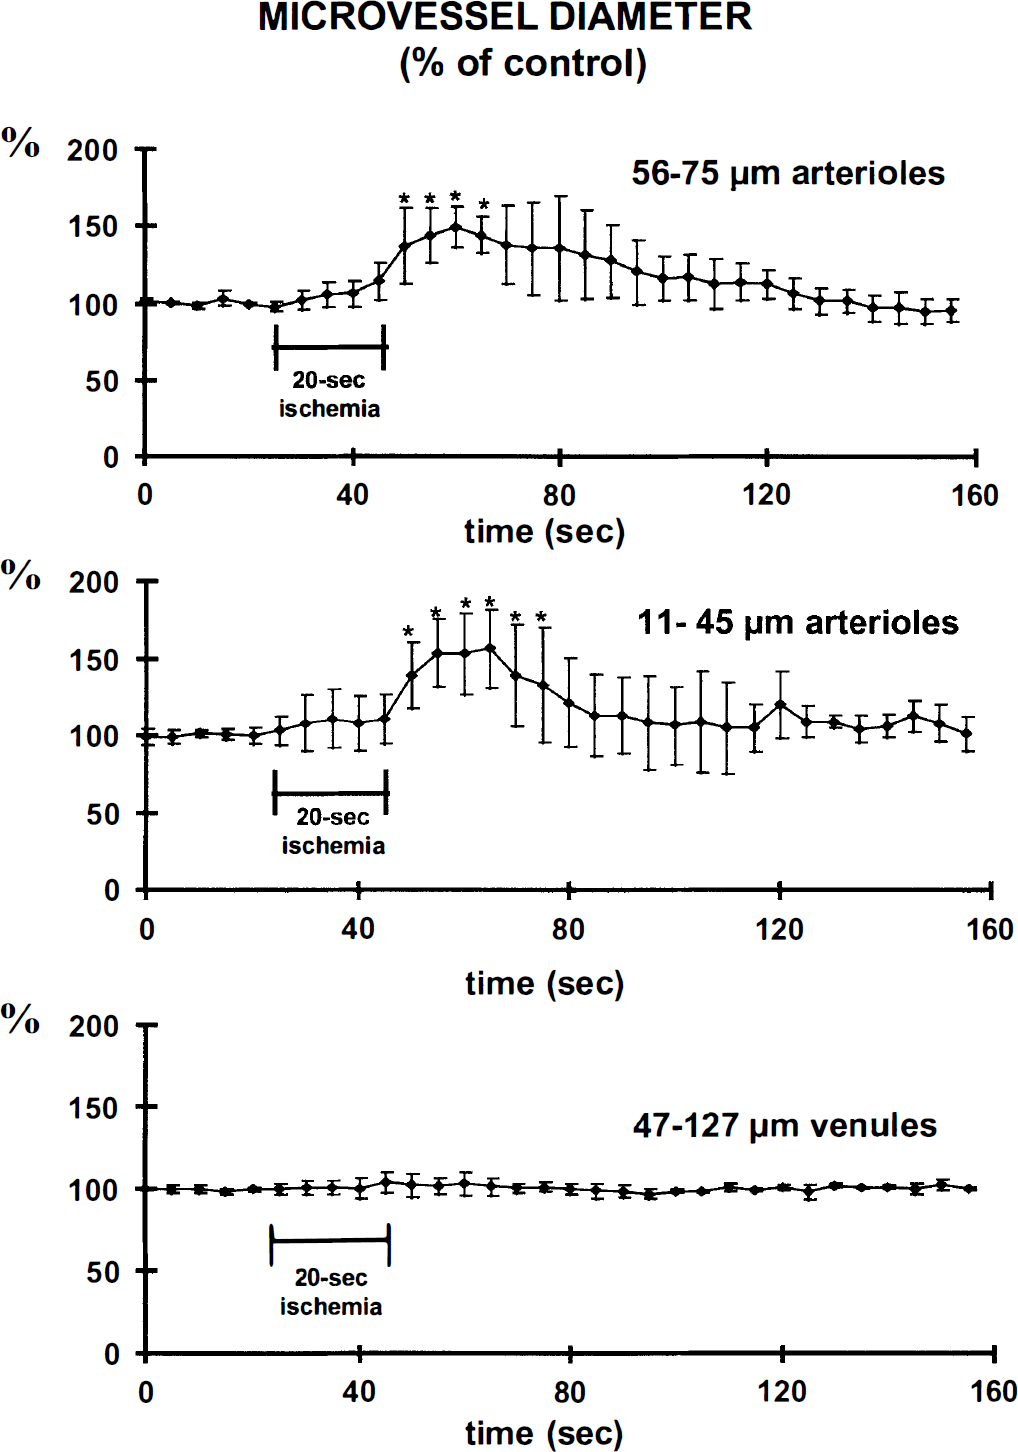
Changes in arteriole and venule diameter expressed as percent of basal values (*P < .05 analysis of variance and Dunnett's test on ranks).
Reperfusion
There were very high blood flows in both arterioles and venules as soon as the carotid clamps were released, whereas capillary lRBC flow and velocity significantly increased within 5 seconds. No newly perfused capillaries were observed. The increase in capillary lRBC flow was significant for 20 seconds, whereas the increase in capillary lRBC velocity was significant for 95 seconds (Fig. 1). The maximal increase in capillary lRBC was 346 ± 229% (from 2.8 ± 2.4 lRBC/s in basal conditions to 9.8 ± 6.5 lRBC/s during hyperemia) and the increase in velocity 233 ± 156% (from 0.4 ± 0.2 to 0.9 ± 0.6 mm/s). The distribution frequencies of lRBC flow and velocity during the reperfusion were significantly different from those measured in basal conditions, indicating a dynamic change towards high values (Figs. 4 and 5). The arteriole diameters increased with the increases in lRBC flow and velocity. The extent of the increase was independent of the basal diameter, about 150% for both mean diameters studied. The significant increase persisted for 15 seconds in 56- to 75-μm arterioles and for 25 seconds in those of 11- to 45-μm diameter (Fig. 3), attaining maximal values of 148 ± 13 and 156 ± 25%, respectively. These maximal values were not reached instantaneously, but at least 10 seconds after the declamping. The venule diameters were not significantly altered at any phase of the reperfusion (Fig. 3).
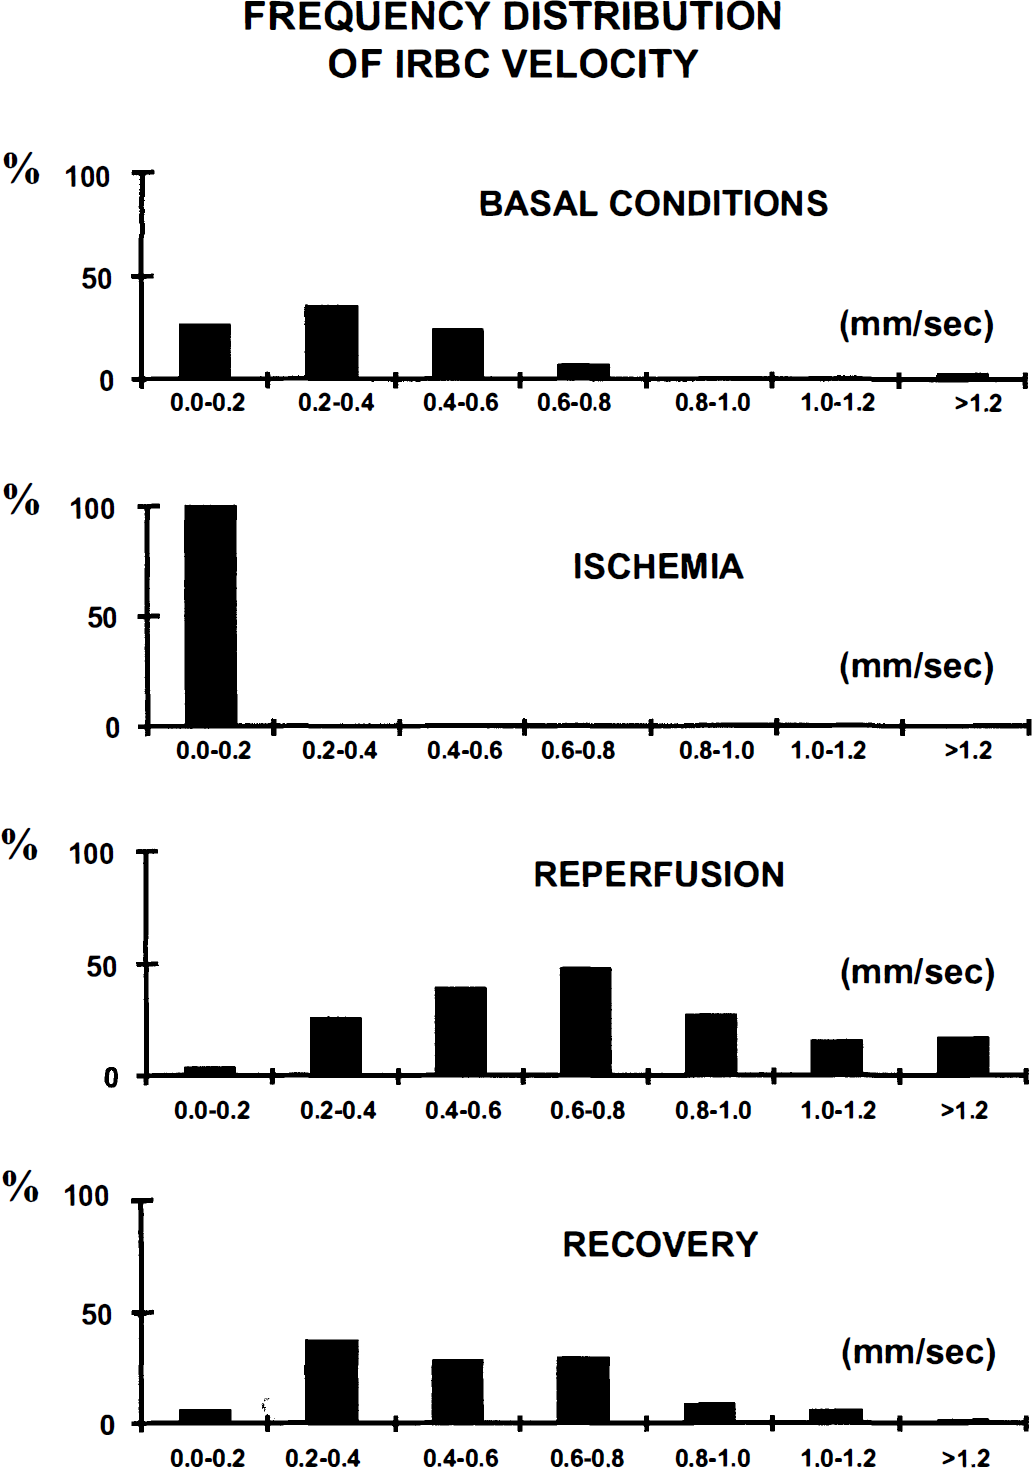
Frequency distribution histograms of labeled RBC velocity in capillaries under basal conditions, during 20 seconds of forebrain ischemia, during the reperfusion following the common carotid arteries unclamping and during the recovery period.
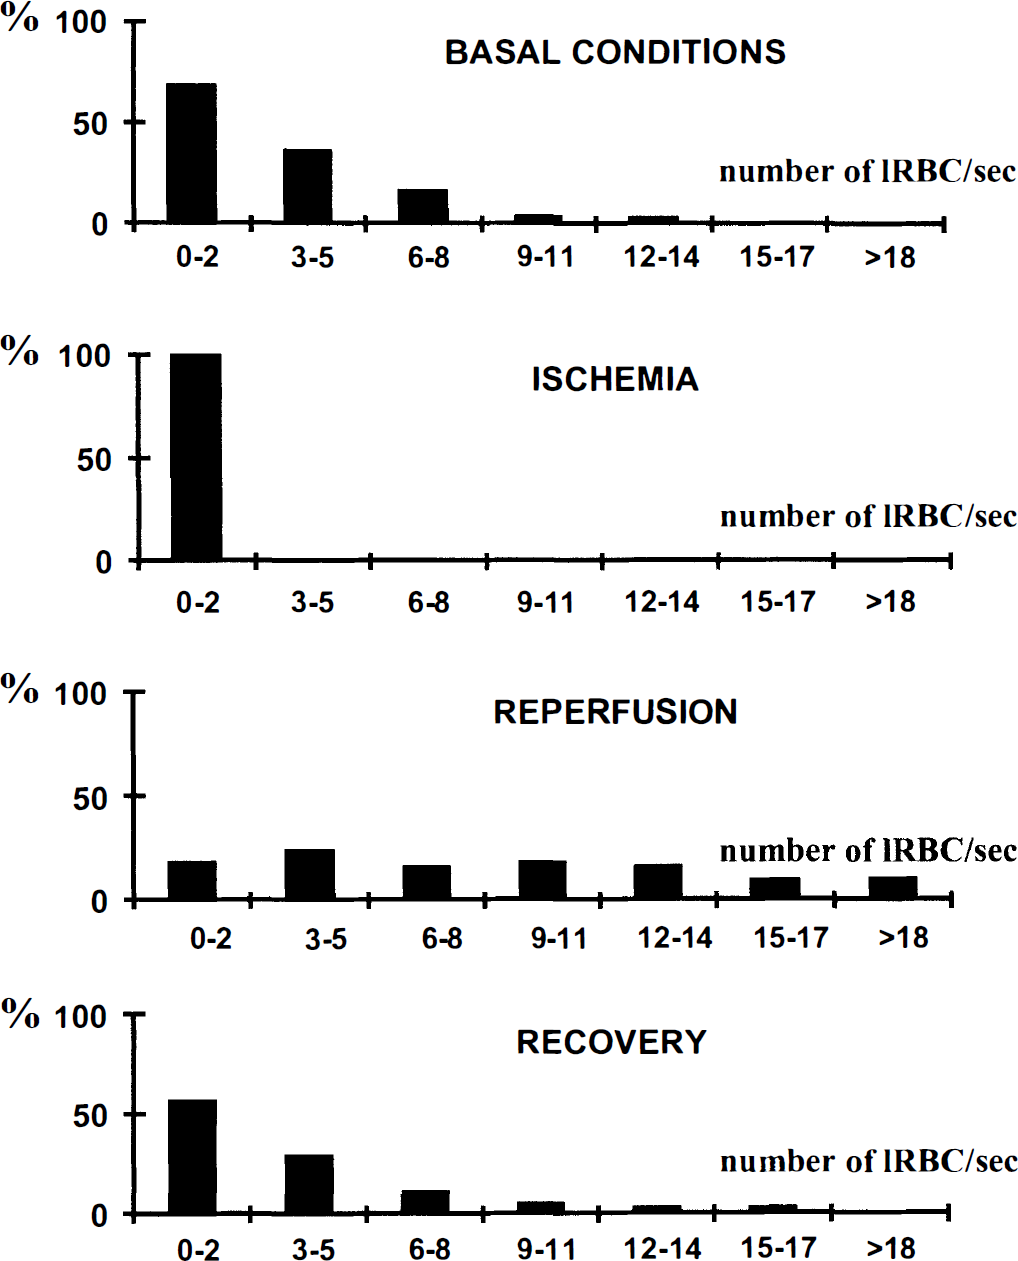
Frequency distribution histograms of the number of labeled RBC (IRBC) per unit of time (flow) in capillaries at the same periods of interest as in Fig. 4.
Recovery
The mean values of all variables had returned to baseline, at 100 seconds after carotid unclamping, but the large SD indicate heterogeneity in the cerebrovascular changes. However, no variable decreased to less than the basal level. Typical images recorded during each experimental condition are shown in Fig. 6.
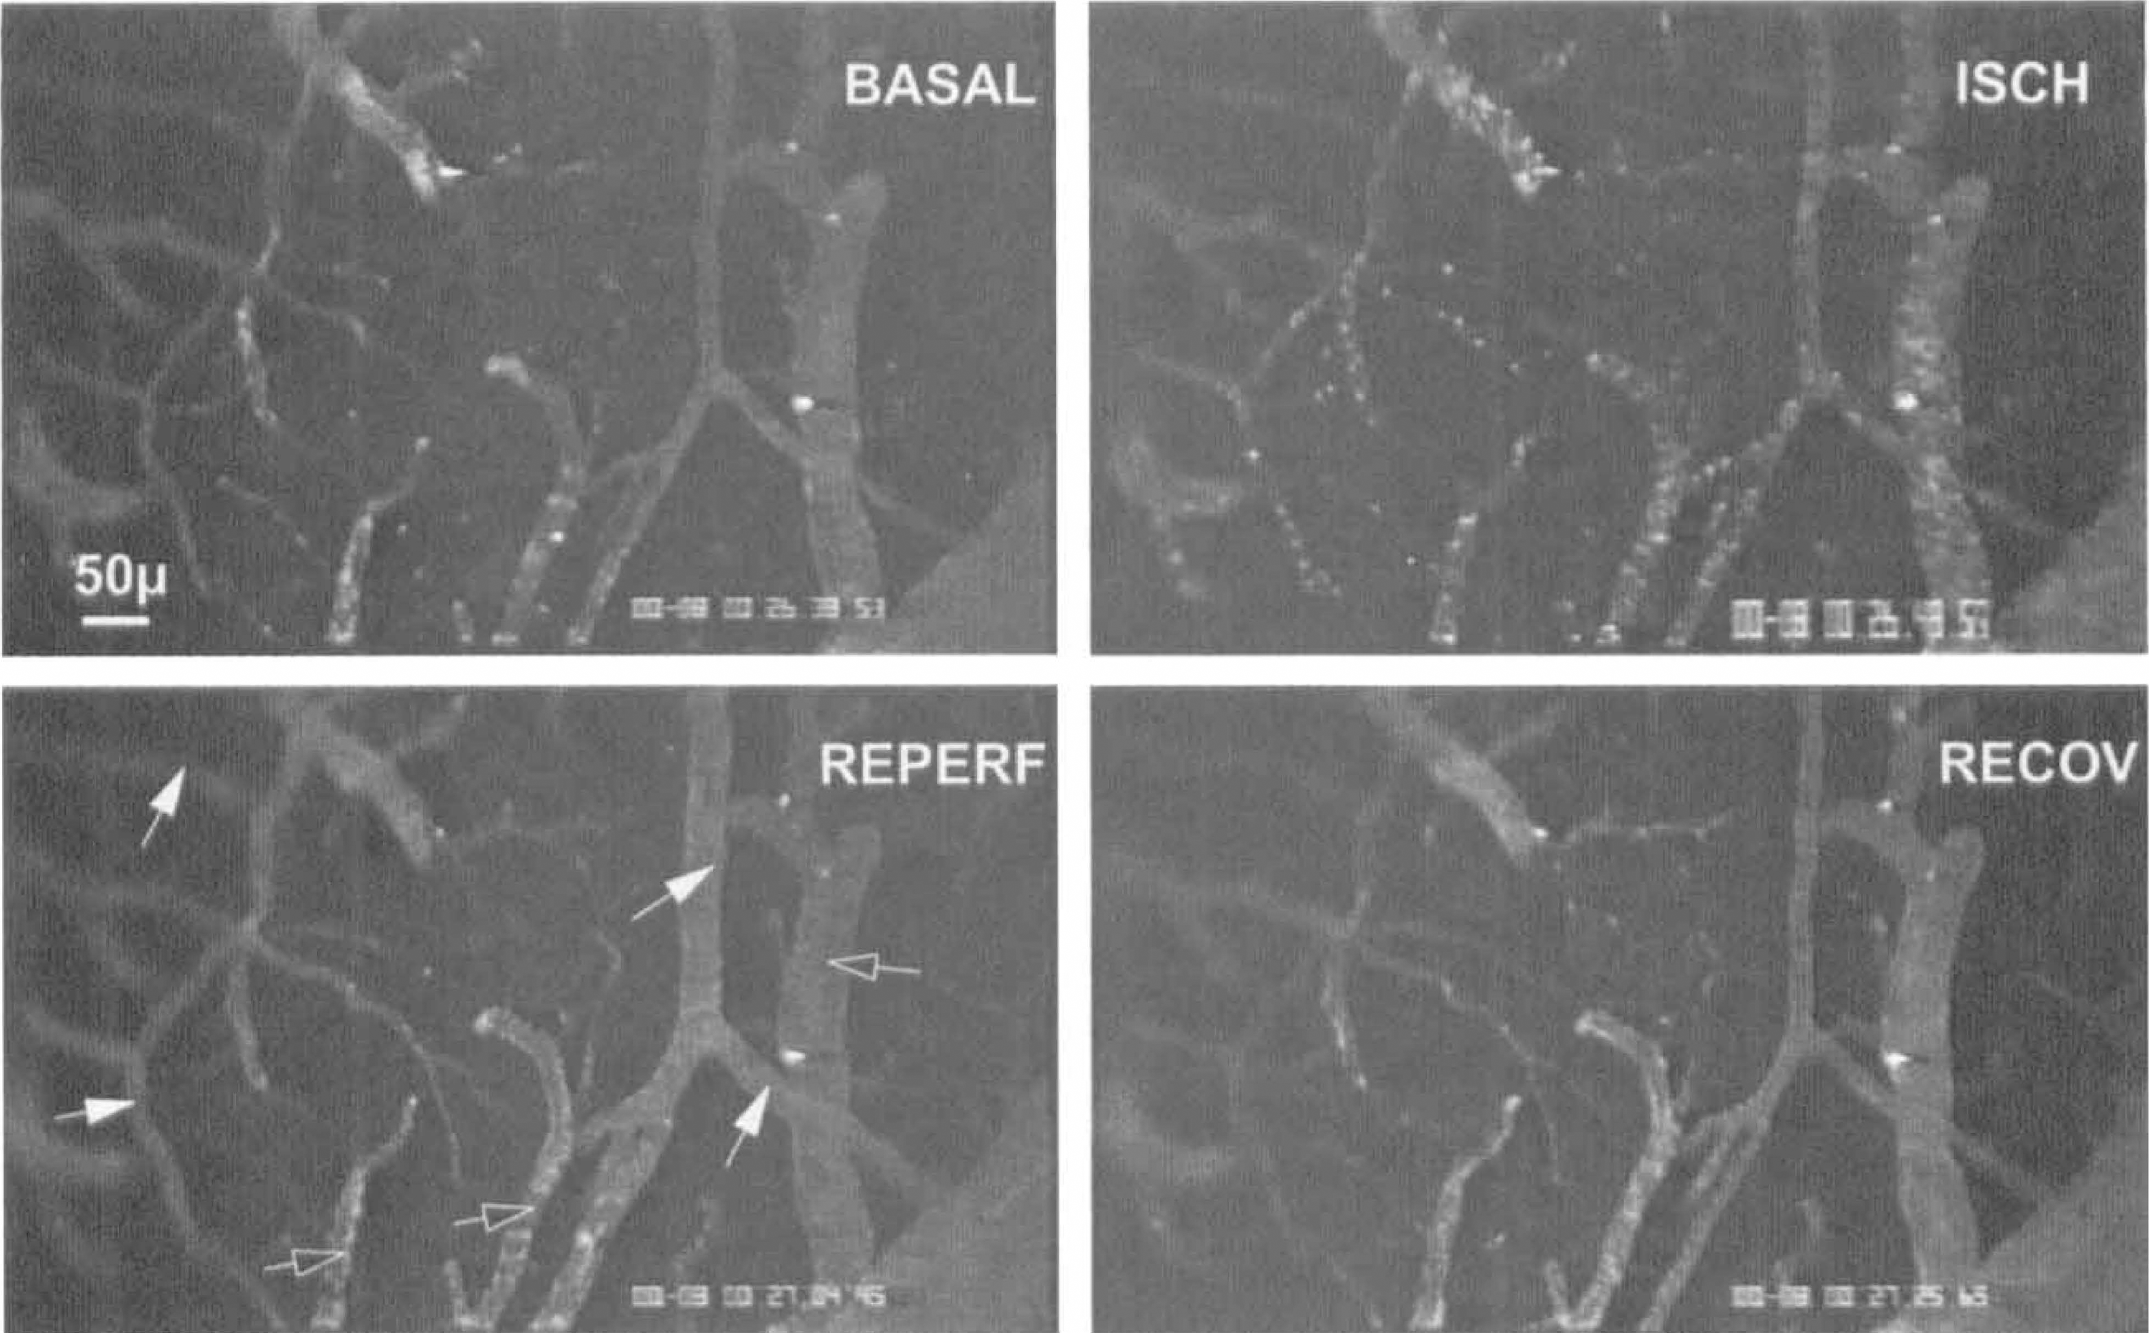
Confocal video-microscope images showing the main phases of 20-second forebrain ischemia and reperfusion: BASAL, basal conditions; ISCH, ischemia; REPERF, reperfusion at 5 seconds after unclamping of common carotid arteries; RECOV, recovery at 40 seconds after unclamping of common carotid arteries (full arrows indicate arterioles; open arrows indicate venules).
DISCUSSION
The present study describes the first application of a newly developed method, combining In Vivo fluorescence microscopy of labeled erythrocytes and plasma with rapid confocal microscopy at the outer layer of the brain. The major interest of this method is to enable one to on-line dynamically visualize both labeled erythrocytes flowing in parenchymal capillaries and pial arteriole and venule diameters. The application to very short transient forebrain ischemia shows the method to be feasible sensitive, and reproducible. In addition, the results provide new insight into the regulation of CBF at the microvascular level, such as the high speed of microvascular changes, the absence of change in any vessel diameter during brief ischemia, and the lack of capillary recruitment during post-ischemic hyperemia.
Method
The present development is based on two complementary approaches using respectively intravital fluorescence video-microscopy (Hudetz et al., 1992) and confocal laser-scanning microscopy (Dirnagl et al., 1991). It became possible with the availability of a two-dimensional real-time confocal microscope. The confocal effect increases the resolution of in-depth measurements and permits several optical sections to be studied in vivo, from the pial level to 200 μm within the brain parenchyma. The rapid laser-scanning also provides on-line visualization of fluorescently labeled erythrocytes in several capillaries simultaneously. Confocal video microscopy was used rather than classical epifluorescent-intensified video microscopy so as to increase the image resolution and improve the depth penetration of the measurements. Villringer et al. (1994) used in vivo confocal microscopy to determine the velocity of the RBC, but they did so without labeling them. The image acquisition time of their confocal microscope was too long to provide two-dimensional confocal images. Therefore, they used a one-dimensional imaging system, which increased the temporal resolution but reduced the spatial resolution.
A possible drawback of laser-scanning two-dimensional confocal microscopy could be some local damage due to the intensity of the laser irradiation. No data in the literature report direct comparison of the light intensity between conventional light microscopy and confocal microscopy. However, it is likely that the number of photons needed for a usable image is similar with both methods. Because of the basic principle of confocal microscopy, photons originate from a virtual point source (smaller than conventional light source), thus implying a more intense irradiation. However, because of the scanning associated to the confocal microscope, the duration of irradiation is reduced by 10 to 100 times depending on the width of the pinhole used. Consequently, the short irradiation time should compensate for the higher irradiation intensity. Additionally, to further limit any deleterious effect of laser illumination on the tissue, the investigation using confocal laser microscopy was intermittent during the 20-minute intervals between ischemic episodes. Moreover, as also reported by Dirnagl et al. (1991), neither aggregates, nor an increase in background tissue fluorescence, nor any change in vascular fluorescence occurred in any experiment, indicating that sequential confocal laser examination lasting longer than 2 hours did not result in any visible damage. In pilot experiments, a histologic study with cresyl violet staining has shown that no damage was visible in the neocortex of rats 7 days after a 3-hour laser illumination period.
The injection of FITC-dextran in the blood together with fluorescently labeled erythrocytes (about 5% of total RBC) neither modified the arterial hematocrit, nor changed the microvessel diameter, ABP, or electrocortical activity, indicating that there was no major perturbation of the hemodynamics. The clear visualization of the microcirculation was made possible by mounting the quartz coverglass over the skull aperture to form a closed cranial window without fluid disturbance. The nondegradation of the physiologic state of the tissue under the window and the absence of microcirculatory disturbance were assessed by the stability of the image and by the reproducibility of the measurements.
Capillary perfusion
The IRBC velocity in the capillaries under basal conditions is of the same order of magnitude as those found by Villringer et al. (1994), but it is less than those reported by others (Ma et al., 1974; Ivanov et al., 1981; Pawlik et al., 1981; Chang et al., 1984; Hudetz et al., 1996). As far as the labeling is concerned, the velocity of fluorescent RBC has been shown to be the same as that of the total RBC population (Sarelius and Duling, 1982). However, the value for IRBC velocity differs from that measured by Knuese et al. (1994) and Hudetz et al. (1992) using fluorescence microscopy, probably because of differences in the experimental conditions. Barbiturate anesthesia decreases the linear velocity of plasma and RBC flows through small parenchymal microvessels (Wei et al., 1993), but it cannot be the cause for the differences because it was used in all three studies. The electrocoagulation of vertebral arteries the day before the experiment may be responsible for our lower values.
Although all the capillaries were filled by FITC-dextran dissolved in plasma, the IRBC flow within capillary networks and within individual capillaries was extremely heterogeneous, as reported by Hudetz et al. (1994) and Villringer et al. (1994). Despite this heterogeneity of lRBC capillary flow, capillaries unperfused by lRBC were never found under basal conditions. Hence, all the capillaries carried at least one fluorescent RBC every few minutes. These results, obtained by a direct dynamic in vivo demonstration, support and extend the notion initially enunciated by Göbel et al. (1990) that capillary recruitment does not occur in cerebral circulation (Kuschinsky and Paulson, 1992). The zero flow in capillaries during ischemia indicates that there is no oxygenation of parenchyma at this time.
In the early post-ischemic reperfusion period, corresponding to transient hyperemia (Pulsinelli et al., 1982), lRBC flow and velocity both significantly increased in parallel. There were rare transient stops of erythrocyte flow, but only for a few seconds. Supplementary capillaries perfused with fluorescent plasma or RBC were never observed during the hyperemic phase. Capillary recruitment of plasma and RBC is thus not involved in the hyperemic phase after short periods of ischemia. This agrees with the ex vivo results of Kuschinsky's group on the lack of plasma flow recruitment (Theilen et al., 1993; Abounader et al., 1995; Kuschinsky, 1996) and with the in vivo findings on the lack of erythrocyte recruitment during autoregulation (Hudetz et al., 1995) and hypercapnia (Villringer et al., 1994).
Microvessel reactivity
Monitoring the arteriole diameter throughout very short ischemic and reperfusion periods may help to explain how CBF autoregulation occurs because blood pressure dramatically and selectively decreased in cerebral vessels for a duration that was not compatible with the production and accumulation of metabolites. The persistent RBC flow within arterioles and venules, although greatly reduced, during the four-vessel occlusion period is intriguing. The EEG became flat within less than 20 seconds after carotid clamping which confirmed the success of ischemia. It is thus likely that there was anastomotic circulation due to the opening of arteriovenous shunts. The fact that there was no significant change in arteriole diameter during ischemia could be attributed to the absence of perfusion pressure. However, this does not prevent relaxation of smooth muscle cells under the influence of various relaxing influences, such as the lack of myogenic tone, the release of endothelial factors, or the perivascular innervation. The relaxed state of the smooth muscle cells is indicated by the instantaneous increase in arteriole diameter on reperfusion. Shear-stress is probably important because the restoration of blood flow may directly stimulate endothelial receptors and ionic channels, causing the release of vasodilatory agents such as nitric oxide (Busse and Fleming, 1998).
Conversely, metabolic factors may have little influence, especially in view of the time course of the vascular events, and also because pilot experiments with shorter ischemic periods caused similar microvascular changes. A myogenic effect due to restoration of blood pressure during recovery can be incriminated in the return of arterioles to their basal diameter because the increase in myogenic tone, stretching smooth muscle cells, causes the release of vasoconstrictive agents (Busse and Fleming, 1998). The lack of significant change in venule diameter confirms the poor reactivity of the cerebral venous myocytes (Schmidek et al., 1985).
In conclusion, we have measured the dynamics of the change in diameter of microvessels and erythrocyte velocity and flow in capillaries by means of confocal laser scanning microscopy. The usefulness of this approach is shown in this feasability study in which cerebral circulation was interrupted for very short periods.