
Abstract
Variations in the cerebellum to plasma ratio at late times in 6-[18F]fluoro-
We have recently reported (Stout et al., 1998) that for 6-[18F]fluoro-
In this communication, we reexamine the theory of LNAA transport across the BBB. The theory leads to a logical explanation of the observed distribution volume changes that is consistent with literature findings on plasma and brain LNAA levels in rats. Implications on improved FDOPA quantitation, in vivo tissue LNAA measurements, and
THEORY OF LNAA TRANSPORT ACROSS THE BLOOD-BRAIN BARRIER
Because the same LNAA transport carriers are shared by all LNAA for their transport across the BBB (Oldendorf, 1971; Pardridge, 1977), changes in the concentration of any one LNAA would affect the transport rate of others. Based on the Michaelis-Menten equation for competitive enzyme binding or carrier transport, the influx (in units of nmol·min−1 ·g−1) of a particular LNAAi across the BBB can be formulated (Pardridge, 1977; Miller et al., 1985; Segel, 1975) as
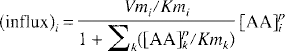
where [AA]pi is the plasma concentration (in nmol/mL) of LNAAi; Vmi and Kmi are respectively the maximal rate (in nmol·min−1·g−1) and half-saturation concentration (in nmol/mL) of LNAAi for the transport carrier. The summation term in the denominator sums over all LNAA (index k) in plasma. Kmk and [AA]pk denote respectively the half-saturation concentration and the plasma concentration of LNAAk. Similarly, by assuming that LNAA in tissue can be approximated as a single compartment (i.e., a pool of uniform LNAA concentration), the outflux (in nmol·min−1·g−1) of LNAAi is
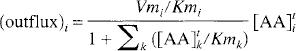
which is identical in form to the influx (Eq. I), except that the plasma LNAA concentrations are replaced by the tissue concentrations ([AA]ti and [AA]tk, in nmol/g). In Eqs. 1 and 2, Vm and Km are assumed to have the same values between the inward and outward transports of each LNAA, except that the units are different (i.e., the unit of Km for influx is nmol/mL and for outflux is nmol/g).
The transport constants for the inward and outward transport of LNAAi can thus be described by
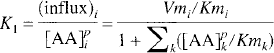
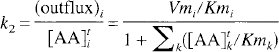
If LNAAi is not involved in biochemical processes within the tissue (as is the case for OMFD), the influx and outflux at equilibrium should be equal, and the distribution volume of LNAAi in tissue can be related to total LNAA concentrations as
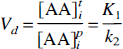
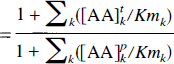
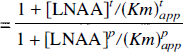
where
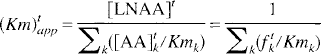
and
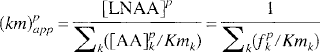
denote, respectively, the apparent Km for total tissue and plasma LNAA transport across the BBB; [LNAA]p and [LNAA]t are the total LNAA concentrations in plasma and tissue, respectively; fpk and ftk are, respectively, the fractions (with respect to total LNAA) of LNAAk in plasma and tissue. Moreover, if LNAAi is in trace amounts (i.e., [AA]pi and [AA]ti are small), the summation terms in the above equations do not need to include the term caused by LNAAi. Therefore, the distribution volume of an inert LNAA in trace amounts (e.g., a radiolabeled inert LNAA) will depend only on the concentration to Km ratios of other LNAA (in tissue and in plasma) (Eq. 6). According to Eq. 7, the distribution volume of such an LNAA will be changed only when the total LNAA concentration in plasma is changed relative to that in tissue, or when the relative concentrations of LNAA in plasma or in tissue (i.e.fpk and ftk are changed such that they alter the apparent Km (Kmpapp and Kmtapp). In other words, one needs to know the LNAA concentrations in plasma and in brain tissue as well as the apparent Km values to predict the distribution volume of an inert radiolabeled LNAA.
If a radiolabeled LNAA is not inert and is involved in tissue biochemical reactions (e.g., protein synthesis), its distribution volume will not be determined by Eqs. 5–7 above. For example, the distribution volume of [11 C]
In the above derivation, the values of Km and Vm were assumed to have the same values between the inward and outward transport. If the values were different, the general relationship of Eq. 7 will still hold except that a scaling factor, dependent on the specific LNAAi, may need to be introduced. Also, a single transport system is assumed in the above discussion. Although it appears that more than one system may exist for LNAA across the BBB (e.g., the high- and low-affinity systems discussed by Hargreaves and Pardridge, 1988), transport is normally dominated by one system.
PLASMA AND BRAIN LNAA CONCENTRATIONS
Many investigators have previously measured plasma and brain LNAA concentrations in rats. In at least three investigations, plasma and brain LNAA concentrations were measured for the same sets of animals in the same experiment. In a study by Glanville and Anderson (1985), four groups of normal animals (n = 6, 5, 6, and 5) were fed with diets of different protein contents (15%, 30%, 45%, and 60%) for 2 weeks. Plasma and whole brain concentrations of eight LNAA were then determined and reported in graphs. The values taken from the graphs are listed in Table 1. In a study by Meloche and Smith (1995) to evaluate the effect of T-2 toxin on amino acid metabolism, two sets of control studies (n = 10 for each set) were performed, and the plasma and brain concentrations of seven LNAA were measured. Their reported values are also listed in Table 1. Voog and Eriksson (1992) measured the plasma and brain concentrations of six LNAA (without methionine) in three groups of rats (n = 7 per group) at 2 hours after a meal of 0%, 18%, and 40% protein for the three groups (animals had been fasted for 12 hours and had been on 16% protein for 2 weeks before fasting). Their measured values are listed in Table 1.
Plasma and brain LNAA concentrations reported in the literature for rat
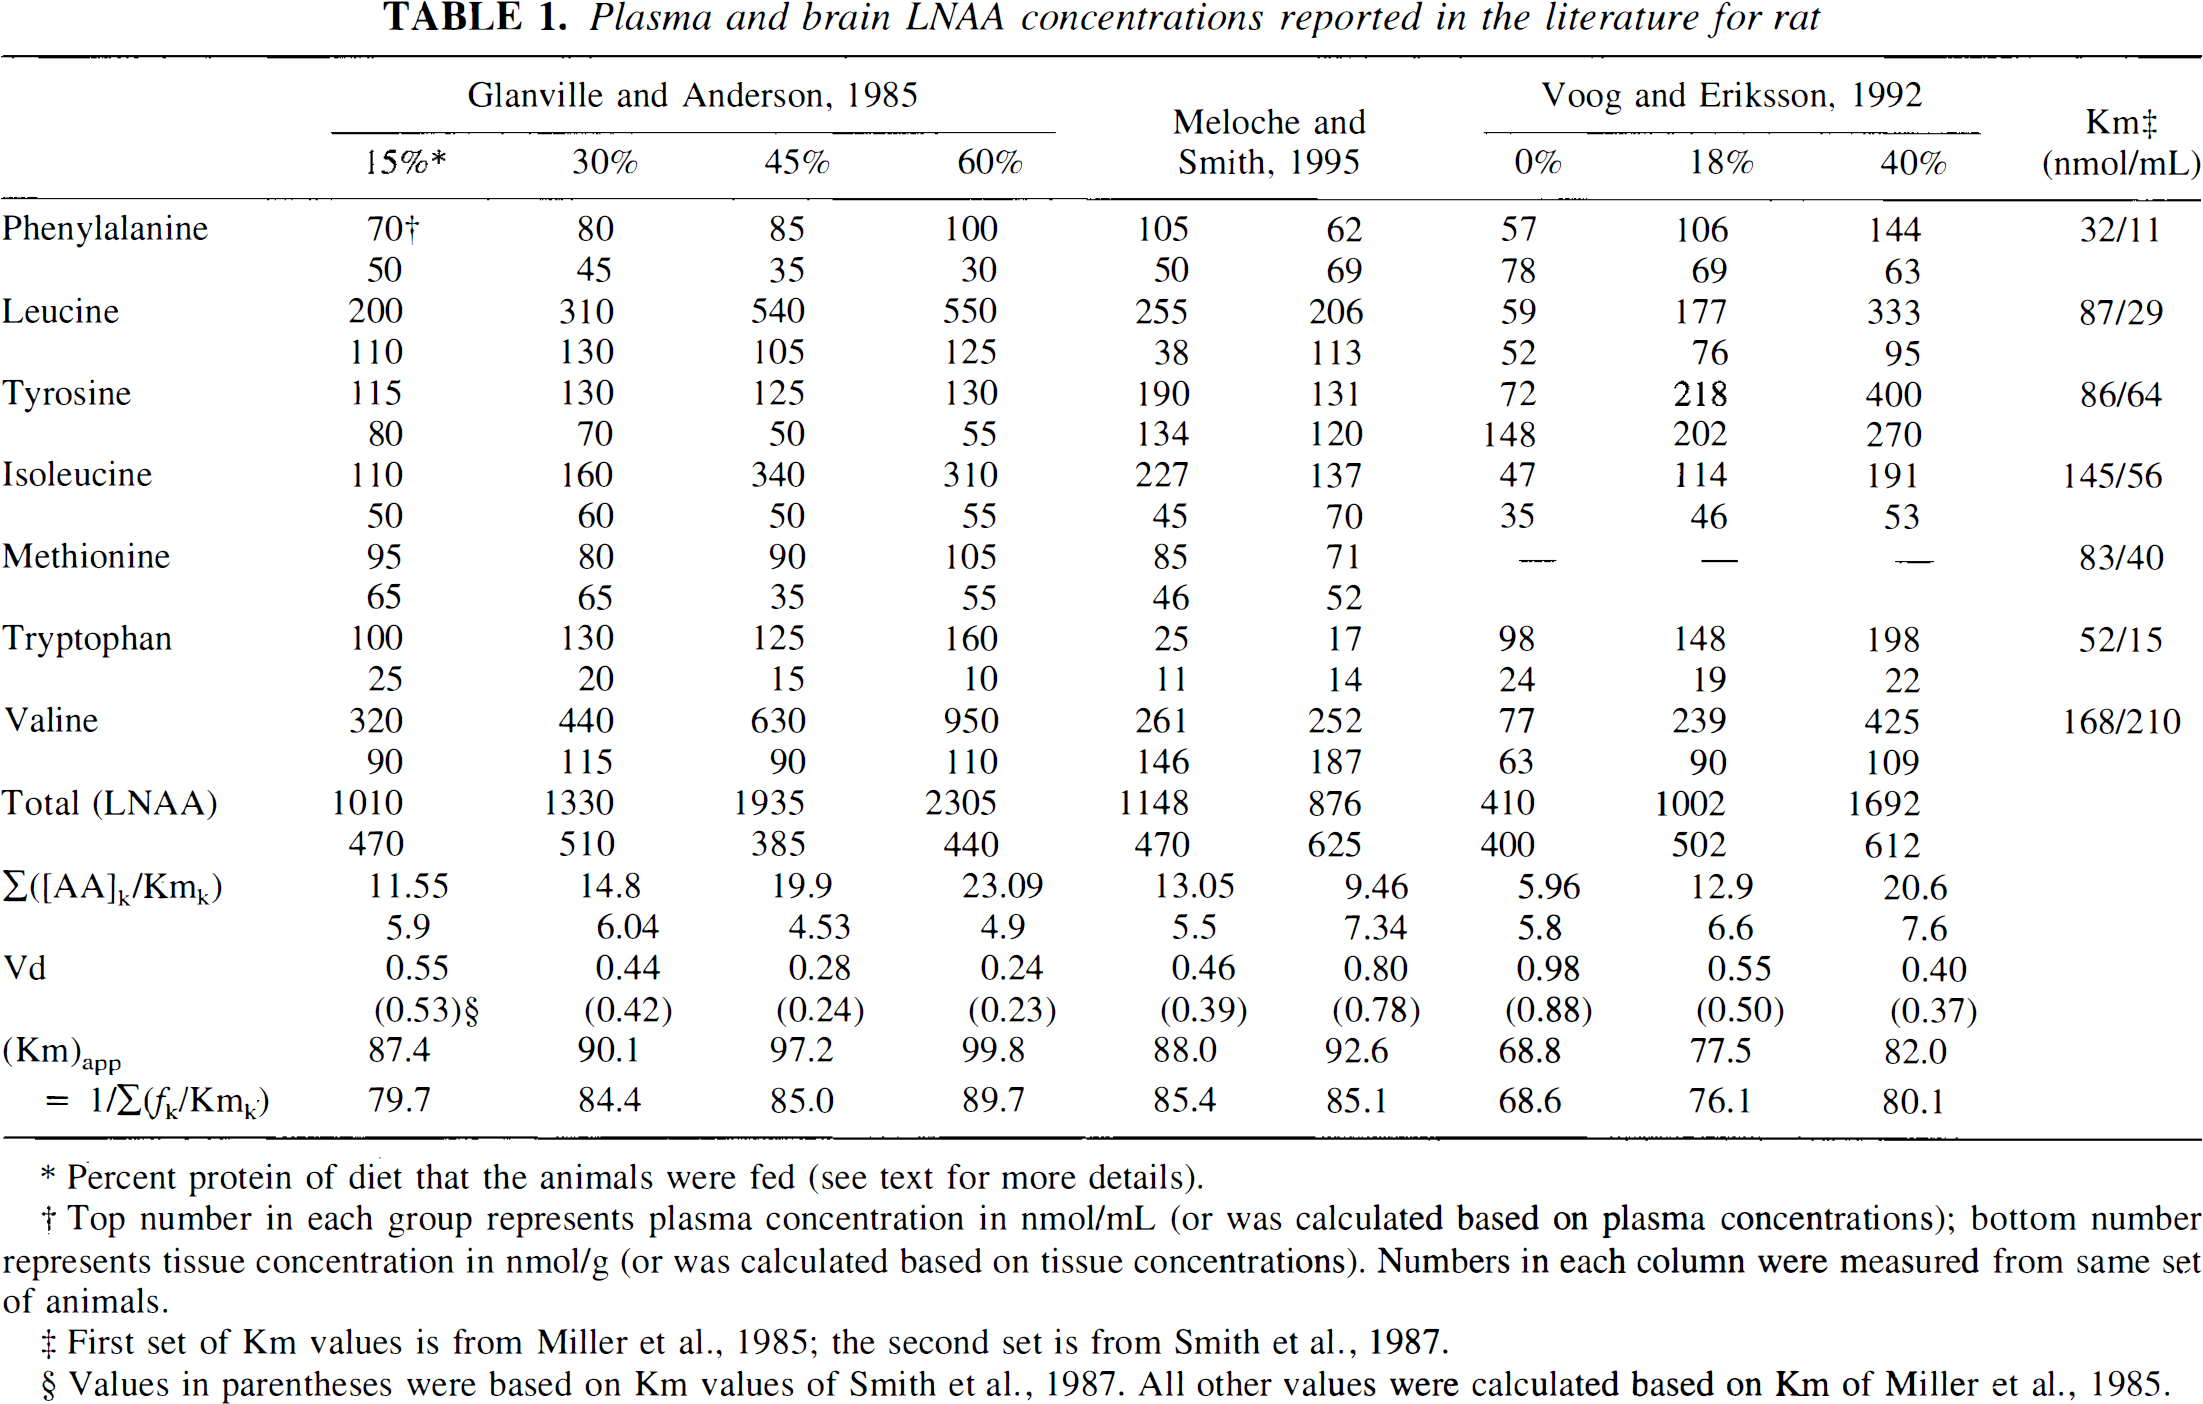
Percent protein of diet that the animals were fed (see text for more details).
Top number in each group represents plasma concentration in nmol/mL (or was calculated based on plasma concentrations); bottom number represents tissue concentration in nmol/g (or was calculated based on tissue concentrations). Numbers in each column were measured from same set of animals.
First set of Km values is from Miller et al., 1985; the second set is from Smith et al., 1987.
Values in parentheses were based on Km values of Smith et al., 1987. All other values were calculated based on of Miller et al., 1985.
Although there are variations among determinations as well as methodological differences, it is clear from these literature findings that the total LNAA levels in brain tissue are mostly lower than those in plasma. Moreover, plasma LNAA concentrations can change significantly with various interventions, but only relatively small effects appear on brain tissue LNAA concentrations.
AGREEMENT BETWEEN MEASURED AND CALCULATED DISTRIBUTION VOLUMES
Based on the plasma and brain LNAA concentrations listed in Table 1 and by using the Km values reported by Miller et al. (1985) for various LNAA, the distribution volume of an inert LNAA in trace amounts can be calculated with Eq. 7. Although not all LNAA concentrations are available (missing values were considered zero in the calculation), the LNAA with large Km contribute little to the summation terms in Eqs. 8 and 9 and thus will not affect significantly the apparent Km values (i.e., Kmpapp and Kmtapp) and the calculated Vd. The calculated Vd for different sets of LNAA measurements are listed in Table 1 and shown in Fig. 1 as a function of total plasma LNAA level. Also shown in the figure are cerebellum to plasma radioactivity ratios measured in vervet monkeys with FDOPA (Stout et al., 1998). The general consistency of the directly measured distribution volume with the calculated values that are based on literature LNAA values supports the validity of the functional relationship of Eq. 7 for estimating distribution volumes. Furthermore, it indicates that Eq. 7 can explain the observed distribution volume change as a function of the total plasma amino acid concentration.
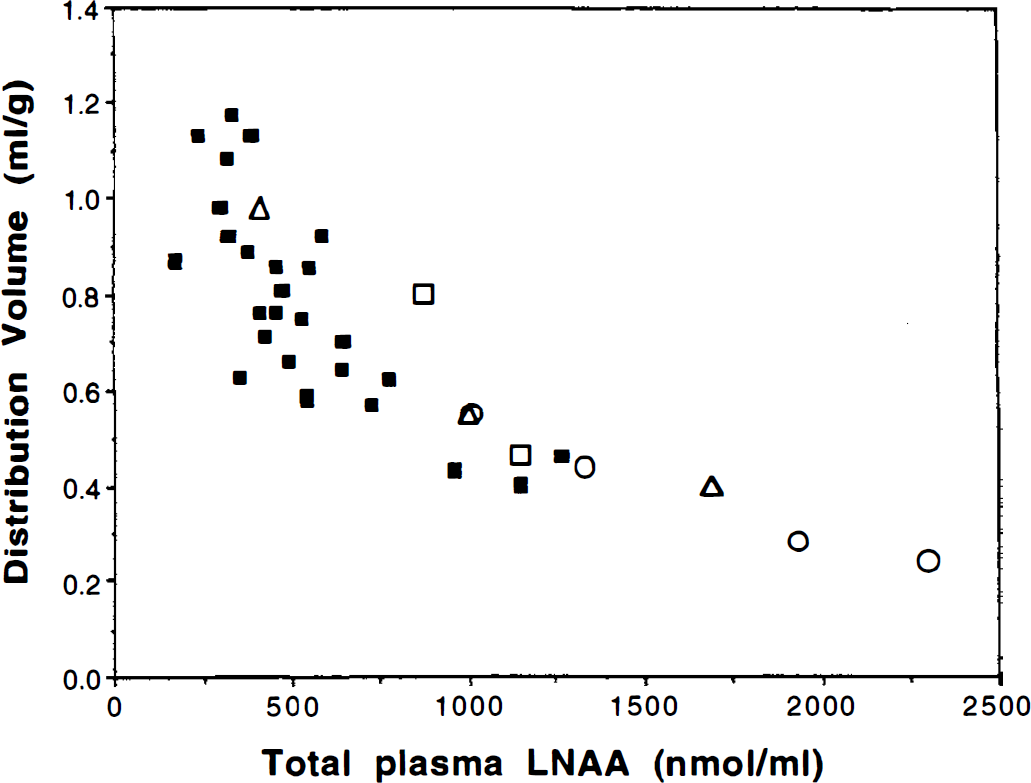
Distribution volume of inert radiolabeled large neutral amino acid (LNAA) in brain tissue as a function of total plasma LNAA (sum of the seven LNAA listed in Table 1). The solid squares were measured directly in vervet monkeys with 6-[18F]fluoro-
Also, according to the equations for K1, and Vd (Eqs. 3 and 6), if the tissue LNAA level does not vary significantly (as supported by data in Table 1), the K1, and Vd values are expected to have the same functional dependency on the plasma LNAA level. This is again consistent with the results reported by Stout et al. (1998) (Figs. 2 and 6 in their paper). The rates of change (slope per y-intercept) of K1 and Vd as plasma LNAA concentration increases are almost identical (0.00060 per mmol/L for K1, and 0.00057 per mmol/L for Vd) near the normal range.
According to Eqs. 5–9, Vd also depends on the Km values of individual LNAA. In the Vd calculations of Fig. 1 and Table 1, the Km values determined by Miller et al. (1985) in conscious rats were used. Smaller values of Km have also been reported for anesthetized animals (Smith et al., 1987) and for isolated capillary preparations (Hargreaves and Pardridge, 1988). If the smaller Km values of Smith et al. (1987) are used in the calculation, the corresponding Vd values are only slightly changed (−0.046 ± 0.033 mL/g on average). The general relationship as a function of plasma LNAA, however, remains the same. Even though the exact Km values for monkeys are not known, the relative insensitivity to the particular set of Km values and the general agreement between the measured and the calculated Vd suggest that the set of Km values from rats is probably applicable to monkeys for estimating Vd.
MECHANISMS ACCOUNTABLE FOR THE APPARENT LACK OF EQUILIBRIUM
The relative constancy of tissue LNAA, in spite of a large variation in plasma concentration (Table 1; Glanville and Anderson, 1985; Voog and Eriksson, 1992), could appear as a lack of equilibrium of LNAA across the BBB. The existence of active cellular processes that could offset the concentration gradients was proposed (Glanville and Anderson, 1985). These authors suggested that “an alteration either in transport mechanisms or in brain metabolism occurs” to explain the tissue LNAA's “relative resistance to change.” However, a simpler explanation can be offered, involving the high level of saturation of the transport carrier system. In fact, transport saturation and competition as a means to maintain homeostasis of brain LNAA has been proposed before by Smith et al. (1987). As shown in Table 1, the LNAA levels in plasma and in tissue are mostly larger than the Km values of the corresponding LNAA. Based on the competitive carrier kinetics discussed earlier, the fraction of total carrier occupied by any LNAAk (frk) can be calculated by the following equation (Segel, 1975).
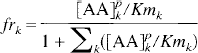
And the fraction that is not occupied (frfree) is
Based on the values listed in Table 1, (frfree) is calculated to be less than 0.04 to 0.08. In other words, the transport carrier is working at close to its maximal transport capacity. So, as the plasma LNAA is increased or decreased, the influx of LNAA would show little change and thus would not affect significantly the tissue amino acid level.
In fact, under normal conditions, the outward transport is also highly saturated, and changes in the tissue LNAA level are not expected to change the outflux much. Therefore, in effect, brain tissue can establish an amino acid environment that is suitable for its biologic function, but insulated from large plasma fluctuations caused by dietary intake and peripheral systemic control (Voog and Eriksson, 1992; Glanville and Anderson, 1985). However, if the relative fractions of LNAA in plasma are significantly altered (as in pathologic conditions), tissue LNAA homeostasis is not expected to be maintained.
OMFD FOR IN VIVO MEASUREMENT OF BRAIN LNAA LEVELS
From Eq. 7, the distribution volume of an inert LNAA, such as OMFD in brain and FDOPA in the cerebellum, is related to both plasma and tissue total LNAA concentrations and to the apparent Km values. In Table 1, the apparent Km values for all sets of LNAA concentrations are also listed. The values are quite stable (Kmpapp = 87.0 ± 9.8 mmol/L and Kmtapp = 81.6 ± 6.3 nmol/g). Because Vd of OMFD can be easily measured in vivo with PET, and total plasma LNAA concentration can be assayed from blood samples, total tissue LNAA concentration can be determined with Eq. 7. For example, the value of Vd is about 0.7 mL/g for a plasma LNAA concentration of 500 mmol/L (Stout et al., 1998; Fig. 1). Using Eq. 7, 87.0 mmol/L for Kmpapp, and 81.6 nmol/g for Kmtapp, the total brain LNAA concentration in vervet monkeys can be calculated to be 304 nmol/g, or [(500/87.0 + 1) · 0.7 – 1] · 81.6. From the relatively constant value of the apparent Km shown in Table I, the calculated tissue LNAA value should have small variability. Nevertheless, variation from an assumed distribution spectrum is expected to affect somewhat the accuracy of the determination. For the cerebellum or other brain tissues, in which FDOPA is not decarboxylated or biochemically trapped, the tissue LNAA concentration can be measured with FDOPA (Stout et al., 1998). Further investigation and validation of this approach are ongoing in our laboratory.
IMPROVED QUANTITATION OF FDOPA KINETICS
With the better understanding of the distribution volume of LNAA provided in this communication, one can improve the modeling and quantitation of the measured FDOPA kinetics. For example, instead of using a fixed Vd value for OMFD in the modeling of striatal kinetics, one can use the value determined from the cerebellum. This is expected to improve the reliability of the measurements. We have observed previously in our laboratory that in the calculation of the striatal uptake constant (Ki) of FDOPA, the use of cerebellum as a kinetic reference region (i.e., by subtracting the cerebellar activity from the striatal activity curve and applying Patlak analysis; Patlak et al., 1983) gives a result of smaller variability than the value estimated from fitting the striatal kinetics with an FDOPA model that assumes a fixed Vd value of 1.0 mL/g for OMFD (Huang et al., 1991). The model-fitting approach estimated the tissue OMFD kinetics from plasma OMFD curve, on the basis of the assumed value of Vd. Preliminary data show that an overestimation of the Vd value by 0.3 mL/g (corresponding to a total plasma LNAA of about 500 nmol/mL) in the model fitting could lower the calculated striatal Ki value by 21% to 37% in vervet monkeys. If the measured cerebellum to plasma ratio (at 120 minutes) is used as the value of Vd, the Ki results from model fitting are found to have reduced variability and correlate well with those obtained with the Patlak analysis (i.e., the approach that first subtracts the cerebellar activity from the striatal kinetics) (unpublished data).
Results by FDOPA quantitation methods that use the cerebellar curve as the input function are not expected to be affected much by the distribution volume variation (because plasma LNAA affects K1 [of FDOPA] and Vd similarly), although they might be sensitive to other factors, such as the O-methylation activity in the periphery, which can influence plasma and tissue OMFD levels. The use of cerebellar Vd value (either directly measured or estimated from plasma LNAA level) in the FDOPA model fitting is expected to improve the reliability of other model parameters (e.g., k2 and k3) as well. This investigation is currently ongoing in our laboratory.
MULTIPLE TRANSPORT BARRIERS IN TISSUE
The discussion so far considers the tissue as a homogeneous compartment of amino acids. However, there is evidence in the literature indicating that the transport of LNAA across the neuronal membrane is also mediated by a carrier system (Aragon et al., 1982; Katz, 1980; Kapatos and Zigmond, 1977; Barrio et al., 1997). Although not much information about this transport system is available now, it is conceivable that this transport is also saturated under normal conditions. Following the same argument for the transport across the capillary, it is likely that cellular and interstitial concentrations of LNAA can be different. In fact, without the need of a sophisticated system, different cells could maintain different LNAA concentrations that are most suitable for the functional states of the individual cells.
IMPLICATION FOR l-DOPA TREATMENT OF PATIENTS WITH PARKINSON'S DISEASE
The saturation of the LNAA carrier system in the BBB also has intriguing implications in drug therapy, specifically the use of