
Abstract
6-[F-18]Fluoro-L-3,4-dihydroxyphenylalanine (FDOPA) has been used to measure the central dopaminergic function in many species, including humans and monkeys. For transport across the blood brain barrier (BBB), FDOPA competes with plasma large neutral amino acids (LNAA). In this article we evaluate the effects of normal physiological LNAA concentration variation on BBB transport (K1) and the FDOPA uptake measurement, Ki. We also investigate a method for reducing the dependency of FDOPA quantitation on LNAA. Adult vervet monkeys (Cercopithecus aethiops sabaeus, n = 19) were fasted overnight before FDOPA positron emission tomography scans. Blood samples were drawn for LNAA determination, metabolite analysis, and compartmental modeling. The estimated K1 and Ki were both negatively correlated with LNAA concentrations (r2 = 0.51 and 0.62, respectively). Using an adjustment to K1 and Ki based on these correlations, the LNAA dependency was reduced (SD of the data for K1 was reduced by 33%, for Ki by 40%). Experiments with amino acid loading on an additional six animals indicate that BBB transport can be described using Michaelis-Menten kinetics. Results show a clear dependence of FDOPA uptake on plasma LNAA concentrations, which can be removed to increase the precision of FDOPA quantitation.
6-[F-18]Fluoro-L-3,4-dihydroxyphenylalanine (FDOPA) is a biochemical probe used as a marker of central dopaminergic function in rats, monkeys, and humans. Low FDOPA uptake has been correlated with dopamine deficiencies due to Parkinson's disease (Snow et al., 1993) and MPTP exposure (Calne et al., 1985; Chiueh et al., 1985; Melega et al., 1991; Doudet et al., 1989). While the magnitude of FDOPA uptake decreases markedly in severe disease or MPTP exposure, changes in the early disease stage and experimental treatments that potentially modify dopaminergic loss or regeneration are usually small and subtle. Therefore, the ability to distinguish small changes in signal strength is crucial for accurate diagnosis and measuring experimental efficacy.
FDOPA positron emission tomographic (PET) data are generally quantified with the use of a compartmental model to estimate the uptake constant Ki, where Ki = (K1 * k3)/(k2 + k3). The compartmental model for FDOPA (Huang et al., 1991) is shown in Fig. 1, using K1 as the forward rate constant representing the blood brain barrier (BBB) transport, k2 as the reverse BBB transport rate constant, and k3 as the decarboxylation rate of FDOPA to fluorodopamine (FDA). FDOPA PET experiments typically measure the accumulation kinetics of FDA in the striatum (Firnau et al., 1986; Melega et al., 1991; Huang et al., 1991).
Compartmental model for FDOPA kinetics. The striatum has three compartments, tissue FDOPA, tissue fluorodopamine (FDA) and tissue 3-OMFD. The rate constants K1, k2 and K5, k6 represent BBB transport, forward and reverse transport of FDOPA and 3-OMFD, respectively. K3 is the decarboxylation of FDOPA to FDA and k4 is the clearance rate of FDA and its metabolites to plasma.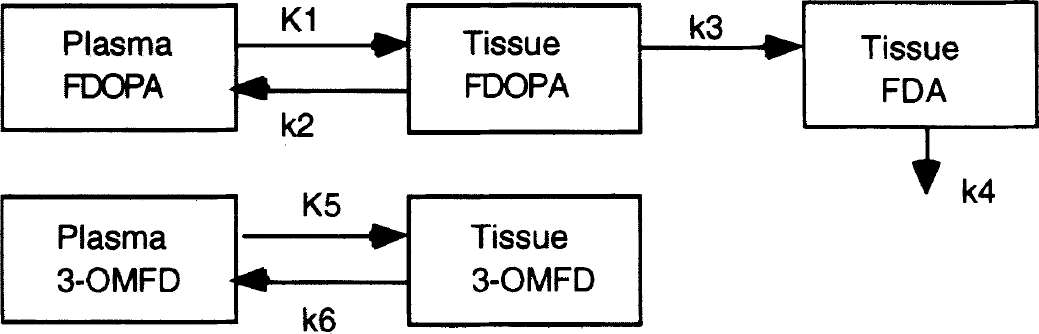
FDOPA crosses the BBB via carrier-mediated transport (Cheng et al., 1993), commonly referred to as the large neutral amino acid (LNAA) transport system (Oldendorf et al., 1971). The LNAA system operates near saturation under normal biologic conditions (Oldendorf et al., 1971; Smith et al., 1987), with all substrates competing for the same binding site. This competition for transport suggests that FDOPA availability in the brain may be inversely related to plasma LNAA concentrations. Competitive inhibition experiments using relatively large amounts of a single amino acid (Hartvig et al., 1993; Koeppe et al., 1991; Shulkin et al., 1995; Wade et al., 1975) or infusion of multiple LNAA (Alexander et al., 1994) have shown a decrease in uptake of both natural and synthetic LNAA probes. L-DOPA and FDOPA have also shown decreased uptake with the addition of large amounts of competitive substrates (Leenders et al., 1986; Hartvig et al., 1993). However, normal variances in physiological plasma LNAA concentrations on FDOPA quantitation have not yet been investigated.
This article describes the effects of normal physiologic variations in LNAA concentrations on the quantitation of FDOPA in vervet monkeys (Cercopithecus aethiops sabaeus). The correlations of LNAA concentrations with various FDOPA kinetic parameters, including the rate constants Ki and K1, are described. Further, the effects of increasing plasma LNAA concentrations were evaluated in animals and the effects on FDOPA quantitation characterized. The results suggest that the plasma LNAA dependency of FDOPA transport and uptake can be adjusted by a simple model, which can improve the precision of FDOPA quantitation and increases the sensitivity to the detection of small changes in the FDOPA measurements.
METHODS
Chemistry
FDOPA (specific activity 1 to 2 Ci/mmol) was produced on-site using the procedure previously described (Luxen et al., 1990). Chemical and radiochemical purities were >99%.
Positron emission tomography scanning
All experiments were conducted using a standard protocol described previously (Barrio et al., 1990; Melega et al., 1996). A Siemens 713 PET scanner was used to acquire 28 dynamic scans from 25 vervet monkeys. A transmission scan using a Ge-68 ring source was used to measure attenuation correction factors for the emission scans. All animals received 10 to 15 mg/kg subcutaneous carbidopa 45 minutes before FDOPA injection. Each animal received approximately 1.0 mCi/Kg FDOPA injected intravenously as a bolus over 45 seconds. During the first 30 minutes, dynamic data was acquired with 13 frames (10 × 90 s and 3 × 300 s). For the remaining 90 minutes, an interleaved protocol alternated between two bed positions to acquire data in 18 × 300 s frames (9 frames for each bed position). The interleaved protocol doubled the axial sampling, producing a plane separation of 1.67 mm, which decreased the sensitivity of animal positioning relative to the scanner imaging planes. Arterial blood samples (0.3 to 1.0 mL) for determining amino acid concentrations, rate constant modeling, and tracer metabolism were collected throughout the study, with 12 samples taken during the first 2 minutes and additional samples at 3, 4, 5, 10, 20, 45, 60, 90, 105, and 120 minutes after injection. Blood samples were centrifuged and 100 μL plasma samples assayed in a well counter (Tracor Analytic, Searle Analytical, Des Plains, IL, U.S.A.) for the plasma F-18 time activity curves. Metabolite analysis was determined using the procedure previously described (Melega et al., 1991) at 5, 10, 20, 30, 60, 90, and 120 minutes after FDOPA injection.
LNAA determination
Plasma concentrations of seven LNAA (tyrosine, tryptophan, valine, phenylalanine, methionine, leucine, and isoleucine) were determined by HPLC analysis described earlier (Barrio et al., 1986; Keen et al., 1989). In brief, blood samples were drawn from an arterial catheter before FDOPA injection from overnight fasted vervet monkeys. Plasma was deproteinated with an equal volume of 0.8 mol/L perchloric acid, filtered (0.22 μm, Micron Alltech, Deerfield, IL, U.S.A.) and stored at −4°C for later analysis. Quantitation of the amino acids was achieved by a gradient HPLC analysis using a Beckman C-18 Ultrasphere (Beckman Instruments, Fullerton, CA, U.S.A.) reversed phase 5 μm column (4.6 mm × 25 cm). The solvent flow was 0.8 mL/min with 70% 100 mmol/L NaH2PO4, 30% MeOH, ramped to 65% MeOH by 30 minutes. After neutralization with 0.3 mol/L KOH and filtration of precipitated potassium perchlorate, samples were incubated with an equal volume ofo-phthaldialdehyde solution (1 mg/mL, Sigma Chemical, St. Louis, MO) for 2 minutes before injection. Fluorescence detection using a 340 nm excitation wavelength and 440 nm emission detection provided stable, reproducible peak areas (Keen et al., 1989). Concentrations of each LNAA were determined by comparing peak areas with known dilutions for each amino acid at 10, 20, and 100 μmol/L. The total plasma LNAA concentration was calculated as the sum of all seven LNAA.
LNAA loading experiments
Infusion rates and LNAA concentrations
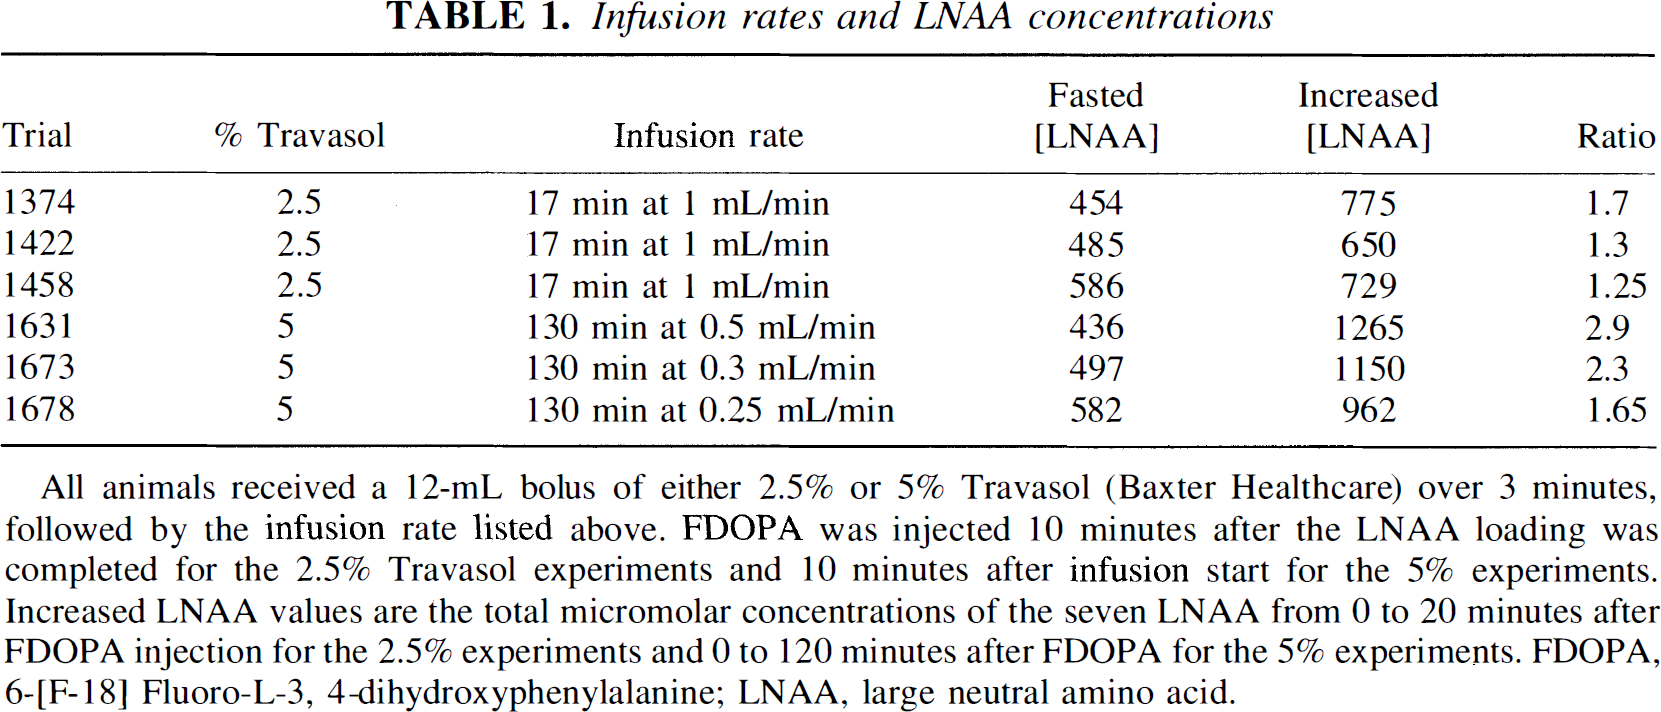
All animals received a 12-mL bolus of either 2.5% or 5% Travasol (Baxter Healthcare) over 3 minutes, followed by the infusion rate listed above. FDOPA was injected 10 minutes after the LNAA loading was completed for the 2.5% Travasol experiments and 10 minutes after infusion start for the 5% experiments. Increased LNAA values are the total micromolar concentrations of the seven LNAA from 0 to 20 minutes after FDOPA injection for the 2.5% experiments and 0 to 120 minutes after FDOPA for the 5% experiments. FDOPA, 6-[F-18] Fluoro-L-3, 4-dihydroxyphenylalanine; LNAA, large neutral amino acid.
All six animals had FDOPA PET scans acquired after or during the amino acid loading. The first three animals received a bolus and infusion with Travasol for a period of 20 minutes, followed 10 minutes later by the FDOPA injection. The second set of three animals received a bolus followed by continuous infusion during the entire PET experiment, with the tracer administered 10 minutes after the start of the Travasol injection. Blood samples were drawn throughout the experiment to determine LNAA concentrations, time-dependent plasma radioactivity, and tracer metabolite analysis.
Data analysis
Images were reconstructed using measured attenuation and a Hann filter (0.5 cutoff of the Nyquist frequency), yielding an in-plane image resolution of approximately 5.5 mm full width half maximum. Parametric images displaying the FDOPA uptake constant Ki were determined with a Patlak analysis (Patlak et al., 1983) using the plasma FDOPA radioactivity curve and PET data collected between 30 and 120 minutes after FDOPA injection. Background activity, due to the FDOPA metabolite 3-O-methyl-FDOPA (OMFD), was obtained using a region of interest (ROI) defined inside the cerebellum and was subtracted from the entire image, before the Patlak analysis, to generate parametric images of Ki.
Regions of interest were drawn on all parametric image planes containing striatal signal and the plane with the highest Ki value was used for analysis. Striatal and cerebellar radioactivity concentrations were also determined at 120 minutes after injection. K1, k2, and k3 values of the striatal region were determined using the first 30 minutes of data based on the FDOPA model (Fig. 1). An iterative least squares fitting algorithm was used, where k3 was constrained by the striatal Ki value obtained from the Ki parametric images by the relationship k3 = Ki * k2/(K1 – Ki). This constraint was necessary to stabilize the fitting results and produce convergence to non-negative kinetic values. Using an unconstrained model produced nearly identical values for the data taken as a group; however, several experiments produced negative or extremely high rate constants or did not converge to a solution.
Large neutral amino acids concentrations for the amino acid loading studies were estimated as the average total LNAA concentrations of the measurements taken 10 to 50 minutes after FDOPA injection, which corresponds to the time when the majority of FDOPA uptake occurs. The correlations of K1 and Ki with LNAA concentrations were determined using Kaleida-Graph (Abelbeck Software). A linear equation and a Michaelis-Menten equation [MM, K = Vmax/(Km + [LNAA])] were used to fit the K1 and Ki versus LNAA data (Pardridge and Chio, 1986).
RESULTS
Rate constants relationship to plasma LNAA concentrations
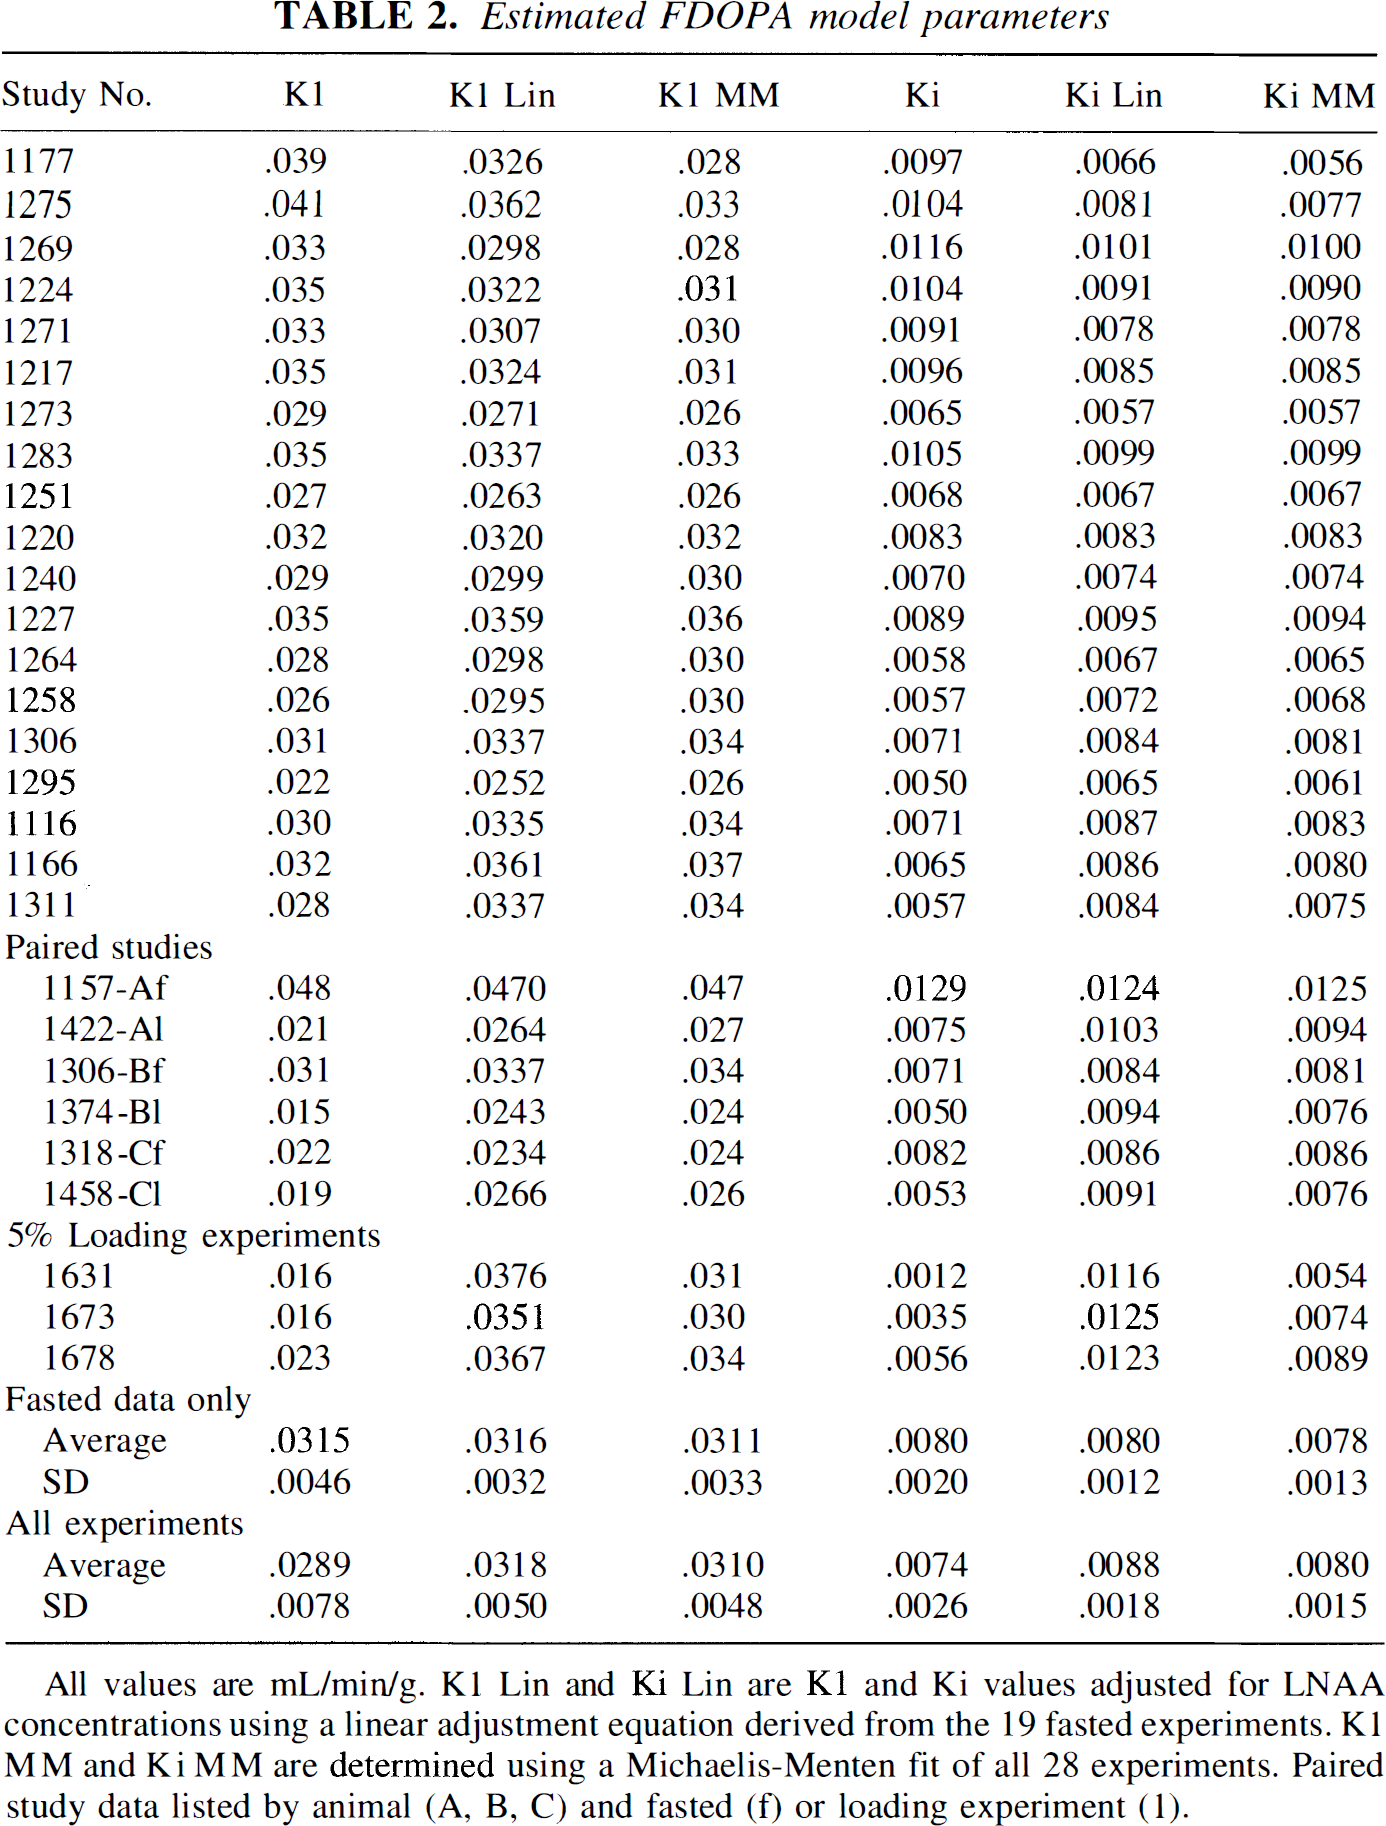
Total LNAA concentrations averaged 426 μmol/L (124 SD) for 19 overnight fasted animals. Ki and K1 values averaged 0.0080 mL/min/g (0.002) and 0.0315 mL/min/g (0.0046), respectively (Table 2). Ki was inversely correlated with LNAA (Ki = 0.013−1.24e−5 * [LNAA], r2 = 0.62, Fig. 2). The MM model fit did not significantly improve the fit compared with the linear fit (Vmax = 6.1, Km = 354, r2 = 0.57, P > .05 by F-test). K1 was also inversely correlated to LNAA concentrations (Ki = 0.043–2.6e–5 * [LNAA], r2 = 0.51) and also was not improved with a MM model fit (Vmax = 37.6, Km = 776, r2 = 0.54, P > .05 by F-test).
K1 and Ki values with associated plasma large neutral amino acid concentrations for 19 animals. Dashed lines are linear fits, solid lines are Michaelis-Menten fits, see text for fitting results. Estimated FDOPA model parameters All values are mL/min/g. K1 Lin and Ki Lin are K1 and Ki values adjusted for LNAA concentrations using a linear adjustment equation derived from the 19 fasted experiments. K1 MM and Ki MM are determined using a Michaelis-Menten fit of all 28 experiments. Paired study data listed by animal (A, B, C) and fasted (f) or loading experiment (1).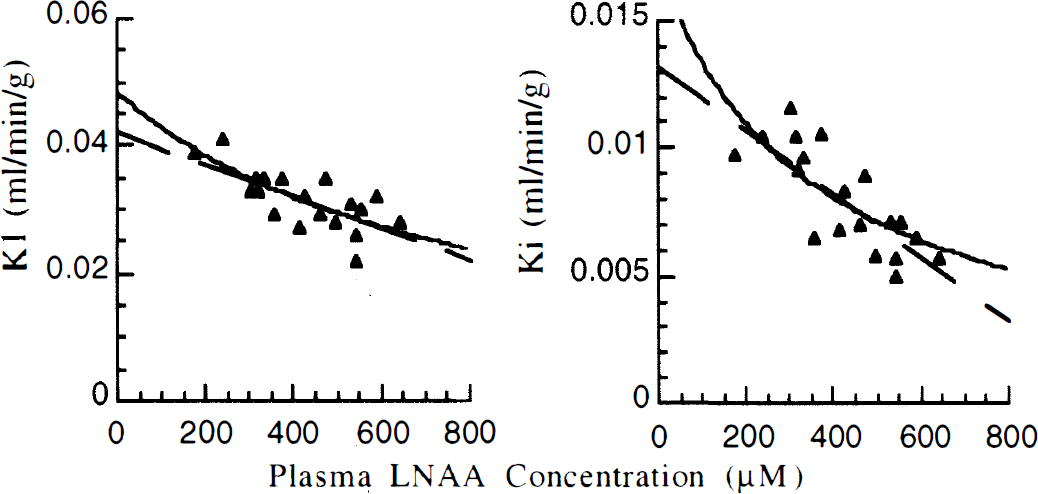
A fit including data from all experiments (19 fasted, 6 paired experiments, and 3 LNAA loading experiments) increased the linear LNAA correlation with Ki by 17% (Ki = 0.012 − 8.68e − 6 * [LNAA], r2 = 0.69), and the MM fit by 11% (Vmax = 5.9, Km = 310, r2 = 0.64, Fig. 3). Similar measures were obtained for K1 using a fit with all the experimental data, (Ki = 0.042 − 2.38e − 5 * [LNAA], r2 = 0.59 and Vmax = 28.7, Km = 502, r2 = 0.63). The addition of a diffusion component, Kd, in the MM model did not significantly alter the fitting results, as assessed by the lack of increase of the correlation coefficient using a F-test at P > .05 level.
Large neutral amino acid concentrations and Ki values for all 28 PET experiments, including six large neutral amino acids (LNAA) loading experiments. Michaelis-Menten (solid) and linear (dashed) fits of the data are shown.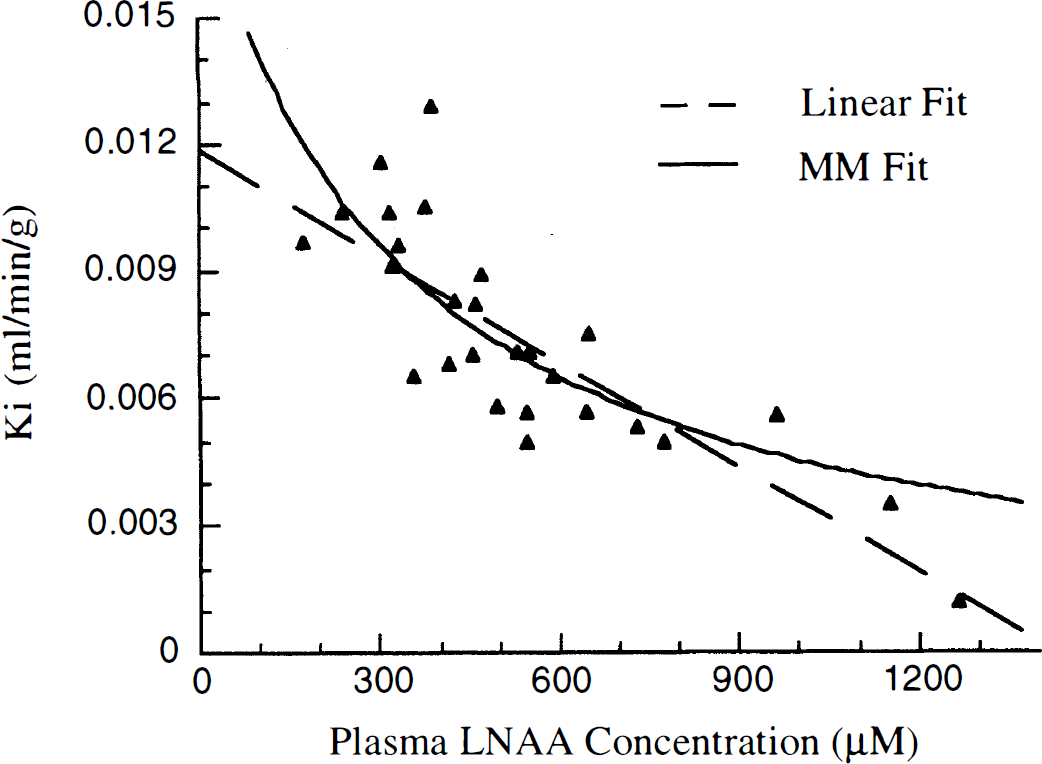
LNAA adjustment results
Ki values were adjusted for plasma LNAA concentrations by the use of the fits shown in Fig. 2. The linear adjustment used the following equation:
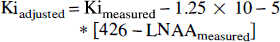
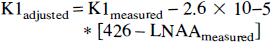
The adjusted Ki values are shown in Table 2. These adjusted Ki values correspond to uniform plasma LNAA concentration of 426 μmol/L, which is the average LNAA concentration in the 19 fasted animals. The SD of the adjusted Ki values among the 19 fasted studies decreased from 0.0020 mL/min/g to 0.0012 mL/min/g, representing a 40% decrease in data variability. Similarly, when the K1 values were adjusted for plasma LNAA using the following equation, K1 variability decreased from 0.0046 mL/min/g to 0.0032 mL/min/g, a 30% decrease in the SD.
Based on the relationship Ki = K1 * k3/(k2 + k3), if Ki values were calculated using the K1 values adjusted for LNAA, a significant residual correlation (Ki = 0.0097 − 3.5e − 6 * [LNAA], r2 = 0.24, P < .01) remained between LNAA concentrations and the K1 adjusted Ki values (Fig. 4).
Calculated Ki values adjusted for LNAA using MM adjusted K1 values.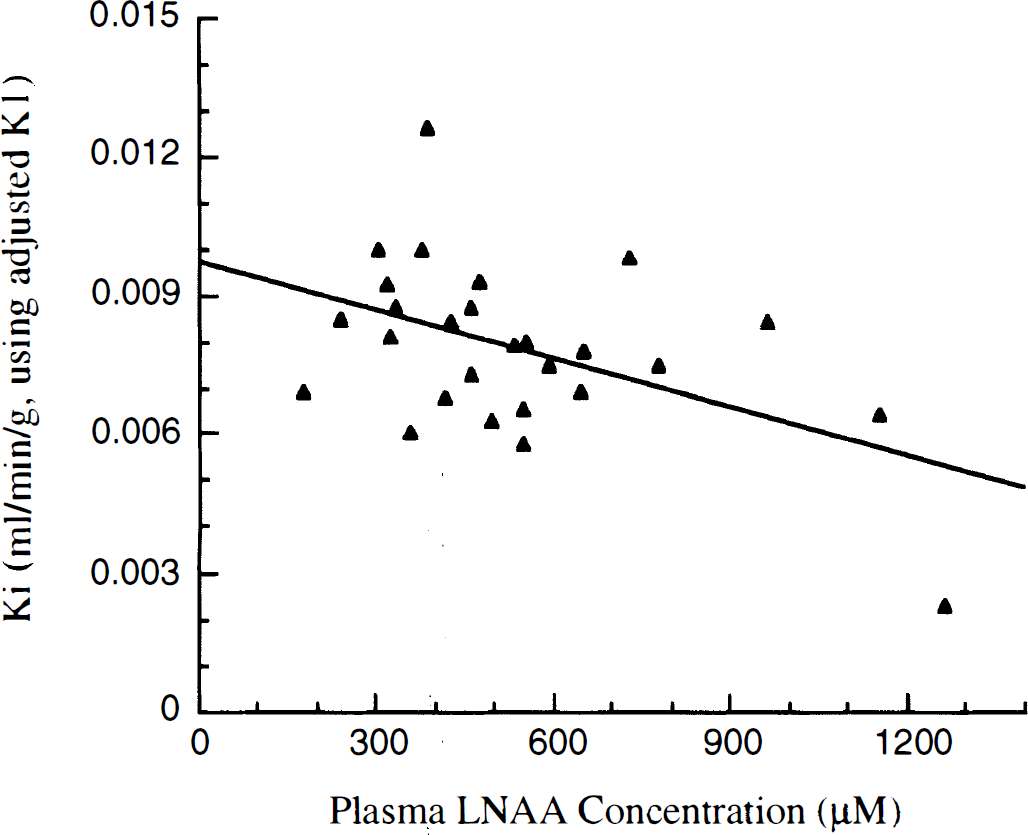
LNAA fractions unchanged with amino acid loading
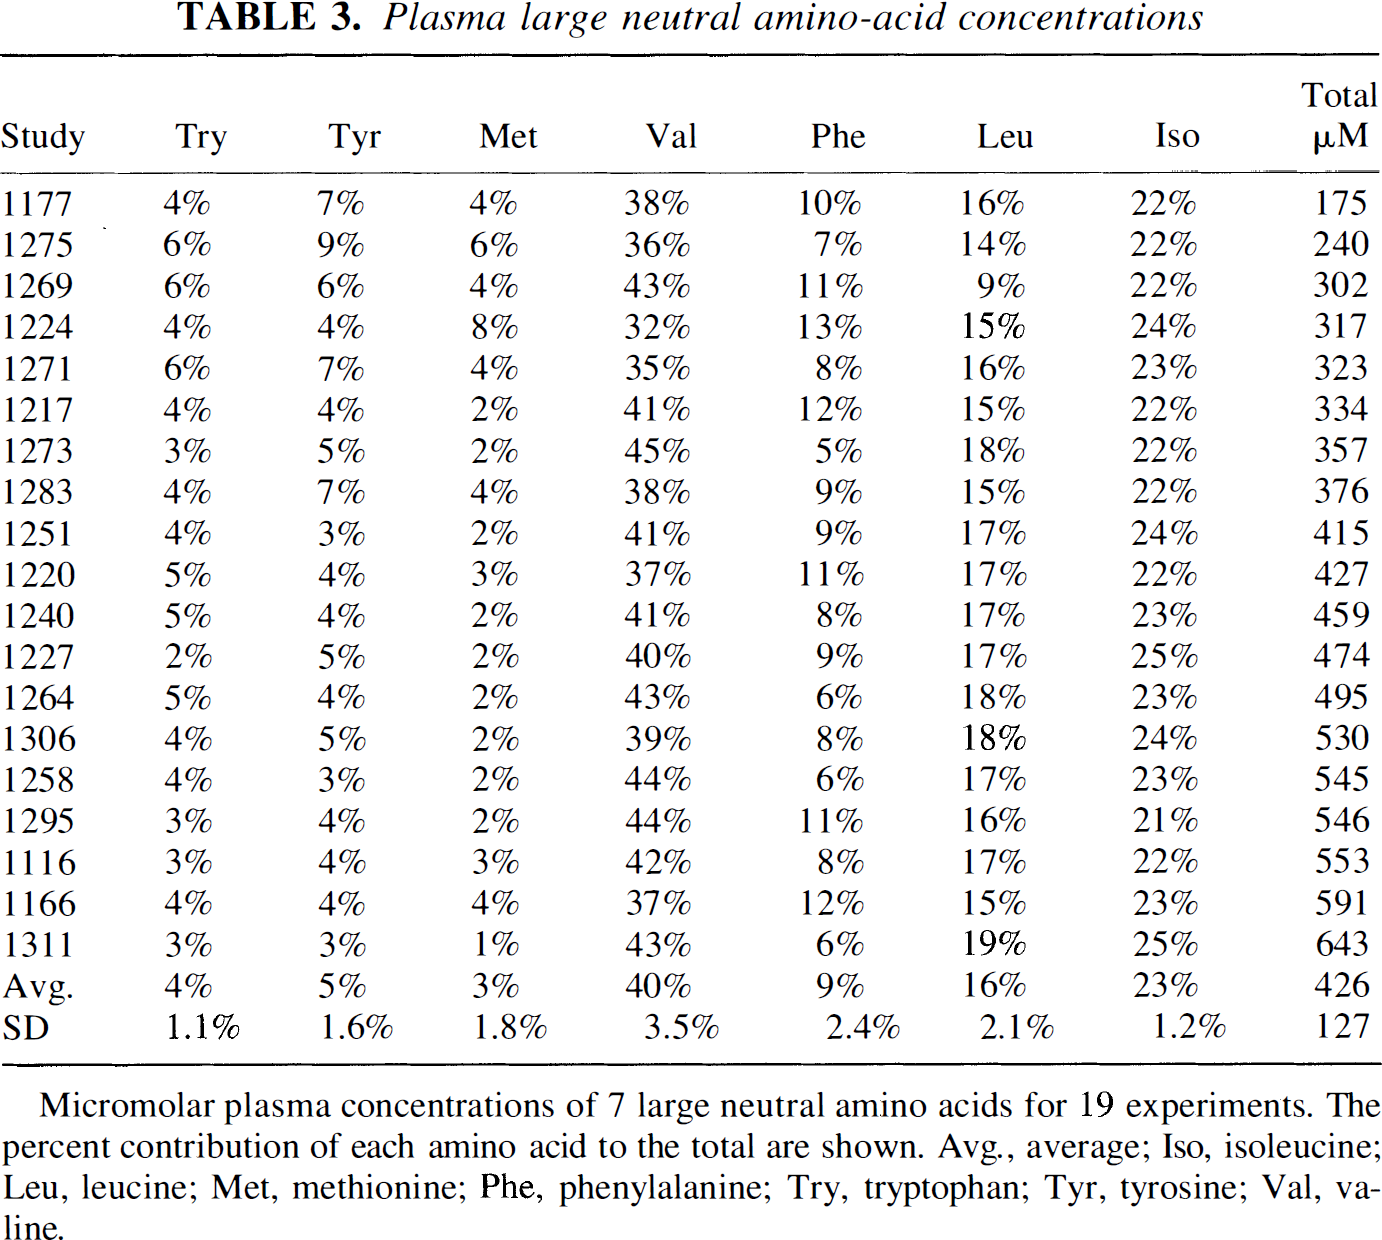
The relative fraction of each LNAA was compared for all 19 fasted animals (Table 3). The ratio of each amino acid to the total was found to be stable (SD 1.1 to 3.5%). The LNAA loading experiments increased total LNAA concentrations 25% to 190% above the fasted measurements (Table 1). The ratio of fasted total plasma LNAA concentrations to loaded LNAA values are shown in Fig. 5. Over the duration of the six LNAA loading experiments, the percent contribution for each LNAA remained nearly unchanged for all LNAA. There were small, significant changes (P < .05) in the fractions of methionine (+2%) and valine (–5%) during amino acid loading compared with the fasted measurements. For each LNAA loading experiment, the plasma samples from all time points had nearly identical fractional LNAA values. The differences were ~1%, which was at the limit of the measurement sensitivity.
Ratios are LNAA concentrations measured after amino acid loading compared to fasted LNAA measurements. The left graph shows data from 2.5% Travasol loading experiments, the right graph from 5% loading experiments. See Table 1 for infusion rates. Plasma large neutral amino-acid concentrations Micromolar plasma concentrations of 7 large neutral amino acids for 19 experiments. The percent contribution of each amino acid to the total are shown. Avg., average; Iso, isoleucine; Leu, leucine; Met, methionine; Phe, phenylalanine; Try, tryptophan; Tyr, tyrosine; Val, valine.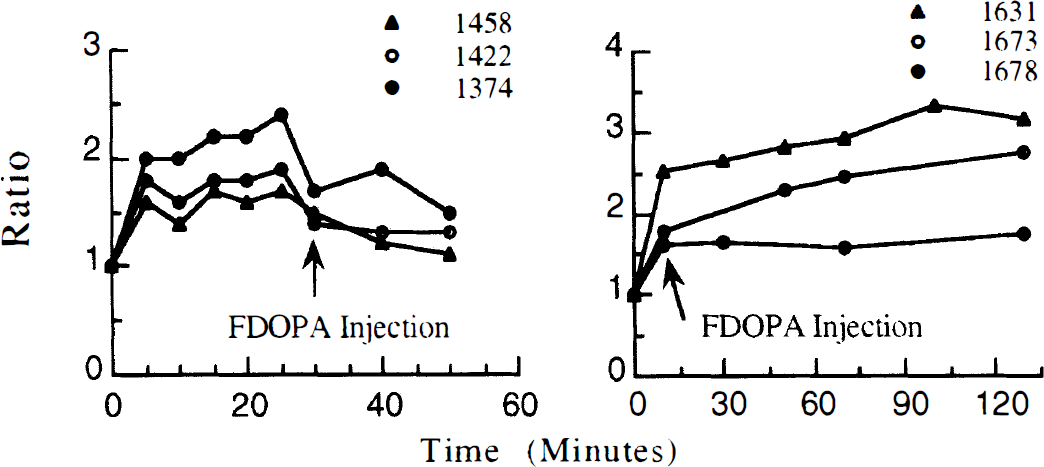
LNAA adjustment validation experiments
Paired experiment Ki data
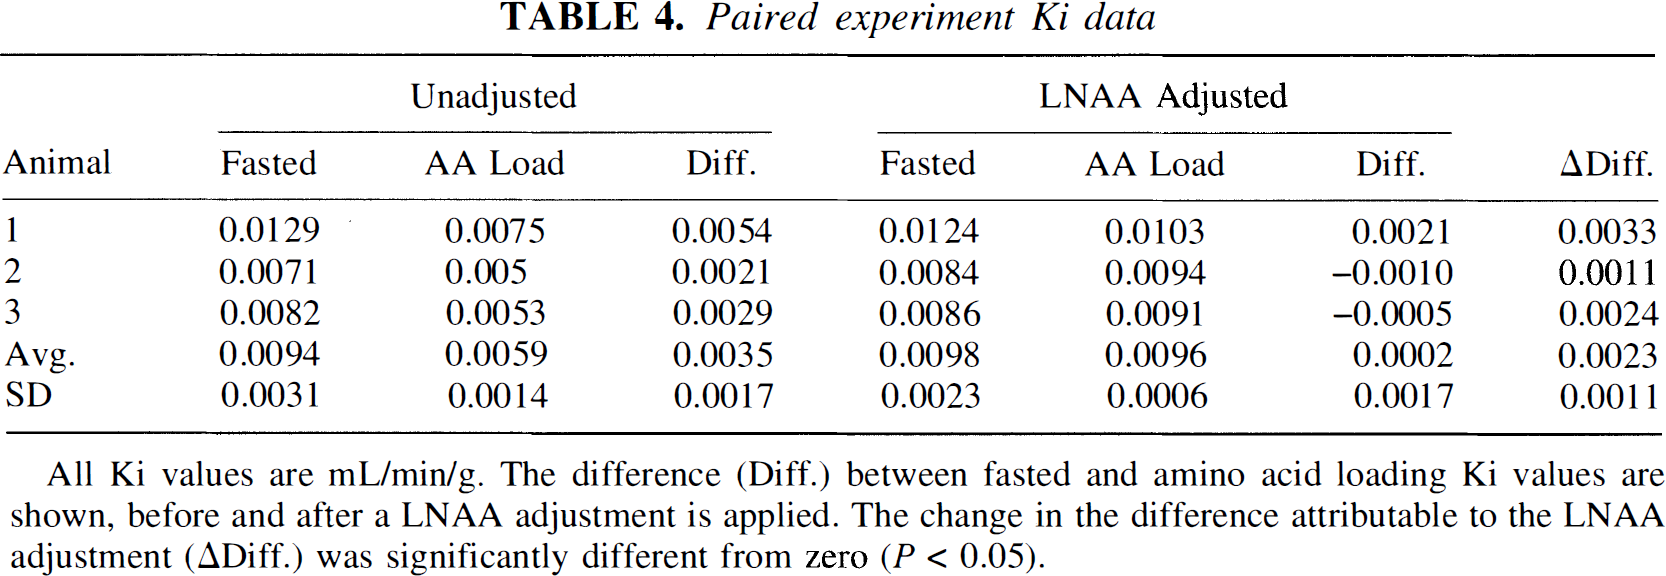
All Ki values are mL/min/g. The difference (Diff.) between fasted and amino acid loading Ki values are shown, before and after a LNAA adjustment is applied. The change in the difference attributable to the LNAA adjustment (ΔDiff.) was significantly different from zero (P < 0.05).
Striatum-cerebellum ratios
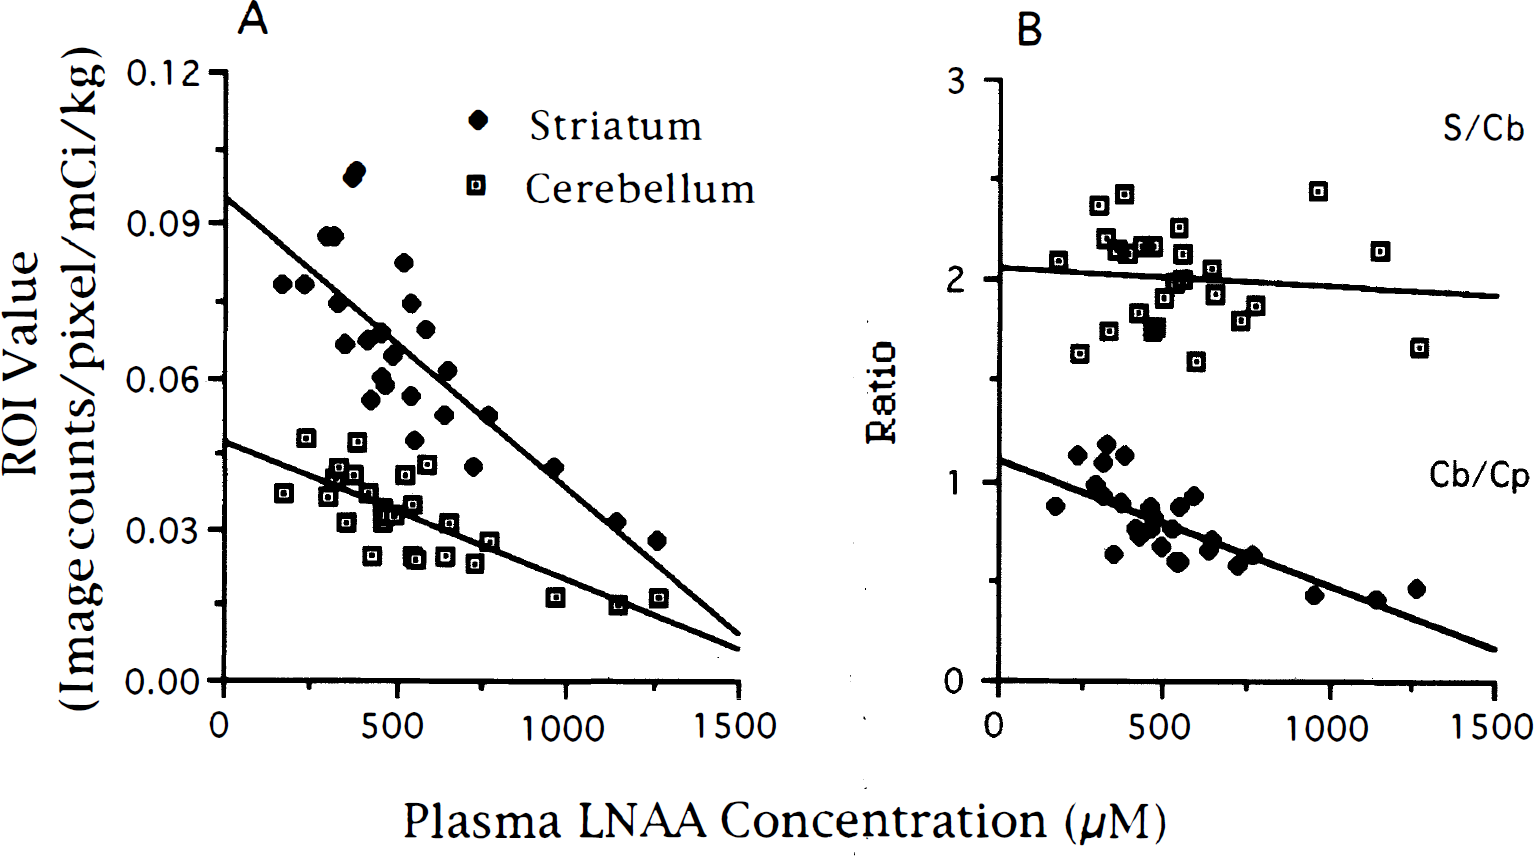
The ratio of striatum to cerebellum (S/Cb) was determined at the end of each experiment. Figure 6A shows the individual ROI values for all experiments, normalized for weight and dose. The correlation equations were striatal ROI (Image counts/pixel) = 0.096 − 0.000057 * [LNAA], r2 = 0.64 and cerebellar ROI = 0.047 − 0.000027 * [LNAA], r2 = 0.60. The S/Cb ratio is shown in Fig. 6B, along with the cerebellar value divided by the weight and dose adjusted plasma FDOPA + OMFD (Cp) at 120 minutes. The S/Cb ratio had no correlation with LNAA concentrations (r2 = 0.007) whereas the cerebellum to plasma ratio was related by the equation Cb/Cp = 1.11 − 0.00063 * [LNAA], with r2 = 0.59. The average value for the Cb/Cp ratio was 0.77 for all experiments, 0.84 for all fasted experiments. The peripheral FDOPA metabolism was unaffected by amino acid loading, with all fractions of FDOPA and OMFD of the loading experiments within one SD of the fasted values at all measurement times.
DISCUSSION
LNAA correlation with kinetic parameters
The variability of FDOPA Ki values has been examined earlier (Vingerhoets et al., 1996; Pate et al., 1991). However, the contribution of variations in LNAA concentrations within the normal physiologic range to the Ki variability has not been addressed. The present work shows a significant inverse correlation between LNAA and FDOPA K1 and Ki values at normal physiologic amino acid concentrations. These findings are in agreement with the theory that FDOPA competes with LNAA for a common saturable BBB transporter site. Using this correlation to adjust the rate constants K1 and Ki, their dependency on the plasma LNAA concentrations can be reduced. The resulting values have a significantly lower SD, thereby improving the sensitivity of FDOPA for measuring central dopaminergic function.
LNAA administration
The sensitivity of FDOPA quantitation to the plasma LNAA concentrations (Fig. 3) suggests that plasma concentrations must be kept stable during FDOPA uptake to model transporter competition effects. If a higher LNAA concentration is desired, care must be exercised to achieve and maintain a constant level. Bolus injections produce a rapid elevation of plasma amino acid concentration, followed by a decrease over several hours. To minimize the changing concentrations associated with a bolus delivery of amino acids, we used the bolus/infusion method previously described by Carson et al. (1993). Using this method, we quickly established stable, increased LNAA concentrations in six vervet monkeys. The concentrations of LNAA were measured at several times during the LNAA loading experiments (Fig. 5).
Previous amino acid loading experiments have used either a single bolus injection (Koeppe et al., 1991; Wade et al., 1975; Hammerstad et al., 1993; Hartvig et al., 1993; Smith et al., 1987) or various injections of multiple LNAA (Leenders et al., 1986; Alexander et al., 1994) to increase amino acid concentrations. The amino acid levels reported were either the injected quantities, single measurements, or values determined from hourly sampling during the experiments. The kinetics of the LNAA concentrations during the uptake of the tracer were not determined. In contrast to previous work that showed a qualitative inverse relationship between LNAA concentrations and FDOPA uptake, the present investigation characterizes quantitatively the relationship between normal physiologic LNAA concentrations and FDOPA uptake. Additionally, we have showed the necessity of accurate LNAA plasma determinations, both for loading and fasted experiments, in order to remove the LNAA dependency from quantitative FDOPA measurements.
In addition to the complication of using a bolus injection, other factors are known to effect plasma LNAA concentrations, including anesthesia (Sage et al., 1979; Berglund et al., 1991), time of day (Fernstrom et al., 1979; Wurtman et al., 1968; Scriver et al., 1985), and individual metabolic variations (Scriver et al., 1985; Berglund et al., 1991). These factors are minimized in the present work by measuring the LNAA concentration during FDOPA uptake.
LNAA adjustment validation: paired experiments
To test the validity of using the Ki-derived adjustment, we examined three animals both with and without amino acid loading. A comparison of results from fasted versus amino acid loading experiments is made in Table 4. Unadjusted Ki values dropped by an average of 36% with the increased LNAA levels. Using a linear-based adjustment derived from LNAA and Ki data in Fig. 4, applied to both the fasted and elevated PET studies, the Ki variation between these two experiments was markedly reduced for each of the three animals (Table 4). This significant decrease in Ki variability shows that the model is useful for removing the LNAA dependence and increases measurement precision.
K1 is not sufficient to describe LNAA effects
Using the LNAA effects on K1 alone to adjust the Ki value resulted in values still correlated to LNAA concentrations (Fig. 4). This suggests that additional components (i.e., in addition to the LNAA effect on K1) may be needed to adequately describe the LNAA effects on the estimated Ki values. If k2 is also affected by plasma LNAA similar to K1, Ki would have had a lower dependency on LNAA than K1, instead of the larger dependency as determined in the present work. Because k3 is the aromatic amino acid decarboxylase rate for FDOPA inside the neuron, the passage of the tracer across the neuronal membrane is not explicitly accounted for in the FDOPA model. It is conceivable that the higher LNAA concentrations may also inhibit transport at a neuronal transporter (Barrio et al., 1997). However, with the present data no correlation of either k2 or k3 with LNAA concentrations was clearly demonstrable, which indicates the need for further work to address this issue.
Although the K1 correlation was not sufficient to remove all the LNAA dependency, it does account for a large portion of the Ki correlation. An adjustment based on the Ki correlation, however, best describes the LNAA dependency on the FDOPA uptake.
Although there is some controversy over the correlation of age with Ki values (Eidelberg et al., 1993; Scherman et al., 1989), recent work with FDOPA and [F-18]phenylalanine (Kuwabara et al., 1995; Ito et al., 1995) indicates that K1 does not change with aging. This suggests that the K1 component of the LNAA adjustment can appropriately be applied to data acquired from animals of all ages. The limited range of animal ages used in the present work (7.7 ± 3 years) indicates no correlation of plasma LNAA concentrations, K1, or Ki with age; however, the age range is not sufficiently wide to clearly characterize any age dependency.
Michaelis-Menten kinetics versus linear fit
Carrier-mediated transport, including FDOPA and LNAA BBB transport, is expected to follow MM kinetics. Because the difference between a linear and MM fit was not significant (P < .05) for the nonloading experiments, three animals were tested using a high LNAA loading to examine the fit over a wider range of amino acid concentrations.
Based on a linear fit of the fasted PET data, the adjusted Ki values for the three highest LNAA loading studies were significantly higher (38%, P < .01) than the average fasted Ki value. The MM- derived adjustment produced Ki values 9% lower than the average, which was not significantly different from the average fasted Ki value (P > .5). Similar results were determined for the K1 rate constants. This suggests that the LNAA dependency is best described using MM kinetics, especially over a wide range of LNAA concentrations. Further evidence supporting the MM model is that the original MM fit remains relatively unchanged with the inclusion of all the LNAA loading experiments. Although the MM fit was best for a wide range of LNAA concentrations, in the normal physiologic range, a linear fit reasonably approximates the data. The adjusted K1 and Ki values based on either fitting results are comparable for the set of studies without LNAA loading.
The addition of a diffusion parameter in the MM fit did not alter the fitting results. Estimates of the diffusion parameter (Smith et al., 1987; Wade et al., 1975) indicate that diffusion would not be a significant component in the LNAA concentration range of the present experiments [175 to 1265 μmol/L, significantly lower than the 2-mmol/L level necessary for the diffusion component to reach ~10% (Smith et al., 1987)].
Individual amino acid binding affinities for the LNAA transporter vary widely (Oldendorf et al., 1971). The possibility exists that a change in the relative concentrations of the various amino acids could alter the rate constants owing to their different affinities. For the MM modeling of the present study, the Km is assumed to be a lumped constant for all seven LNAA, although each amino acid has its own transporter affinity (Hargreaves et al., 1988).
In the fasted studies, the ratio of each individual amino acid to the total LNAA concentration was stable among all the animals. Even for the relatively high amino acid loading experiments, the fractions of the seven LNAA remained nearly unchanged compared with the fractions of the fasted studies. Furthermore, the fractions of each amino acid also remained stable over the course of each loading experiment. This indicates that the LNAA concentrations in the Travasol solution are appropriately matched to the in vivo concentrations, that the MM model with a single Km value can be used, and that a summed LNAA concentration is an appropriate parameter for adjusting the K1 and Ki values. Attempts to calculate a weighted Km value using individual amino acid Km's determined from rat brain uptake indices measurements (Smith et. al., 1987) and the equation below (3), produced a Km estimate of 42 μmol/L, well below the value of 310 μmol/L estimated for Ki from our data.
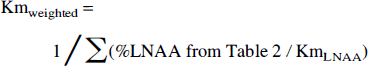
Although species differences cannot completely be discounted, the difference in Km values may be attributed to the methodologic differences in the Km determination.
Striatum-cerebellum ratios
An alternative approach to assessing FDOPA activity is the use of the S/Cb ratio. As shown in Fig. 6B, the ratios are independent of LNAA concentrations. Figure 6A, however, shows that the striatal and cerebellar values are correlated with LNAA concentrations. The ratios appear unaffected because the LNAA concentration affects both striatum and cerebellum in approximately the same magnitude. The striatal and cerebellar values used to measure these ratios are correlated with LNAA concentrations. This suggests that factors which alter only the specific or nonspecific dopaminergic distributions will produce ratios that do not accurately reflect the status of the dopaminergic activity in the striatum.
Using conventional wisdom it is difficult to explain the decrease in cerebellar values with increasing LNAA concentrations. The Cb/Cp ratio shown in Fig. 6B mainly indicates the distribution of OMFD at the time of the determination (2 hours after FDOPA injection). The average Cb/Cp ratio (0.77) agrees well with the ratio of 0.677 reported in human occipital cortex using OMFD as an imaging agent (Dhawan et al., 1996). That the cerebellum OMFD concentration is reduced at higher LNAA concentrations implies a reduction in the volume of distribution for the FDOPA metabolite. The reduced cerebellum to plasma ratio became stable in all cases starting at approximately 15 minutes after FDOPA injection and remained constant for the remaining 105 minutes of the experiment, suggesting that equilibrium has been achieved. A possible explanation for the decrease in distribution volume could be that the forward and reverse BBB transport are differentially effected by LNAA concentrations. The nature of the specific and nonspecific distribution of FDOPA and OMFD in brain tissue thus warrants further investigation.
CONCLUSION
Variations in the normal physiologic plasma concentrations of LNAA in fasted vervet monkeys have a marked effect on FDOPA quantitation. Using the correlation between the plasma LNAA levels and FDOPA Ki values, it is possible to characterize and remove the dependency of Ki on plasma amino acid concentrations. An adjustment for LNAA concentrations derived from a linear or MM fit of the K1 and Ki data significantly reduced the variability of the data. Both K1 and Ki standard deviations were lowered by about one third using the LNAA adjustment. The reduction was even greater with the increased LNAA concentrations. The LNAA adjustment decreases the variability and improves the precision of FDOPA quantitation for the assessment of central dopaminergic function.