
Abstract
A nuclear magnetic resonance study of the middle cerebral artery occlusion in the rat is presented. Experiments were performed on seven animals before and after occlusion, which occurred in situ. The emphasis in this study was on evaluating rapid proton spectroscopic imaging. Data were acquired with experimental durations of between 4 and 15 minutes for a 32 by 32 spatial matrix, with 64 spectroscopic data points per spatial element. The spectroscopic data were interleaved with diffusion-weighted nuclear magnetic resonance water images of the same slice. The study was terminated at about 6 hours after occlusion. The brains were then frozen in liquid nitrogen for biochemical imaging. The results showed that the signal from N-acetyl aspartate decreased and that of lactate increased within the infarcted region. The temporal course of these intensity changes varied between animals. Nineteen cortical spreading depressions (CSD) were observed by electrophysiologic monitoring during the experiments. Of these, 11 could be unambiguously detected in the lactate images, and a further 3 were on the threshold of detectability. As only a single slice could be examined, it is possible that the centers of depression for the remaining 6 CSD were outside the slice. To the authors' knowledge, this is the first report of the measurement of CSD using proton spectroscopic imaging. Thus, it is shown that this method is valuable not only in following the continuous evolution of proton metabolites with a good spatial and temporal resolution, but also in observing transient phenomena which are believed to play an important role in the expansion of the infarcted territory.
Keywords
The middle cerebral artery occlusion (MCAO) model of cerebral infarction in the rat is widely used for studying the pathophysiology of infarct development during the period immediately after insult. In particular, nuclear magnetic resonance (NMR) imaging techniques in which the contrast is determined by the apparent diffusion coefficient have become the method of choice for monitoring early cerebral infarction (Moseley et al., 1990; Mintorovitch et al., 1991) and have been used to follow the development of the surrounding penumbric region (Hoehn-Berlage et al., 1995a). It has also proven possible to use diffusion-weighted NMR imaging (DWI), to observe the passage of cortical spreading depression (CSD) both induced by the external application of substances such as KCl to the cortex (Latour et al., 1994; Busch et al., 1996) or arising spontaneously from an infarction (Gyngell et al., 1994, Gyngell et al., 1995; Röther et al., 1996). CSD have been implicated in the expansion of the infarcted territory in animal models (Mies et al., 1993).
The proton NMR spectrum undergoes marked changes during cerebral infarction. In particular, the concentration of lactate, which is undetectable in the resting healthy brain, increases to detectable levels (Berkelbach van der Sprenkel et al., 1988), and may become the strongest metabolite signal. It has also been widely reported that the concentration of the neuronal marker (N-acetyl aspartate [NAA]) decreases (Berkelbach van der Sprenkel et al., 1988; Bruhn et al., 1989), and in studies on humans in the chronic state, the NAA concentration has been demonstrated as correlating with the clinical outcome (Federico et al., 1996). Increased lactate levels during CSD have recently been reported using a single-voxel method (Gyngell et al., 1995).
Proton spectroscopy has an intrinsically lower sensitivity than water imaging, hence, most experiments have been performed using either single voxel methods, which have a good temporal but a poor spatial resolution, or using the classical spectroscopic imaging (SI) experiment (Brown et al., 1982; Maudsley et al., 1983), which in the rat brain has been shown capable of 3 μL spatial resolution but requires a minimum experimental duration of about 15 minutes for a spatial matrix with 322 elements. Faster methods exist, and are generally based on single shot imaging experiments, such as spectroscopic echoplanar imaging (Mansfield, 1984, Guimares et al., 1993, Posse et al., 1994), spectroscopic spiral scanning (Adalsteinsson et al., 1995), or spectroscopic U-FLARE (Norris et al., 1992; Norris and Dreher, 1993). It is possible with these to reduce the minimum experimental duration by at least a factor of four without reducing the spatial resolution, and high quality spectra have previously been obtained from the rat brain using the spectroscopic U-FLARE technique. This study characterizes the first 6 hours post-insult of the MCAO model in the rat using this method. Particular attention is given to the temporal resolution required both for the continuous evolution of metabolite signal intensities, and for the transient changes associated with spontaneous CSD.
METHODS
Animal model
Male Wistar rats (350 to 400 g body weight; n = 7) were anesthetized with 0.8 to 1% halothane in a 7:3 N2O:O2 mixture, tracheotomized, and mechanically ventilated for the whole duration of the experiment. Blood samples for gas analyses were obtained at regular intervals via an arterial catheter. Pancuronium bromide (0.3 mg/kg/h) for muscle relaxation was administered through a venous catheter. Body temperature was recorded with a rectal thermometer and maintained at 37 °C with a feedback-controlled warm water blanket. The animals were placed in a non-magnetic stereotaxic head holder for accurate positioning in the magnet. For recording of EEG and direct current potential throughout the whole NMR experiment, the skull was exposed by a midline incision and thinned to approximately half its thickness over the frontoparietal cortex, 2 mm posterior and lateral of the bregma for placement of the active electrode. The reference electrode was set on the nasal bone. The electrophysiologic recordings were performed with two specially designed calomel electrodes connected to the skull by a saline-rinsed cotton wool ball. The design of the calomel electrodes kept the platinum wires distant from the NMR imaging planes to avoid artifacts in the NMR data (Busch et al., 1995).
Focal ischemia was induced by intraluminal occlusion of the middle cerebral artery (MCA), as described in detail elsewhere (Kohno et al., 1995a). Preparation of the vessels started at the right cervical carotid artery: a 3-0 nylon thread, connected to a wire for the guidance of a catheter, was inserted into the internal carotid artery through the immobilized proximal end of the external carotid artery. The diameter of the coated suture tip (0.28 mm) was chosen to achieve complete occlusion of the MCA exit of the intracranial carotid artery (Kohno et al., 1995a). This arrangement permitted the manipulation of the thread position from outside the magnet to allow control measurements without the need to reposition the animal as is necessary if occlusion takes place outside the magnet. The success of the occlusion was confirmed by a sudden decrease in the EEG amplitude.
Biochemical and histologic imaging
Brains were removed from the skull in a cold box at −20 °C, and sliced at the same temperature into 20-μm sections, using a cryostat microtome. Coronal sections were processed for regional tissue pH, using the umbelliferone fluorescence technique of Csiba et al. (Csiba et al., 1983), and for the regional distribution of ATP by evoking substrate-specific bioluminescence (Paschen, 1985).
pH images were calibrated with graded pH standards. Local metabolite content was quantified by correlating the optical densities of bioluminescence images with metabolite concentrations, measured in small tissue samples by conventional enzymatic analysis.
In pH images, tissue acidosis was defined as the decrease below pH 6.3. In the ATP images, impaired metabolism was defined as a decrease to 30% of the value of the contralateral hemisphere.
NMR measurement protocol
Measurements were performed with the spectroscopic U-FLARE technique which has been fully described elsewhere (Norris and Dreher, 1993) and using the following parameters: field of view (FOV) 32 mm, slice thickness 3.5 mm, echo time (TE) 8 msec, sweep width 4.8 kHz, data matrix 32 × 32 (spatial) × 64 (spectral). The time increment in the spectral domain was 1 ms giving a spectral bandwidth of 1 kHz. The sequence acquires one k-space slice per excitation, and requires a two-step phase-cycle, which for a time to repeat (TR) of 1.8 seconds gives a measuring time of 3.8 minutes. The sequence was implemented on a 4.7 T/300 mm Bruker Biospec system. This is retrofitted with Bruker self-shielded magnetic field gradients capable of switching 100 mT/m within 250 μs. Signal transmission was performed using an 80-mm Alderman-Grant resonator, reception followed via an 18-mm single-turn surface-coil placed directly on the head. Water suppression was performed using 3 Gaussian pulses for presaturation. All data were acquired from coronal slices in which the read gradient was parallel to the y-axis. This alignment ensured that leakage of lipid signal, which occurs primarily along the phase-encoding direction was along the x-axis, and hence that the leakage from the regions of high lipid content above the brain was significantly reduced. Data were acquired as a pseudo-echo with an effective TE of 135 ms.
The experimental protocol was as follows: The rat was placed in the magnet with the section 5 mm anterior to the bregma positioned in the isocenter, as this section lies at the center of focal ischemia in the MCAO model. A volume selective shim of about 20 Hz was then obtained from a volume of typically 20 mm (x) by 10 mm (y) by 5 mm (z) using a PRESS sequence (Gordon and Ordidge, 1984). The water suppression was then adjusted. A DWI was subsequently acquired with a b-value of 700 s/mm2 using the single-shot U-FLARE technique. Four averages with a TR of 2 seconds gave an 8 seconds measuring time. Data were acquired on a 128 × 64 matrix from a 32 mm FOV, with a slice-thickness of 2.5 mm. Subsequent to this two spectroscopic U-FLARE data sets were acquired, with the matrix dimensions indicated above. In each case the basic sequence was repeated to give an 8-minute measuring time. Focal ischemia was then induced, and changes were observed over the next 6 hours using DWI and SI. Directly after induction a diffusion image was acquired, and this was repeated every 16 minutes. The first 16 minutes after occlusion were monitored using SI with a 4-minute time resolution. The next 14 SI data sets were acquired with 8-minute resolution, and the last 16 with 16-minute resolution. Experimental circumstances sometimes forced slight modifications to this protocol.
Data processing
Final post-processing was performed on a DEC Alphastation 400 (Digital Equipment Corporation) using programs written in interactive data language (Research Systems Inc., Boulder, CO). The spectra presented were obtained by applying a Hamming filter with a value of 0.6 to the raw data in the spatial dimensions. The same filter, with a value of 0.55 was applied in the spectral dimension and the data zero-filled to 512 points before Fourier transformation.
The same data were also used to produce the SI of NAA and lactate. For these, no zero-filling was applied, and instead of applying the Hamming filter in the spectral dimension, a line-broadening of 5 Hz was used. The images were generated by identifying the position of the spectral line of interest, and summing the intensity of this point, and the two neighboring points. This number of points to sum over was determined empirically by examining the quality of the images produced. The images were then realigned with reference to the DWI to correct for the differing chemical shifts of the metabolites and interpolated for display onto a 128 by 128 matrix using bilinear interpolation.
RESULTS
Physiologic data
Table 1 summarizes the physiologic variables during the whole NMR-study. The parameters were measured before and during the period up to 6 hours after MCAO. During the length of the observation period, all variables were in the normal physiologic range and did not change significantly.
General physiologic parameters
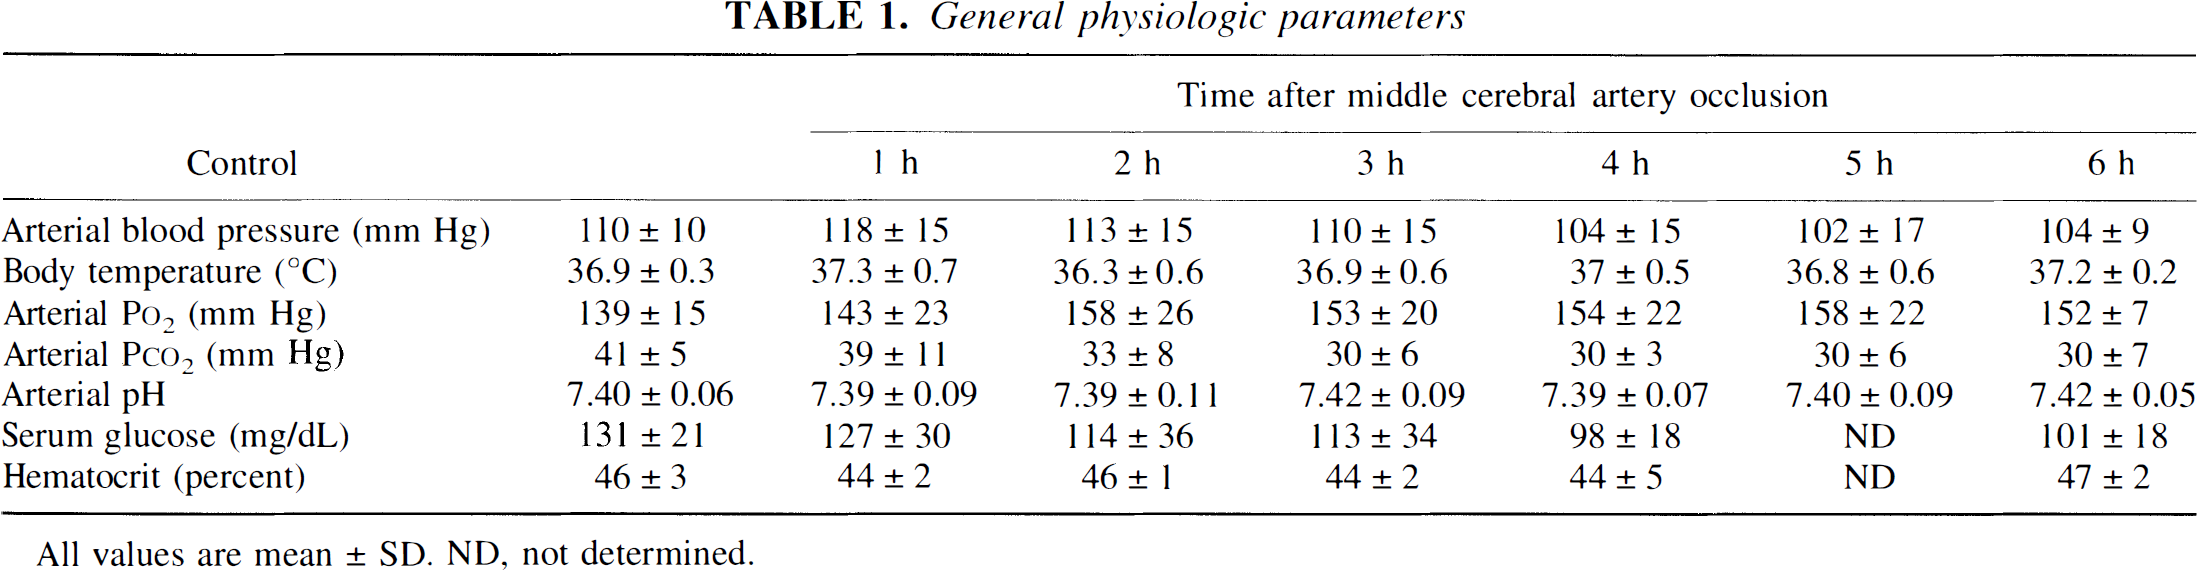
All values are mean ± SD. ND, not determined.
Electrophysiologic recordings
Immediately after advancement of the tip of the filament to the branching-off point of the MCA, EEG amplitude was clearly reduced. Direct current recording revealed in all animals a first transient DC potential shift a few minutes after successful vascular occlusion. Further DC shifts were recorded during the following 6 hours of focal cerebral ischemia as shown in Table 2.
Occurrence of cortical spread depressions and their detection in lactate images
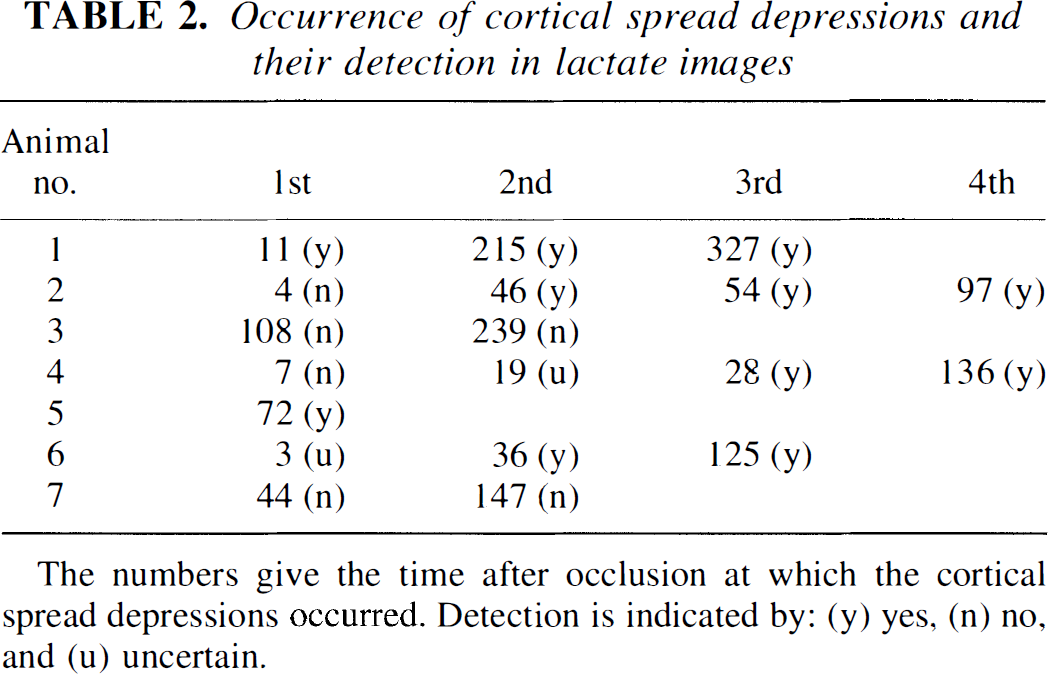
The numbers give the time after occlusion at which the cortical spread depressions occurred. Detection is indicated by: (y) yes, (n) no, and (u) uncertain.
DWI
Within minutes of successful occlusion a hyperintense region appeared in DWI data. The end-state of all seven animals is documented in Fig. 1 which shows the final DWI U-FLARE image alongside the ATP and pH images. Despite the consistent experimental protocol, a significant variation in outcome can be observed: Animals 1, 2, and 4 developed clear infarcts; 3, 5, and 7 showed minimal damage; and 6 showed changes in pH, but no core of infarction. All the animals showed some degree of hyperintensity in DWI images, this being visible from the first image obtained after occlusion. In animals with large ischemic territories the DWI signal intensity increased with time, providing evidence of further tissue deterioration (Hoehn-Berlage et al, 1995b).
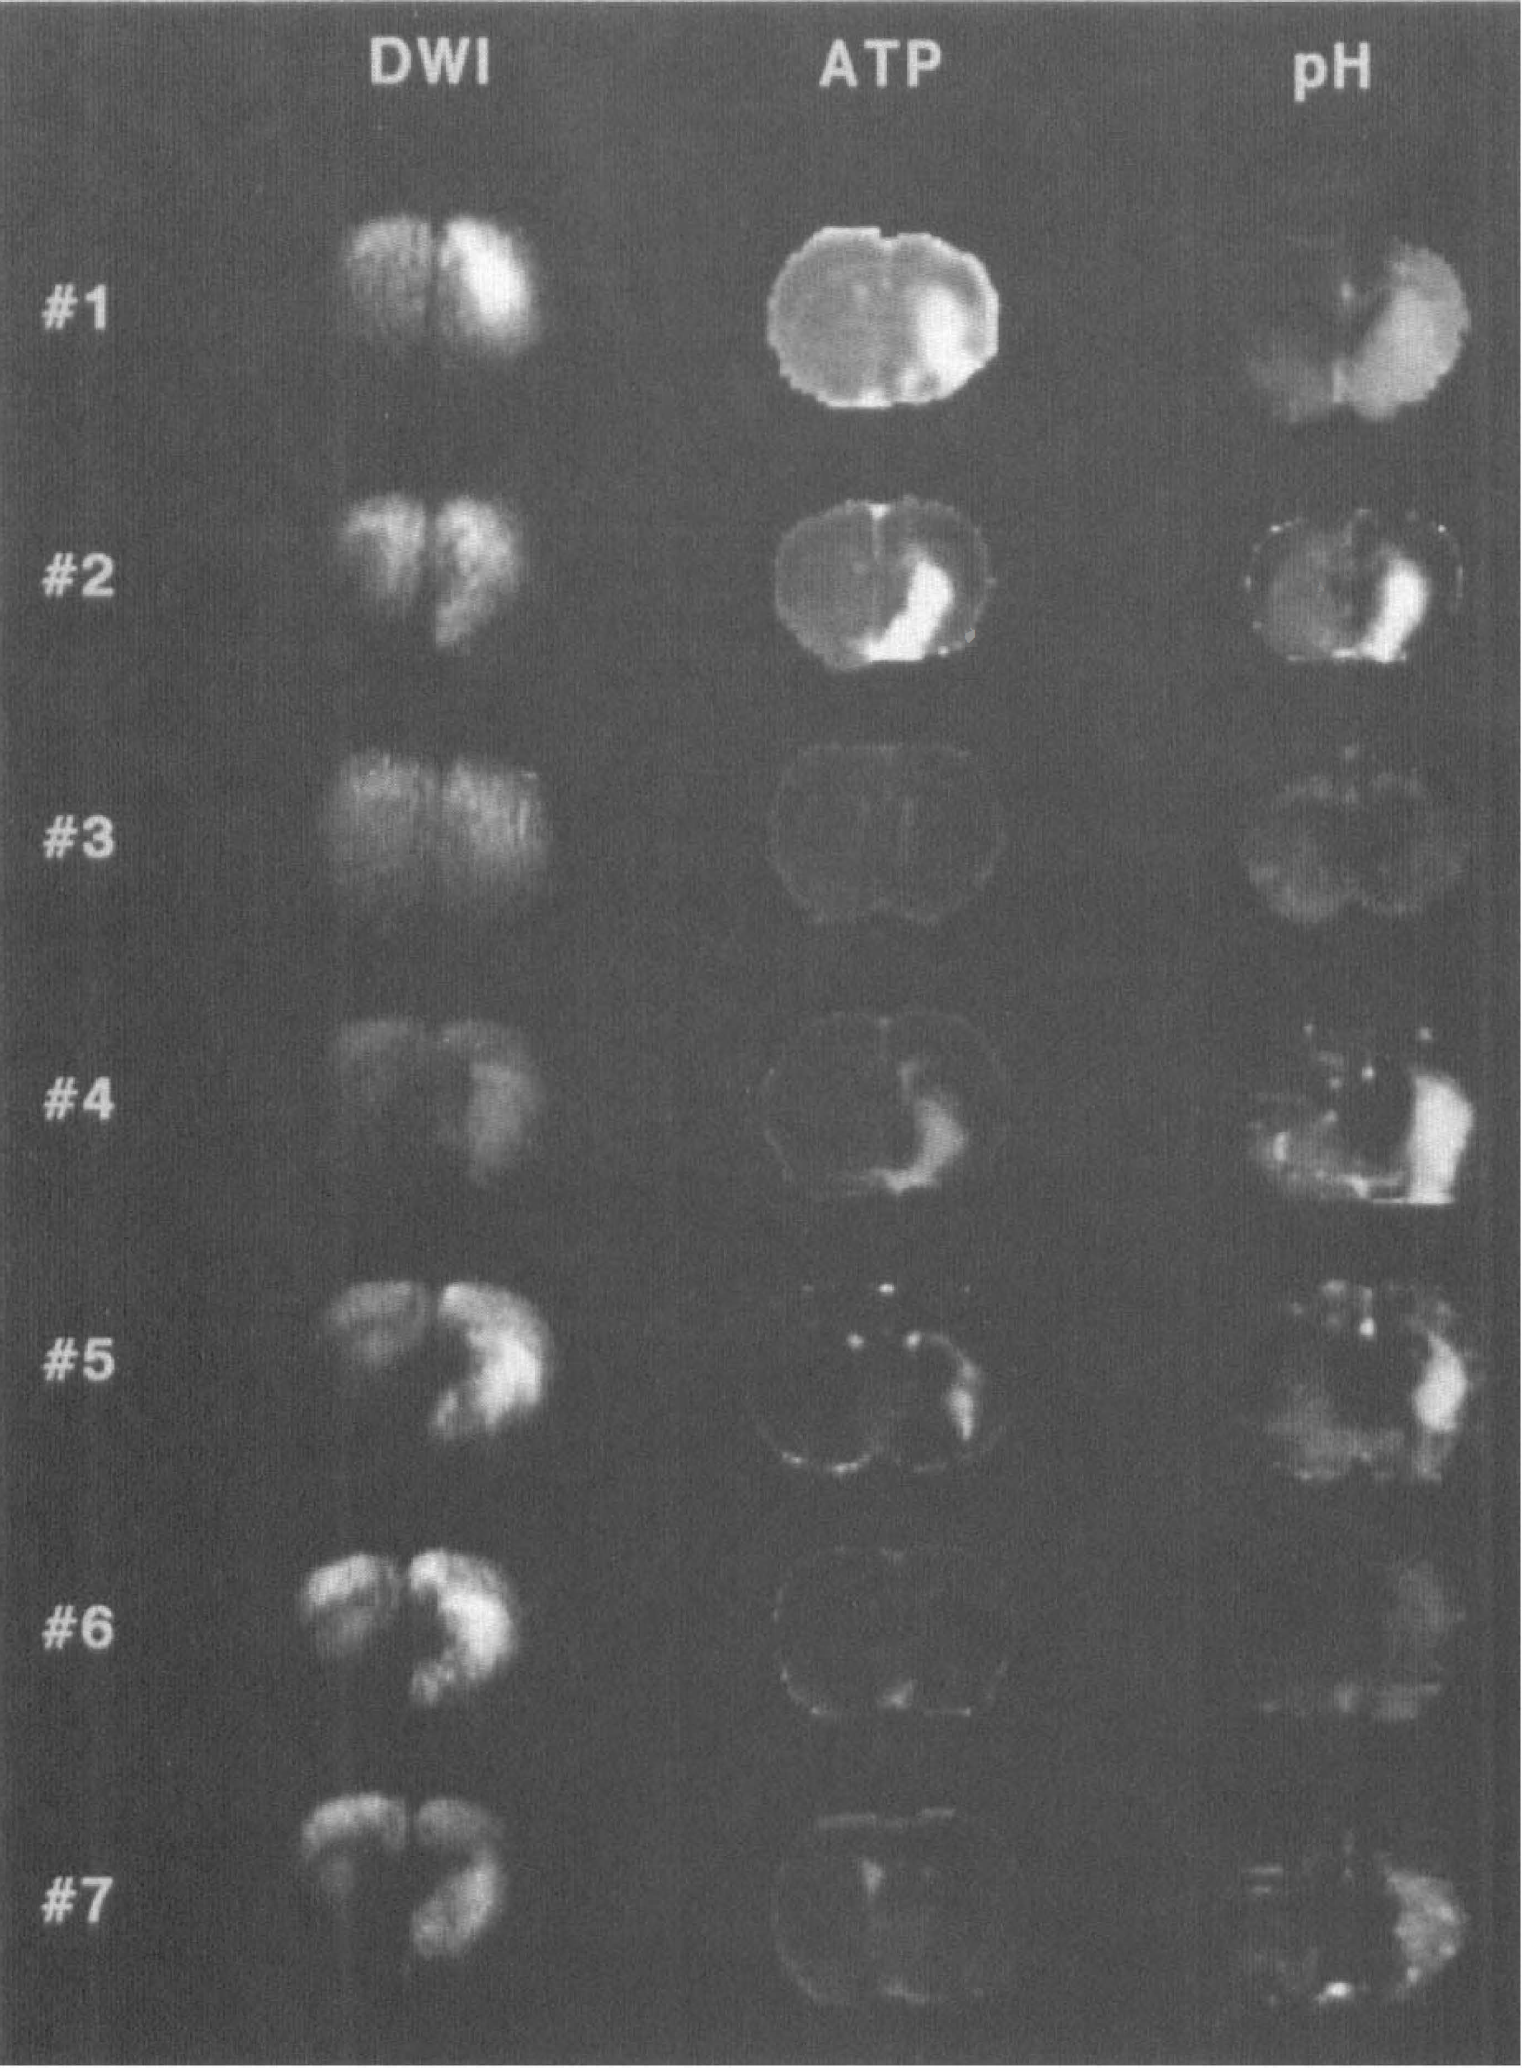
Final state of each animal, documented from left to right with: diffusion-weighted image U-FLARE, ATP and pH images. The methods by which these images were obtained are described fully in the text. The ATP and pH images are obtained from slices that are much thinner than those used for nuclear magnetic resonance (NMR) imaging (3.5 mm), care was however taken to ensure that the slices were obtained from within that used for the NMR image. The difference between the methods used for obtaining the images made slight differences between the aspect ratios unavoidable.
SI
Lactate was detected in spectra from animals 1, 2, 4, 5, and 6, whereas a loss of NAA was only detectable in animals 1 and 4. The lesion in animal 2 was deep-seated resulting in a lower sensitivity owing to the greater distance from the surface coil. As the largest infarcts were found in animals 1, 2, and 4, the data are not inconsistent with an expectation that NAA loss within the first few hours is to be expected in severe infarction, lactate being generated by a lower level of metabolic disturbance.
Figure 2 documents the spectral transition between healthy and infarcted tissue. Figure 2A is a DWI U-FLARE image that shows the contralateral and ipsilateral regions of interest (ROI) from which the spectra in Figs. 2B, 2C, and 2D were obtained. Figure 2B was obtained from the contralateral ROI before occlusion. Figure 2C is from an identical volume in the top left corner of the ipsilateral ROI at the end of the experiment. As expected there is a significant reduction in NAA intensity 350 minutes after insult, and there is a significant increase in the intensity of the lactate signal. The spatial variation in intensity over the infarct territory is shown in Fig. 2D. There is some evidence of lactate leakage, i.e., a high lactate signal in regions where the NAA intensity is not significantly reduced, and by reference to Fig. 2A, also from an area that is outside the largest change in DWI intensity. This is consistent with an interpretation that the NAA reduction is initially confined to the core region of the ischemic territory whereas a lactate increase can be found in the borderzone (Dreher et al. 1993).
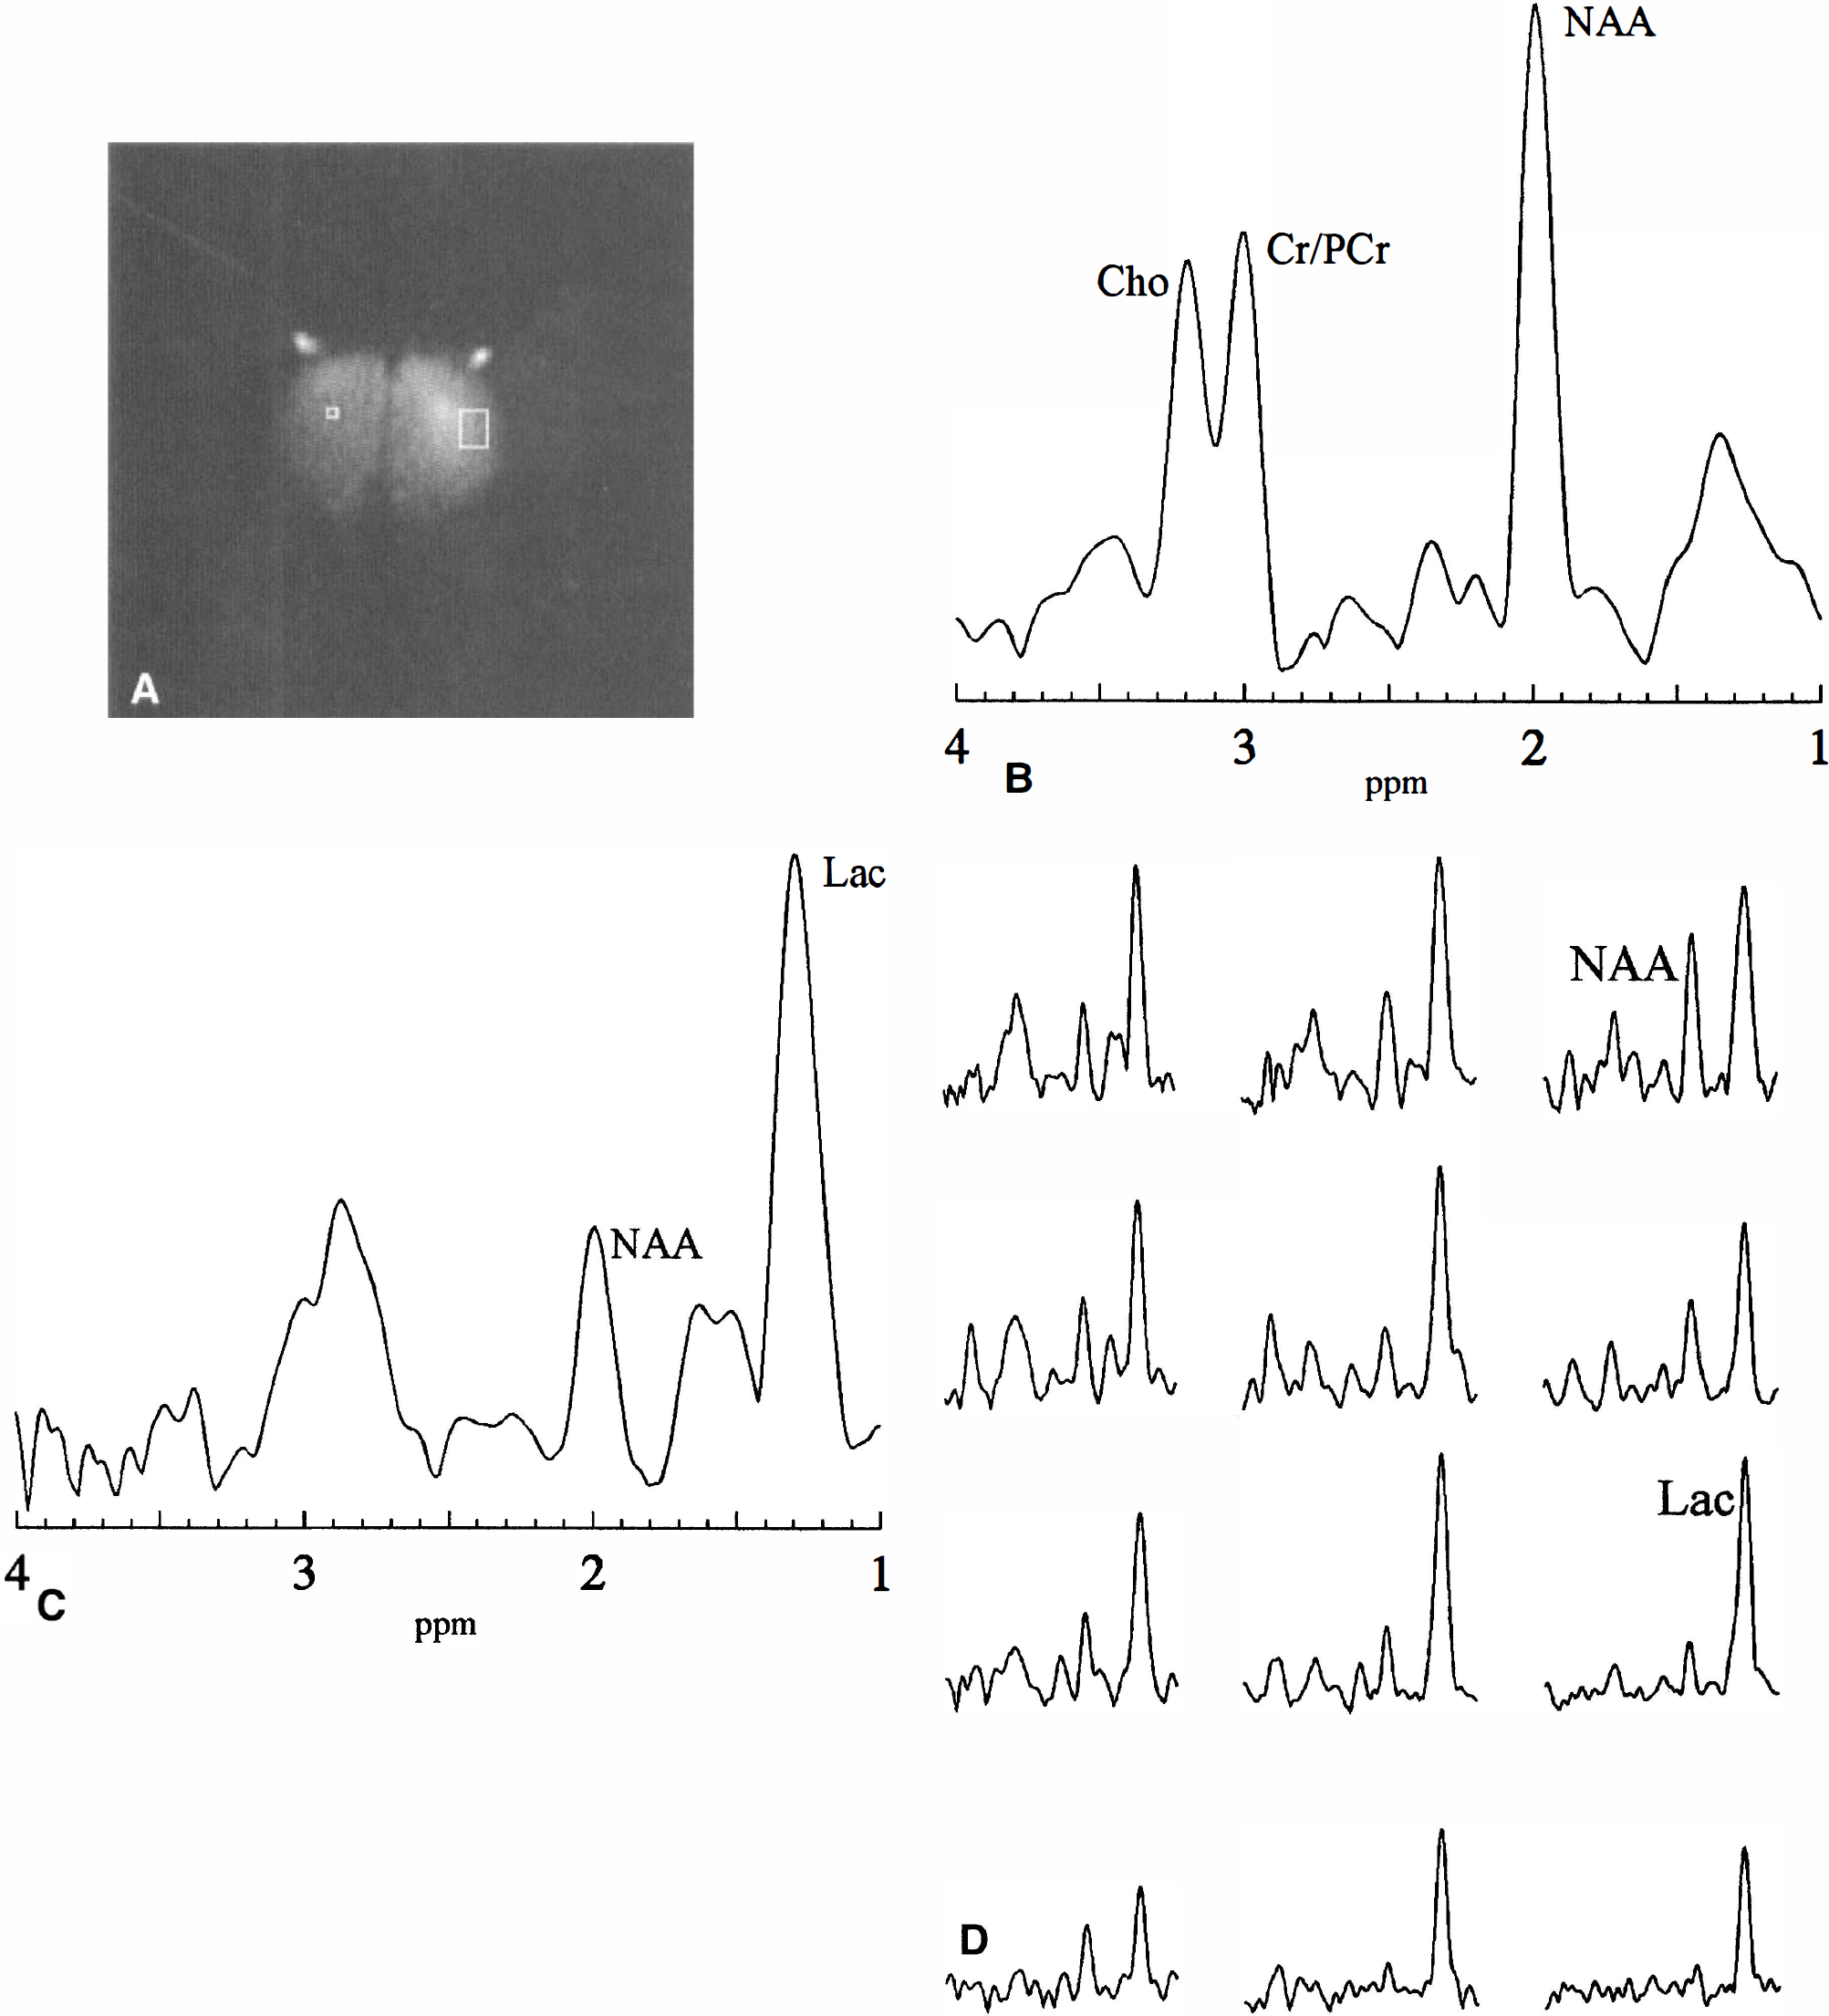
Spatial distribution of spectral changes in animal 1. (
The temporal evolution in the signal intensity of DWI, NAA, and lactate signal is followed in Fig. 3 for animals 1 and 4. Figures 3A show the ROI used for Figs. 3C and 3D, respectively, plotted on a DWI U-FLARE image. In Fig. 3C data are shown for an ROI of 2.5 mm situated at the center of the infarcted territory. The lactate signal intensity increases steadily from the time of infarction, and does not appear to have reached a final value after 6 hours. In Fig. 3D data from animal 4 are shown. The lactate intensity remains at a low level until almost 6 hours after occlusion and then suddenly increases; in this diagram the intensities are scaled to constant noise level. In both instances the NAA signal intensity decreases steadily from occlusion, in Fig. 3C it appears to reach the noise level after about 150 minutes. The DWI signal intensities show a consistent increase over time. In Fig. 3C the intensity returns almost to normal after about 100 minutes before starting a steep increase. This effect is redolent of CSD (see below), but has a significantly longer time constant. These two animals were chosen because they both show a loss in NAA and represent the extremes of behavior regarding the intensity of the lactate signal.
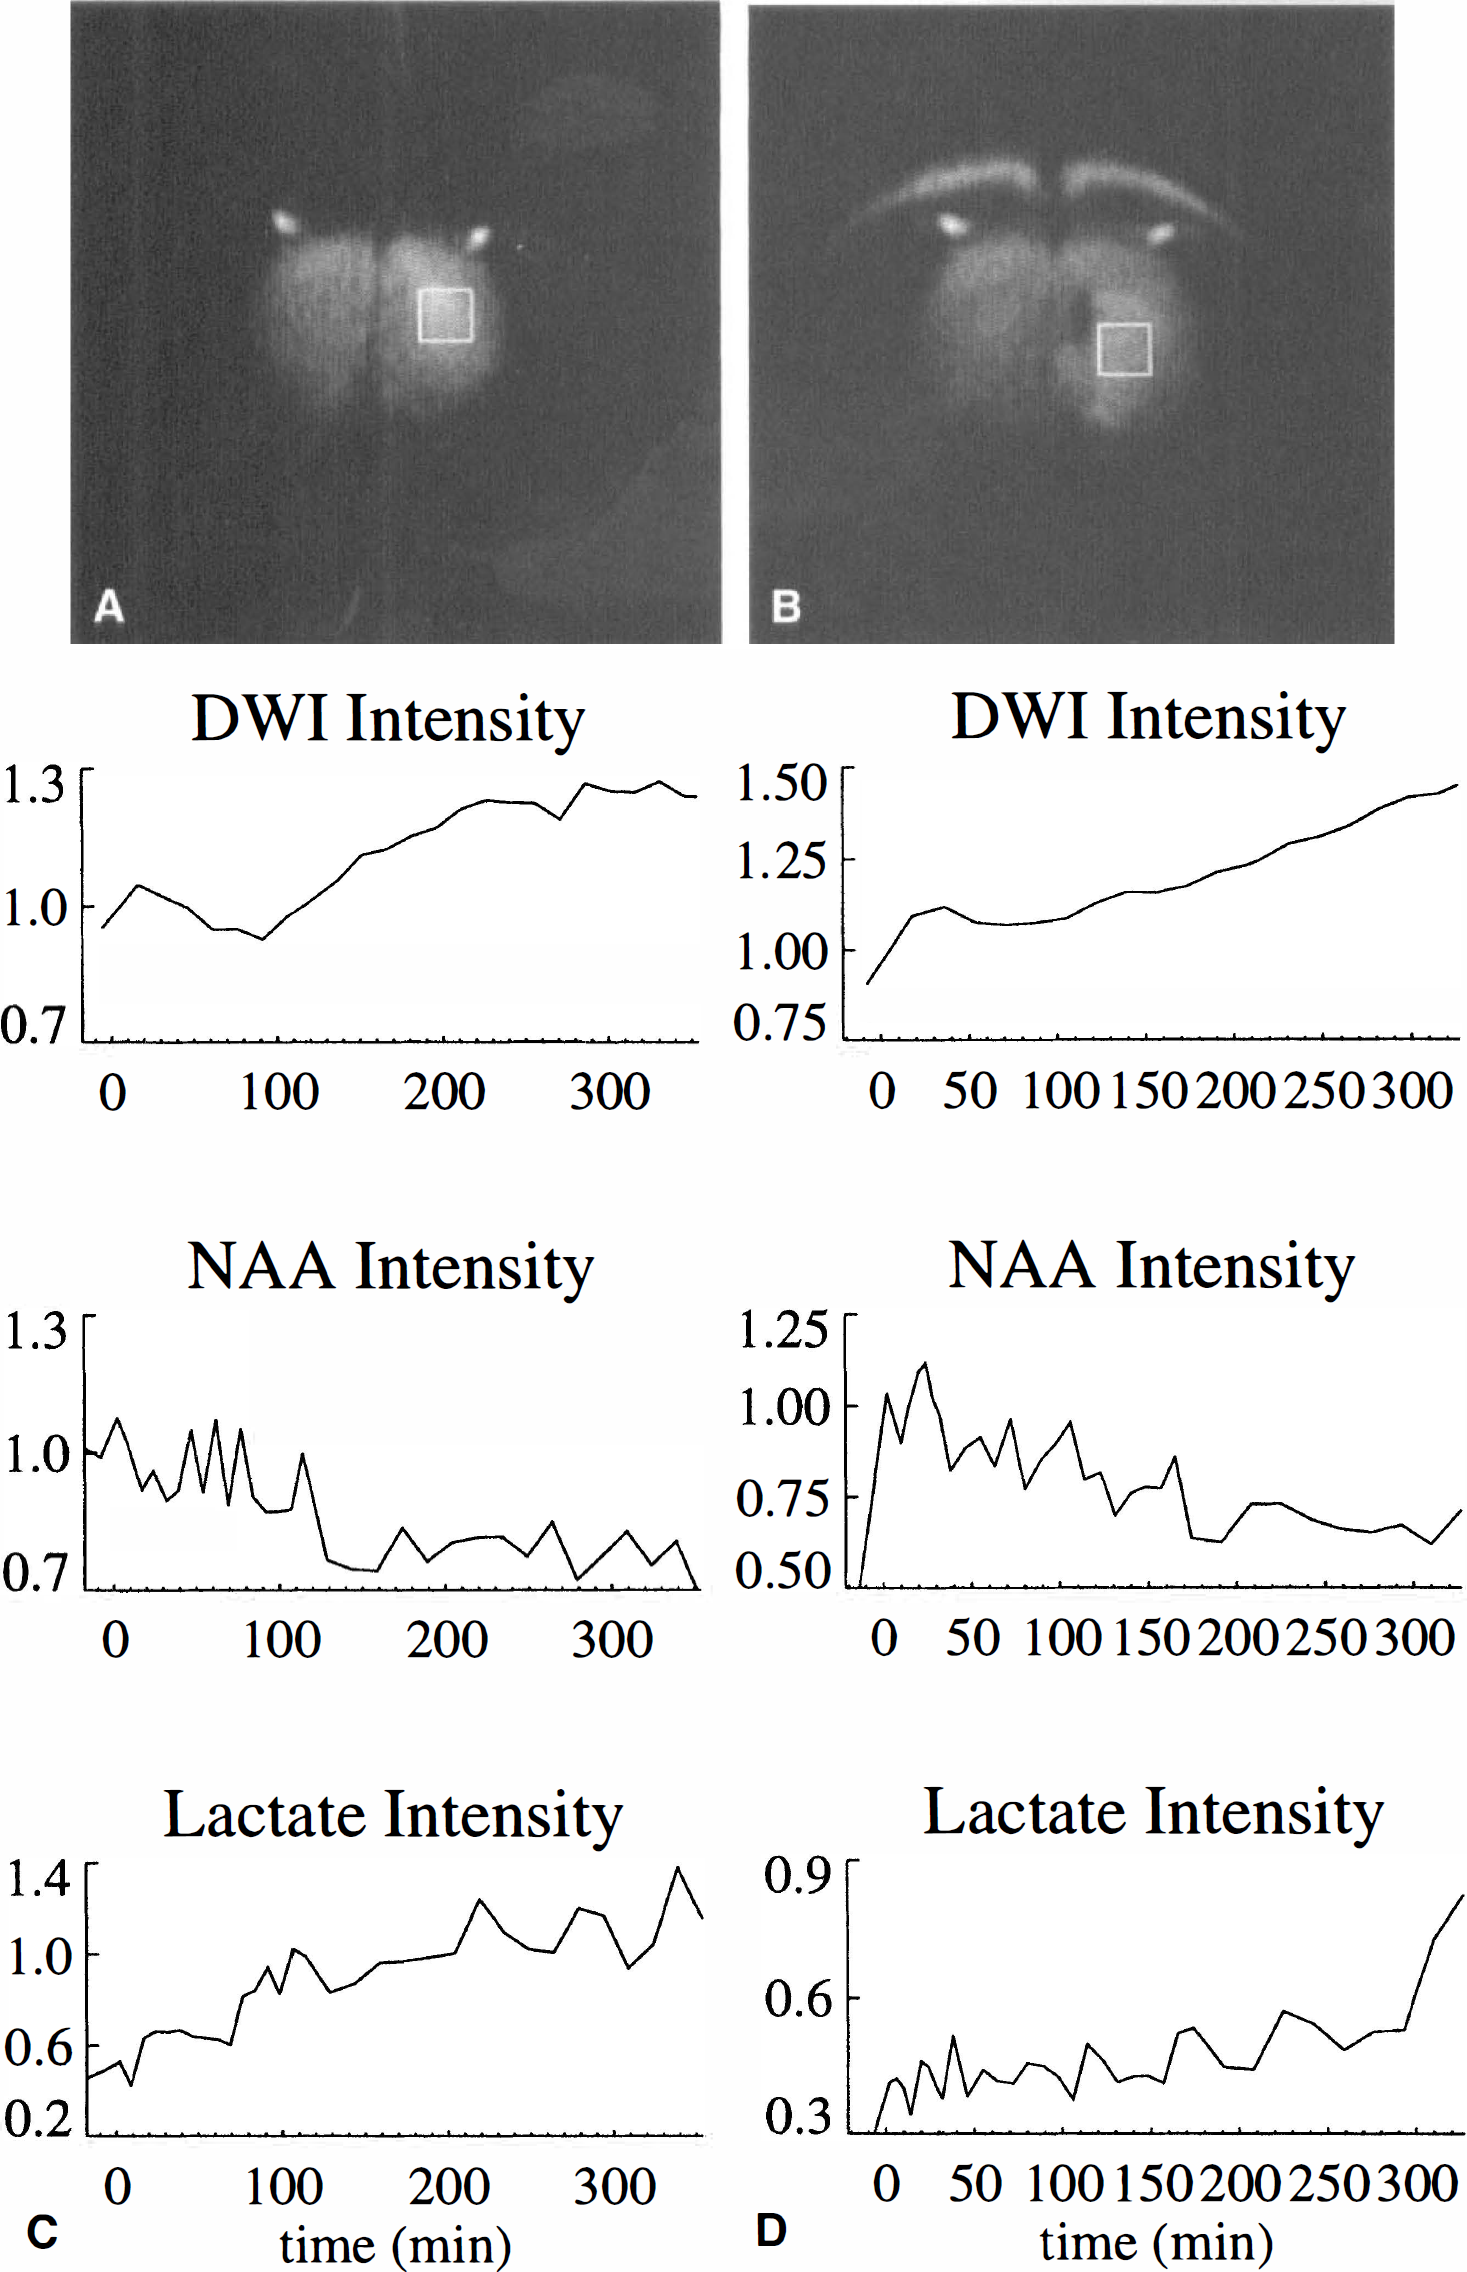
The time courses of the diffusion-weighted image (DWI), N-acetyl aspartase (NAA), and lactate signal intensities for animals 1 and 4. (
Metabolic manifestations of peri-infarct cell depolarizations
Figures 4 and 5 show the temporal and spatial appearance of CSD taken from animal 6, which showed CSD behavior despite developing no infarct territory. Figure 4A shows the position of the 2.5-mm ROI on a DWI U-FLARE image obtained at the end of the experiment. In Fig. 4B, the DWI and lactate time courses for this ROI are shown. This animal experienced CSD at 3, 36, and 125 minutes of which the latter two are clearly visible in both the DWI and lactate curves; there is some indication of the first CSD in the lactate time course. The appearance of the CSD at 125 min is shown in Fig. 5, the left column of which shows the lactate imaged immediately before the CSD, and the three subsequent images obtained at 8-minute intervals. The bottom three images in the right hand column show the difference images obtained by subtracting the lactate image pre CSD from each of the later three images. Superimposed on the difference images is a high-pass filtered anatomical image obtained pre-infarction showing the outline of the upper brain and scalp. The anatomical image used is shown at the top of the right-hand column.
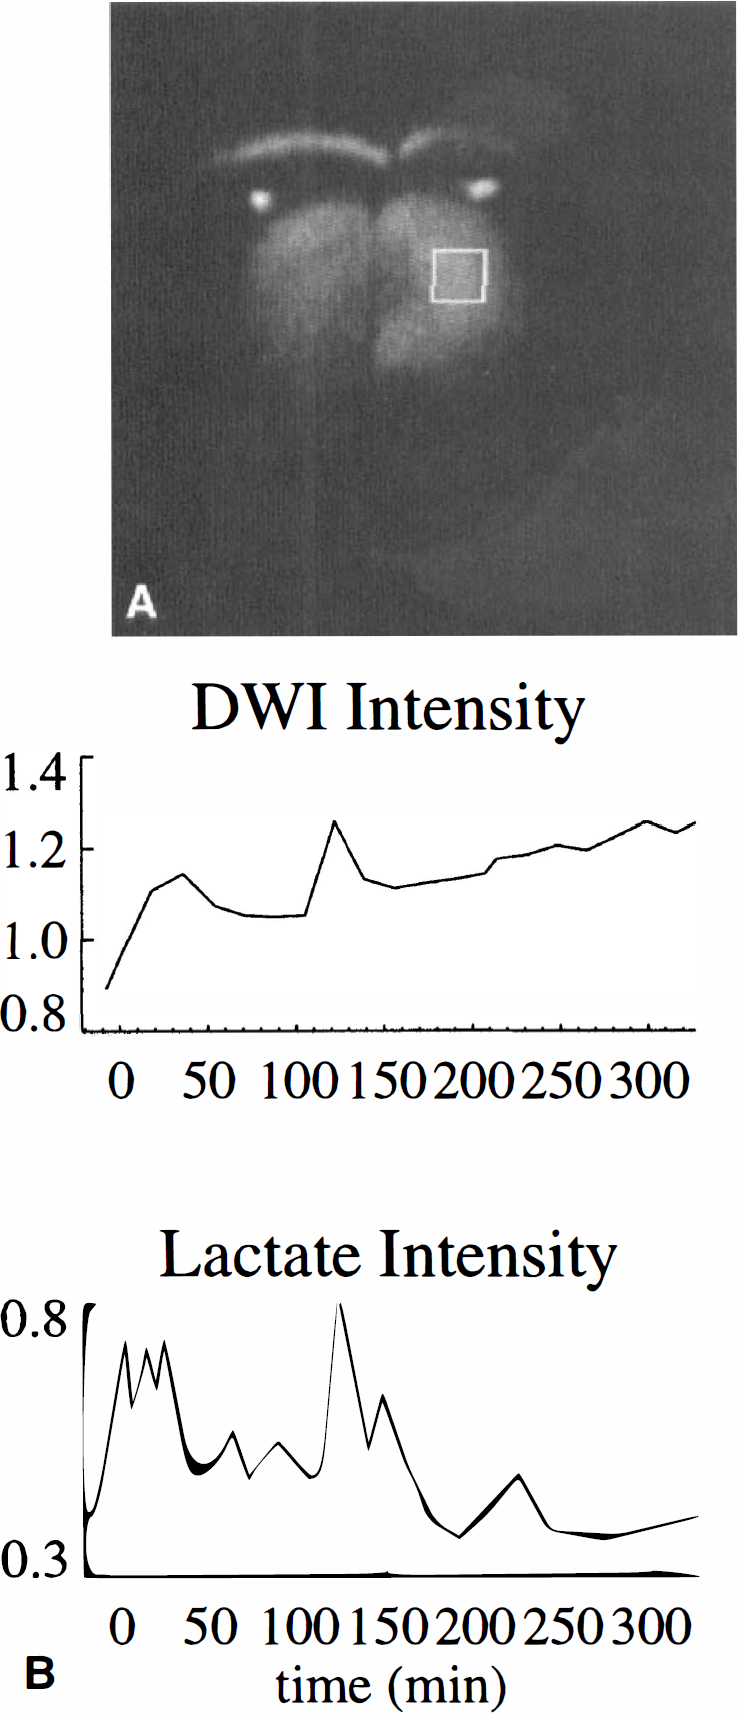
Temporal manifestation of cortical spreading depressions (CSD) in animal 6. (
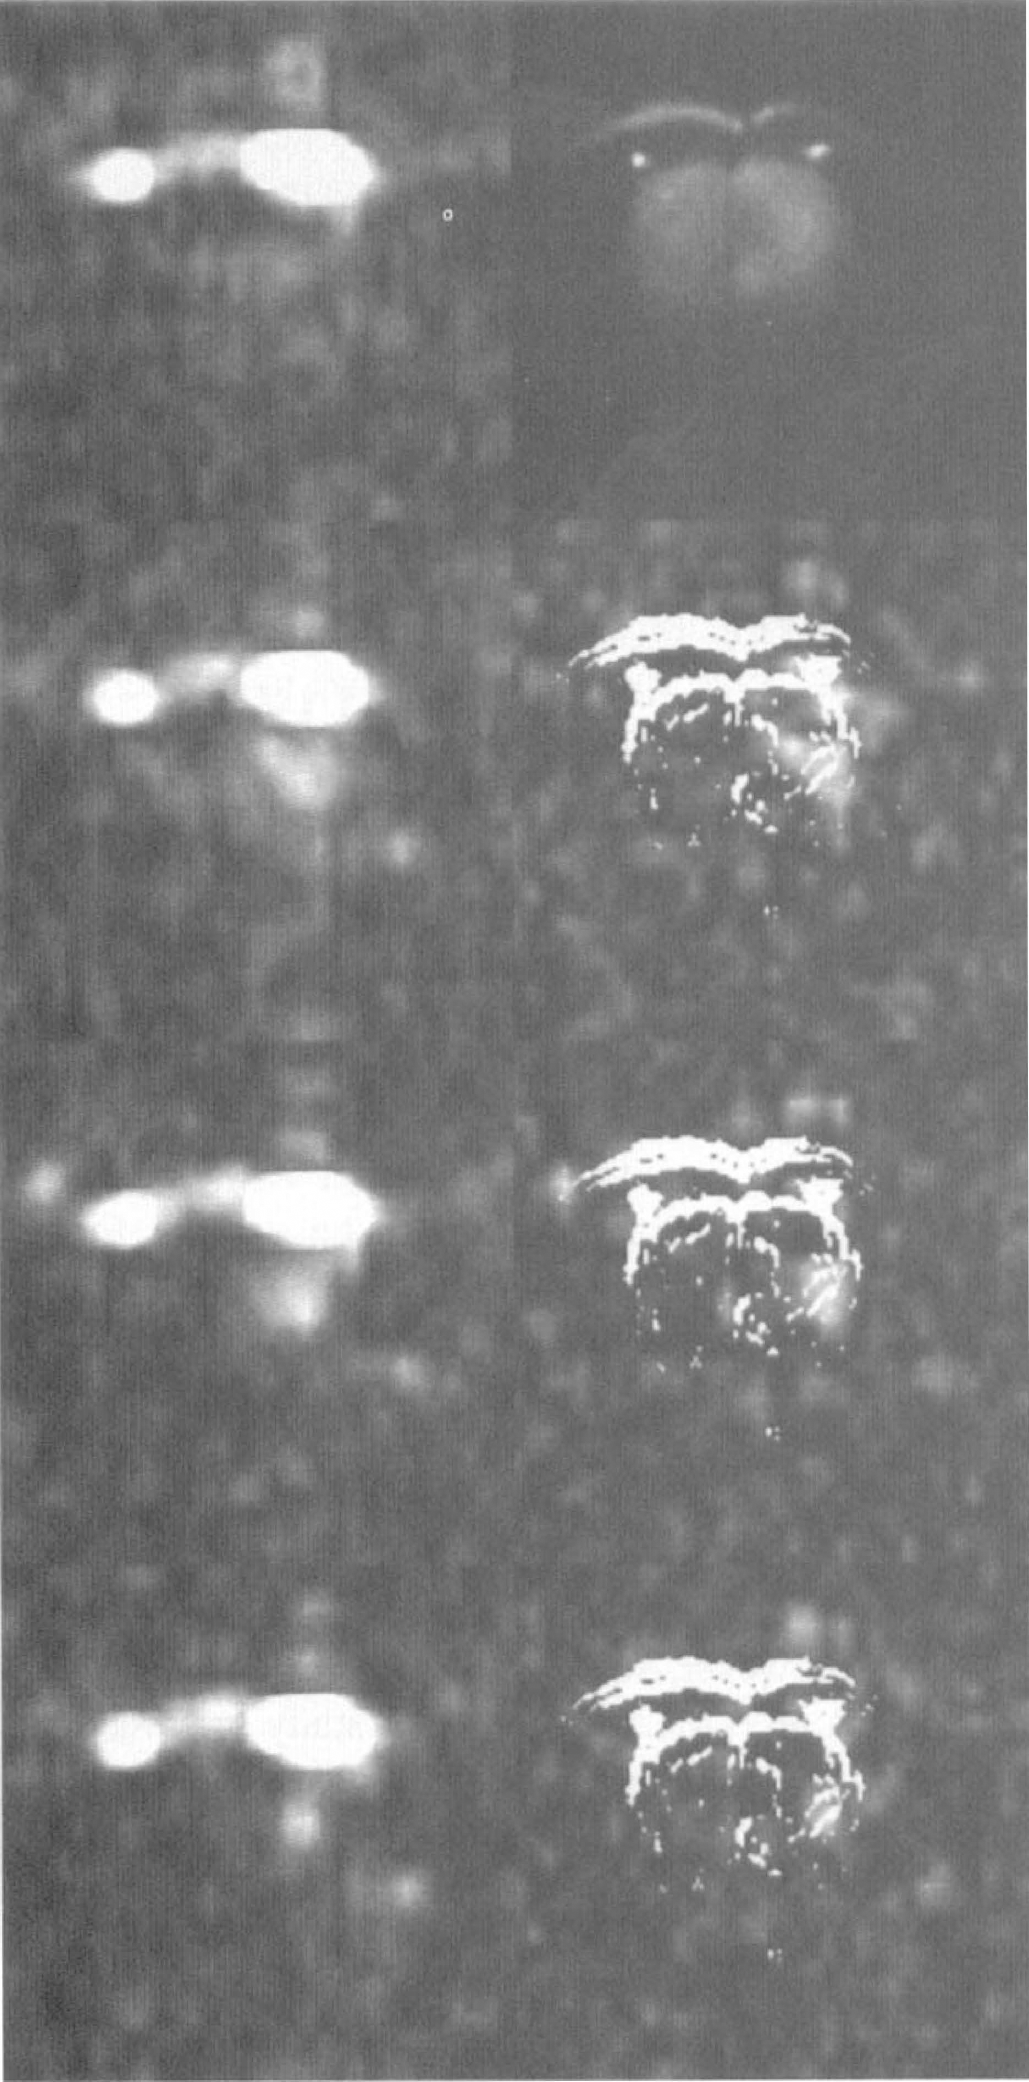
Spatial and temporal manifestation of a cortical spreading depression (CSD). This depicts the CSD experienced by animal 6 at 125 minutes after infarction. The left-hand column shows the lactate images, with that shown at the top left being obtained before the CSD, and the next three being obtained with the experiment starting at 123, 131, and 140 minutes after occlusion. The images are dominated by the strong lipid signal arising from the fat in the scalp. The top right image is a diffusion-weighted image (DWI) obtained before occlusion. The subsequent images in the right-hand column were obtained by taking the difference between the lactate image to the left and that obtained just before the CSD, and superposing on this a high-pass filtered image obtained from the DWI shown in the top right.
CSD were detected electrophysiologically on 19 occasions in the seven animals presented. Of these events, 11 could be unambiguously identified in the lactate images, in 3 there were indications of CSD, but low signal to noise ratio (SNR) prevented an unambiguous definition. The other events either generated lactate outside the slice measured or the quantity of lactate produced was below the threshold of detection. These results are summarized in Table 2. The elevated level of lactate was in general detectable for about 20 minutes after the electrophysiologic event. There was no incidence in which a spontaneous increase in the lactate signal was not accompanied by a DC shift. The 15-minute interval between successive DWI images meant that fewer CSD could be detected with this modality than with proton SI.
DISCUSSION AND CONCLUSIONS
Methodologic aspects
The results presented here show the feasibility of using proton SI to monitor the development of cerebral ischemia in the rat with good temporal and spatial resolution using a main magnetic field strength of 4.7 T. To achieve this, some spectral quality has to be sacrificed, particularly for a 4-minute experiment. The use of a higher field strength could be expected to improve this. The experimental conditions pertaining to this study were such that the main proton metabolites could be detected with a good SNR and 3 μL spatial resolution at 8-minute temporal resolution. This proved more than adequate to detect the occurrence of CSD. The use of a surface-coil placed on the skull for signal detection meant that the sensitivity decreased with increasing depth. This configuration may not be optimal for the detection of deep seated infarct territories.
A recurrent difficulty in the use of proton spectroscopy to measure lactate is interference from lipid signals, particularly those originating from outside the brain. This ambiguity could be eliminated, generally at some cost in sensitivity, by using a lactate editing method which can be used with the U-FLARE imaging sequence (Reese et al., 1995), however, such an experiment would lose the information on NAA. In the present study such methods were not necessary because only changes in lactate intensity, against a constant lipid background, were measured.
DWI data
The development in the DWI signal hyperintensity is in full agreement with earlier studies and descriptions (Mintorovitch et al., 1991; Roussel et al., 1994; Kohno et al., 1995b). The persistent increase in signal intensity documents an ongoing aggravation of the ischemic situation by further shift of water into the cells (Hoehn-Berlage et al., 1995b). The situation of the ATP images for the animals with large ischemic territories at 6 hours after MCAO shows a large region with total loss of ATP; this shows some similarity with the hyperintense region in DWI at this time point.
Proton SI data
The relatively good spatial resolution achieved in this study made it possible to document regional variability. The proton metabolites that are primarily of interest in cerebral infarction are lactate and NAA. It is of interest to observe that NAA can retain near normal values in border regions where lactate is already elevated. Similar observations have previously been reported (Dreher et al., 1994).
The pattern of temporal changes reported here are similar to those reported by Gyngell et al. (1995) using single voxel spectroscopy. The advantage of using SI is that it has the potential to characterize both the temporal development and the spatial heterogeneity.
Peri-infarct CSD
To the authors' best knowledge, this is the first reported detection of CSD using proton SI methods. The spontaneous increases in lactate signal always correlated with shifts in the DC potential. In most instances the lactate signal later returned to a value near that which it had just before the DC shift. This behavior suggests that the tissue in these regions is still viable as the lactate must either be remetabolized or transported away. Such tissue is potentially salvageable and should form the focus of further investigations. In particular, the quantification of the concentration and half-life of the lactate generated in CSD could yield valuable information about the viability of these regions.
Footnotes
Abbreviations used
Acknowledgments
The authors thank Prof. K.-A. Hossmann (Cologne) and Prof. D. Leibfritz (Bremen) for their support and encouragement, and Urthe Lanzerath for help in data evaluation.