
Abstract
Several approaches have been applied for quantification of D2 dopamine receptors in positron emission tomography studies using [11C]raclopride. Initial approaches were based on analyses of data obtained after rapid bolus injection of [11C]raclopride. A continuous infusion paradigm has more recently been applied. The current study compares these approaches in healthy men. Two positron emission tomography measurements were performed in each of six healthy men, the first with rapid bolus injection and the second with continuous infusion of [11C]raclopride. In rapid bolus injection, the binding potential was calculated by the following methods. One approach is the kinetic analysis using the standard three-compartment model. Another is to define a transient equilibrium at the moment when the specific binding reaches its maximum. In continuous infusion, binding potential was calculated by using time-activity data at equilibrium condition. All methods gave almost identical binding potential, representing cross-validation of these methods. The continuous infusion method can provide “true” equilibrium condition. The kinetic analysis is a sophisticated approach but requires determination of an arterial input function. The transient equilibrium method thus is suitable for routine clinical research, since it does not require determination of an arterial input function.
The radio ligand [11C]raclopride is widely used for determination of central D2 dopamine receptors using positron emission tomography (PET). Positron emission tomography measures the total radioactivity in brain regions. The differentiation of specific receptor binding from the background of nonspecifically bound and free radioligand is a fundamental problem in quantitative analyses. To solve this problem, a variety of approaches have been suggested and applied for analysis of [11C]raclopride binding.
One approach is to apply a kinetic analysis that is based on the assumption that [11C]raclopride binding can be described by the standard three-compartment model (Mintun et al., 1984; Huang et al., 1986; Wong et al., 1986; Farde et al., 1989; Price et al., 1993; Lammertsma et al., 1996). This approach is experimentally demanding and includes an arterial input function that has to be corrected for radioligand metabolites in plasma. The rate constants obtained from the three-compartment model can be used to calculate the curve for specific [11C]raclopride binding (Cb) and the nonspecifically bound and free radioligand concentration (Cn) in a brain region.
To avoid the need for an arterial input function, several quantitative approaches are based on the use of a reference region such as the cerebellum, which is a brain region almost devoid of D2 dopamine receptors (Martres et al., 1985). Specific receptor binding, Cb, is defined as the difference between the total radioligand concentration in a brain region and the concentration in the cerebellum. This approach is based on the assumption that the radioactivity in the cerebellum is a valid estimate for the nonspecifically bound and free radioligand concentration, Cn, in a brain region with D2 dopamine receptors.
Another assumption is that [11C]raclopride binding satisfies equilibrium conditions after rapid bolus injection. Equilibrium has practically been defined in several ways. An early approach was to define equilibrium as occurring when the ratio of Cb to Cn approaches a plateau (secular equilibrium) (Farde et al., 1986). Theoretically, a more correct approach is to assume equilibrium conditions at the transient moment when the specific binding is maximal (transient equilibrium) (Farde et al., 1989). To improve the reliability of the calculations, the brain time-activity curves can be integrated for a time interval that either embraces the time for transient equilibrium (Nordstrom et al., 1993; Nyberg et al., 1993; Nakashima and Farde, 1995) or represents a late part of the curve (Brooks et al., 1992; Rinne et al., 1993; Volkow et al., 1993; Lammertsma et al., 1996).
Theoretically, a “true” equilibrium condition with constant concentration of Cb and Cn can be obtained only by continuous infusion of ligand (Patlak and Pettigrew, 1976; Kawai et al., 1991; Lassen, 1992; Carson et al., 1993; Abi-Dargham et al., 1994; Laruelle et al., 1994; Carson et al., 1997). The continuous infusion method recently has been applied to determine [11C]raclopride binding in the monkey brain (Carson et al., 1997). Importantly, the continuous infusion method is based on the assumption that the radioactivity in the cerebellum is a valid estimate for the nonspecifically bound and free radioligand concentration, Cn, in a brain region with D2 dopamine receptors.
Despite extensive studies with [11C]raclopride, there is no consensus on an optimized quantitative approach. The current study compares six approaches for quantification of [11C]raclopride binding. Two PET measurements were performed in each of six healthy men. The first measurement was performed with rapid bolus injection, and the second was performed with continuous infusion of [11C]raclopride.
METHODS
Subjects and design
The study was approved by the Ethics and the Radiation Safety Committees of the Karolinska Hospital. Six healthy men (aged 24 to 37 years) were recruited and gave written informed consent. The subjects were healthy according to medical history, physical examination, blood and urine screening analyses, and magnetic resonance(MR) imaging of the brain. They were not taking any medication.
In each subject, two PET measurements were performed on different days. The first measurement was performed with rapid bolus injection of [11C]raclopride, and the second included an initial rapid bolus injection followed by continuous infusion.
Positron emission tomography procedures
The PET system used was Siemens ECAT Exact HR(Knoxville, TN, U.S.A.), which provides 47 sections with a center to center distance of 3.125 mm (Wienhard et al., 1994). The intrinsic spatial resolution was 3.6 mm in plain and 4.0 mm full width at half maximum axially. With a Hanning filter, the reconstructed in plain resolution was 5.5 mm full width at half maximum. Data were acquired in three-dimensional mode. Scatter correction was done (Watson et al., 1996). A head fixation system with an individual plaster helmet was used in the PET and MR imaging examinations to allow mastery of positioning between the two modalities (Bergstrom et al., 1981).
Rapid bolus injection. After intravenous rapid bolus injection of 293 to 336 MBq [11C]raclopride during 2 seconds, data were acquired for 63 minutes in a consecutive series of time frames. The frame sequence consisted of three 1-minute frames, four 3-minute frames, and eight 6-minute frames. The specific radioactivity of [11C]raclopride was 19 to 48 GBq/μmol at time of injection.
Continuous infusion. Intravenous continuous infusion of [11C]raclopride was performed after an initial rapid bolus injection. The continuous infusion was started at about 10 seconds after the rapid bolus injection. For continuous infusion, a computer-controlled pump was used. Data were acquired for 81 or 93 minutes in a consecutive series of time frames. The frame sequence consisted of 3 1-minute frames, 4 3-minute frames, and 11 or 13 6-minute frames.
The optimal proportion between the initial rapid bolus injection and the continuous infusion was individually predicted for each subject according to the literature (Carson et al., 1993; Carson et al., 1997). The proportion of the rapid bolus component relative to the continuous infusion component of [11C]raclopride is given by the parameter Kbol. This parameter has the dimension minute and defines the proportion of the bolus component to be equal to Kbol minutes worth of continuous infusion. The determination of the Kbol value was based on analysis of the tissue response curves using the arterial input function and the kinetic parameters that were obtained from the measurement after rapid bolus injection. The tissue response curves for the continuous infusion were calculated for the putamen and the cerebellum as a function of Kbol. The optimal Kbol value was determined to reach constant radioactivity levels in both regions in the shortest time. The total radioactivity of [11C]raclopride administrated was 354 to 527 MBq decay-corrected to the time of bolus injection. The proportion of the bolus component was 38% to 51% (Kbol: 52 to 91 minutes, n = 6). The specific radioactivity of [11C]raclopride was 25 to 50 GBq/μmol at time of bolus injection.
To obtain the arterial input function, an automated blood sampling system was used during the first 5 minutes of each measurement (Eriksson et al., 1988). Thereafter, arterial blood samples were taken manually at the midpoint of each frame until the end of the measurement (Farde et al., 1989). The fraction of radioactivity representing unchanged [11C]raclopride in plasma was determined by gradient HPLC (Swahn et al., 1994; Halldin et al., 1995). For HPLC analysis, arterial blood samples were taken at 4 minutes, 10 minutes, and every 10 minutes until the end of the measurement. The data of the fraction of unchanged [11C]raclopride were used with linear interpolation.
Regions of interest
T2-weighted MR images of the brain were obtained using the same positioning of the head and series of sections as in the PET studies. The MR imaging system used was GE Signa (Milwaukee, WI, U.S.A.) at 1.5 T. Regions of interest were drawn on the MR images and transferred to the reconstructed PET images. Regions of interest were defined for putamen and cerebellar cortex. Regions of interest for putamen were drawn covering the level of Monro's foramen. Each region of interest was drawn in four adjacent sections and data were pooled to obtain the average radioactivity concentration for the whole volume of interest. To obtain regional time-activity curves, regional radioactivity was calculated for each frame, corrected for decay, and plotted versus time.
Theory of calculation of radioligand binding
The time-activity curves of several neuroreceptor ligands have been described by the standard three-compartment model with four first-order rate constants (Fig. 1) (Mintun et al., 1984; Huang et al., 1986; Wong et al., 1986; Farde et al., 1989). Three compartments are defined as follows: Cp is the radioactivity concentration of unchanged radioligand in plasma (arterial input function), Cn is the radioactivity concentration of nondisplaceable radioligand in brain, which includes nonspecifically bound and free radioligand concentration, and Cb is the radioactivity concentration of radioligand specifically bound to receptors. The rate constants K1 and k2 describe the influx and efflux rates for radioligand diffusion through the blood-brain barrier. The rate constants k3 and k4 describe the radioligand transfer between the compartments for nondisplaceable radioligand and specific radioligand binding to receptors. According to this model, the following equations can be expressed:


Here, Ct(t) is the total radioactivity concentration in a brain region. The PET measures the sum of Ct(t) and the radioactivity concentration in blood.
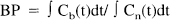
The three-compartment model analysis is based on the use of data from a PET measurement in which the radioligand has been labeled to high specific radioactivity. At such a condition, the receptor density Bmax and affinity Kd cannot be differentiated (Mintun et al., 1984; Huang et al., 1986; Farde et al., 1989). As seen from the following equations, the ratio Bmax/Kd corresponds to the ratio of k3 to k4, often referred to as the binding potential (BP) (Mintun et al., 1984):

where, f2 is the free fraction of radioligand in the nondisplaceable compartment. In the current study, the fraction of radioligand unbound to plasma proteins were not measured, and therefore, f2 value could not be calculated. According to the literature, f2 was assumed to be unity (Farde et al., 1989). Furthermore, when a radioligand with high specific radioactivity is used, the ratio of Cb to Cn at equilibrium conditions also corresponds to the ratio Bmax/Kd (Farde et al., 1989).

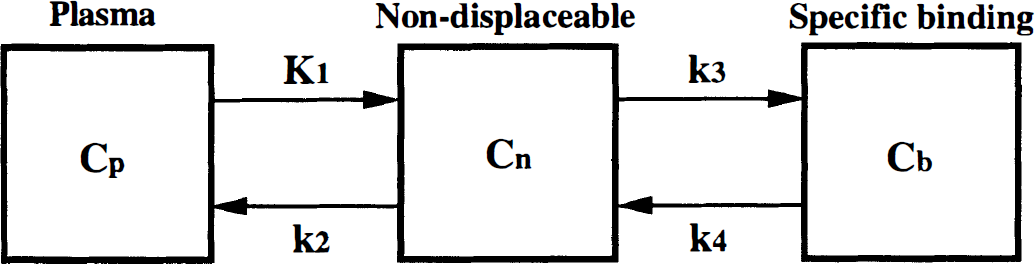
The three-compartment model used to describe the kinetics of [11C]raclopride binding in brain.
Calculation of binding potential for [11C]raclopride
The following five approaches were used to quantify [11C]raclopride binding after the rapid bolus injection: the kinetic methods (direct and indirect), the transient equilibrium method, the interval method, and the late time method. One approach was applied to the data obtained after continuous infusion. All of these approaches allowed the calculation of the BP for the putamen.
Kinetic method(direct): The BP was defined as the ratio between the parameters k3 and k4 as calculated using the three-compartment model.
To estimate the rate constants, a conventional nonlinear least squares fitting procedure was applied to the regional time-activity curves (Marquardt, 1963). In this analysis, four parameters (K1, k2, k3, and k4) were estimated. The radioactivity of unchanged [11C]raclopride in plasma was used as the arterial input function (Farde et al., 1989). Two approaches were applied to correct for the effect of radioactivity in the cerebral blood volume. The first was to exclude the first frame of the regional time-activity curves (Koeppe et al., 1990). The second was to use standard values for regional cerebral blood volume (Yamaguchi et al., 1986; Leenders et al., 1990) and the curve for measured radioactivity in arterial whole blood. The calculated radioactivity in the blood was thereafter subtracted from the regional time-activity curves. For cross-validation, the rate constants obtained by the two approaches were compared. Kinetic method (indirect): Since the ratio of k3/k4 is sensitive for noise in the PET measurement, BP also was calculated using the following equation (Lammertsma et al., 1996):
where, Vd(put) and Vd(cer) are the total distribution volumes (equal to (K1/k2)·(1 + k3/k4)) of the putamen and the cerebellum, respectively (Lammertsma et al., 1996). This method thus is based on the use of the cerebellum as a reference brain region devoid of D2 dopamine receptors. Transient equilibrium method: The condition of transient equilibrium is theoretically defined as occurring when the derivative for specific binding is zero (Farde et al., 1989). As seen from equation 2, Cb(t)/Cn(t) is equal to k3/k4 at this condition.
Since the cerebellum is a brain structure with a negligible density of D2 dopamine receptors (Martres et al., 1985), the radioactivity concentration in the cerebellum, Ccer(t), was used as a measure of Cn(t), that is, Cbref(t) = Ct(t) − Ccer(t) where Cbref(t) is the specific binding calculated using the cerebellum as a reference region (Fig. 2). To calculate Cbref(t), the fitted curves for Ct(t) and Ccer(t) obtained in the direct kinetic approach were used. The time of transient equilibrium was determined using this time-activity curve, Cbref(t). Interval method: Using the interval method, BP is defined by the following equation:
Ccer(t) was used as an estimate for Cn(t). The integration interval, 9 to 45 minutes, which includes the time for transient equilibrium (20 to 24 minutes; see Results), was used (Nyberg et al., 1993). This time interval has been shown to give the lowest coefficient of variance in a large series of healthy subjects (n = 39) (Nakashima and Farde, 1995). Late time method: The late time method was defined according to equation 9, but the integration interval, 33 to 63 minutes, which represents a late part of the time curve, was used (Brooks et al., 1992; Rinne et al., 1993; Volkow et al., 1993; Lammertsma et al., 1996). Continuous infusion method: In the continuous infusion, BP was calculated according to the following equation (Lassen, 1992; Carson et al., 1997):
Ccer(t) was used as estimate for Cn(t). The total distribution volumes of the putamen (Vd(put) and the cerebellum (Vd(cer)) were obtained using the following equations (Lassen, 1992):
Data for a time interval when Ct(t), Ccer(t), and Cp(t) were at a constant level were used for these calculations (see Results).


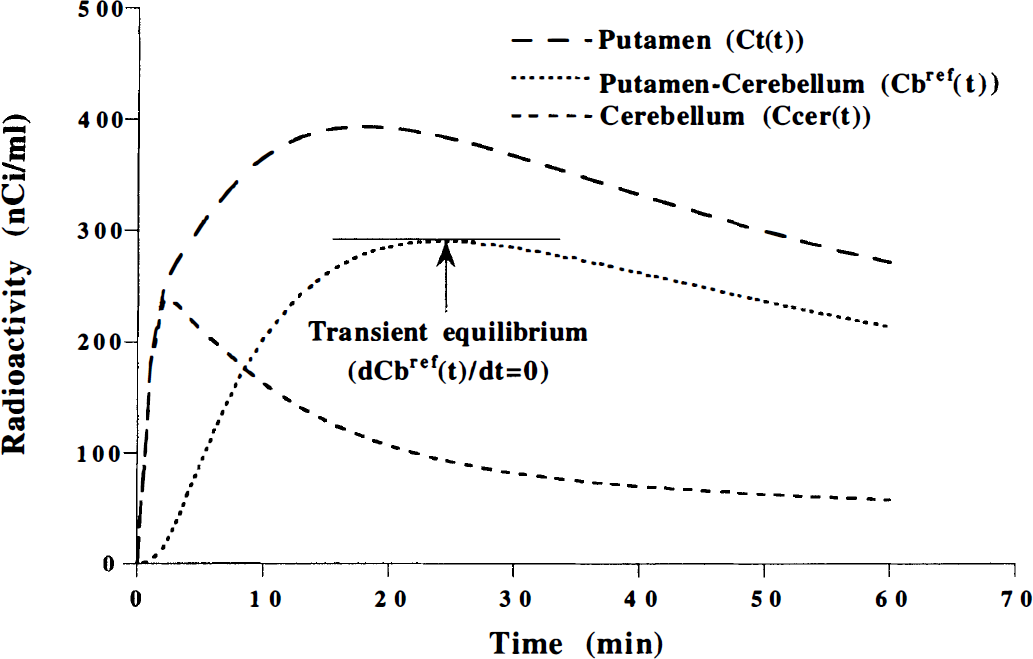
Typical time courses of the radioactivity concentration for the putamen [Ct(t)], for the cerebellum [Ccer(t)] and specific binding using a reference region, that is, the cerebellum: Cbref(t) = Ct(t) − Ccer(t). The time of transient equilibrium is defined as the time when the time derivative of Cbref(t) is zero.
Comparison of Ccer(t) and calculated Cn(t)
The validity of using the radioactivity concentration in the cerebellum Ccer(t) as an estimate for Cn(t) was examined. Cn(t) was calculated for each subject's time-activity curve of the putamen after rapid bolus injection using the following expression, which is derived from equation 1, equation 2 and equation 3 (Farde et al., 1989; Blomqvist et al., 1990):

As seen in equation 13, Cn(t) is dependent on the density of available receptors. The rate constants and fitted curve for Ct(t) obtained by the direct kinetic approach were used. The calculated Cn(t) was compared with Ccer(t).
The use of Ccer(t) as an estimate for Cn(t) causes an error in the calculation of the specific binding. This error can be calculated by comparing the radioactivity concentrations of radioligand specifically bound to receptors obtained from the equation Cbref(t)= Ct(t) − Ccer(t) (specific binding using cerebellum) and Cb(t)= Ct(t) − Cn(t) [specific binding using calculated Cn(t)].
Simulation study
Effect of binding potential on C n (t). To test the effect of the BP on Cn(t) after rapid bolus injection, Cn(t) were simulated for a range of BP values. Tissue time-activity curves for the putamen(0 to 60 minutes), Ct(t), were generated based on the three-compartment model using assumed values for the rate constants K1, k2, k3, and k4. The K1, k2, and k4 values were assumed to be 0.16 mL/mL/min, 0.40 min−1, and 0.09 min−1, respectively. These values were taken from the results obtained with the direct kinetic approach. A series of tissue time-activity curves for the putamen were generated by varying k3 from 0 to 0.45 (min−1) in seven steps. This corresponds to BP values between 0 and 5. Cn(t) then was calculated for each of the seven time-activity curves (BP = 0 to 5) using equation 13. Cn(t) in a region with a BP of zero corresponds to the time-activity curve in a reference region that has no specific binding, Cref(t). The time courses of specific binding using Cn(t) [Cb(t) = Ct(t) − Cn(t)] were compared with those using reference region [Cbref(t) = Ct(t) − Cref(t)]. The input function used in this simulation was interpolated by a sum of two exponential functions in the time interval 3.5 to 60 minutes (0 to 3.5 minutes, linear interpolation).
Error of binding potential calculated by the transient equilibrium method and the interval method. When the K1 values of putamen are different from those of reference region because of a change of CBF in the putamen caused by neurologic and psychiatric diseases, this might have an effect on BP calculated by the transient equilibrium method and the interval method. A simulation study was performed to estimate this error. Tissue time-activity curves for the putamen (0 to 60 minutes) were generated according to the three-compartment model. The K1/k2 and k4 values were assumed to be 0.40 mL/mL and 0.09 min−1, respectively. Tissue time-activity curves for the putamen were generated with K1 values between 0.10 and 0.22 mL/mL/min and with k3 values between 0.045 and 0.45 min−1, corresponding to BP values of 0.5 to 5. A tissue time-activity curve for the reference region also was generated according to the two-compartment model using 0.16 mL/mL/min and 0.40 min−1 and K1 and k2 values, respectively. These assumed values were taken from the results obtained with the direct kinetic approach. The input function used in this simulation was interpolated by a sum of two exponential functions in the time interval 3.5 to 60 minutes (0 to 3.5 minutes: linear interpolation). The BP values were then calculated by both the transient equilibrium method and the interval method using the generated tissue time-activity curves. The estimated BP values were compared with the assumed BP values (equal to k3/k4).
The first-pass extraction fraction of [11C]raclopride was 30% (Farde et al., 1989). Using this extraction fraction and a K1 value of 0.16 mL/mL/min, the PS (capillary permeability-surface area product) value was calculated (Renkin, 1959; Crone, 1963). With this PS value, the K1 range of 0.11–0.17 mL/mL/min corresponds the CBF range of 0.15 to 0.85 mL/mL/min. Since cerebral infarction occurs in a brain region with CBF values less than 0.15 mL/mL/min (Lenzi et al., 1982; Shishido et al., 1986), K1 values of less than 0.10 mL/mL/min were not considered in this simulation.
RESULTS
The time courses for radioactivity in the putamen, the cerebellum, and unchanged [11C]raclopride in plasma obtained after rapid bolus injection are shown for one subject in Fig. 3. The time-activity curves for the putamen and the cerebellum were well described by the three-compartment model. The rate constants and the total distribution volumes for the putamen and the cerebellum obtained by the direct kinetic approach are given in Table 1. Using the cerebellum as a reference region, the time of transient equilibrium varied between 20 and 24 minutes (n = 6) after rapid bolus injection. The two methods applied to correct for the effect of radioactivity in cerebral blood volume gave almost identical results in the direct kinetic approach(data not shown).
The rate constants, the total distribution volumes, and binding potential obtained by the kinetic method for rapid bolus injection
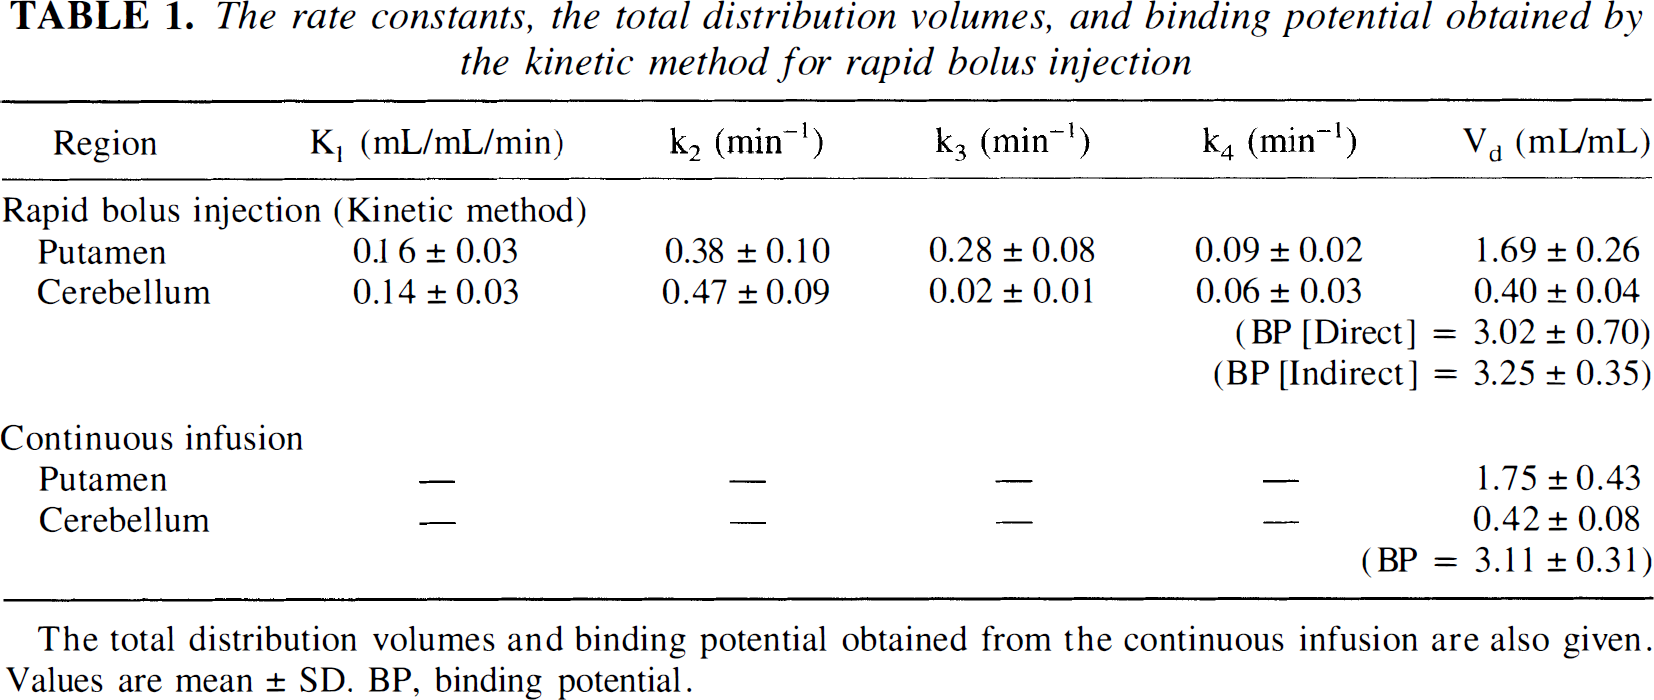
The total distribution volumes and binding potential obtained from the continous infusion are also given. Values are mean ± SD. BP, binding potential.
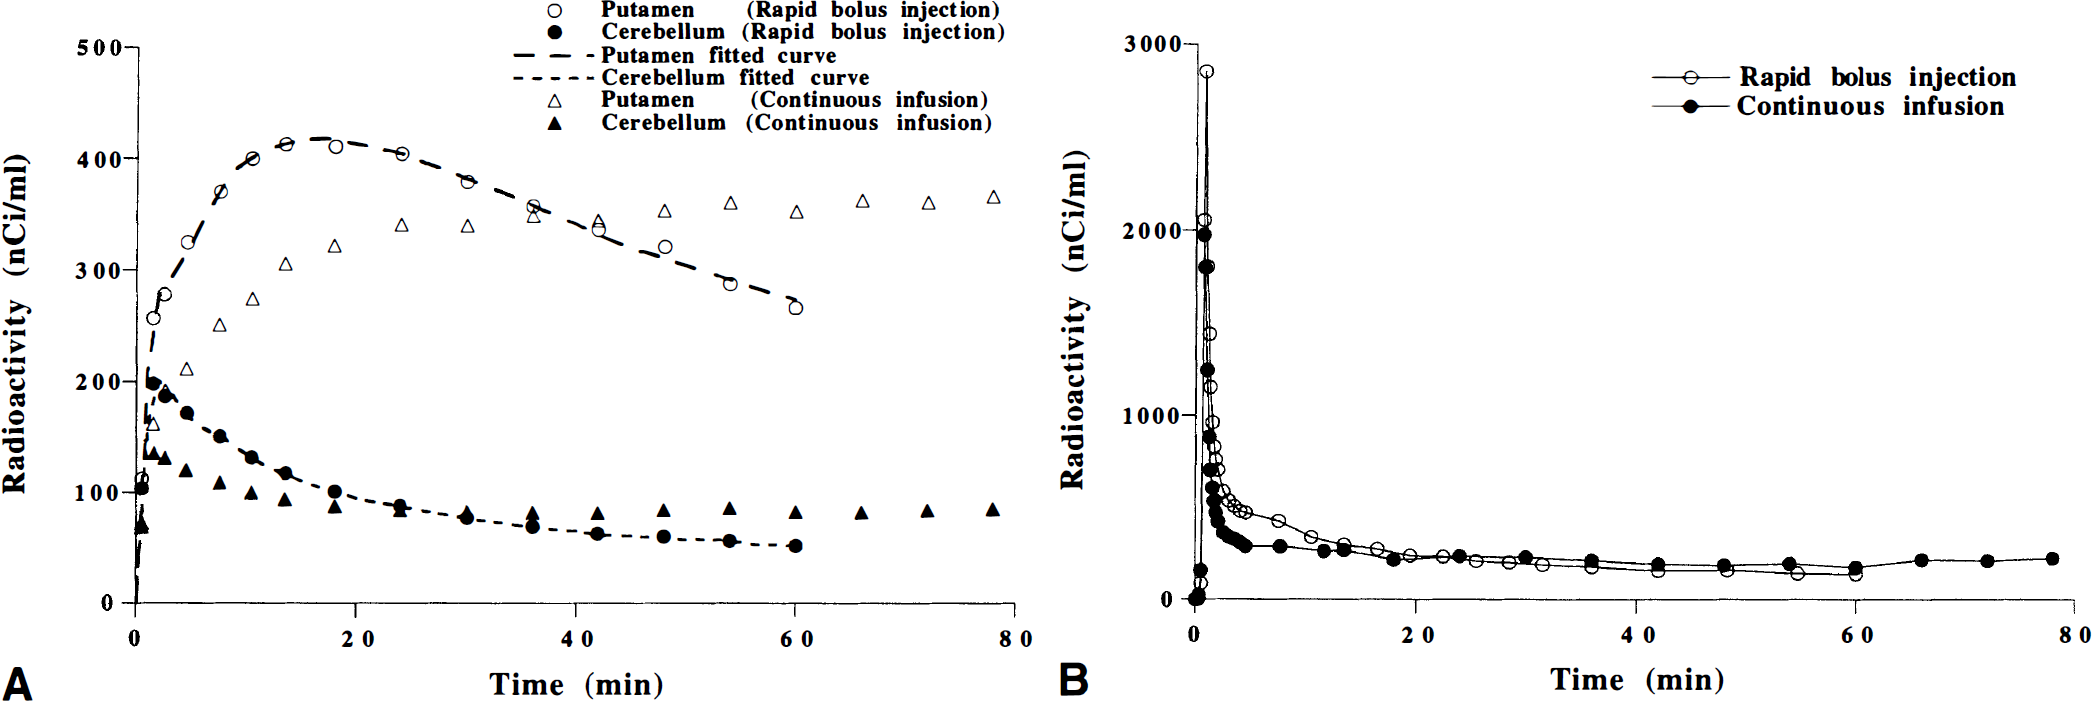
The time courses for radioactivity in the putamen, the cerebellum and unchanged [11C]raclopride in plasma during continuous infusion are shown for one subject in Fig. 3. The time courses for the ratio of the specific binding Cbref(t) to the cerebellum Ccer(t) are shown for all subjects in Fig. 4. Assuming that the equilibrium conditions were obtained during the interval of 63 to 81 minutes, the radioactivity integrated over this interval was compared with earlier intervals to see if equilibrium conditions also were satisfied at earlier time. The radioactivity integrated over time for four consecutive 18-minute intervals of the putamen, the cerebellum, and unchanged [11C]raclopride in plasma during continuous infusion are given in Table 2. For the time interval of 45 to 63 minutes, the regional and plasma radioactivity and Cbref(t)/Ccer(t) were on a similar level as the time interval 63 to 81 minutes (Fig. 4; Table 2). Therefore, the data integrated for a wider interval, 45 to 81 minutes, were used in the continuous infusion method. The total distribution volumes for the putamen and the cerebellum are given in Table 1.
The radioactivity integrated over time for four consecutive 18 minute-intervals during continuous infusion of [11C]raclopride
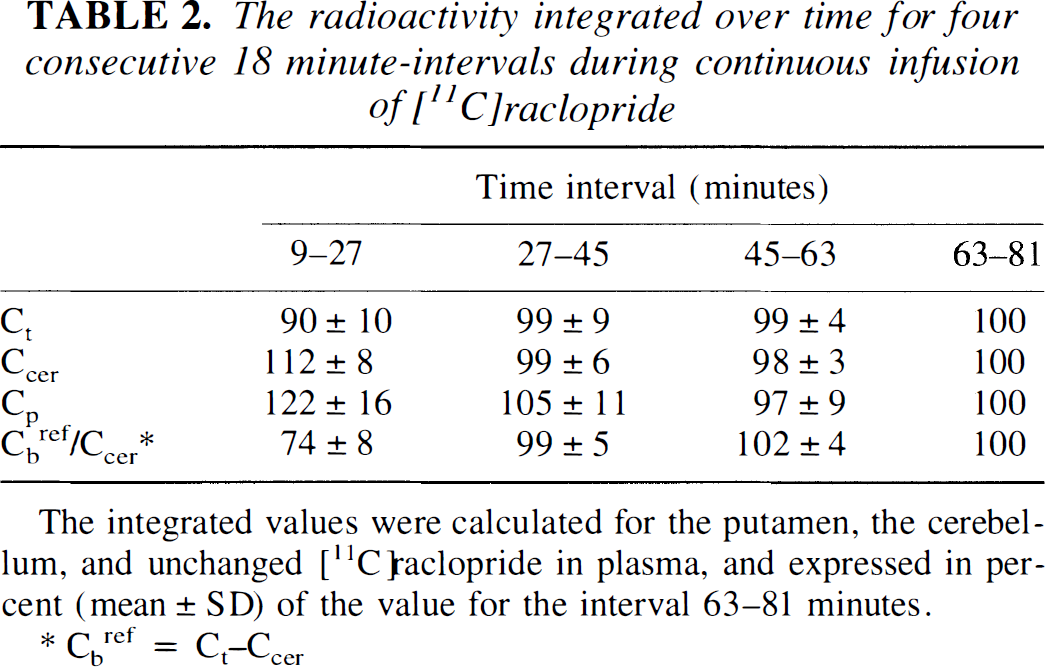
The integrated values were calculated for the putamen, the cerebellum, and unchanged [11C]raclopride in plasma, and expressed in percent (mean ± SD) of the value for the interval 63–81 minutes.
Cbref = Ct–Ccer
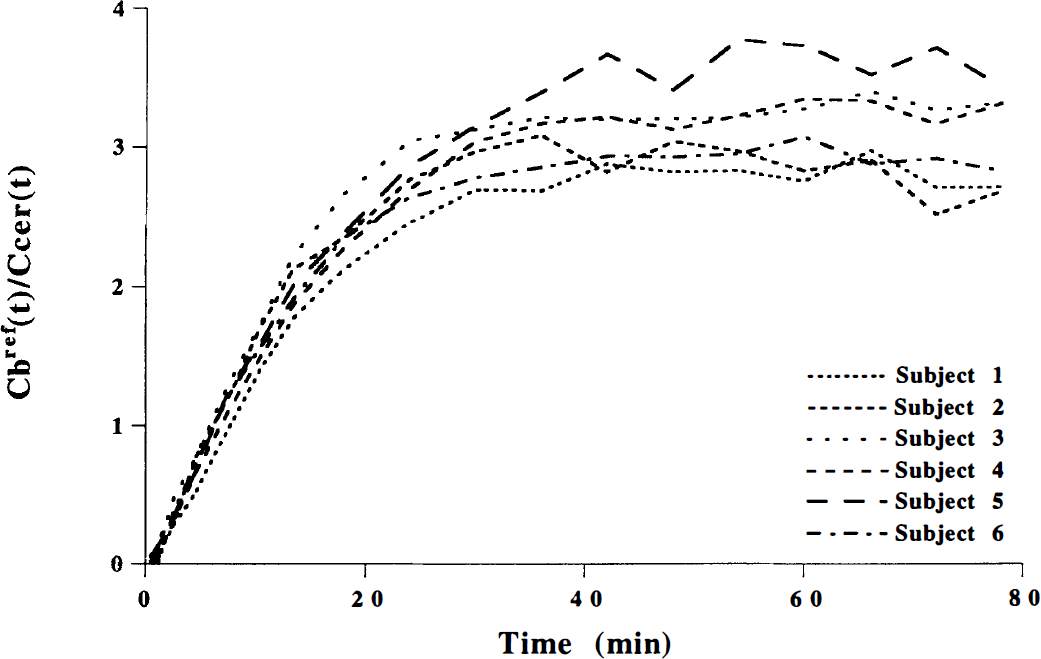
The time courses for Cbref(t)/Ccer(t)(Cbref(t) = Ct(t) − Ccer(t)) during continuous infusion of [11C]raclopride for all subjects.
The average BP values obtained by the different methods are given in Table 3 and for each individual in Fig. 5. The BP values obtained by the transient equilibrium method and the interval method were in close agreement with those obtained by the direct and indirect kinetic method and the continuous infusion method. The BP value obtained by the late time method was 21% to 30% higher than those obtained by all the other methods. This difference was statistically significant(P < 0.01, paired t test).
Binding potential values obtained by the different methods
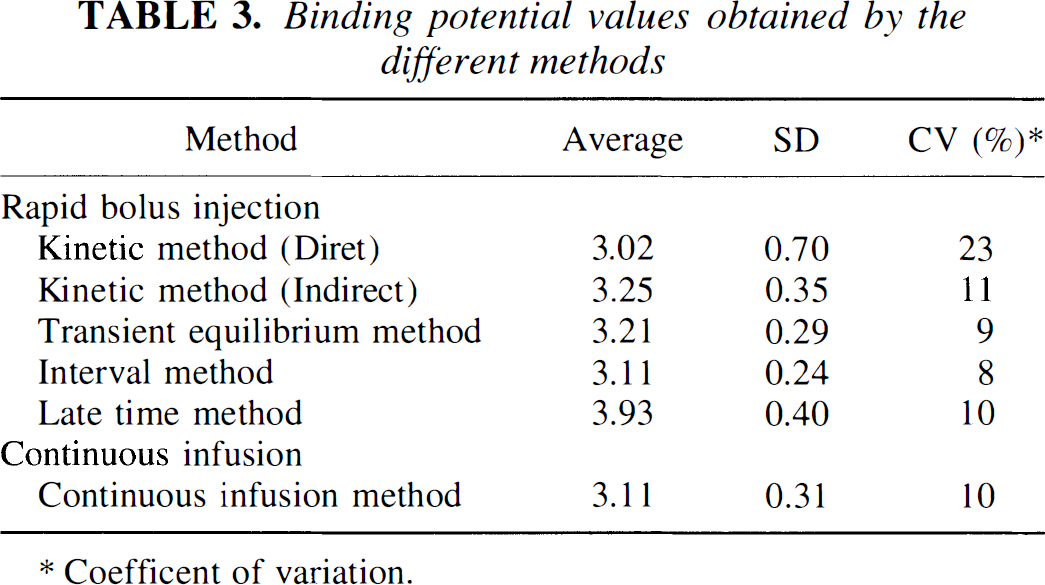
Coefficent of variation.
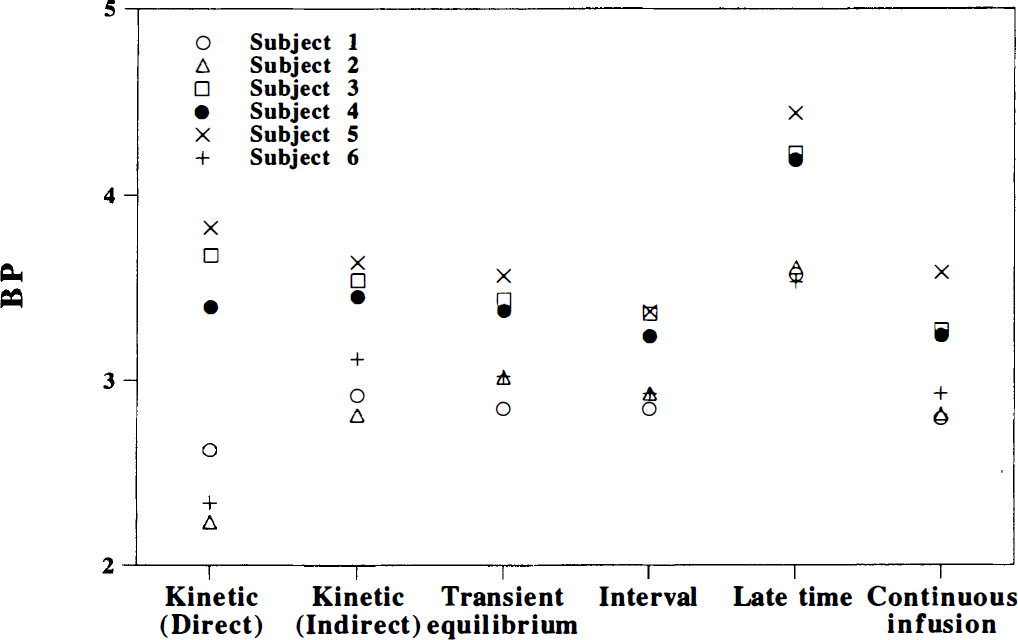
Binding potential (BP) values obtained by the different methods for each individual.
Using the rate constants obtained by the direct kinetic approach, the time curve for Cn(t) was calculated for the six subjects (Fig. 6). The average experimental curve and fitted curve in the direct kinetic approach for the putamen and the cerebellum also are shown in Fig. 6. Cn(t) was lower than the cerebellar curve during the early phase, and higher during the late phase after injection. The time of intersection between Cn(t) and the curve fitted to cerebellum was observed around the point of transient equilibrium as defined using the cerebellum. The time courses of specific binding using calculated Cn(t) (Cb(t) = putamen− Cn(t)) and using Ccer(t) (Cbref(t) = putamen− cerebellum) also are shown in Fig. 6. The time difference between transient equilibrium as defined by the peak of the two curves was less than 2 minutes.
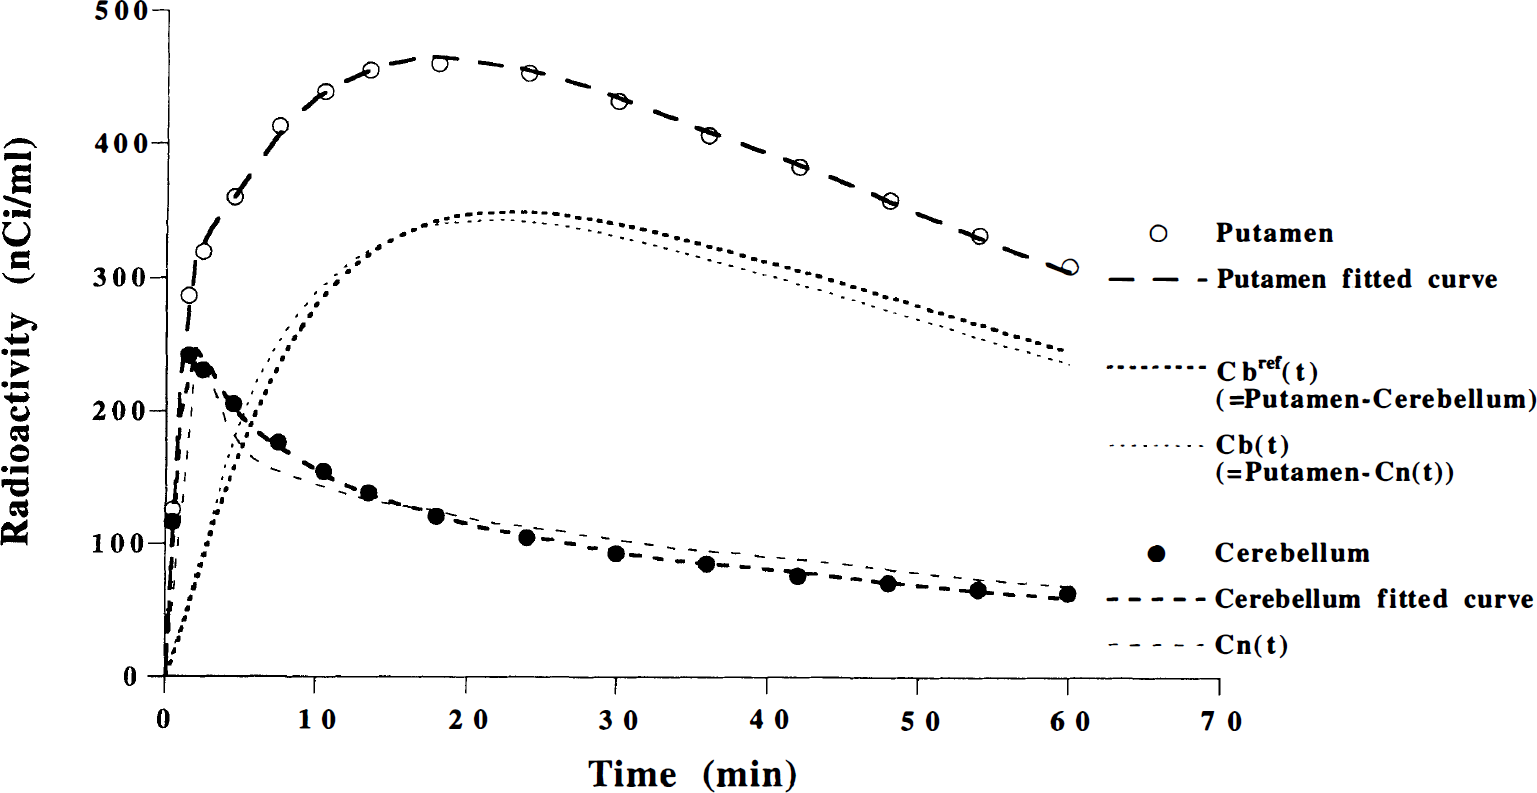
Average time curve for Cn(t), experimental curve, and fitted curve in the direct kinetic approach for the putamen and the cerebellum for the six subjects. The specific binding using calculated Cn(t)(Cb(t) = putamen − Cn(t)) and using Ccer(t) (Cbref(t)= putamen − cerebellum) also are shown.
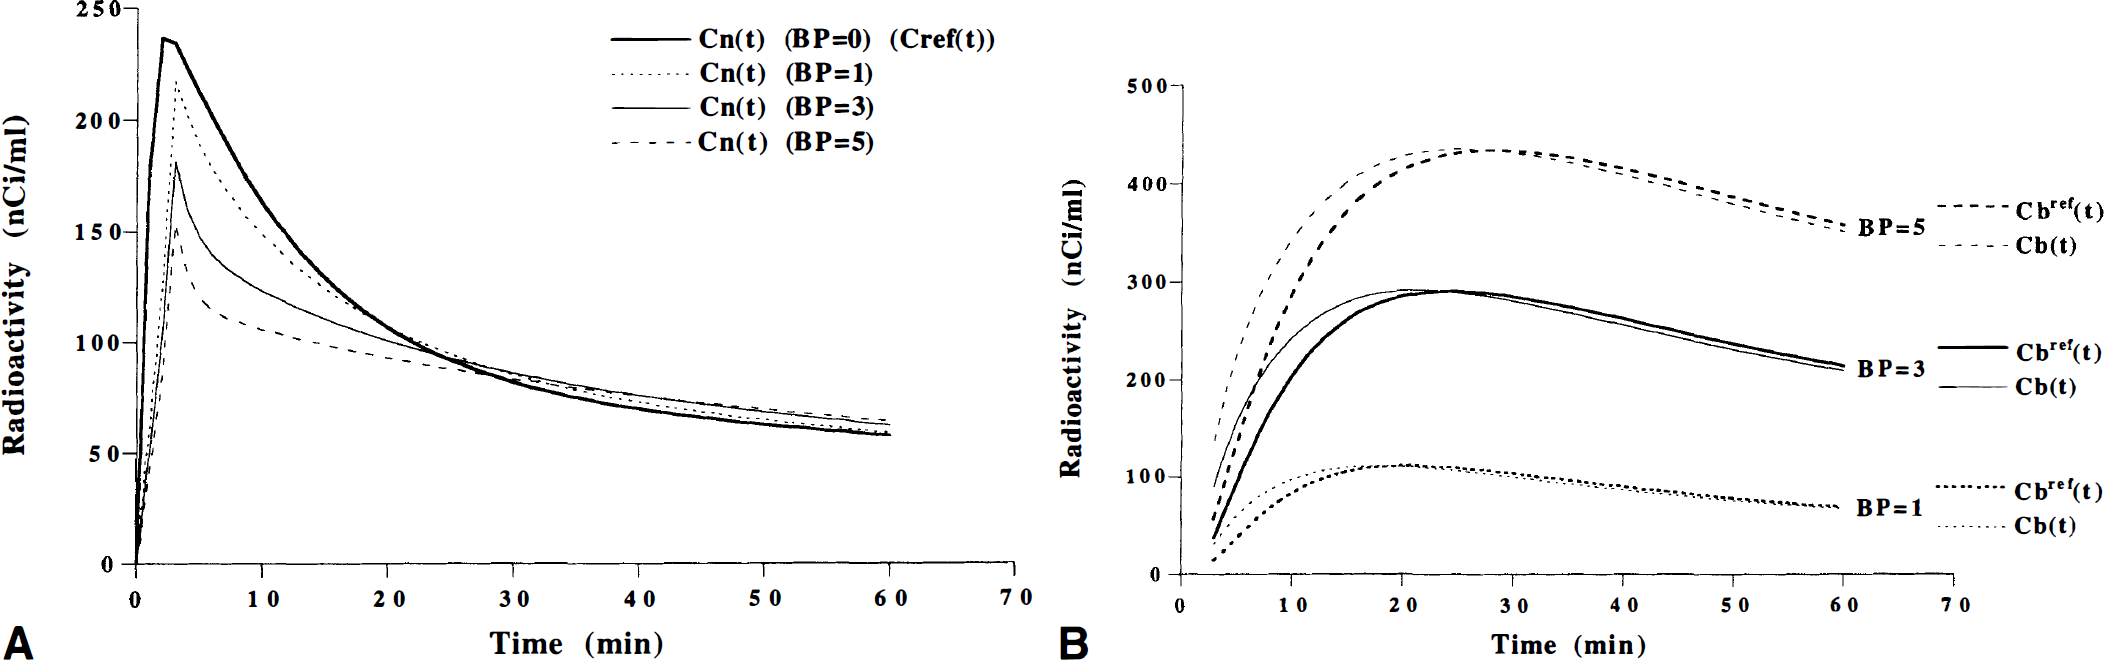
The time course for Cn(t) was simulated for different BP values ranged from 0 to 5 (Fig. 7A). Cn(t) in a region with a BP of zero corresponds to the time-activity curve in a reference region with no specific binding, Cref(t). In regions with specific binding (BP > 0), Cn(t) was lower than Cref(t) in the early phase and higher in the late phase after injection. The larger the BP, the larger is the difference between Cn(t) and Cref(t). For each BP value, the time of intersection between Cn(t) and Cref(t) is that of transient equilibrium using an ideal reference region with a BP of zero (Fig. 7B). As seen in Fig. 7B, the time of transient equilibrium is dependent on the BP value. Higher BP corresponds to later time of transient equilibrium. For all BP values, the time difference between transient equilibrium using Cn(t) and using reference region was found to be less than 3 minutes.
Errors of BP calculated by the transient equilibrium method for assumed BP and K1 values are shown in Fig. 8A. When the assumed BP values were 2 to 5, errors of estimated BP were within +10%. The largest overestimation was observed for low K1 values and low BP values.
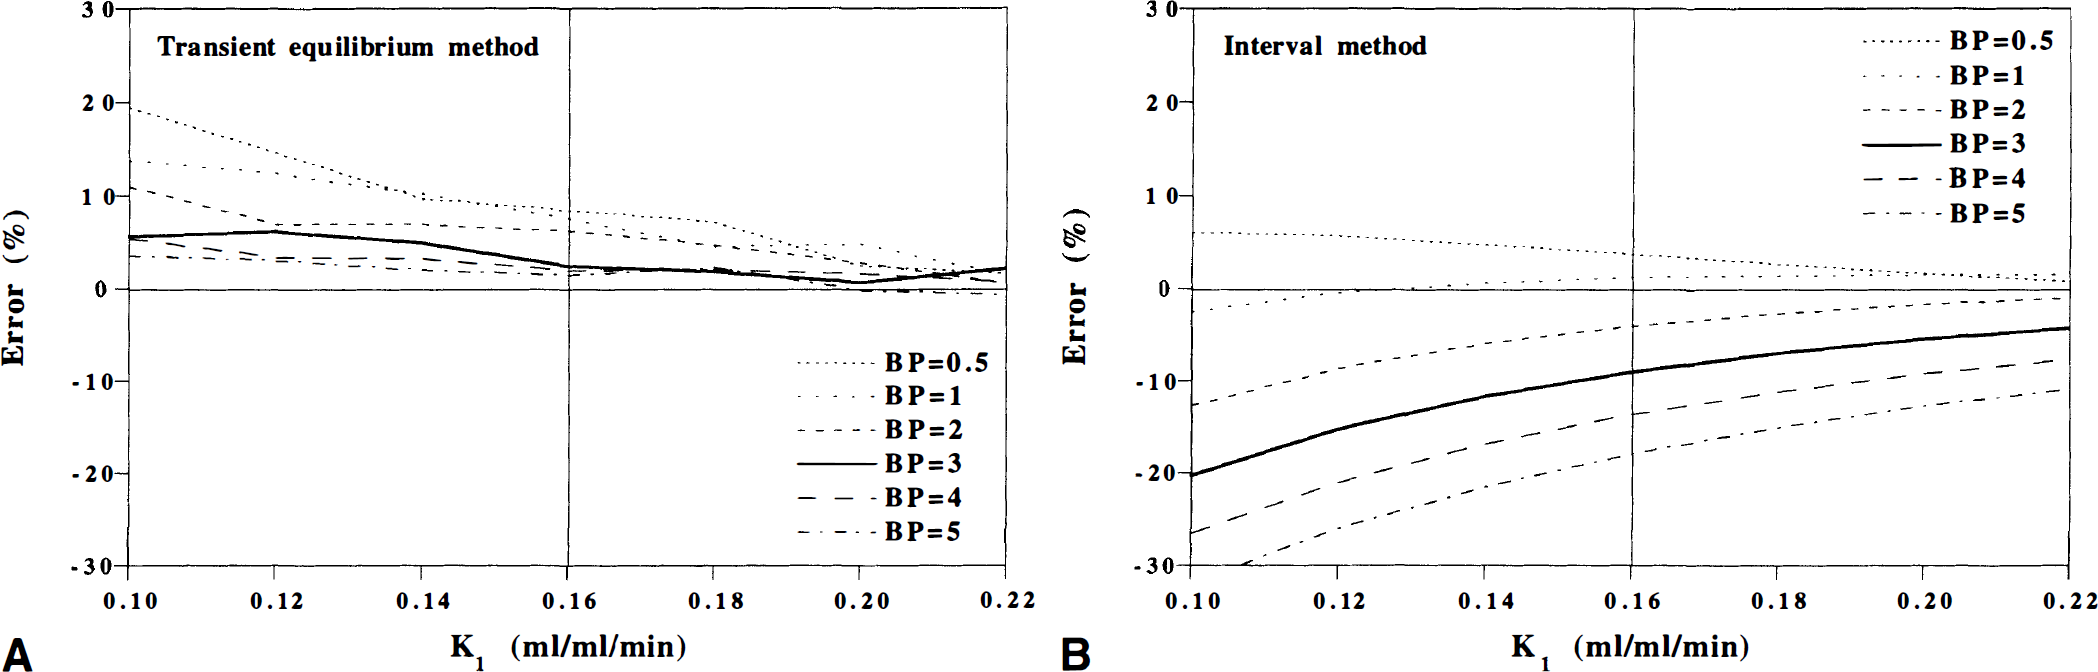
Errors of BP calculated by the interval method for assumed BP and K1 values are shown in Fig. 8B. When the assumed BP values were 0.5 to 3, errors of estimated BP were about ±10%. The largest underestimation was observed for low K1 values and high BP values.
DISCUSSION
[11C]Raclopride is a widely used radioligand for PET imaging of central D2 dopamine receptors. Throughout the years, several approaches have been suggested and applied for quantification of [11C]raclopride binding with rapid bolus injection. Theoretically, a true equilibrium condition can be obtained only by the continuous infusion of ligand. The current study compares two experimental paradigms after rapid bolus injection and continuous infusion in healthy men. The BP obtained by the continuous infusion method was found to be different by only a few percentage points from most methods used to examine [11C]raclopride binding after rapid bolus injection(Fig. 5; Table 3).
Rapid bolus injection
The time-activity curves for the putamen and the cerebellum obtained after rapid bolus injection were well described by the three-compartment model, supporting this model as being suitable for interpretation of experimental data (Fig. 3A). Although nice curve fitting was obtained in all subjects, the highest coefficient of variation was observed with the direct kinetic method (Table 3). This is probably because of an interdependency of parameters, indicating that this approach is sensitive to noise in the PET measurements (Lammertsma et al., 1996).
The transient equilibrium method, the interval method, and the late time method have an advantage when used for routine purposes, since they do not require an arterial input function. Notably, the BP values obtained by the transient equilibrium and the interval methods were in close agreement with those obtained by the direct and indirect kinetic methods (Fig. 5; Table 3), whereas the late time method caused a significant overestimation of BP.
Continuous infusion
During continuous infusion, the radioactivity in brain regions and plasma, as well as the ratio Cbref(t)/Ccer(t), reached an almost constant level in the time period of 27 to 45 minutes from the start of the measurement (Figs. 3 and 4; Table 2). This observation confirms previous observations in the rhesus monkey (Carson et al., 1997), and indicates that the true equilibrium condition can be obtained by initial rapid bolus injection and continuous infusion of [11C]raclopride in healthy men (Carson et al., 1993). Notice that the total distribution volumes for the putamen and the cerebellum and the BP were in close agreement with the rapid bolus injection and the continuous infusion (Table 1). Since both methods are based on the three-compartment model, this similarity is theoretically expected if Ccer(t) in the continuous infusion study is a valid and reliable estimate for Cn(t).
Transient equilibrium method
The observation that BP values obtained by the transient equilibrium method were in close agreement with those obtained by the direct and indirect kinetic methods and the continuous infusion method represents cross-validation of the currently used methods for quantification of [11C]raclopride binding (Fig. 5; Table 3). However, the transient equilibrium method gave a BP that was slightly higher (6%) than that obtained by the direct kinetic method (Table 3). This difference was not statistically significant but can be expected from the slight deference in time for transient equilibrium using calculated Cn(t) and cerebellum (Fig. 6). This difference was less than 3 minutes for all BP values in the simulation studies (Fig. 7B), and resulted in a less than 8% overestimation of the BP (Fig. 8A), which is at the same order as the 6% difference in the experimental data.
The time of transient equilibrium using reference region is defined as the time when the time derivative of Cbref(t) is zero (Farde et al., 1989):

Using equation 3:

Assuming that the reference region has no specific binding of [11C]raclopride to D2 dopamine receptors, following equation is valid:

Assuming identical K1 and k2 values in the reference region and in the putamen, equation 15 and equation 16 can be combined to:
which can be simplified to:

It can be seen from equation 18 that the equality Cref(t)= Cn(t) is valid at the time of transient equilibrium using reference region (Fig. 7). On the other hand, dCn(t)/dt is not necessarily equal to dCref(t)/dt at this time. This means that, in general, dCb(t)/dt is not zero at the time of transient equilibrium using reference region (equation 15). Thus, the points of transient equilibrium using reference region (dCbref(t)/dt= 0) and transient equilibrium using Cn(t) (dCb(t)/dt = 0) are different, even if the reference region and the putamen have identical K1 and k2 values.
Even if the K1 values of putamen and reference region, i.e., cerebellum are different because of neurologic and psychiatric diseases, the errors of BP as calculated by the transient equilibrium method were within +10% (Fig. 8A), supporting its validity. The largest overestimation was observed for low K1 values and low BP values. This indicates that the transient equilibrium method may not provide accurate BP when the BP value is low at the same time as the K1 value is low.
Interval method
The BP values obtained by the interval method also were in close agreement with those obtained by the direct and indirect kinetic method, the transient equilibrium method, and the continuous infusion method, indicating its validity (Table 3).
The time of transient equilibrium is dependent on the BP (Fig. 7B). Since the interval method assumes a fixed time interval, this might cause errors in BP calculated by the interval method. In the simulation study, errors of BP calculated by the interval method were about ±10% when the assumed BP values were 0.5 to 3 (Fig. 8B). Largest underestimation was observed for low K1 values and high BP values. This indicates that the interval method may not provide accurate BP when the BP value is high at the same time as the K1 value is low.
Comparing the errors of BP caused by changed BP and K1 values between the transient equilibrium method and the interval method (Fig. 8), the systematic errors of BP were larger in the interval method than in the transient equilibrium method. However, the interval method gave a lower coefficient of variation than the transient equilibrium method because of reduced statistical noise when using data from a wide interval (Table 3; Nakashima and Farde, 1995). This supports that the interval method may provide more a reliable BP in measurements of D2 dopamine receptors' occupancy after administration of neuroleptic drugs (Nordstrom et al., 1993; Nyberg et al., 1993).
Late time method
The late time method has been used in applied studies for the measurement of BP (Brooks et al., 1992; Rinne et al., 1993; Volkow et al., 1993; Lammertsma et al., 1996). However, this method was the only method that caused significant overestimation of the BP (Table 3) (Nakashima and Farde, 1995).
The experimental data and the simulation showed that Cn(t) was lower than the radioactivity concentration of reference region in the early phase and higher in the late phase after injection (Figs. 6 and 7A). In particular, the difference between Cref(t) and Cn(t) was large for a high BP (Fig. 7A). This indicates that in the early phase, when there is a rapid association of ligand to receptors, Cn(t) becomes lower, and in the late phase, when there is a net dissociation of ligand from receptors, Cn(t) becomes higher than the tracer concentration in a region without receptors (i.e., cerebellum [Farde et al., 1989]). This must have been one of main reasons for the overestimation of BP in the late time method that Cn(t) values were higher than the radioactivity concentration in cerebellum during a late phase after injection. Another reason would be that the late time method is not based on data at equilibrium conditions.
A fourth compartment
The quantification of neuroreceptors using a reference region is a conventional approach for applied clinical neuroimaging. For quantification of [11C]raclopride binding, the cerebellum has been used as a reference region (Farde et al., 1989; Lammertsma et al., 1996). However, as previously reported, there is a component of the nonspecific binding in the cerebellum, which is not infinitely fast according to the kinetic analysis (Table 1) (Farde et al., 1989; Lammertsma et al., 1996). This suggests that “a fourth compartment” with two additional rate constants k5 and k6 should be added to the standard three-compartment model (Biver et al., 1994). This problem was not addressed in the current study for two reasons: (1) it is difficult to reliably calculate six parameters (Biver et al., 1994), and (2) the major aim of the current study was to compare the rapid bolus injection paradigm to the continuous infusion paradigm, which cannot differentiate a fourth compartment.
CONCLUSION
The rapid bolus injection paradigm and the continuous infusion paradigm of [11C]raclopride were applied in each of six healthy men. All methods except the late time method gave almost identical BP values. This observation represents cross-validation of these methods. The continuous infusion method can provide a true equilibrium condition and has been suggested as a gold standard. This method can be applied for drug challenge study (Carson et al., 1997). The rapid bolus injection paradigm is simple compared with the continuous infusion paradigm. The kinetic method is a sophisticated approach; however, this requires determination of an arterial input function. The transient equilibrium method and the interval method thus are suitable for routine clinical research, since they do not require determination of an arterial input function.
Footnotes
Acknowledgements
The authors thank the members of the Karolinska PET group involved in the PET experiments for their assistance.