
Abstract
Tyrosine hydroxylase of catecholamine neurons catalyzes the synthesis of 3,4-dihydroxphenylalanine (DOPA), which is subsequently metabolized to dopamine by DOPA decarboxylase (DDC). However, DOPA is not committed to decarboxylation in vivo because export of DOPA from brain and metabolism of DOPA other than decarboxylation are possible. To estimate the relative magnitudes of the several fates of DOPA, the kinetics of the uptake and metabolism of
Keywords
Tyrosine hydroxylase (TH, EC 1.14.13.2) is thought to be the rate-limiting step in dopamine (DA) synthesis, but rate-limitation requires that the product be committed to a single pathway (i.e., that alternative fates be unavailable). In theory, the TH product 3,4-dihydroxphenylalanine (DOPA) is not wholly committed to decarboxylation by DOPA decarboxylase (DDC) because at least two additional pathways are available to this amino acid in living brain, including methylation in situ by catechol-O-methyltransferase (COMT), and export from the cells and interstitium by the facilitated diffusion transporter of large neutral amino acids. Spillover of DOPA into venous blood has been detected from human brain (Eisenhofer et al., 1989; Gjedde et al., 1995) and human sympathetic nerves (Eldrup et al., 1994). The existence of alternative routes of DOPA disposition and metabolism requires a revision of the dogma of exclusive rate control of DA synthesis by TH activity. Equally, the noncommitted nature of DOPA synthesis limits the usefulness of NSD 1015 blockade of DDC to determine the rate of DOPA, and hence DA synthesis (Carlsson et al., 1972). To test the hypothesis of multiple DOPA pathways, we established a kinetic model of [3H]tyrosine ([3H]Tyr) metabolism in brain of living rats pretreated with NSD 1015.
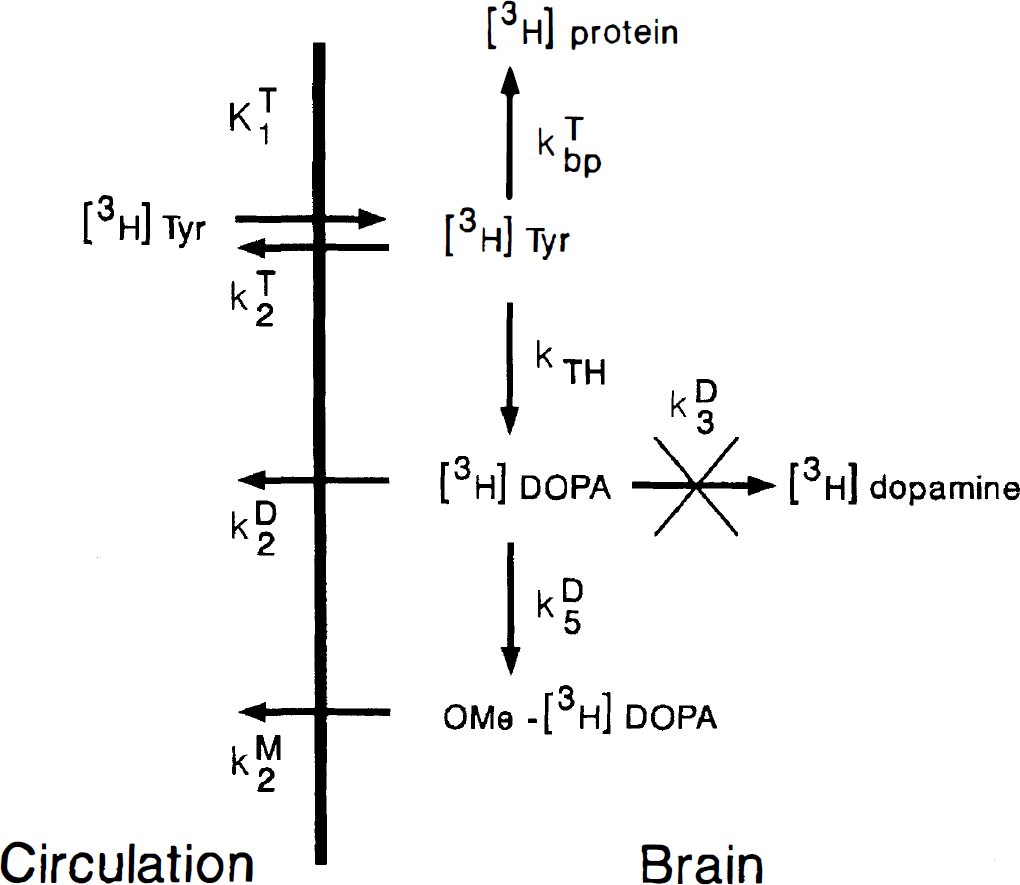
Labeled catecholamines are formed in rodent brain after peripheral injection of [3H]Tyr (Zigmond and Wurtman, 1970). We have used a multicompartmental model to describe the uptake and metabolism in rat brain of the DDC tracers 6-[18F]fluoro-DOPA (Cumming et al., 1994a) and [3H]DOPA (Cumming et al., 1995, Cumming et al., 1997). As an extension of this model, we now describe the pathway for [3H]Tyr metabolism in kinetic terms (Fig. 1). The tracer in arterial plasma is reversibly transferred into brain by facilitated diffusion (K1Tyr, mL g−1 min−1, k2Tyr, min−1). We assume that [3H]Tyr and other amino acids in brain occupy a single homogeneous compartment, also containing the enzymes TH and DDC. This assumption is valid given that [3H]Tyr, [3H]DOPA, and other large neutral amino acids are freely diffusible, such that concentration gradients between brain water and specific cellular compartments containing enzyme activities cannot occur. Thus, [3H]Tyr in brain is hydroxylated with a rate constant kTH (min−1) to yield [3H]DOPA, or is incorporated into brain protein by a series of steps with a lumped rate constant kbpTyr (min−1). The net clearance rate constant of [3H]Tyr from brain (kclTyr) is thus equal to the sum (k2Tyr + kTH + kbpTyr). Similarly, the rate constant for the net clearance of [3H]DOPA from brain (kclDOPA) is the sum of the rate constants for facilitated diffusion from brain (k2DOPA, min−1), O-methylation in situ by COMT (k5DOPA, min−1), and decarboxylation by DDC (k3DOPA, min−1). The current model of cerebral [3H]Tyr metabolism identifies a series of processes, all of which can be measured during radiotracer experiments.
The kinetic model for
METHODS
Male Wistar rats (250 to 300 g, Charles River, Québec, Canada) received heparin-containing catheters to the right femoral artery and vein while anesthetized with halothane (2%, Ayerst). After surgery, rats received NSD 1015 (3-hydroxybenzylhydrazine-2HCl, 150 mg/kg intraperitoneally, Research Biochemicals Natick, MA, U.S.A.) and were placed in plaster body casts for either 30 minutes (n = 12) or 3.5 hours (n = 12). Other rats (n = 9) received haloperidol (3 × 2.5 mg/kg intraperitoneally, Research Biochemicals) at 8-hour intervals before surgery, followed by treatment with NSD 1015 during 30 minutes. At the end of the postoperative period, [3H]Tyr (
After rapid centrifugation of whole blood, plasma was removed and mixed with an equal volume of perchloric acid (0.5 mol/L), placed on ice for 15 minutes, and recentrifuged (14,000 g × 10 min). Portions of the extracts (50 μL) corresponding to 25 μL of raw plasma were transferred to scintillation vials, and to each vial 10 mL scintillation counting fluid (BCS, Amersham, Oakville, Ontario, Canada) was added. Total perchloric acid-soluble radioactivity was counted by scintillation spectroscopy with windows set at 10 to 250 keV and calculated as disintegrations per minute (dpm) per microliter of original plasma.
For each experimental condition, rats (n = 1 to 3) were killed by decapitation at 2, 5, 10, 15, 30, or 45 minutes of tracer circulation. Brains were dissected rapidly on ice into five regions: striatum, olfactory tubercle, neocortex, hippocampus, and hypothalamus. Each brain sample was weighed, sonicated in 10 volumes of perchloric acid (0.1 mol/L), placed on ice for 10 minutes, and centrifuged (14,000 g × 10 minutes). Total perchloric acid-soluble radioactivity in 100-μL portions of the extracts, corresponding to 10 mg of brain tissue, was measured by scintillation spectroscopy and calculated as disintegrations per minute per milligram of tissue. Each protein pellet was dissolved overnight in 1 mL of organic base (NCS-II, Amersham) and transferred into plastic vials containing 200 μL glacial acetic acid and 10 mL scintillation fluid. Radioactivity concentrations in the perchloric acid-insoluble pellets were then measured and calculated as disintegrations per minute per milligram of tissue.
Plasma and brain extracts were fractionated by reversed phase HPLC (Alltech Alltima, 4.6 × 150 mm Deerfield, IL, U.S.A.). The mobile phase, consisting only of 50 mmol/L sodium phosphate (pH 3.7) and 10% methanol, was delivered at 1.2 mL/min. Retention volumes of pure standards (Sigma, St. Louis, MO, U.S.A.) were determined by ultraviolet absorption at 270 nm: V0=1.7 mL, DOPA=4.3 mL, DA=5.4 mL, Tyr=6.5 mL, and OMe-DOPA = 13.7 mL. Fractions of the eluent (20 × 0.4 minutes followed by 8 × 1 minute) were collected, and the radioactivity in each fraction measured by scintillation spectroscopy. The area of each radiochemical peak was calculated as a percentage of the total radioactivity recovered in the HPLC radiochromatogram. Recoveries of total radioactivity were greater than 90%. For each identified radiochemical species, the product of its percentage abundance in the radiochromatogram and the total soluble radioactivity per microliter of unfractionated plasma or milligram of brain was used to calculated the tracer metabolite concentrations in plasma (dpm/μL) or brain tissue (dpm/mg). The concentration of endogenous Tyr in some plasma extracts was determined by HPLC with on-line ultraviolet absorption detection (Waters Model 480) at 270 nm.
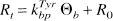
The normalized arterial plasma integrals for [3H]Tyr (Θ, minutes), defined as the integrated activity divided by
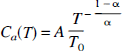
where A and T0 are arbitrary scaling constants (2000 dpm/μL and 1 minute), and T the tracer circulation time (minutes). The simulated arterial curve was integrated, and the ratio was calculated of this integral evaluated at specific circulation times to the corresponding area under the plasma curve measured for [3H]Tyr in individual rats at the end of tracer circulation. The value of this ratio for each rat then was used as a linear factor for scaling measured brain radioactivity concentrations of [3H]Tyr-, [3H]DOPA-, and [3H]-labeled protein to the common arterial curve. This normalization allows compartmental fitting of time–activity curves obtained in the brains of a population of rats with different arterial curves.
After scaling to the common arterial curve, the brain (MtTyr) and arterial (CaTyr) concentrations of [3H]Tyr are related by the convolution integral,
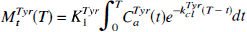
where K1Tyr is the unidirectional blood–brain clearance of [3H]Tyr, and kclTyr the net rate constant of loss of [3H]Tyr from brain by all processes identified in Fig. 1. In brain, [3H]DOPA (MtDOPA) is formed from [3H]Tyr as follows,
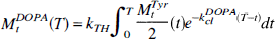
where kTH is the relative activity of TH, also known as the fractional rate constant of TH relative to its Michaelis constants (Vmax/(Km + [Tyr]), and kclDOPA the net rate constant of clearance of [3H]DOPA from brain by all processes identified in Fig. 1, equal to the sum (k2DOPA + k3DOPA + k5DOPA). The hydroxylation reaction generates equimolar amounts of tritiated water and [3H]DOPA from the elements of
In brain, the ratio of perchlorate-precipitated radioactivity to free [3H]Tyr (Rt) is (see Appendix),
where kbpTyr is the lumped rate constant for incorporation of [3H]Tyr into a perchlorate-insoluble pool (brain protein), Θb the normalized integral of [3H]Tyr in brain calculated from the integration of equation (2), and R0 the initial fraction of [3H]Tyr reversibly bound as aminoacyl-tRNA, before the “irreversible” incorporation into brain protein.
Nonlinear regressions were completed with the Matlab software (Mathworks, Inc., Cambridge, MA, U.S.A.). Best estimates are reported ±95% confidence intervals of the regression estimates, or mean ± SE of repeated measures. Significance of treatment effects was tested using the z test, or, in the case of repeated measures, the Student's t-test.
RESULTS
The only radiochemical peaks in plasma extracts were [3H]Tyr, and a peak eluting with the solvent front. This peak, presumably [3H]H2O derived from spontaneous or catalytic exchange of ring-tritium with protons from plasma water, initially accounted for less than 5% of total recovered radioactivity in plasma extracts, but comprised up to 10% of total radioactivity at 45 minutes of tracer circulation. Neither [3H]DOPA nor OMe-[3H]DOPA were detected in plasma extracts. The relation between circulation time and the normalized arterial integral for [3H]Tyr (Θ) in 12 rats treated with NSD 1015 30 minutes before tracer injection is illustrated in Fig. 2A. The population linear regression slopes (α) were 2.2 ± 0.1 at 30 minutes after NSD 1015, 2.4 ± 0.1 3 hours later, and 2.2 ± 0.1 after haloperidol. A normalized arterial [3H]Tyr curve and [3H]Tyr concentrations measured in a single rat and then scaled to the common arterial curve (α = 2.2) are illustrated in Fig. 2B.
The concentration of [3H]Tyr (500 μCi/kg intravenously) in arterial plasma of rats pretreated with NSD 1015 (150 mg/kg intraperitoneally) 30 minutes before intravenous bolus injection of the tracer. (
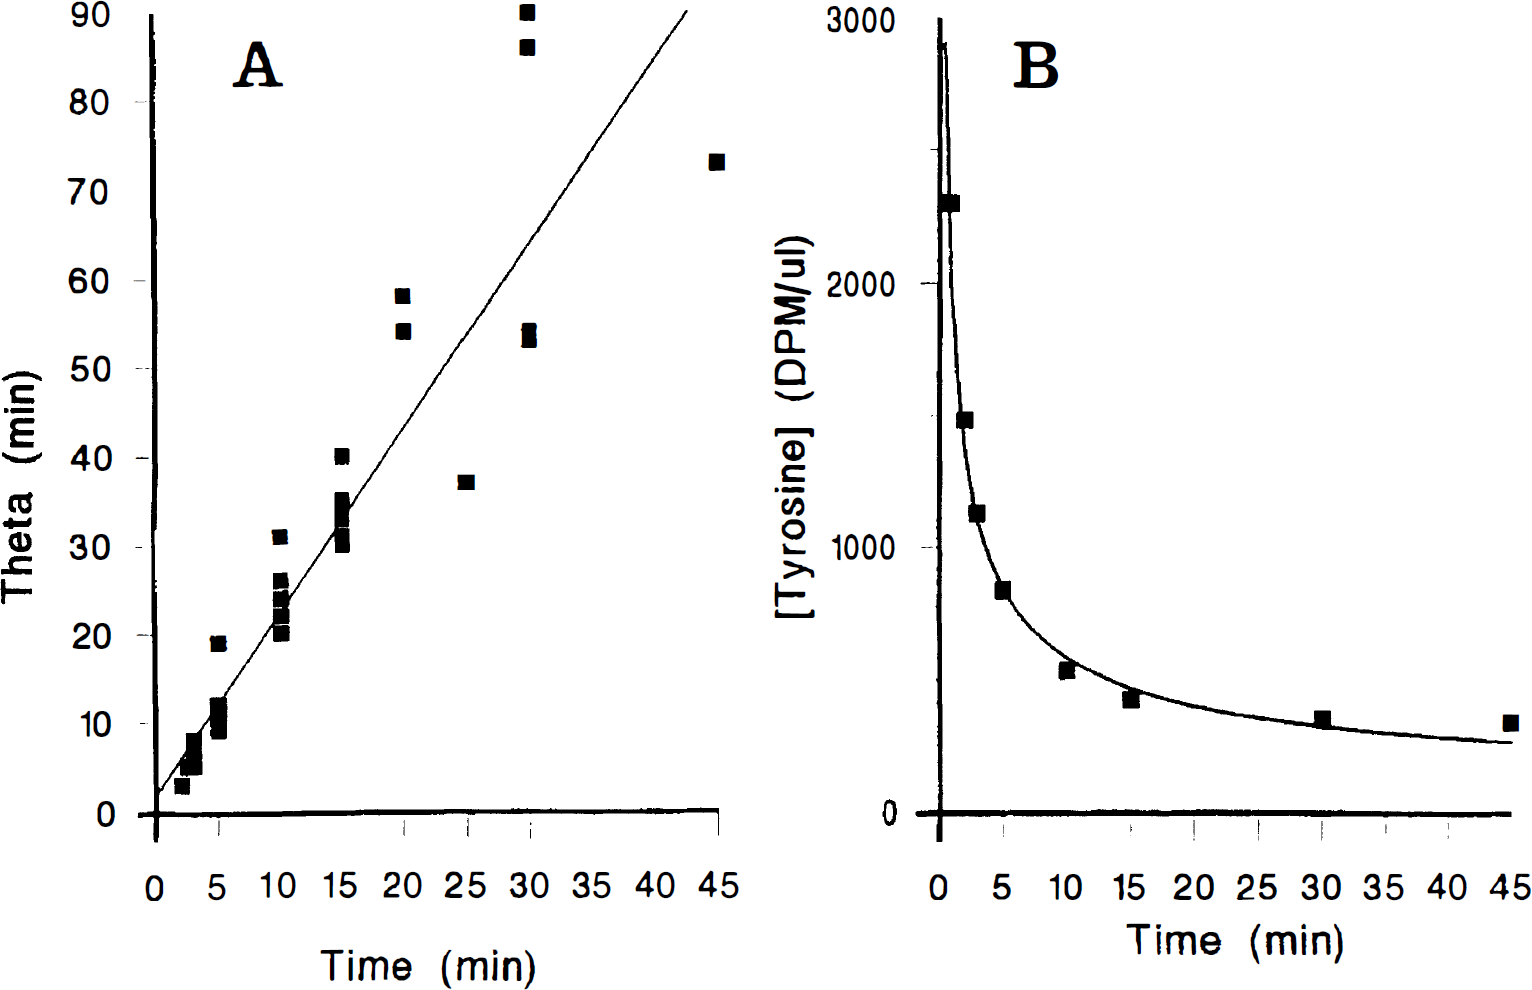
Figure 3 shows the scaled concentrations of [3H]Tyr in striatum of rats treated at 30 minutes (Fig. 3A) and 3.5 hours (Fig. 3B) before tracer injection, or after NSD 1015 plus haloperidol (Fig. 3C). The smooth curves indicate the fitting of equation (2) to the data points. The mean (±SD) unidirectional blood–brain clearances of [3H]Tyr in five brain regions were 0.064 ± 0.009 mL g−1 min−1 at 30 minutes after NSD 1015, 0.053 ± 0.005 mL g−1 min−1 3 hours later, and 0.058 ± 0.010 mL g−1 min−1 after haloperidol (Table 1). The magnitude of K1Tyr was significantly lower in three of five brain regions (striatum, olfactory tubercle, and hypothalamus) of rats treated with NSD 1015 for 3.5 hours, and in one of five brain regions (hippocampus) of haloperidol-treated rats.
The concentration of [3H]Tyr in rat striatum as a function of time after tracer injection (500 μCi/kg intravenously) in rats treated with NSD 1015 (150 mg/kg intraperitoneally) in rats receiving [3H]Tyr 30 minutes after NSD 1015 (
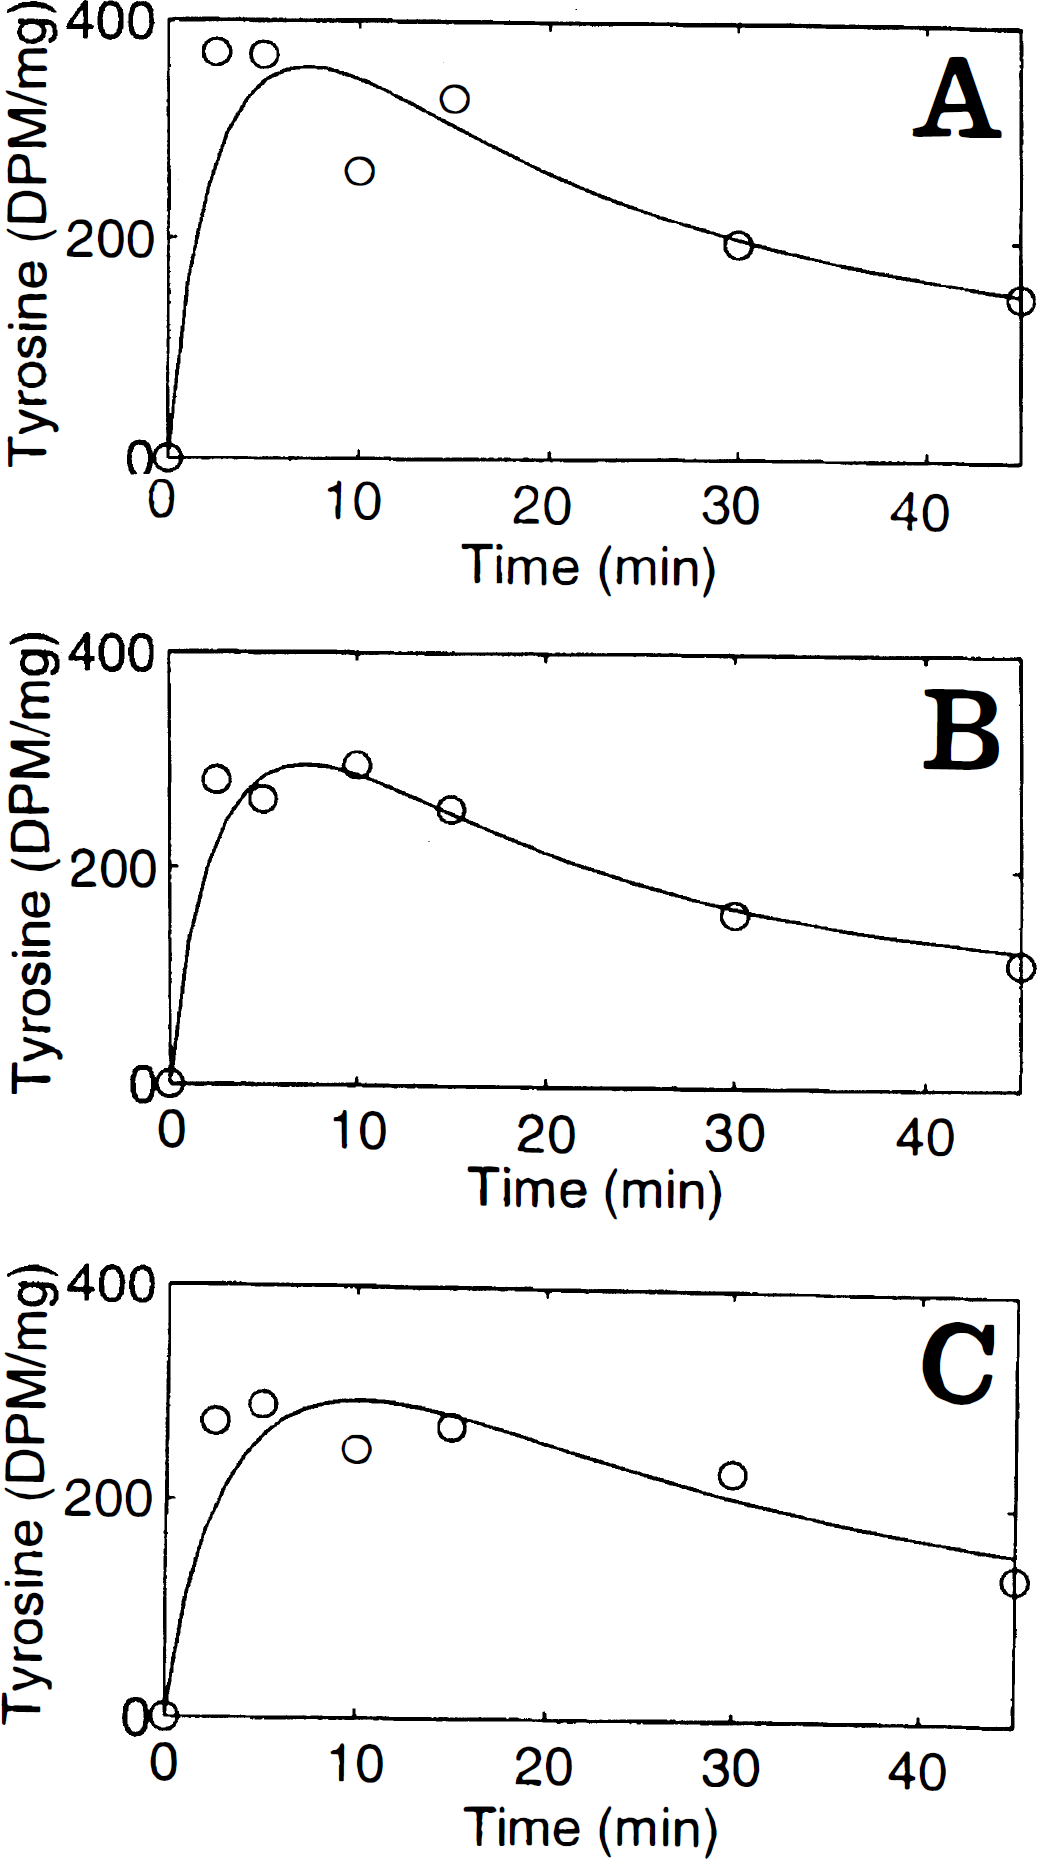
Unidirectional blood-brain clearances and net clearance rate constants of [3H]Tyr from rat brain
The unidirectional blood-brain clearance (K1Tyr) and the total loss rate constant (Kc1Tyr) for [3H]Tyr (500 μCi/kg, intravenously) in five brain regions of groups of (n) rats at 30 minutes (n = 12) or 3.5 h (n = 12) after NSD 1015 (150 mg/kg, intraperitoneally), and at 30 minutes after NSD 1015 in rats treated with haloperidol at 8-hour intervals (3 × 2.5 mg/kg, intraperitoneally, n = 9). Parameters (± 95% confidence intervals) were calculated by nonlinear fitting of a one-compartment model to the scaled [3H]Tyr concentrations measured in brain and the common arterial input function during 45 minutes. Tyrosine concentrations in brain are calculated from the product of K1Tyr (K1Tyr/Kc1Tyr) and the plasma Tyr concentrations measured for each population, hal, haloperidol. Significance of differences from 0.5 h group: *P<0.05; † P<0.001; ‡not significant.
The mean value (±SD) of kclTyr in five brain regions was 0.149 ± 0.013 min−1 at 30 minutes and 3.5 hours after NSD 1015, but was reduced to 0.109 ± 0.016 min−1 after haloperidol (P<0.01, Student's t-test). The corresponding mean (±SD) apparent equilibrium distribution volumes were unaffected by drug treatments (VfTyr = K1Tyr/kclTyr; 0.42 ± 0.03, 0.36 ± 0.02, and 0.053 ± 0.03 mL g−1). The mean Tyr concentrations (±SD) measured in arterial plasma (n = 6) were 64 ± 4 μmol/L at 30 minutes after NSD 1015, 67 ± 13 μmol/L 3 hours later, and 110 ± 17 μmol/L after haloperidol. Brain free Tyr concentrations, calculated as the product of these measured plasma concentrations and VfTyr, thus were 40% of the plasma concentrations (Table 1).
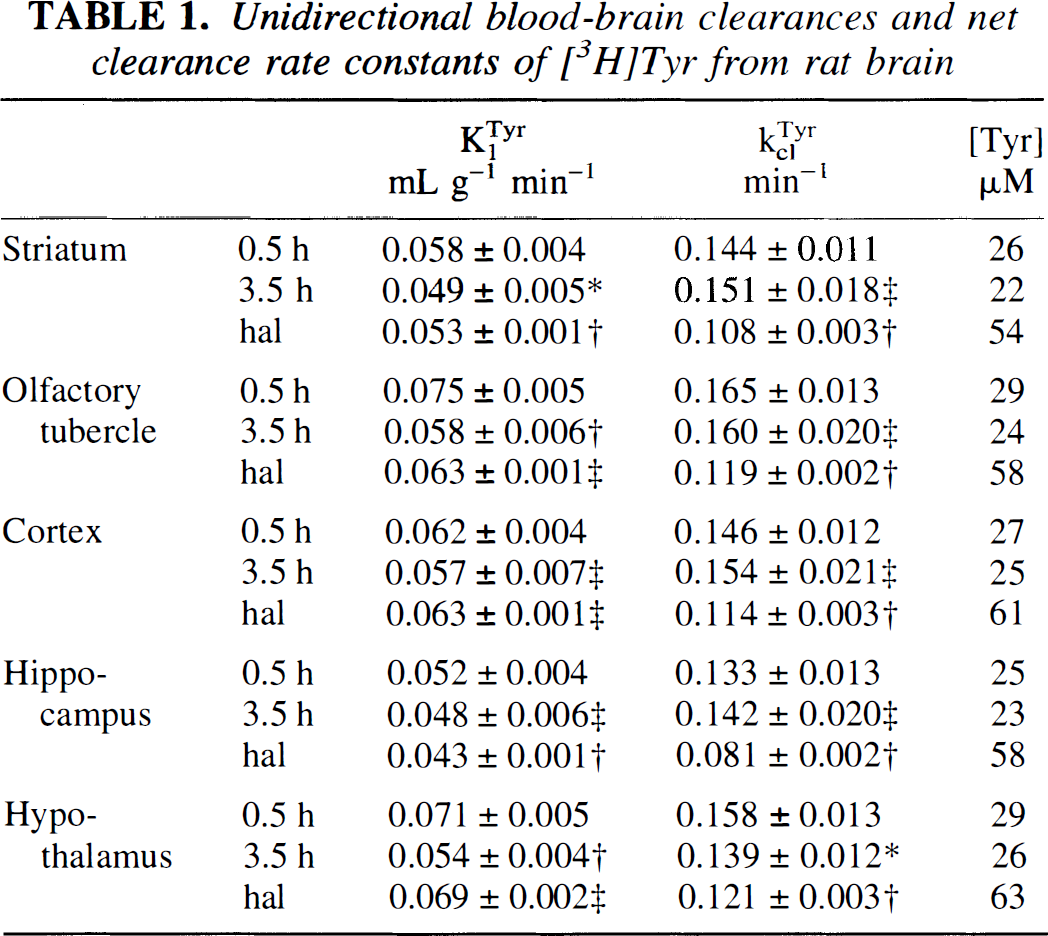
Figure 4 illustrates the scaled concentrations of [3H]DOPA measured in striatum of rats with tracer injections at 30 minutes (Fig. 4A) and 3.5 hours after NSD 1015 (Fig. 4B), or after haloperidol plus NSD 1015 (Fig. 4C). The smooth curves indicate the fitting of equation (3) to the data. The rate constants for the relative TH activity ranged from 0.0001 min−1 in cortex to 0.0048 min−1 in striatum at 30 minutes after NSD 1015 (Table 2). Three hours later, the magnitude of kTH had increased nearly twofold in striatum and other brain regions, excepting the hypothalamus. Haloperidol administration resulted in a fourfold stimulation of kTH in striatum.
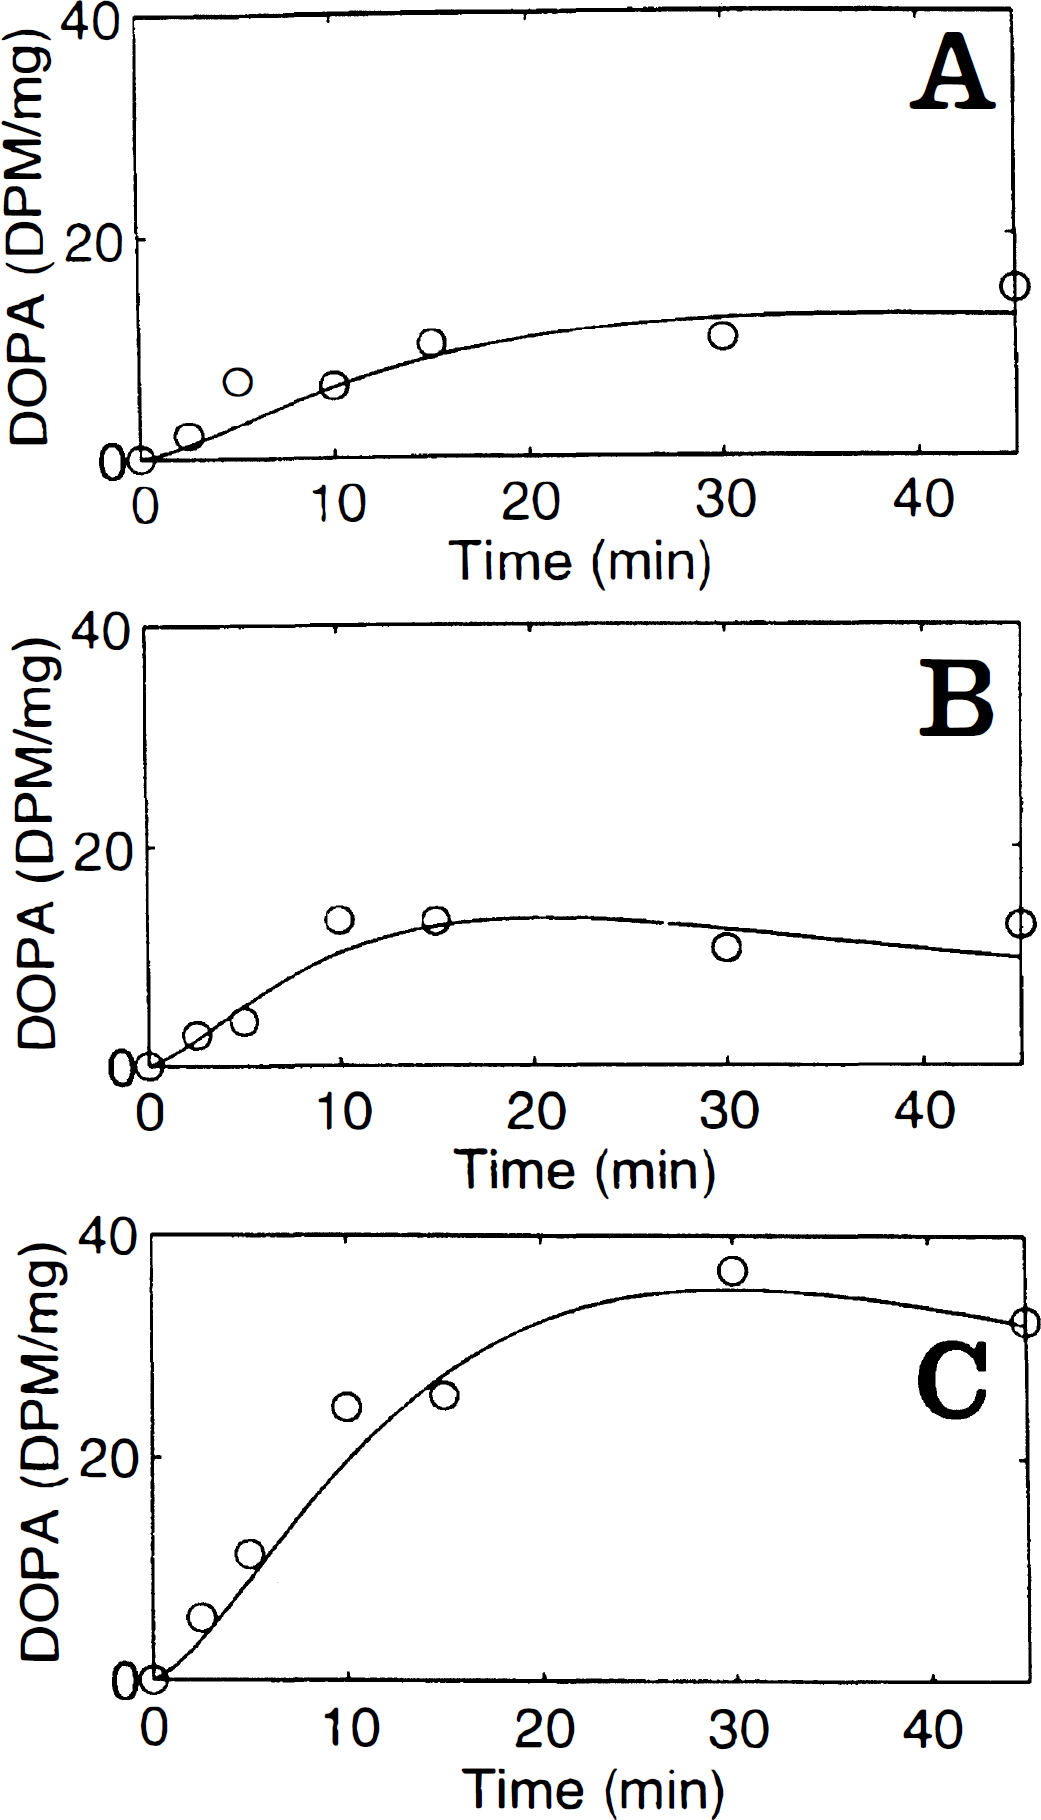
The concentrations of [3H]DOPA in striatum of rats after [3H]Tyr injection (500 μCi/kg intravenously) at 30 minutes (
Relative tyrosine hydroxylase activity and net clearance rate constant of [3H] DOPA from brain
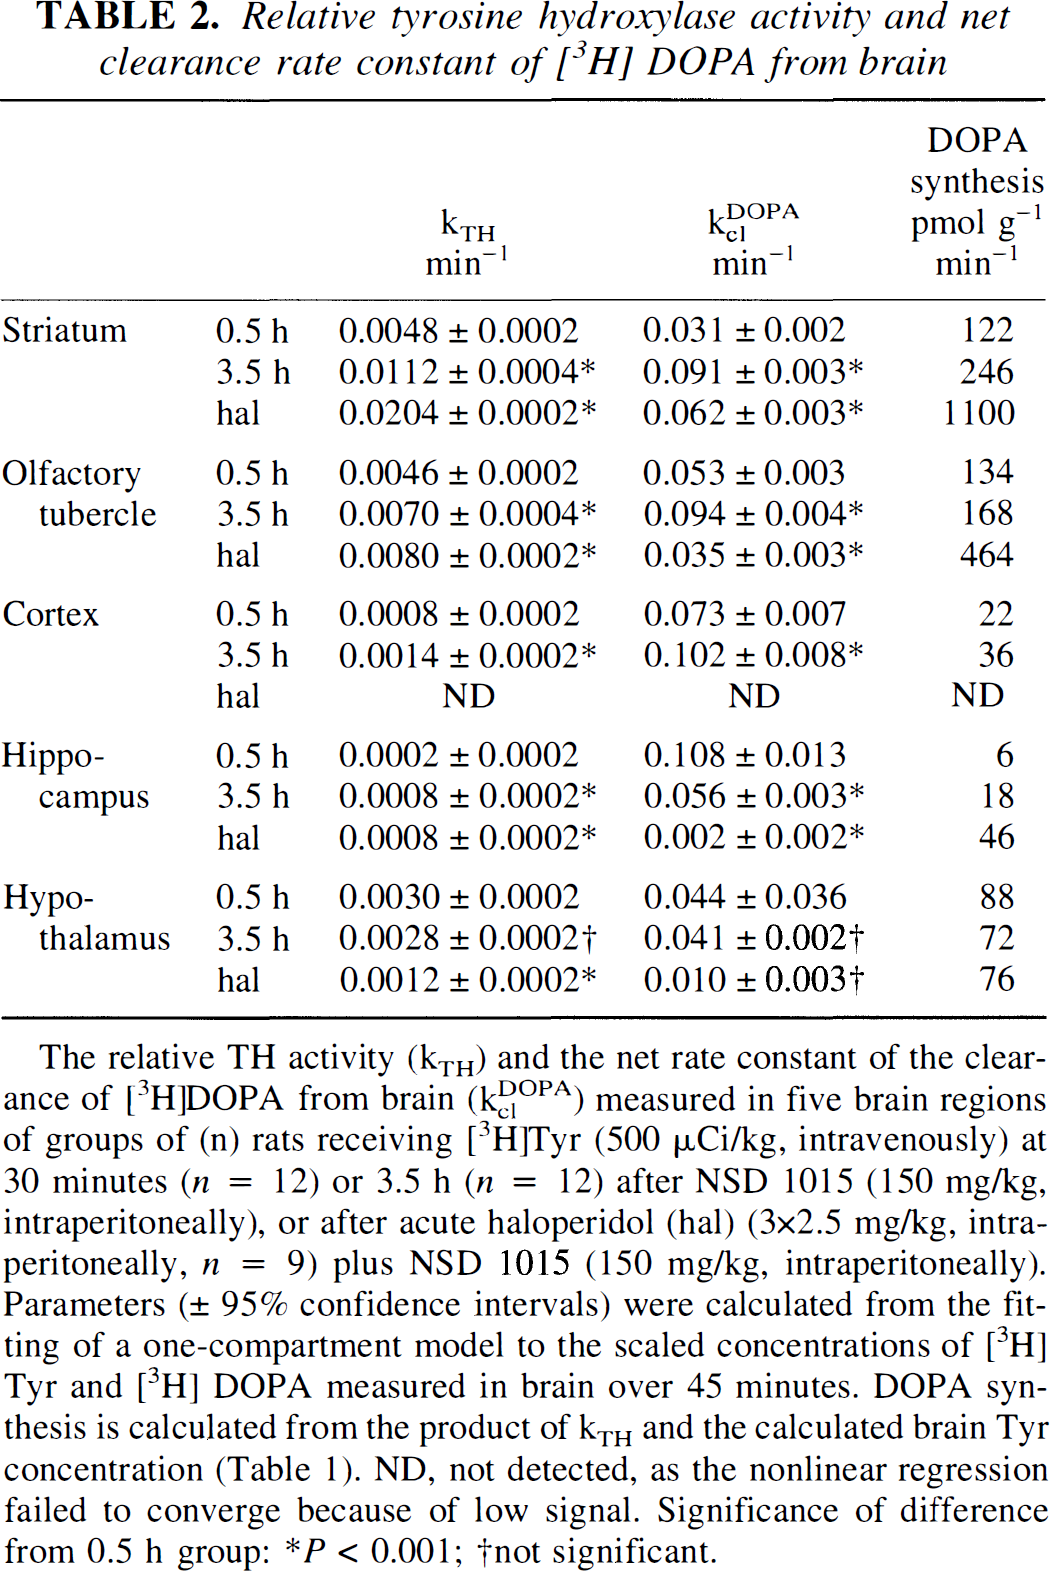
The relative TH activity (kTH) and the net rate constant of the clearance of [3H]DOPA from brain (kc1DOPA) measured in five brain regions of groups of (n) rats receiving [3H]Tyr (500 μCi/kg, intravenously) at 30 minutes (n = 12) or 3.5 h (n = 12) after NSD 1015 (150 mg/kg, intraperitoneally), or after acute haloperidol (hal) (3×2.5 mg/kg, intraperitoneally, n = 9) plus NSD 1015 (150 mg/kg, intraperitoneally). Parameters (± 95% confidence intervals) were calculated from the fitting of a one-compartment model to the scaled concentrations of [3H] Tyr and [3H] DOPA measured in brain over 45 minutes. DOPA synthesis is calculated from the product of kTH and the calculated brain Tyr concentration (Table 1). ND, not detected, as the nonlinear regression failed to converge because of low signal. Significance of difference from 0.5 h group: *P<0.001; †not significant.
The accumulation of [3H]-labeled protein in rat striatum as a function of the normalized integrals of free brain [3H]Tyr 30 minutes or 3.5 hours after NSD 1015, and after NSD 1015 together with haloperidol pretreatment, are illustrated in Fig. 5. The average initial bound fraction R0 of [3H]Tyr in five brain regions (±SD) was 0.19 ± 0.04 in rats treated only with NSD 1015 either 30 minutes or 3.5 hours previously, but increased to 0.27 ± 0.02 in the haloperidol-treated group (Table 3, P<0.005, Student's t-test). The mean rate constants (±SD) for incorporation of [3H]Tyr into protein in five brain regions was 0.030 ± 0.004 min−1 (±SD) in rats treated only with NSD 1015 either 30 minutes of 3.5 hours previously, but was significantly lower (0.016 ± 0.001 min−1) in the group with haloperidol pretreatment. Rates of incorporation of [3H]Tyr into brain protein are calculated as the product of kbpTyr (Table 3) and the calculated brain Tyr concentrations (Table 1). In striatum of all three treatment groups, the rates so calculated are close to 750 pmol Tyr per gram of brain tissue per minute.
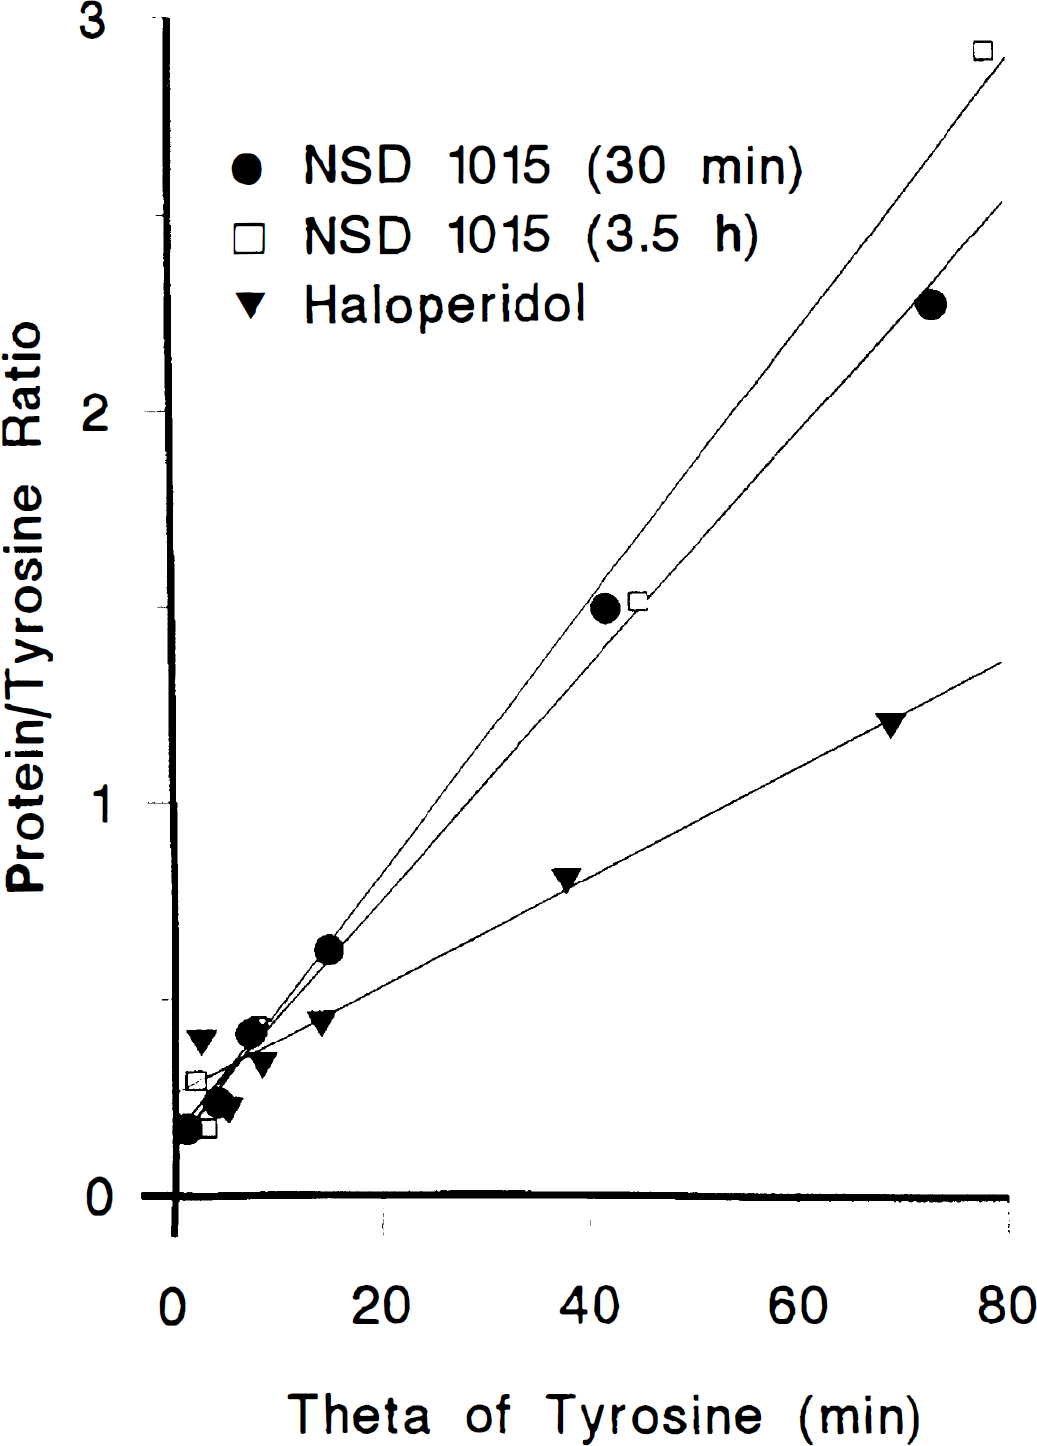
The incorporation of [3H]Tyr into a perchlorate-insoluble fraction in striatum of groups of (n) rats receiving [3H]Tyr (500 μCi/kg intravenously) at 30 minutes (n = 12) or 3.5 hours (n = 12) after NSD 1015, or after acute haloperidol plus NSD 1015 (n = 9). The ratio of precipitated radioactivity to free [3H]Tyr (R) in striatum is plotted as a function of the normalized integral for free [3H]Tyr in striatum (Θ, minutes). Each point is the mean ratio obtained in two or three rats scaled to a common arterial curve. The linear regression slopes of this relation (smooth lines) are the lumped rate constants for incorporation of [3H]Tyr into protein. The ordinate intercepts are the apparent protein precursor volumes (R0) for [3H]Tyr in brain.
Rate constants calculated for the incorporation of [3H] Tyr into brain protein
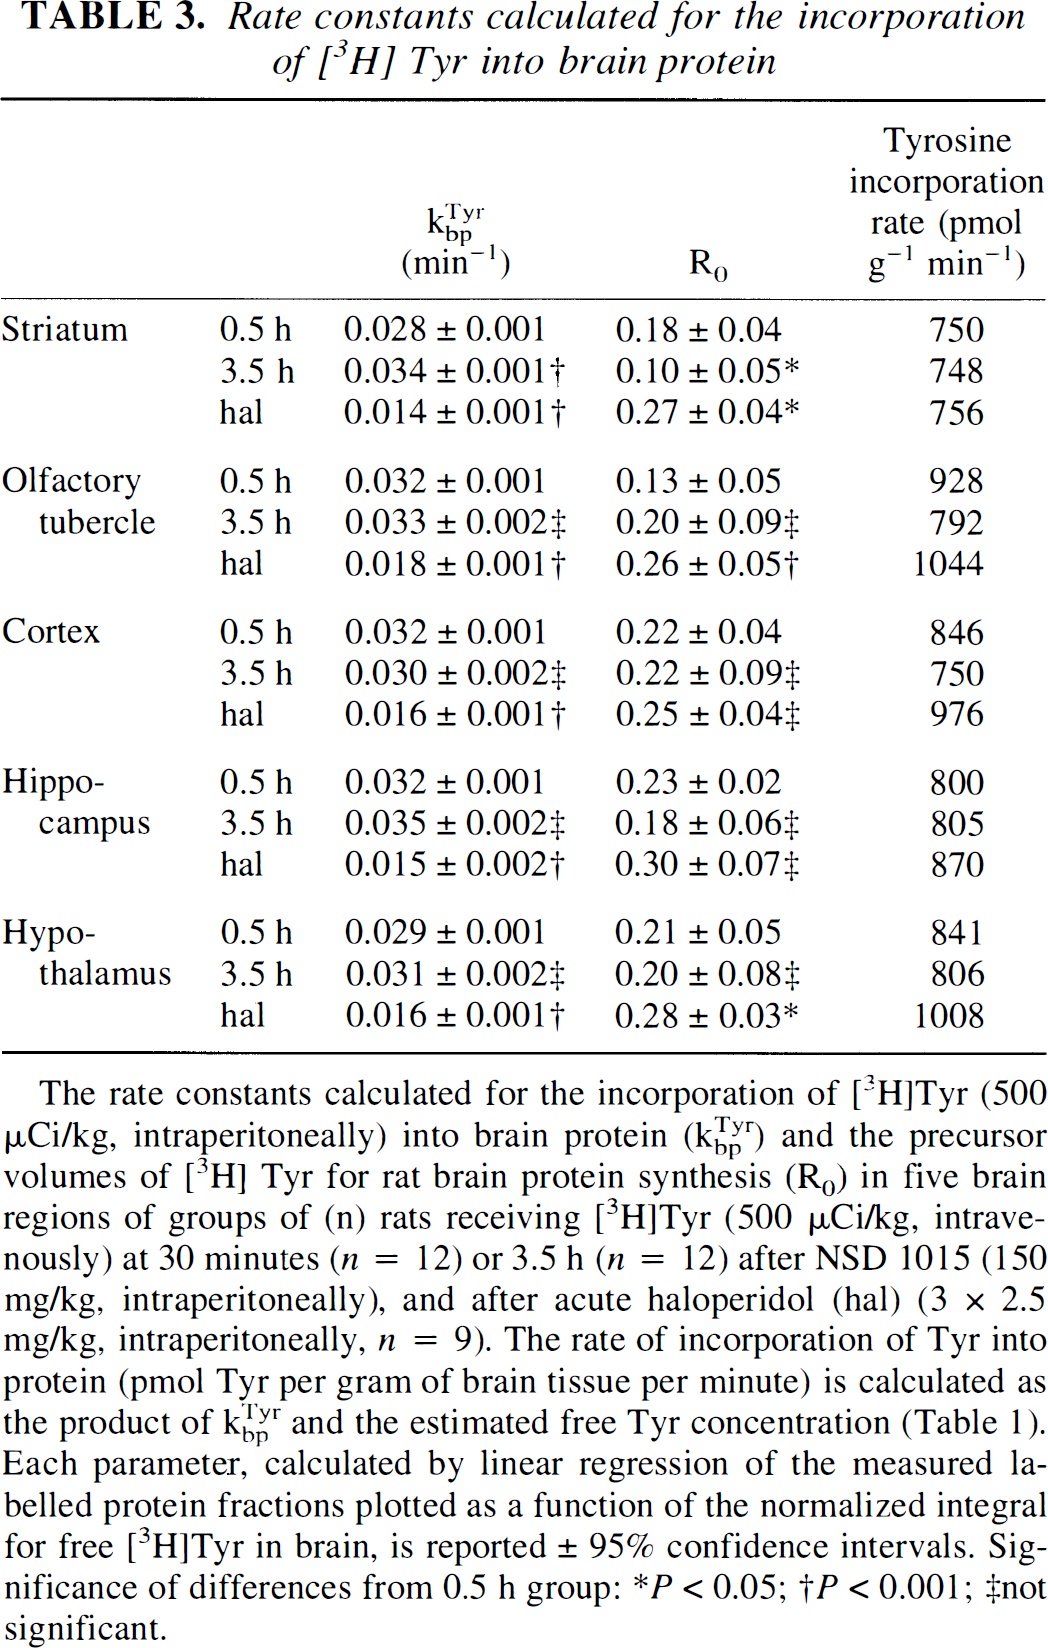
The rate constants calculated for the incorporation of [3H]Tyr (500 μCi/kg, intraperitoneally) into brain protein (kbpTyr) and the precursor volumes of [3H] Tyr for rat brain protein synthesis (R0) in five brain regions of groups of (n) rats receiving [3H]Tyr (500 μCi/kg, intravenously) at 30 minutes (n = 12) or 3.5 h (n = 12) after NSD 1015 (150 mg/kg, intraperitoneally), and after acute haloperidol (hal) (3 × 2.5 mg/kg, intraperitoneally, n = 9). The rate of incorporation of Tyr into protein (pmol Tyr per gram of brain tissue per minute) is calculated as the product of
Subtracting from kclTyr (Table 1) the contributions of TH activity (Table 2) and the trapping of [3H]Tyr in protein (Table 3) yields the brain–blood clearance rate constant for Tyr (k2Tyr), which had a mean value (±SD) of 0.12 ± 0.02 min−1 in five brain regions at 30 minutes after NSD 1015.
DISCUSSION
The unidirectional blood–brain clearances of [3H]Tyr in the present study (Table 1) agree well with estimates from a study in which NSD 1015 was not used (Cumming et al., 1994b). Therefore, NSD 1015 does not appear to interfere directly with the unidirectional blood–brain clearance of [3H]Tyr. The blood–brain transporter for large neutral amino acids is known to be saturated with its several substrates (Gjedde et al., 1993). Therefore, it is unlikely that the somewhat lower unidirectional blood–brain clearance of [3H]Tyr after prolonged NSD 1015 exposure is related to altered concentrations of Tyr and other large neutral amino acids in plasma. The changes in the magnitude of K1Tyr may reflect altered cerebrovascular tone after catecholamine depletion. Patients treated with neuroleptics have normal plasma levels of Tyr and other large neutral amino acids (Potkin et al., 1983). The present experiments with the neuroleptic-treated rats were carried out 1 month after the other groups, suggesting that the elevated plasma Tyr concentrations may have resulted from in-group variability rather than drug treatment.
In the present study, the predominant pathway for [3H]Tyr in rat brain (3% per minute) was protein synthesis. Likewise,
We have previously measured the relative DDC activity in the rat striatum with respect to 6-[18F]fluoro-DOPA (0.17 min−1, Cumming et al., 1994a) and [3H]DOPA (0.26 min−1, Cumming et al., 1995; 0.20 min−1, Cumming et al., 1997). In the present study, blockade of DDC was complete at 30 minutes after NSD 1015, although traces of [3H]DA were formed in striatum at 3.5 hours after DDC inhibition (not shown). Traces of OMe-[3H]DOPA were detected in striatum and olfactory tubercle in the current study, but these concentrations were variable and therefore uninformative about the magnitude of k5DOPA, the COMT activity in brain.
In the present study, the activity of TH was stimulated in striatum, olfactory tubercle, cortex, and hippocampus, but not in hypothalamus (Table 2) after prolonged blockade of DDC and after subchronic haloperidol treatment. The neuroleptic-induced stimulation of TH in rat striatum is related to an increased affinity of the enzyme for reduced pteridine, the limiting substrate (Zivkovic et al., 1974, Levine et al., 1979, Pradhan et al., 1981), which is mediated by DA autoreceptors (Strait and Kuczenski, 1986) through regulation of adenylate cyclase activity (Goldstein et al., 1976, El Mestikawy and Hamon, 1986). The insensitivity of hypothalamic TH activity to neuroleptics, which has been noted previously (Zivkovic et al., 1974), may reflect the location of TH in hypothalamus within noradrenergic fibers, or other compartments lacking DA autoreceptors.
The present finding of increased magnitude of kTH in the rat basal ganglia after prolonged DDC inhibition may reflect feedback activation of TH in response to DA depletion. Synthesis of DA in the rat medial prefrontal cortex is impaired in several experimental models that reduce brain Tyr levels, but Tyr supplements only enhance DA synthesis when the neurons are stimulated (Tam and Roth, 1997). Although TH activity may not normally perturb cerebral Tyr concentrations, the release of DA in striatum of rats with partial nigrostriatal lesions (Melamed et al., 1980) and in nucleus accumbens (During et al., 1988) after pharmacologic stimulation of DA synthesis (Woods and Meyer, 1991) is potentiated by exogenous Tyr. We see evidence for this phenomenon in the striatum of haloperidol-treated rats, where the calculated Tyr concentration is 10% lower than in other brain regions (Table 1).
The initial rate of accumulation of DOPA in striatum after NSD 1015 treatment is reduced by DA autoreceptor agonists or after blockade of DA catabolism with pargyline, and is increased after treatment of rats with neuroleptic drugs (Argiolas et al., 1982), induction of hypoxia in pigs (Tammela et al., 1993), and after stress in rat hippocampus (Nissenbaum and Abercrombie, 1992). In the present study, the product of kTH and the calculated brain Tyr content equals the DOPA synthesis rate. The present estimates of this rate in striatum (Table 2) are therefore within the reported range of DOPA accumulation in striatum after NSD 1015: 100 pmol g−1 min−1 (Carlsson, 1972) to 400 pmol g−1 min−1 (see Reith et al., 1990). Present estimates of DOPA synthesis rate in cortex are unreliable because of low signal. Complete inhibition of DDC does not occur immediately after NSD 1015 treatment, suggesting that DOPA concentrations measured in brain extracts may be substantially lowered by the postmortem activity of DDC or other enzymes. Indeed, microwave fixation yielded threefold higher cerebral DOPA levels than did decapitation (Thiede and Kehr, 1981).
At a steady state, the cerebral concentrations of Tyr and DOPA are related as follows:
Using values in Table 1 and Table 2, we can calculate the DOPA concentration in striatum to be 4 μmol/L at 30 minutes and 3 hours after NSD 1015 and 16 μmol/L after haloperidol. This finding is comparable with the threefold increase in DOPA efflux reported after haloperidol in microdialysis studies (Westerink et al., 1990). After haloperidol, the relative TH activity in striatum (Table 2) increased to the same magnitude as the rate constant for incorporation of Tyr into brain protein (Table 3), suggesting that TH activity in a stimulated condition could be detected in human brain by positron emission tomography with labeled Tyr.
The mean (±SE) estimate of the total loss rate constant [3H]DOPA from five brain regions (kclDOPA) at 30 minutes after NSD 1015 (0.06 ± 0.02 min−1) is nearly identical to an earlier estimate (Cumming et al., 1995). The sum of this brain–blood clearance rate constant (k2DOPA) and the relative DDC activity (k3DOPA) measured in the unperturbed brain, and assuming k5DOPA to have a value close to zero (Cumming et al., 1995), yields the native value of kclDOPA, were DDC unblocked. Using these estimates, equation (5) then predicts that steady-state DOPA concentrations were 0.1 μmol/L in cortex and 0.4 μmol/L in striatum before DDC inhibition. The somewhat lower basal DOPA concentrations measured in rat brain after microwave fixation (0.05 to 0.1 μmol/L; Thiede and Kehr, 1981; Westerink et al., 1982) may have been reduced by thermal decomposition of some of the endogenous DOPA.
The relative magnitudes of kclDOPA in basal ganglia after blockade of DDC (0.03 to 0.05 min−1) and the rate constant for DDC in unperturbed striatum (0.26 min−1, Cumming et al., 1995; 0.20 min−1, Cumming et al., 1997) suggest that 75% to 90% of endogenously formed DOPA in rat striatum normally is committed to DA synthesis in these structures. The current results obtained in rat are not in complete agreement with our estimate based on positron emission tomography studies with FDOPA that 50% of DOPA is exported from normal human caudate/putamen (Gjedde et al., 1993). This discrepancy may be attributed to the lower magnitude of k3DOPA obtained in human positron emission tomography studies with FDOPA than in rat studies with labeled DOPA. From earlier estimates of k3DOPA (Cumming et al., 1995) in cortex and hippocampus (0.02 min−1), and hypothalamus (0.04 min−1), we calculate that more than half of DOPA formed in these tissues is normally metabolized by COMT or exported from rat brain, rather than decarboxylated in situ.
The present study predicts that DOPA concentrations in striatum should increase from 0.4 to 4 μmol/L after acute treatment with NSD 1015, a prediction contrasting with the 100-fold increases commonly measured in striatal microdialysates (Westerink et al., 1990; Nakemura et al., 1992; Hashiguti et al., 1993; Tammela et al., 1993). This discrepancy suggests that additional factors such as compartmentalization in vivo or postmortem effects may result in systematic underestimation of basal DOPA in brain tissue or the basal efflux of DOPA in microdialysates. The plateau in cerebral DOPA concentration commonly observed several hours after DDC blockade may well reflect TH activity at the new steady state (equation [5]), but we currently find that a twofold activation of TH in the basal ganglia has occurred, possibly is a consequence of depletion of DA. Thus, steady-state DOPA concentrations attained several hours after NSD 1015 occur as a function of perturbed TH activity.
In conclusion, a substantial fraction of DOPA formed within living brain is not used as precursor for catecholamine synthesis but is exported from brain. It follows that the activity of DDC in vivo determines the relative magnitude of the several possible fates of DOPA. The elevated DDC activity from rodent striatum measured ex vivo after neuroleptic treatment (Zhu et al., 1992; Hadjiconstantinou et al., 1993) and in striatum of living rats treated with flupenthixol (Cumming et al., 1997), and the decreased magnitude of DDC activity in rat striatum after acute pargyline treatment (Cumming et al., 1995) suggest that the fraction of endogenous DOPA trapped as catecholamines can be modulated pharmacologically, probably via activation of autoreceptors on DA terminals.
Footnotes
Acknowledgments
The authors thank Ms. Christine Laliberté and Ms. Marie-Claude Bouchard for technical assistance.
Abbreviations used
APPENDIX
To normalize individual animals to a common arterial input function, we find it convenient to model the arterial concentration of a tracer after a bolus injection (Ca(T)) as a power function,
where A is an arbitrary concentration (dpm/μL), T0 a constant (1 minute), and T the tracer circulation time (minutes). Integrating this equation with respect to time, we find,
Dividing this by the preceding, we have,
From the definition of the normalized arterial integral Θ (Gjedde et al., 1981, 1982; Patlak et al., 1983), it follows that the slope α of the relation between time and Θ is 1/(1 – b), which yields, on substitution and rearrangement,
The current calculation of the rate constant for incorporation of [3H]Tyr into brain protein represents a novel application of the Gjedde-Patlak plot to the accumulation of perchlorate-precipitable [3H]Tyr moieties. Assuming protein synthesis to be irreversible in the time of the current experiment, the rate of accumulation of radioactivity in the protein pool can be expressed as,
where Mprot is the concentration of labeled protein in brain tissue (dpm/mg), kbp the fractional rate constant for the incorporation of [3H]Tyr into brain protein, and MTyr the concentration of [3H]Tyr in brain. When integrated, this yields,
The total radioactivity in perchlorate acid-precipitated pellets from brain tissue (Mpel) is expressed as,
where Mt–RNA is the measured radioactivity (presumably as aminoacyl-tRNA), which is insoluble in perchloric acid but is not yet committed to protein synthesis. Therefore,
where Θb is the normalized integral of free [3H]Tyr in brain. We express this equation as,
The ordinate intercept (R0) of the measured ratio R as a function of the normalized integral for [3H]Tyr in brain corresponds to the apparent precursor volume of [3H]Tyr for protein synthesis, presumably bound as aminoacyl-tRNA, relative to the concentration of free [3H]Tyr in brain.