
Abstract
The heme oxygenase-1 gene, HO-1, induced by heme, ischemia, and heat shock, metabolizes heme to biliverdin, free iron, and carbon monoxide. Though the distribution of HO-1 has been described in normal rat brain, little is known about how extracellular heme proteins in the subarachnoid space distribute in brain. To address this issue, hemoglobin was injected into the cisterna magna of adult rats. Expression of HO-1 in these animals was compared with saline-injected, BSA-injected, and uninjected controls. Western blot analysis showed that 24 hours after injection oxyhemoglobin increased HO-1 levels approximately four- to fivefold in all brain regions studied compared with saline-injected and BSA-injected controls. In the brain, HO-1 immunoreactivity was evident at 4 hours and peaked at 24 hours after oxyhemoglobin injections, returning to control levels by 4 to 8 days. This HO-1 induction was detected mainly in cells with small, rounded somas bearing two to four truncated processes, a morphology consistent with that of microglia. These cells were double-stained with the microglial marker, OX42, in every brain region examined. It is proposed that subarachnoid hemoglobin may be taken up into microglia wherein heme induces HO-1.
The heme oxygenase enzymes (HO) catalyze the conversion of heme to biliverdin, carbon monoxide, and iron (Fe2+; Maines, 1988; Abraham et al., 1988). With the discovery that nitric oxide has important signaling functions in the brain (Moncada et al., 1989; Bredt and Snyder, 1989; Dawson, 1994), it has been suggested that carbon monoxide derived from HO activity might also have important biologic functions in brain and other organs (Verma et al., 1993; Vincent et al., 1994; Morita et al., 1995). Inhibition of HO activity with metal protoporphyrins (Rublevskaya and Maines, 1994) reverses long-term potentiation and affects synaptic activity in the hippocampus (Stevens and Wang, 1993; Zhuo et al., 1993; Bernabeu et al., 1995; Bing et al., 1995).
Heme oxygenase, like nitric oxide synthase, has a complex biology and tissue-specific expression. Heme oxygenase has at least two isoforms, HO-1 and HO-2 (Maines, 1988). These proteins are coded for by separate genes, with mRNA transcripts of 1.8 kb for HO-1 and 1.3 kb and 1.9 kb for HO-2 (Muller et al., 1987; Trakshel and Maines, 1989; McCoubrey and Maines, 1994; Dwyer et al., 1992). In the central nervous system, HO-1, also known as heat shock protein-32 (HSP32), a member of the heat shock protein family (Shibahara et al., 1987, 1993), is present in low levels, is thought to be localized mainly to glial cells, and can be induced by a number of stressors (Ewing et al., 1992; Maines et al., 1993; Matz et al., 1996a, 1996b, 1996c). The other isoform, HO-2, is localized mainly in neurons and is a constitutively expressed protein (Ewing and Maines, 1992). It is the predominant isoform in brain and is generally not inducible except by glucocorticoids (Sun et al., 1990; Dwyer et al., 1995; Weber et al., 1994).
The inducible HO-1 gene is regulated by a number of elements in its promoter, including a heat shock element (HSE), rendering the gene responsive to heat shock (Shibahara et al., 1987, 1993; Okinaga and Shibahara, 1993; Mitani et al., 1991; Ewing and Maines, 1991); an AP-1 site, suggesting regulation by Fos/Jun immediate early gene family members (Alam and Den, 1992); a NFκB site, which may modulate responses to hypoxia and oxidative stress (Lavrovsky et al., 1994); and a metal or heme binding site responsive to heme (Muller et al., 1987; Eisenstein et al., 1991; Alam et al., 1994). Heme oxygenase-1 is induced in brain and other tissues by such agents as heavy metal ions, sulfhydryl compounds, cerebral ischemia, and heat shock (Abraham et al, 1988; Keyse and Tyrrell, 1989; Ewing and Maines, 1991; Ewing et al., 1992; Maines et al., 1993; Paschen et al., 1994; Takeda et al., 1994; Nimura et al., 1996; Massa et al., 1996). This enzyme is also inducible in culture and in tissues by hypoxia, hydrogen peroxide or free radicals, and drugs that decrease glutathione levels (Applegate et al., 1991; Basu-Modak and Tyrrell, 1993; Murphy et al., 1991; Keyse and Tyrrell, 1989, 1990; Dwyer et al., 1992). Prior induction of HO-1 protects cells from subsequent exposure to lethal levels of the same stress (Keyser and Tyrrell, 1990; Balla et al., 1992, 1993; Kutty et al., 1995; Nath et al., 1992).
Heme oxygenase-1 and HO-2 are the only known enzymes that metabolize heme (Abraham et al., 1988; Maines, 1988). Within cells, heme can be derived biosynthetically, and a number of proteins normally present are potential substrates for HO, including the heme moiety in guanylate cyclase proteins, nitric oxide synthase, cytochrome proteins of mitochondria, and others (Schacter, 1988). It is not known if there are extracellular sources of heme or heme-proteins. Although the central nervous system (CNS) is not ordinarily exposed to free hemoglobin (Hb), blood can be released into the subarachnoid space in a variety of pathologic conditions (Bonita and Thomson, 1985; Delgado et al., 1985; Grote and Hassler, 1988; Koeppen et al., 1993; MacDonald and Weir, 1991; Solomon et al., 1985). The lysis of red blood cells would release free Hb and other blood constituents that are then cleared from the subarachnoid space.
The Hb released from lysed red blood cells is potentially neurotoxic. Intracortical injection of Hb produces epileptic seizures (Rosen and Frumin, 1979) and free Hb has been found in damaged CNS neurons (Ohyagi and Goto, 1994). In culture, exposure of neurons to Hb can produce cell death in a dose-dependent manner (Regan and Panter, 1993). Heme, which can be readily released from Hb, promotes oxidative stress leading to lipid peroxidation (Balla et al., 1992, 1993, 1995). The ability of CNS cells to clear, compartmentalize, and metabolize free Hb may be crucial for protecting the brain after subarachnoid and intracerebral hemorrhage. Heme oxygenase could play a critical role in this process. To date, it is not clear which cells are involved in processing subarachnoid Hb, nor is it clear whether some brain regions might be more vulnerable to the effects of heme proteins in the subarachnoid space.
We chose to study HO-1 induction in response to hemoglobin in the subarachnoid space by injecting Hb into the cisterna magna of rats in a manner similar to that used for experimental subarachnoid hemorrhage (Delgado et al., 1985; Solomon et al., 1985). We have used this model to assess the regional and cellular induction of HO-1 after diffusion of hemoglobin into the extracellular spaces.
METHODS
Female Sprague-Dawley rats (180 to 200 g, Simonsen Labs, Gilroy, GA, U.S.A.) were used in this study. All surgical procedures were approved by the UCSF-VAMC Animal Care Committee in accordance with the National Institutes of Health Guide for Care and Use of Laboratory Animals. Intracisternal injections were performed under deep anesthesia after intraperitoneal administration of ketamine (80 mg/kg) and xylazine (8 mg/kg). The animals were positioned in a stereotaxic apparatus (Kopf Instruments, Tujunga, CA, U.S.A.), and a midline incision was made from the calvarium to the lower cervical region. The muscle mass was detached to reveal the atlanto-occipital membrane. A 30-g needle mounted on a 1-mL tuberculin syringe was slowly inserted through the membrane into the cisterna magna. Saline, bovine serum albumin (BSA), or Hb (150 μL) was injected into the cisterna magna for a period of 20 seconds. The needle was left in position for 10 minutes to allow the solution to diffuse away from the injection site.
Animals were injected intracisternally with either 0.9% NaCl (saline), BSA in saline (80 mg/mL), or Hb. Uninjected animals served as naive controls. Three different preparations of human, endotoxin-free oxyhemoglobin (Hb) were injected: a chromatographically purified Hb (HbA0; 59 mg/mL); a bis(2,5-dibromosalicyl)fumarate, α-α, crosslinked Hb (α-αHb; 83 mg/mL); or a stroma-free preparation of Hb (SFHb; 230 mg/mL). All Hb solutions were obtained from the U.S. Army Blood Research Detachment of the Walter Reed Institute of Research. These three different preparations of Hb provide a comparison in terms of presenting the heme protein in various forms. In its relatively pure form, HbA0, hemoglobin has been reported to produce vasospasm when arteries are exposed to it (MacDonald and Weir, 1991). The use of modified hemoglobins (α-αHb) able to carry greater amounts of oxygen is of considerable interest to the clinical community. Finally, the presence of other components of lysed red blood cells and serum (SFHb) have been reported to be vasoactive (MacDonald and Weir, 1991).
After injection, HbA0-treated animals were allowed to recover for varying periods of time (4 and 12 hours, 1,2,4, and 8 days), before perfusion and immunohistochemistry. Saline-treated animals were allowed to recover for 4 and 24 hours before perfusion and immunohistochemistry. Animals in the α-αHb, the SFHb, and the BSA-treated groups were allowed to recover for 24 hours before perfusion and immunohistochemistry. A minimum of 3 animals per treatment group were used in this study with the exception that 10 rats were used for the 24-hour HbA0 group.
After the appropriate survival time, animals were anesthetized as above and perfused through the ascending aorta with 0.9% saline, followed by 400 mL of 4% paraformaldehyde (PFA) in phosphate buffer (PB; 0.1 mol/L sodium phosphate, pH 7.4). Brains were removed, postfixed for 24 hours in phosphate-buffered 4% PFA, and cut into 50μm sections on a vibratome. Sections were incubated for 24 hours at 4°C with a rabbit polyclonal antibody to rat HO-1 (StressGen, Victoria, British Columbia, Canada) diluted 1:10,000 in a solution of 2% goat serum, 0.1% BSA, and 0.1% Triton X-100 in PB. This rabbit polyclonal antibody to HO-1 has been shown to produce a single band on Western blots of heat-shocked brain (Ewing and Maines, 1991). The 1:10,000 dilution used in this study produced optimal, specific labeling of cells with minimal background staining. After three 10-minute PB washes, the sections were incubated for 2 to 5 hours with a biotinylated goat, anti-rabbit secondary antibody (Vector Labs, Burlingame CA, U.S.A.), at a dilution of 1:200 in a solution of 2% goat serum, 1% BSA, and 0.1% Triton X-100 in PB. After three 10-minute PB washes, sections were incubated with ABC reagent (Vectastain ABC Elite, Vector Labs) for 2 hours. After three 10-minute washes in PB, sections were incubated with a solution of 0.6 mg/mL diaminobenzidine (DAB) and 0.05% H2O2 for 2 minutes. This incubation was terminated by three 10-minute PB washes. Sections were mounted onto gelatin-coated slides and dried overnight before placing a coverslip on them. Representative sections from each animal were then photographed.
To identify the cell types stained by the HO-1 polyclonal antibody, some sections were coincubated with anti-HO-1 (1:4000 in 1% BSA and 0.3% Triton X-100 in PB) and either monoclonal, mouse anti-rat OX42 antibody (Serotec, Oxford, U.K.; 1:4000) or with monoclonal mouse antirat glial fibrillary acid protein (GFAP) antibody (ICN, Costa Mesa, CA, U.S.A., 1:4000). After 24 hours' incubation at 4°C, sections were washed three times for 10 minutes each in PB and incubated for 2 hours with a rhodamine-conjugated, goat, anti-rabbit IgG antibody (Boehringer Mannheim, Indianapolis, IN, U.S.A.; 1:100) together with biotinylated sheep anti-mouse IgG antibody (Amersham Life Sciences, Arlington Heights, IL, U.S.A.; 1:200). After three 10-minute PB washes, sections were incubated with avidin-conjugated fluorescein isothiocyanate (FITC; Vector Labs; 1:200) for 2 hours. Sections were mounted onto slides and covered with a 75% glycerol and 25% PB solution containing 0.1% paraphenylenediamine. Select regions were photographed using a rhodamine filter followed by a FITC filter.
To assess the parenchymal distribution of Hb after injection into the cisterna magna, biotinylated HbA0 was substituted for HbA0. Briefly, biotin (5.9 mg/mL; long arm, N-hydroxysulfosuccinimide, water soluble; Vector Labs) was incubated with HbA0 (59 mg/mL) for 2 hours at room temperature in 100 mmol/L N-[2 hydroxyethyl] piperazine-N′-[2 ethane sulfonic acid], pH 8.5. The reaction was terminated with 10 mg/mL glycine and unbound biotin was removed from biotinylated HbA0 by overnight dialysis at 4°C. Biotinylated HbA0 was injected into the cisterna magna as described above. Non—biotinylated HbA0-injected animals were used as controls. Animals were anesthetized 1, 2, and 4 hours after injection and perfused with saline and 4% PFA; visualization of biotinylated HbA0 was performed on 50μm sections, using ABC followed by DAB and H2O2 reagents as described for immunohistochemistry above. In addition, direct assessment of gross Hb distribution was carried out by visually examining whole brains from HbA0-treated animals 1, 2, and 4 hours after injection. Autologous blood was cleared by perfusing with saline before inspection. Visualization of the red color of HbA0 was enhanced by using a higher concentration of HbA0 than was used to assess HO-1 induction (280 mg/mL versus 59 mg/mL, respectively).
Western blot analysis was performed to quantify the HO-1 induction and to confirm the specificity of the anti-HO-1 antibody. Animals were injected as described above with saline, BSA, or HbA0. After 24 hours, animals were anesthetized and decapitated, and the frontal cortex, hippocampus, and cerebellum were removed. The tissue was placed in Laemmli solubilizing buffer (2.5% sodium dodecyl sulfate, 10% glycerol, 62.5 mmol/L Tris-HCl, pH 6.8, and 5% 2-mercaptoethanol) and boiled until homogeneity (~10 minutes), and then frozen at −70°C. Immunoblotting was performed as described previously (Bergeron et al., 1996) with modifications. Briefly, protein concentrations were determined using the bicinchoninic acid method (Pierce, Rockford, IL, U.S.A.) as follows: 55 mg of protein was separated on 12% polyacrylamide gels with a 4.5% stacking gel (SDS-PAGE) and electrotransferred onto nitrocellulose membrane (0.2 mm; Schleicher and Schuell, Keene, NH, U.S.A.). The membranes were blocked at 4°C overnight in PB containing 5% nonfat dry milk, 1% BSA, and 0.1% Tween-20. After a PBS wash, membranes were probed for 2 hours with a 1:2000 dilution of the same polyclonal rabbit anti-rat HO-1 antibody used for immunocytochemistry (StressGen). The membranes were then washed three times with PBS containing 1% BSA, 0.1% Tween-20, and 1:2000 dilution of anti-rabbit Ig-horseradish peroxidase (HRP) for 2 hours. Bound Ig-HRP antibody was visualized with the ECL-chemiluminescence system (Amersham). Densitometric analysis of HO-1 protein immunoreactive bands was carried out using a computer-based imaging system (MCID, Imaging Research, St. Catherines, Ontario, Canada).
RESULTS
Distribution of HbA0 and biotinylated HbA0
Gross examination of brains revealed that HbA0 had extensively covered all superficial surfaces of the brain within 1 hour after cisterna magna injections (Fig. 1A.2). The concentration of HbA0 was greatest in basal regions of the forebrain, from the olfactory bulbs to the occipital cortex (Fig. 1B.2). Accumulation of HbA0 also occurred around the sagittal sinus, optic chiasm, hypothalamus, surface of the cerebellum, and to a lesser extent on the sides and dorsal surface of the cortex (Fig. 1). The red color of the HbA0 dissipated in all regions between 2 and 4 hours after the injections (Fig. 1, A.2 and A.3), though some accumulation was still apparent in most brain regions at 4 hours (Fig. 1A.4). The ventricles of these animals were densely packed with the bright red HbA0, especially in the 1 hour-group (data not shown).
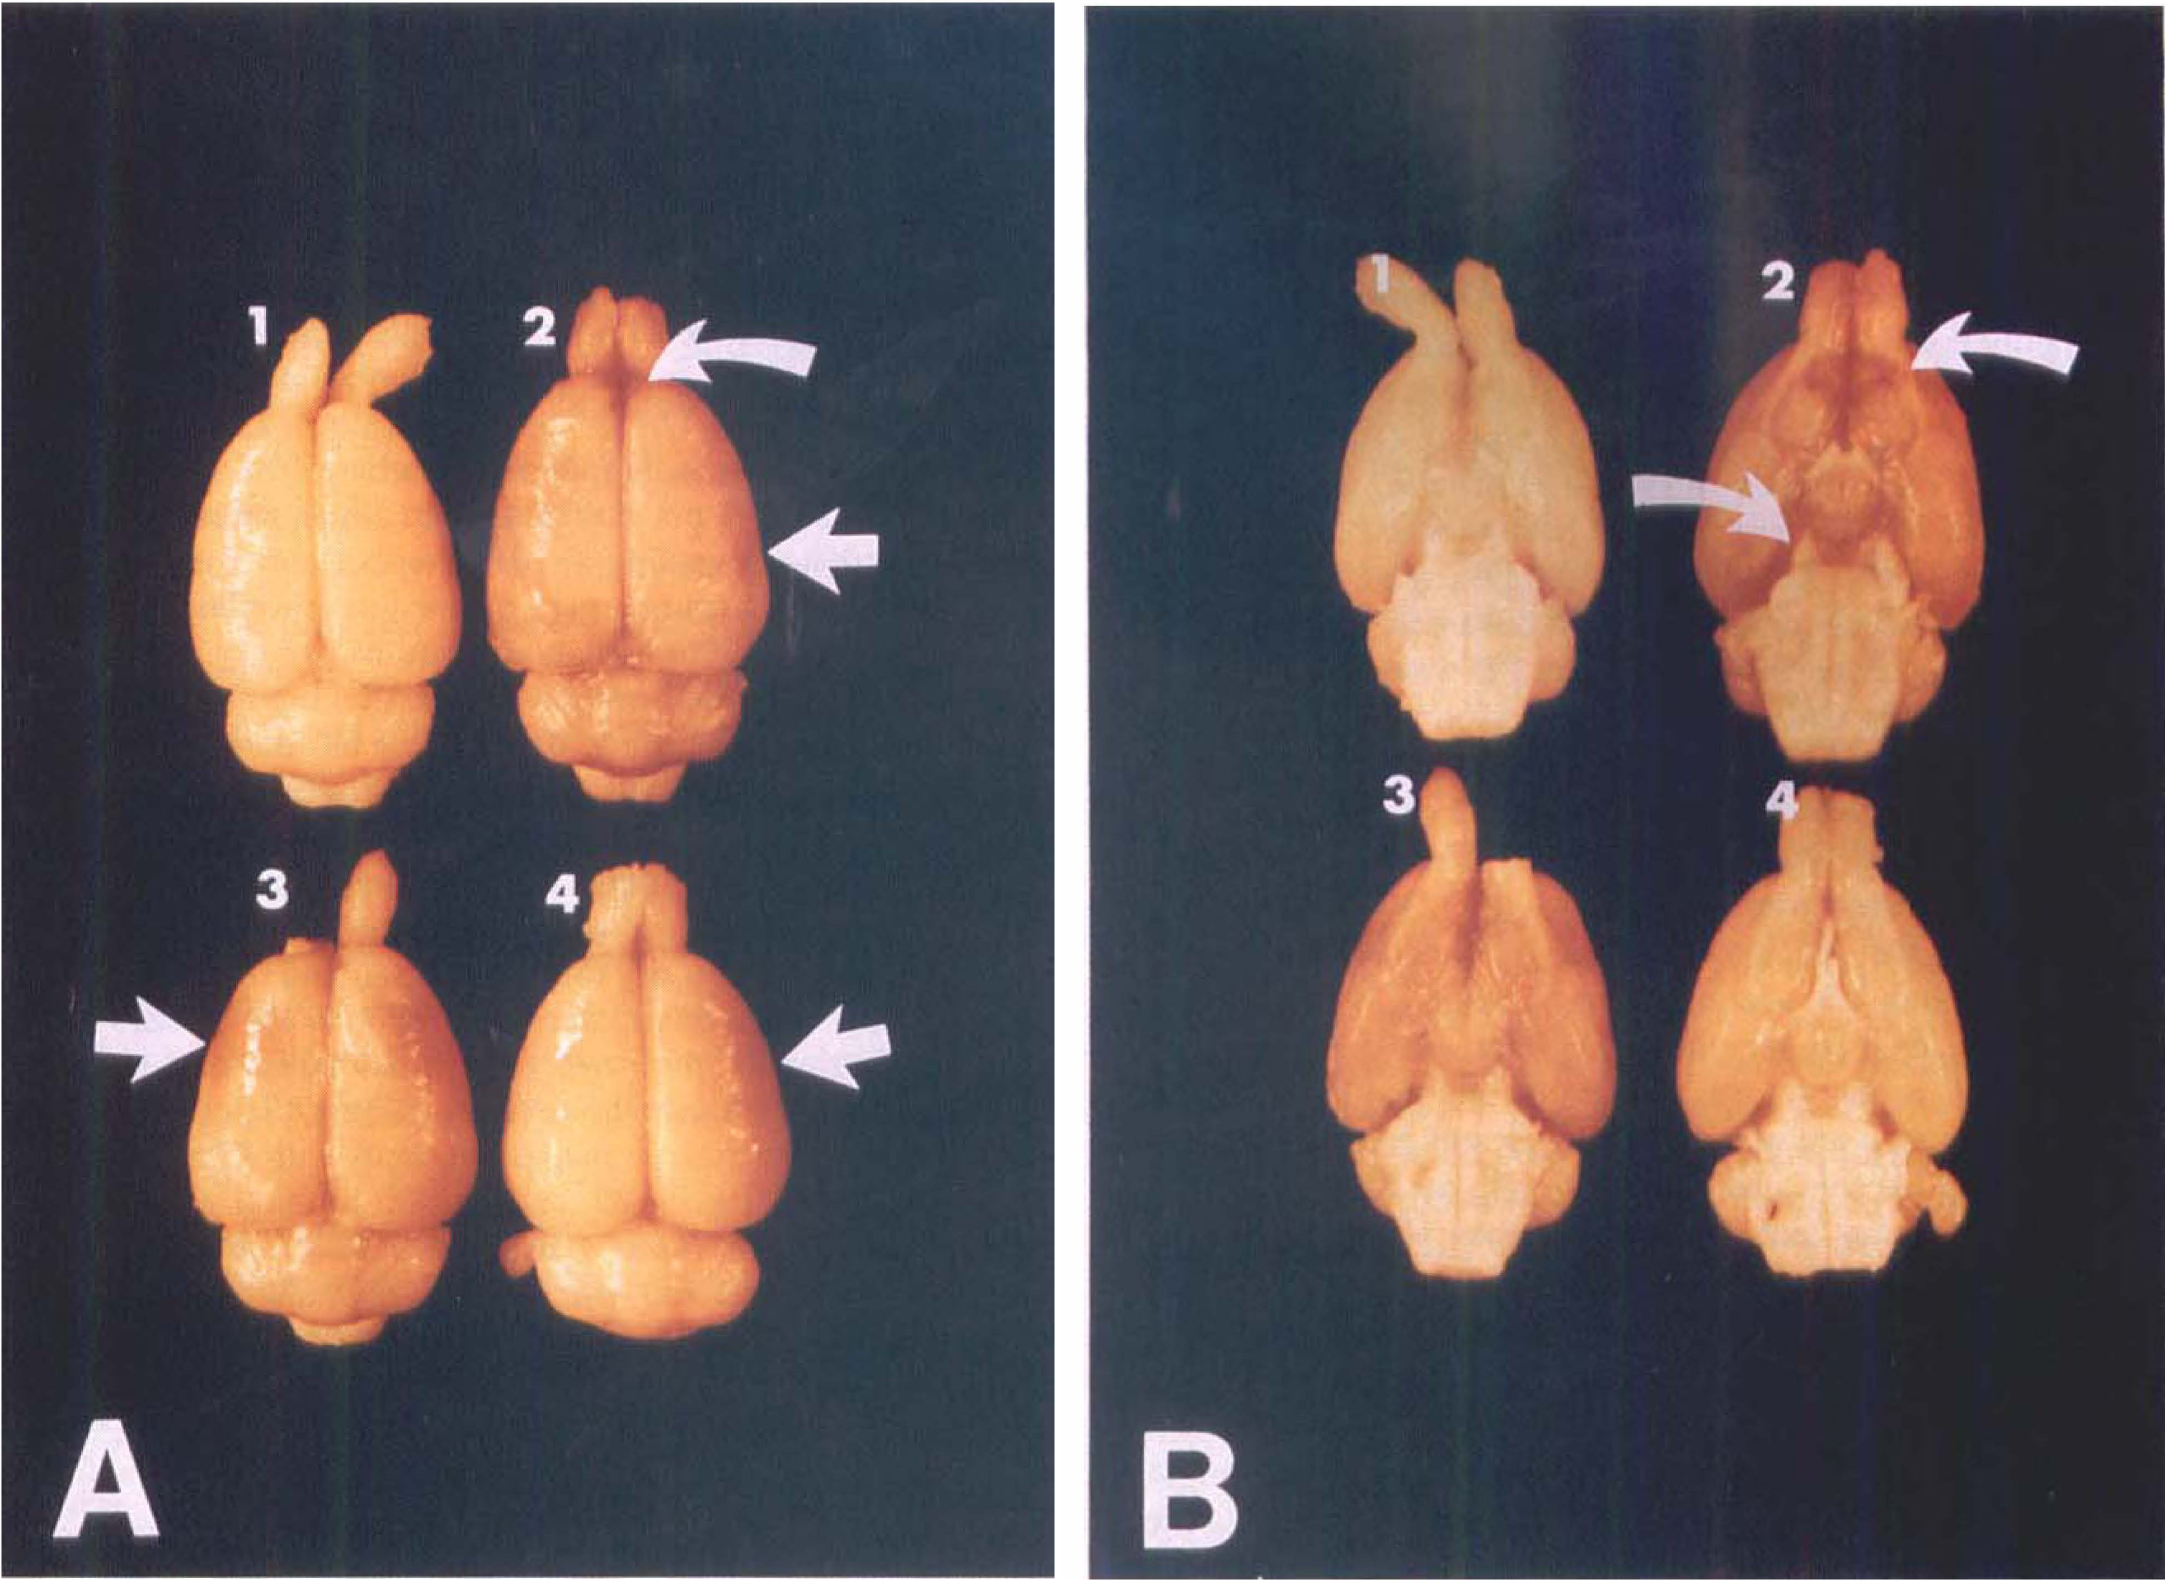
Gross distribution of hemoglobin in brains at various times after intracisternal injection of HbA0. (
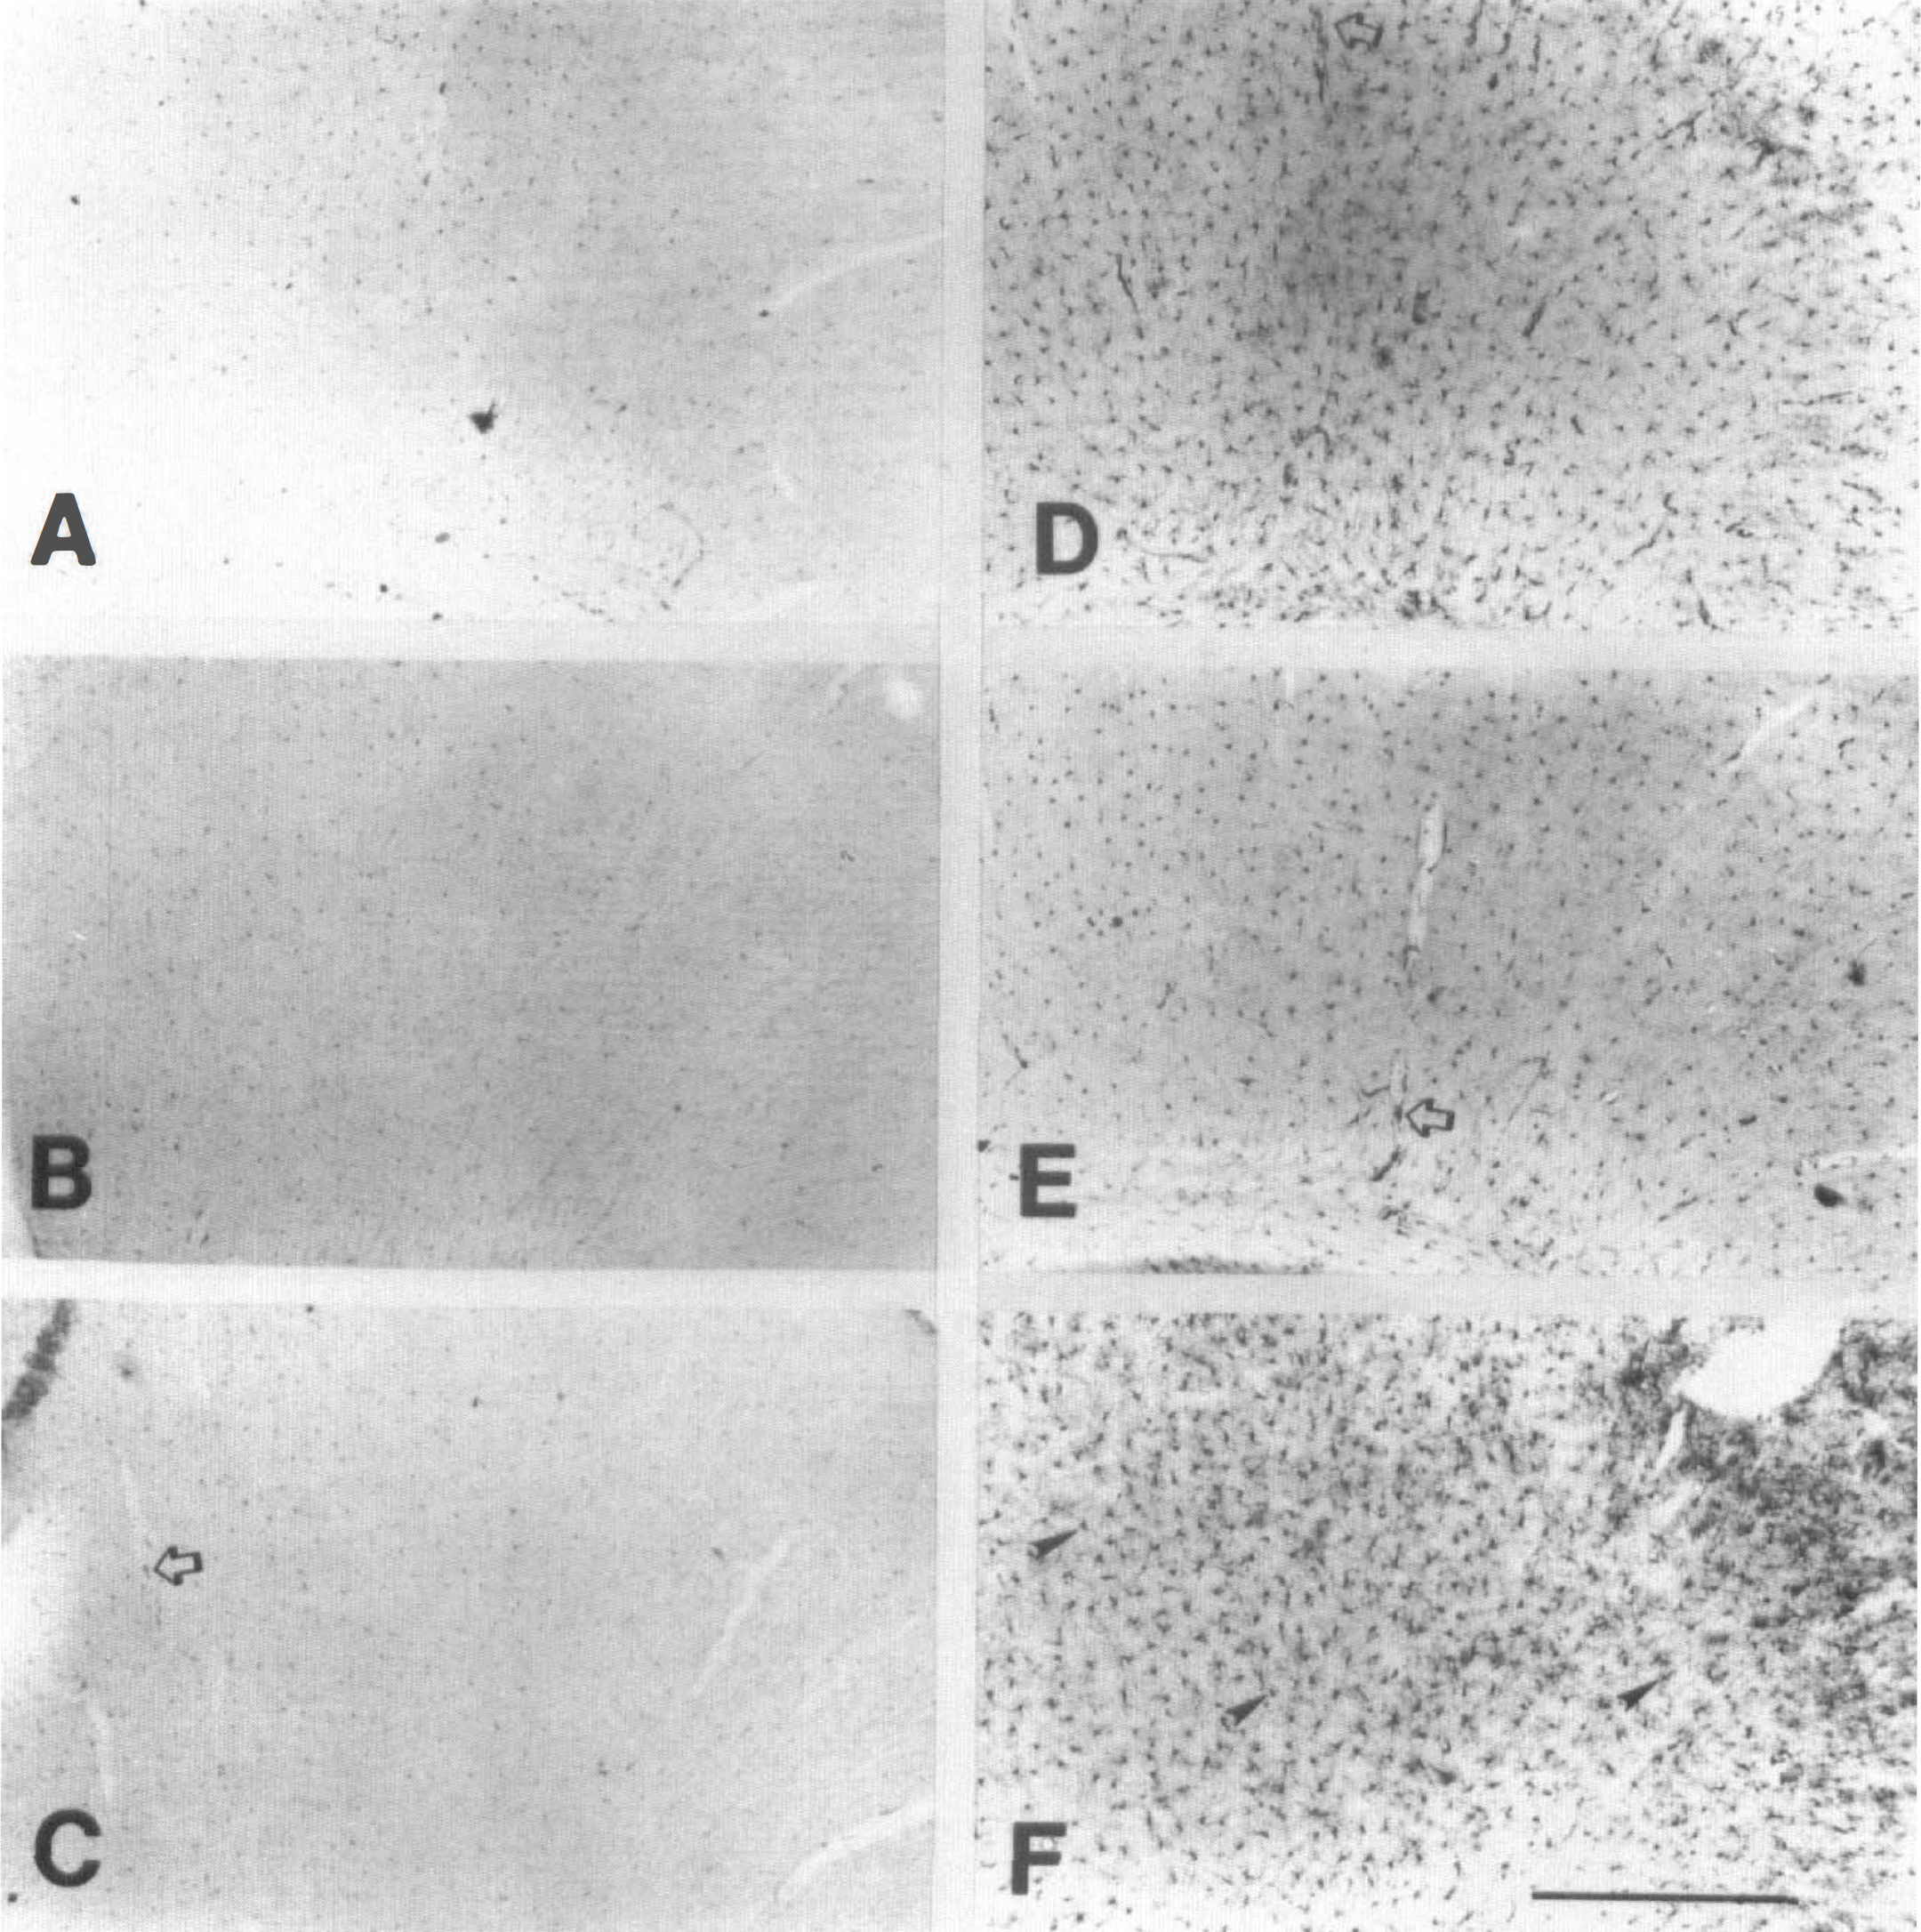
To confirm that HbA0 was indeed penetrating into the brain parenchyma, biotin was attached to this molecule, and sections were assayed for the presence of biotinylated HbA0 using a standard avidin-biotin-peroxidase and DAB reaction. Intracisternally injected biotinylated HbA0 was found in the superficial cortex, hippocampus, periventricular areas, and parasagittal cortex, 1 hour after injection (Fig. 2B). At 2 hours after injection, biotinylated HbA0 had penetrated into the deeper layers of the cortex and labeling was more prominent in the hippocampus as well as the base of the brain and the dorsal thalamus (Fig. 2D). By 4 hours, staining for biotinylated HbA0 was similar to that observed at 2 hours but was less robust (Fig. 2F). Sections from the non—biotinylated HbA0 control animals displayed little DAB-HRP reaction (Fig. 2A, 2C, and 2E), demonstrating that the hemoglobin injections did not induce peroxidase staining in a nonspecific fashion.
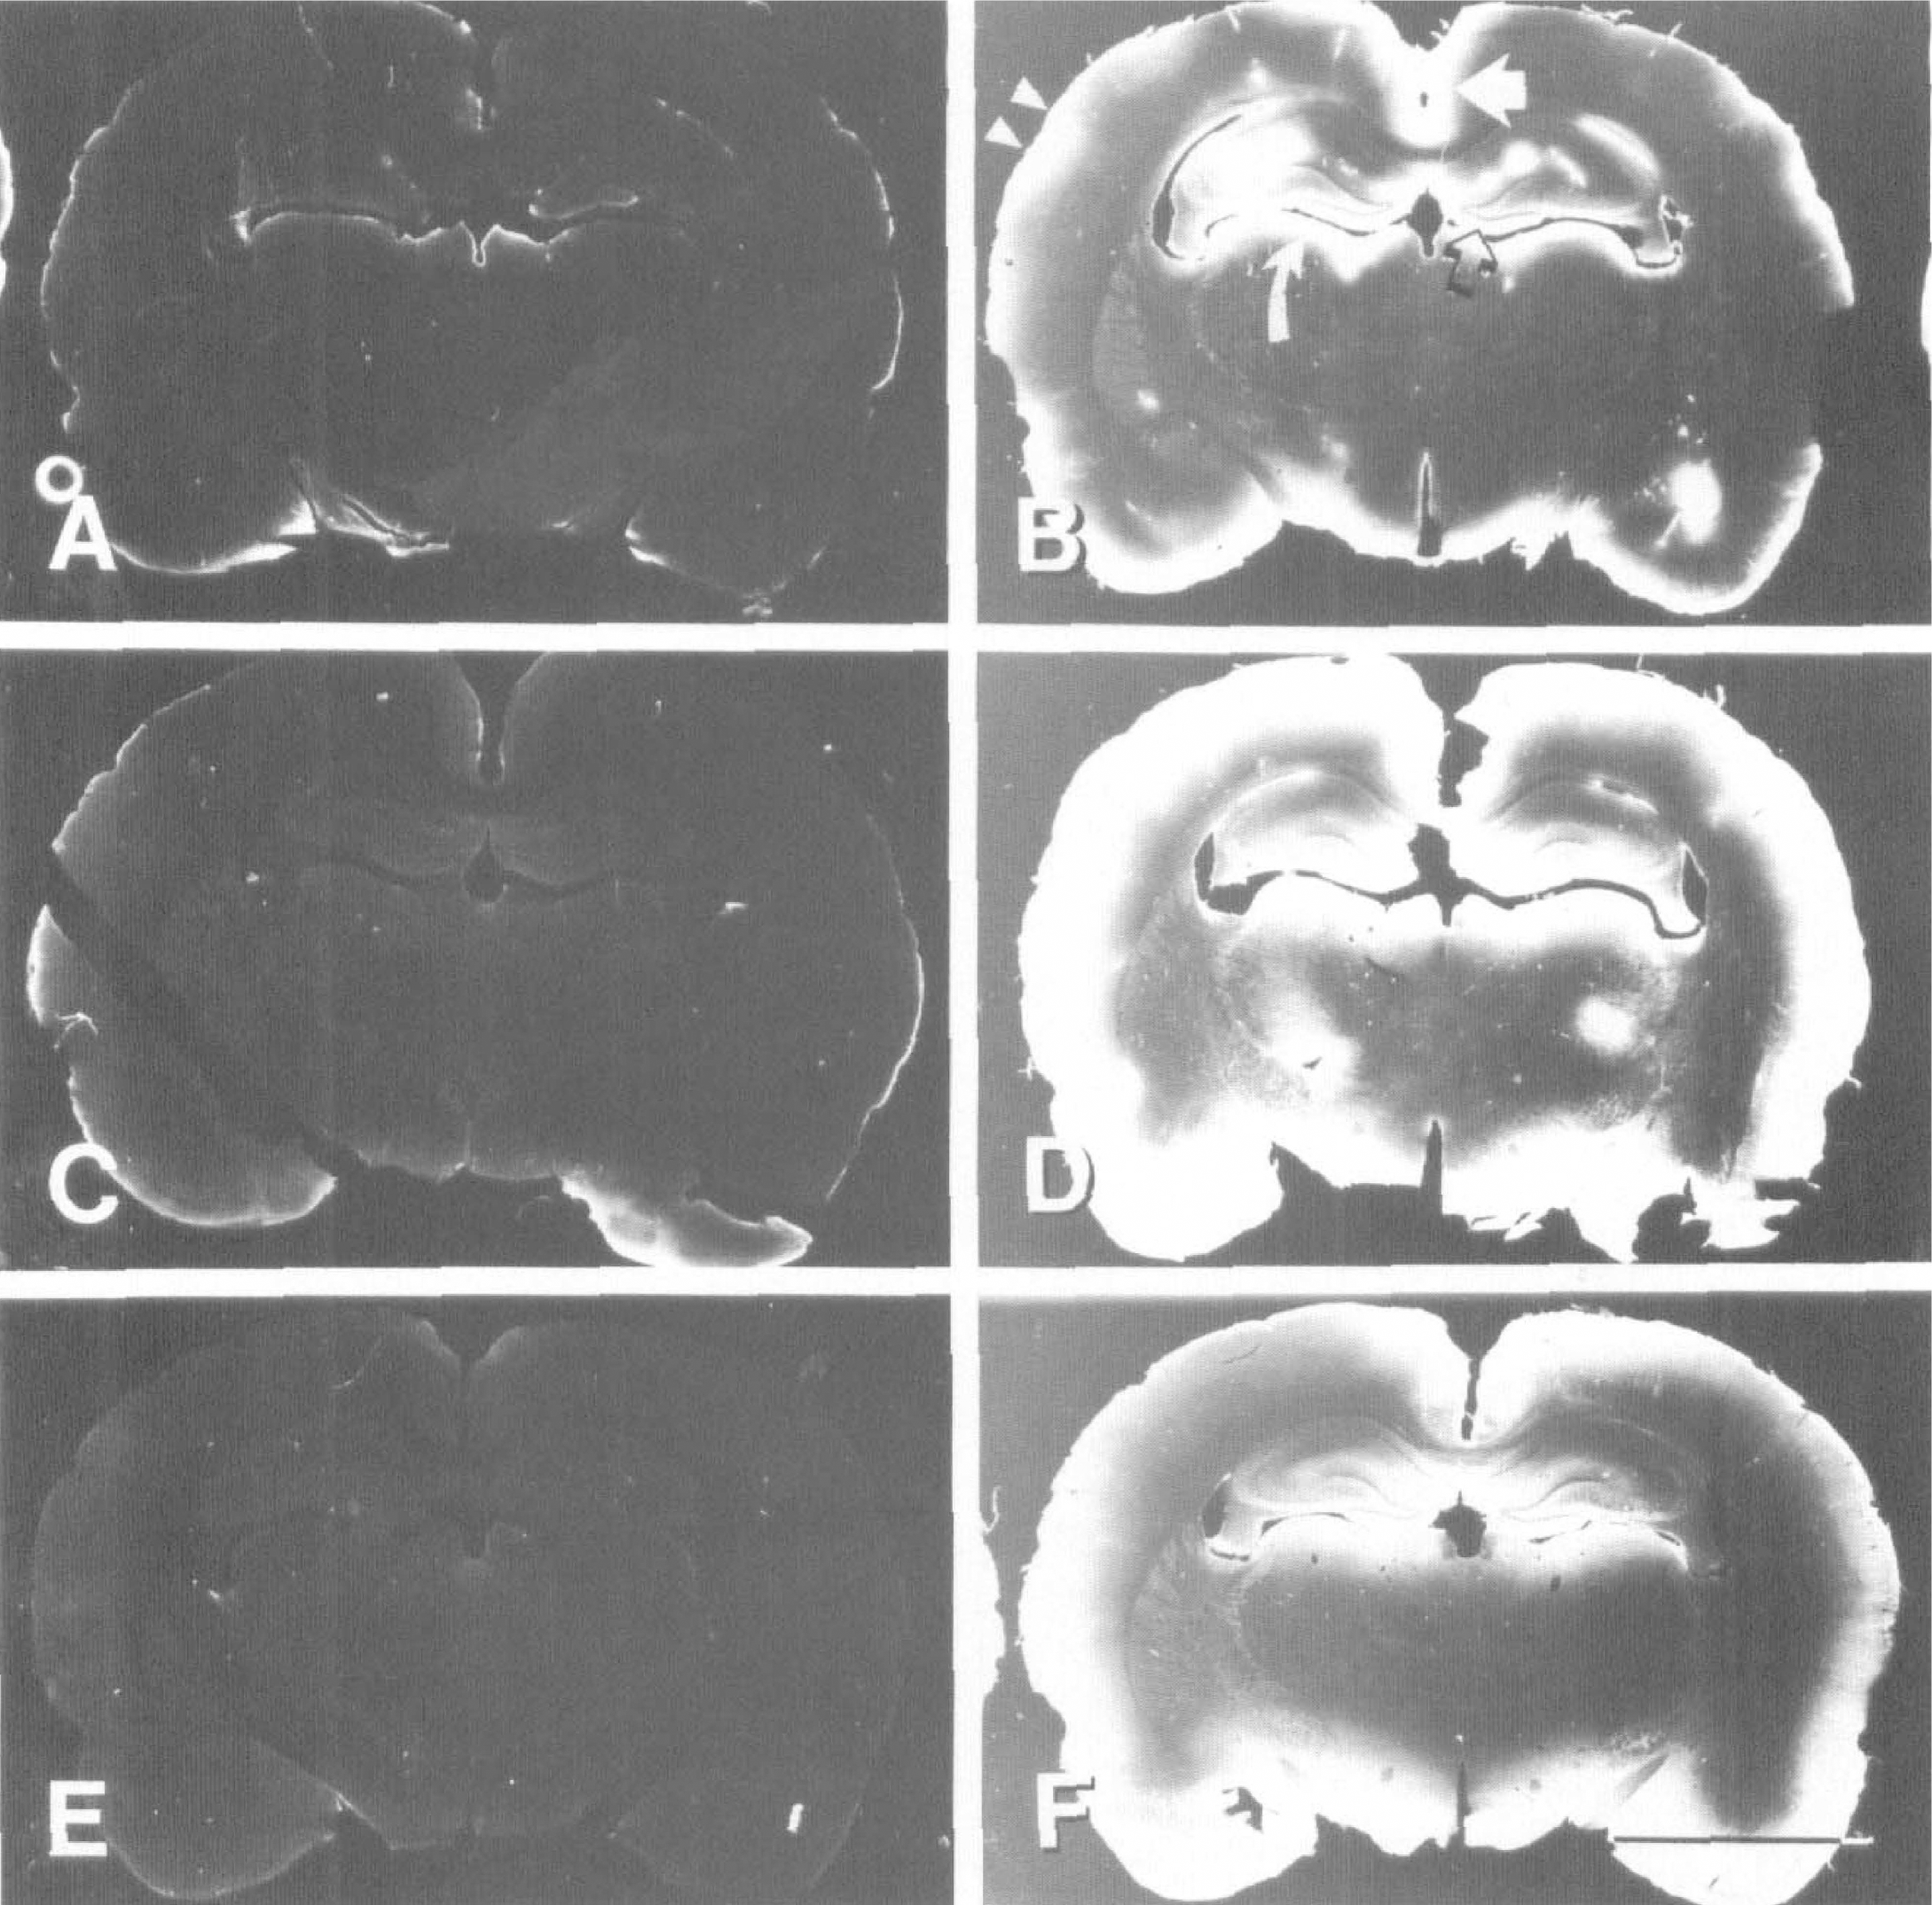
Dark-field photomicrographs showing the distribution of HRP-labeled, biotinylated HbA0 (
Heme oxygenase-1 immunoreactivity in Hb-treated animals
Heme oxygenase-1 immunoreactivity (HO-1-ir) was markedly induced throughout all brain regions after intracisternal injections of hemoglobin compared with saline- and BSA-injected controls (Table 1). Immunoblot analysis of crude brain extracts from rats 24 hours after HbA0 injections revealed an intense 32-kDa band consistent with the HO-1 protein (Fig. 3). In cerebellum, hippocampus, and frontal cortex from HbA0-treated animals, HO-1 protein expression was increased 4.5-, 3.2-, and 5.1-fold (Fig. 3, lanes 7, 8, and 9), respectively, compared with saline-treated animals (Fig. 3, lanes 4, 5, and 6). Untreated controls had little detectable HO-1 protein in the three brain regions investigated (Fig. 3, lanes 1, 2, and 3).
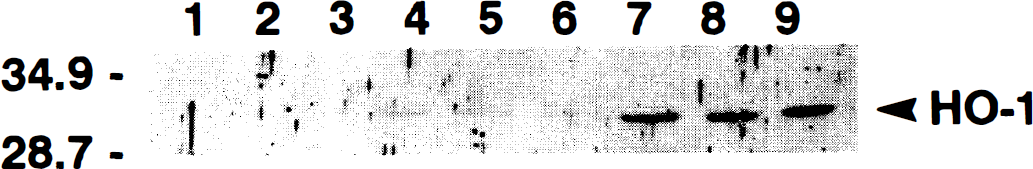
Western immunoblot analysis of brain HO-1 protein levels in control, uninjected animals (lanes 1–3), and in animals after intracisternal administration of saline (lanes 4–6) or HbA0 (lanes 7–9). Lanes 1, 4, and 7 were from crude tissue extracts of cerebellum; lanes 2, 5, and 8 were from hippocampus; and lanes 3, 6, and 9 were obtained from frontal cortex. Equal amounts (55 mg) of protein were analyzed by SDS-PAGE and immunoblotting was performed using a rabbit anti-rat HO-1 antibody. Molecular weight markers in kilodaltons are indicated on the left.
Changes in HO-1-ir in the CNS after injection of HbA 0
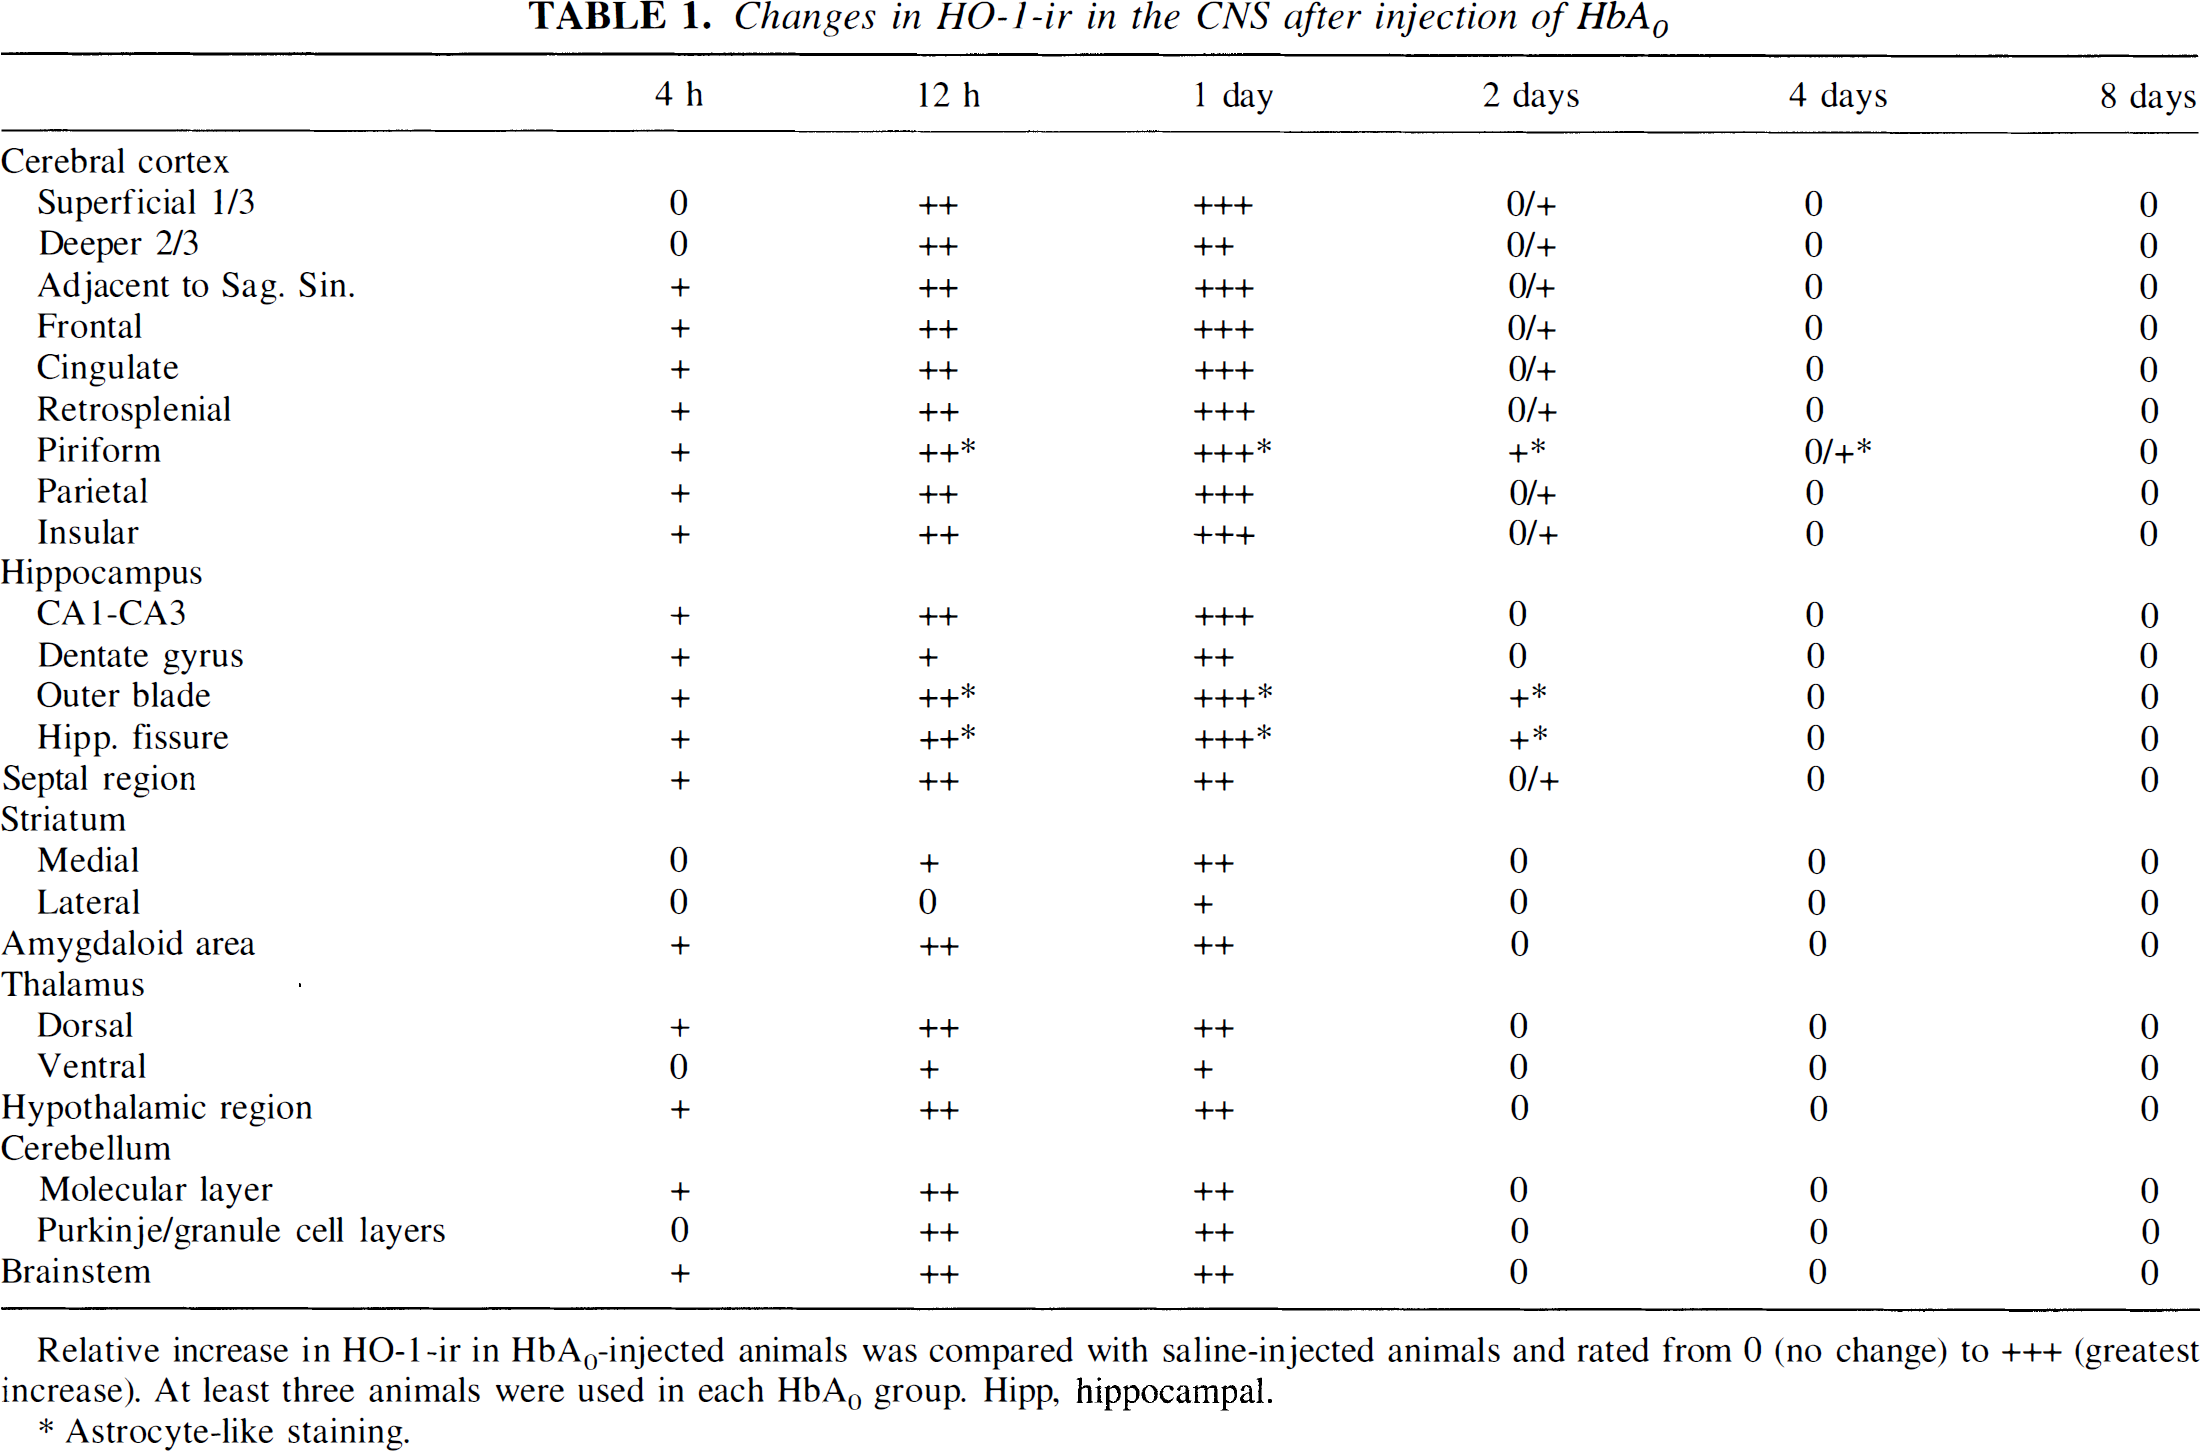
Relative increase in HO-1-ir in HbA0-injected animals was compared with saline-injected animals and rated from 0 (no change) to +++ (greatest increase). At least three animals were used in each HbA0 group. Hipp, hippocampal.
Astrocyte-like staining.
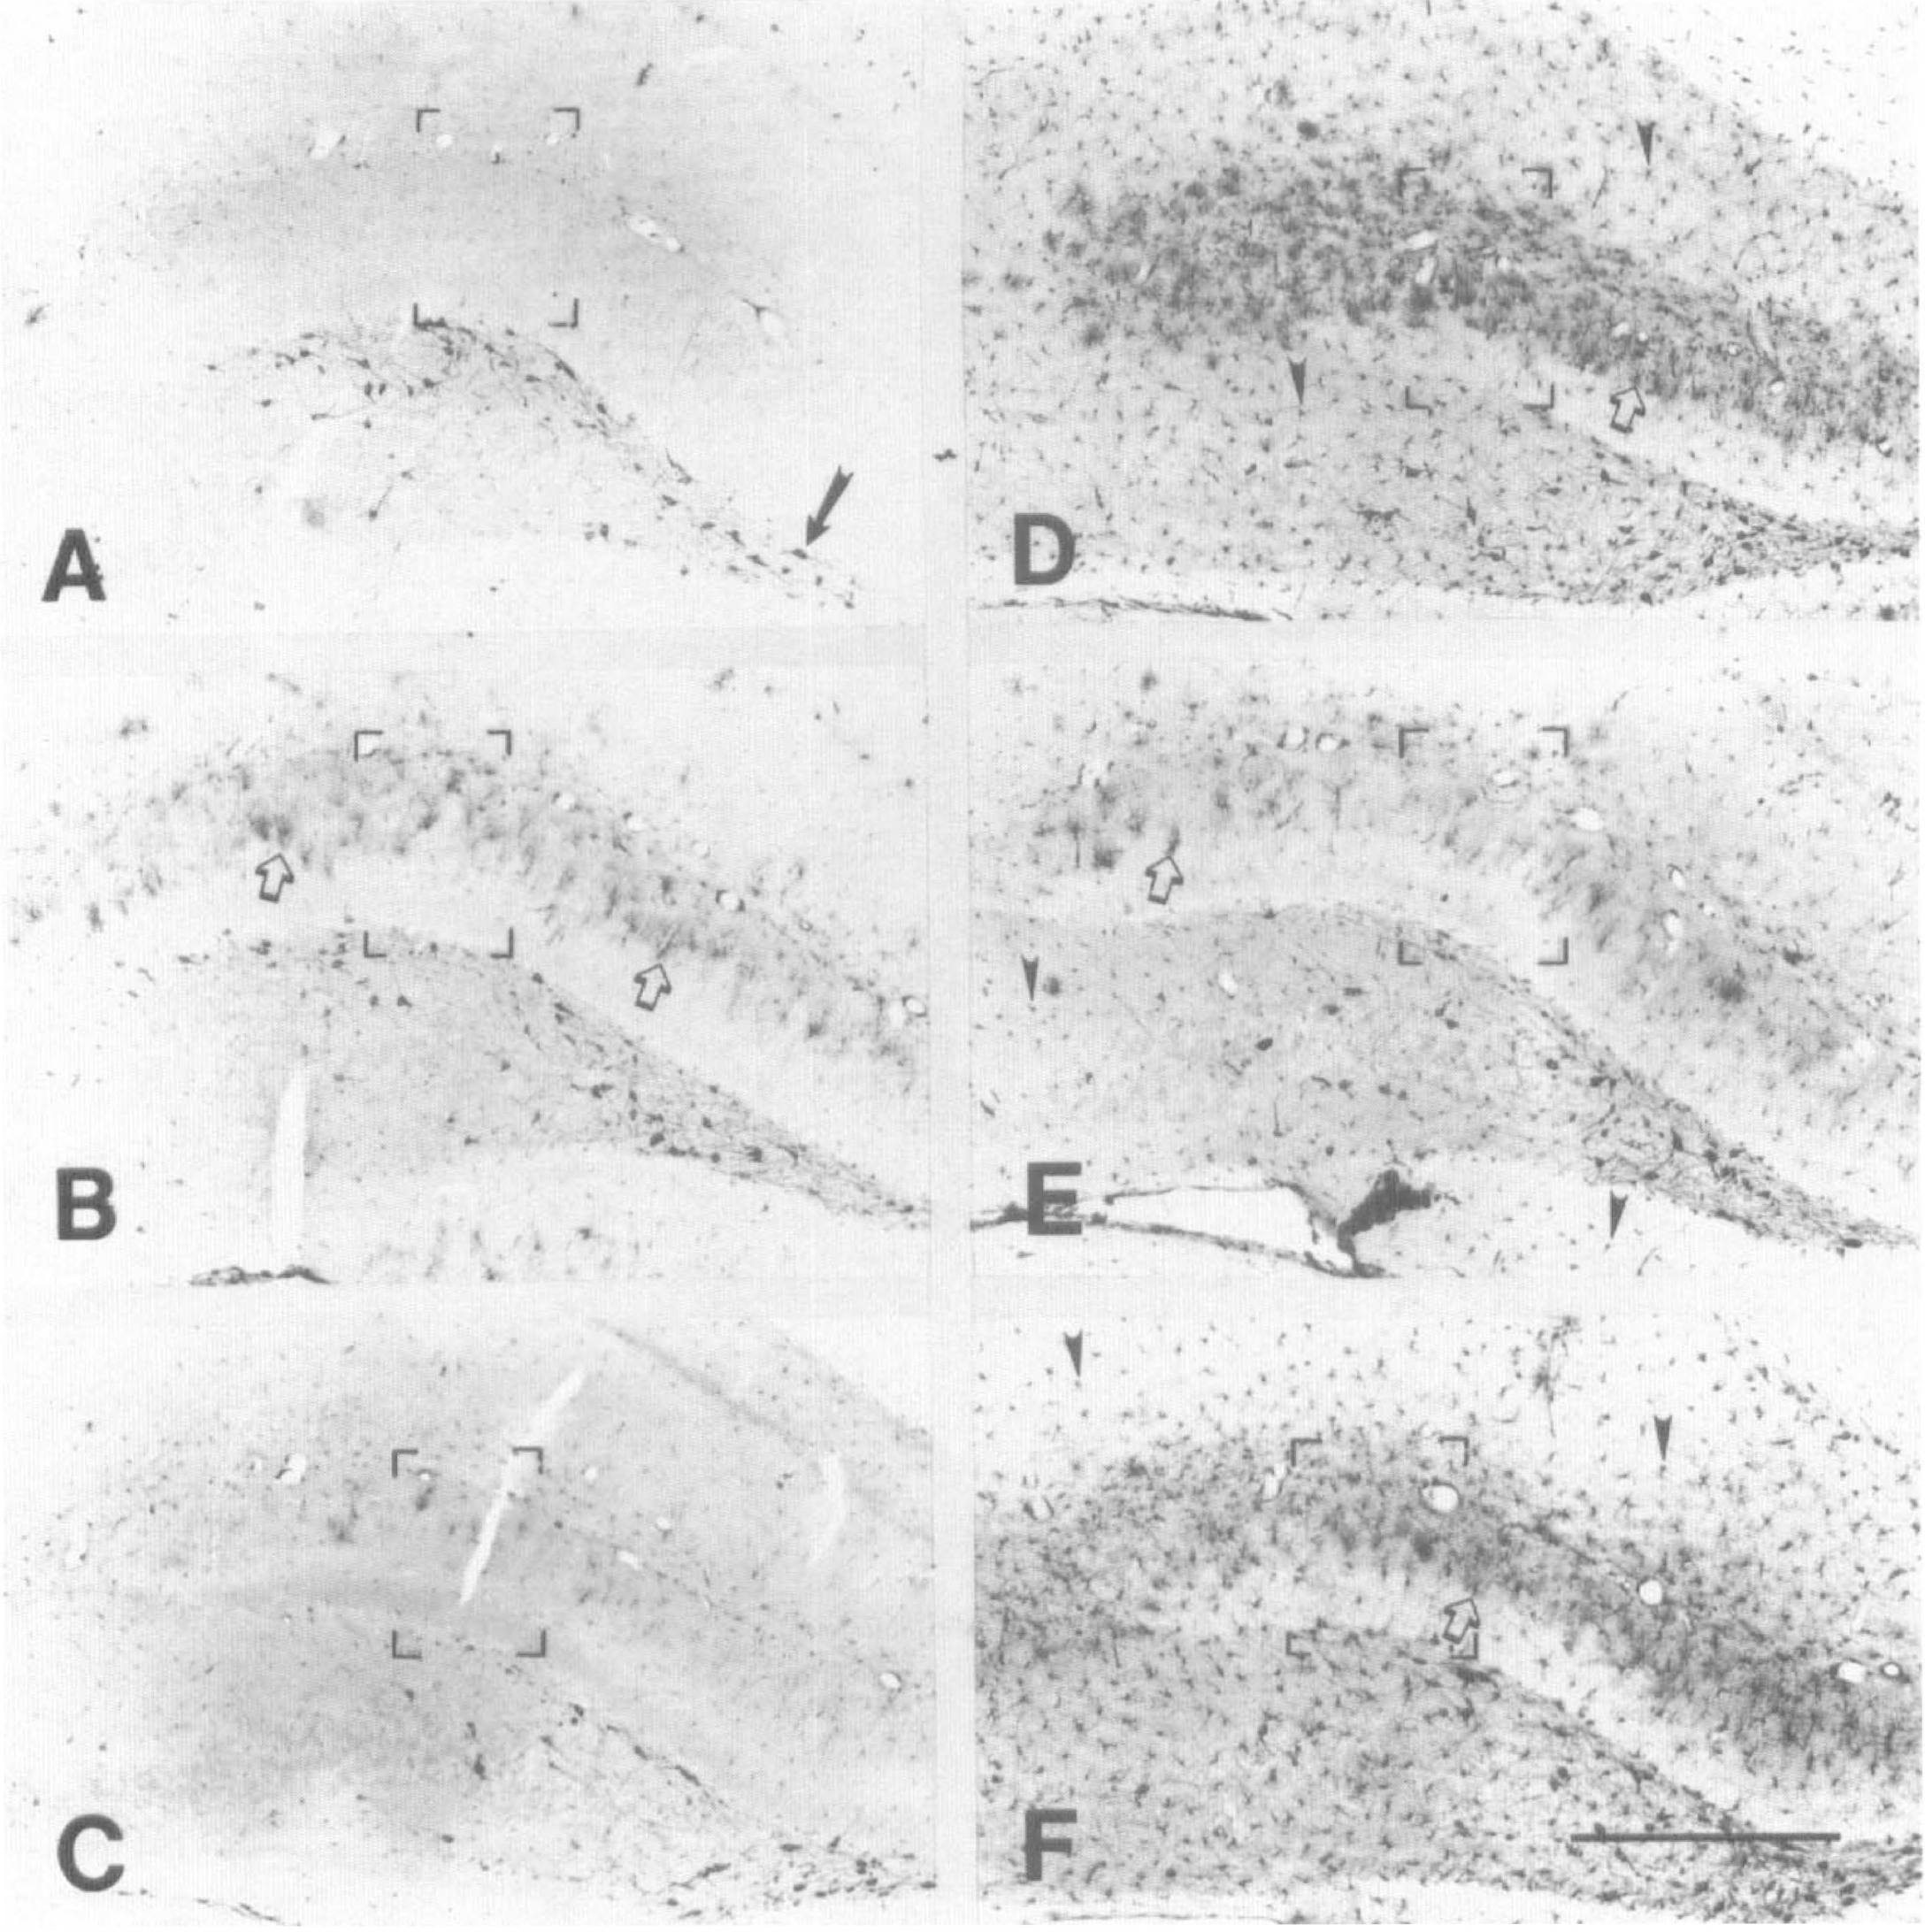
We compared injections of HbA0 with SFHb and observed a similar profile of elevated HO-1-ir in many regions (Fig. 4E and 4F). The most prominent HO-1-ir was observed in the hippocampus (Fig. 4E and 4F), cortical regions adjacent to the sagittal sinus (Fig. 4F), and the superficial cortical layers (Figs. 4E and 4F). The distribution of the most prominent staining for HO-1-ir was strikingly similar to the most heavily labeled areas with biotinylated HbA0 (compare Fig. 4F with Fig. 2F). The HO-1-ir was mainly localized to cells with small, rounded cell bodies with short, well-defined processes, a morphology that was most consistent with microglia (Fig. 5).
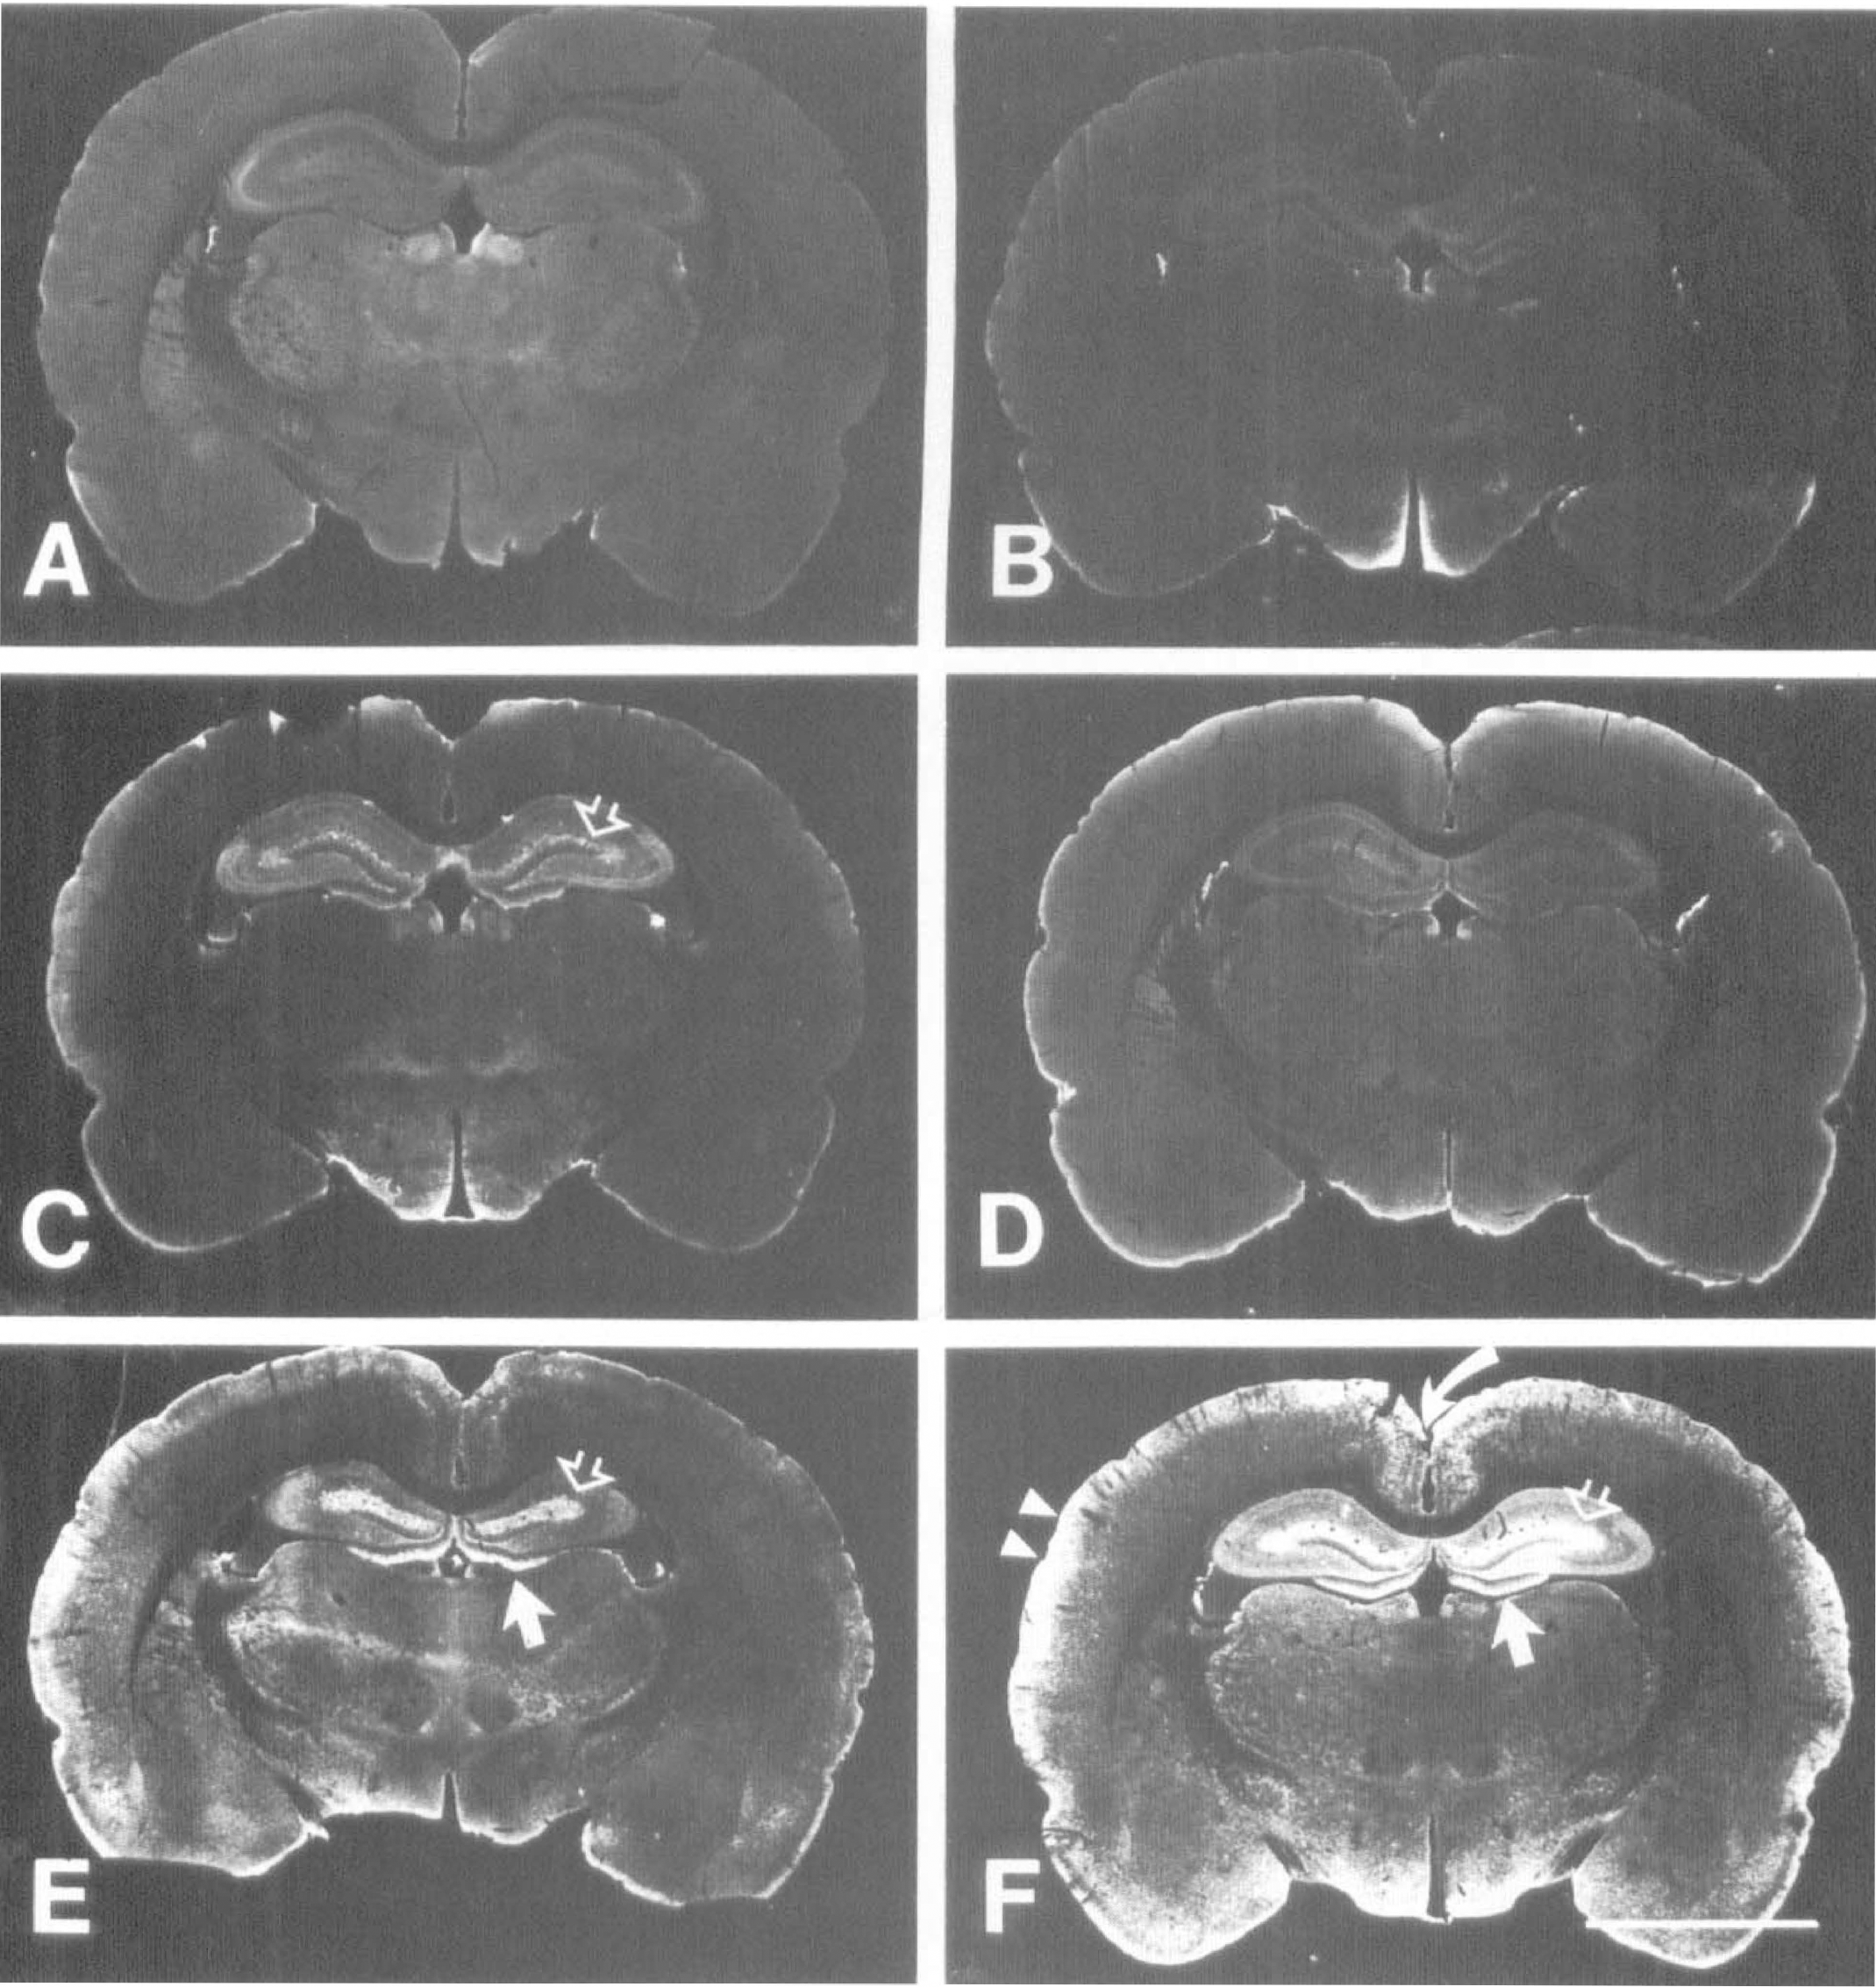
Dark-field photomicrographs showing the distribution of HO-1 protein 24 hours after cisterna magna injections with various solutions. (
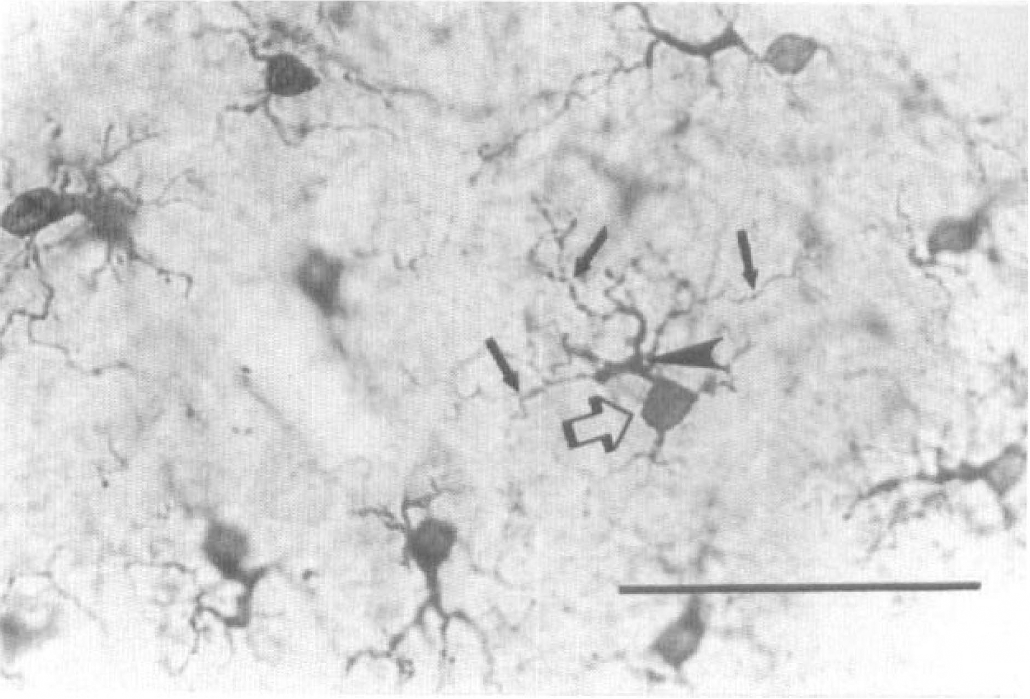
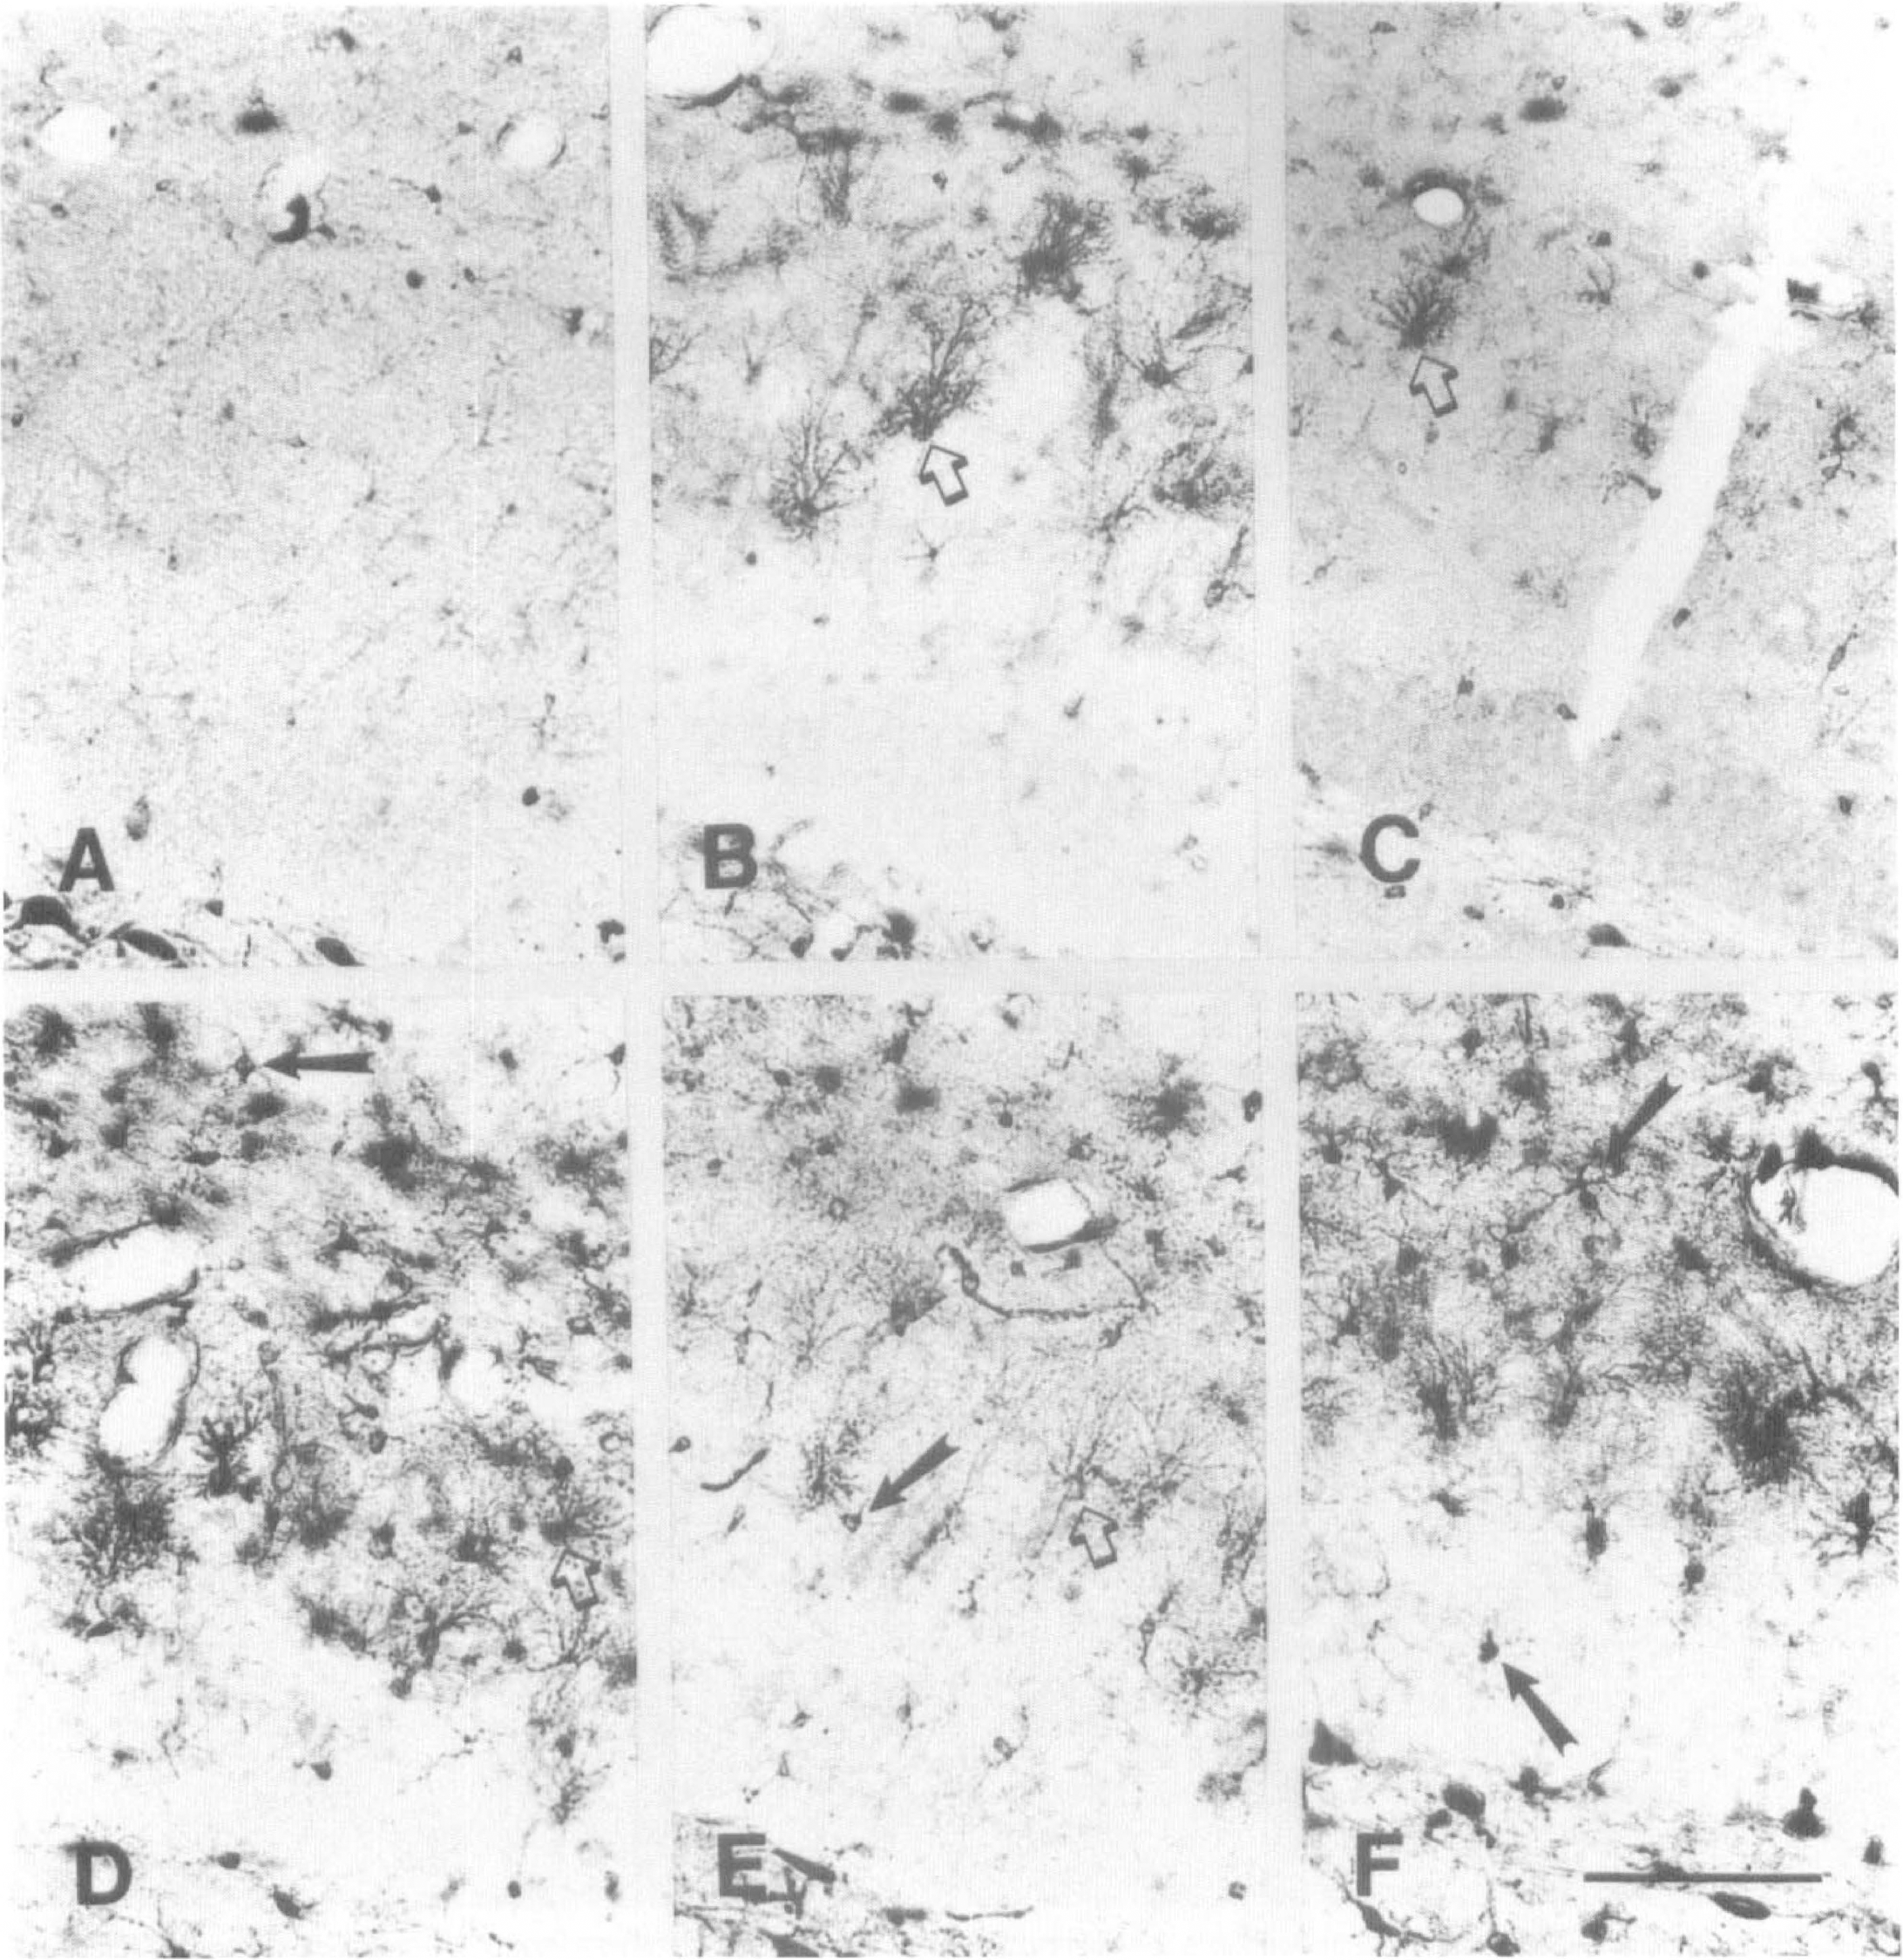
HO-1 immunostained cells in the retrosplenial cortex of an animal 24 hours after HbA0 injection into the cisterna magna. The morphology of all HO-1-stained microglia in the brain after injections of HbA0, α-αHb, and SF-Hb was identical to these cells, which showed dense cell body staining (large, open arrow) and 2 to 4 processes ending in numerous thinner branches (small, closed arrow). The morphology of these cells is consistent with that of microglia. Scale bar is 100 μm.
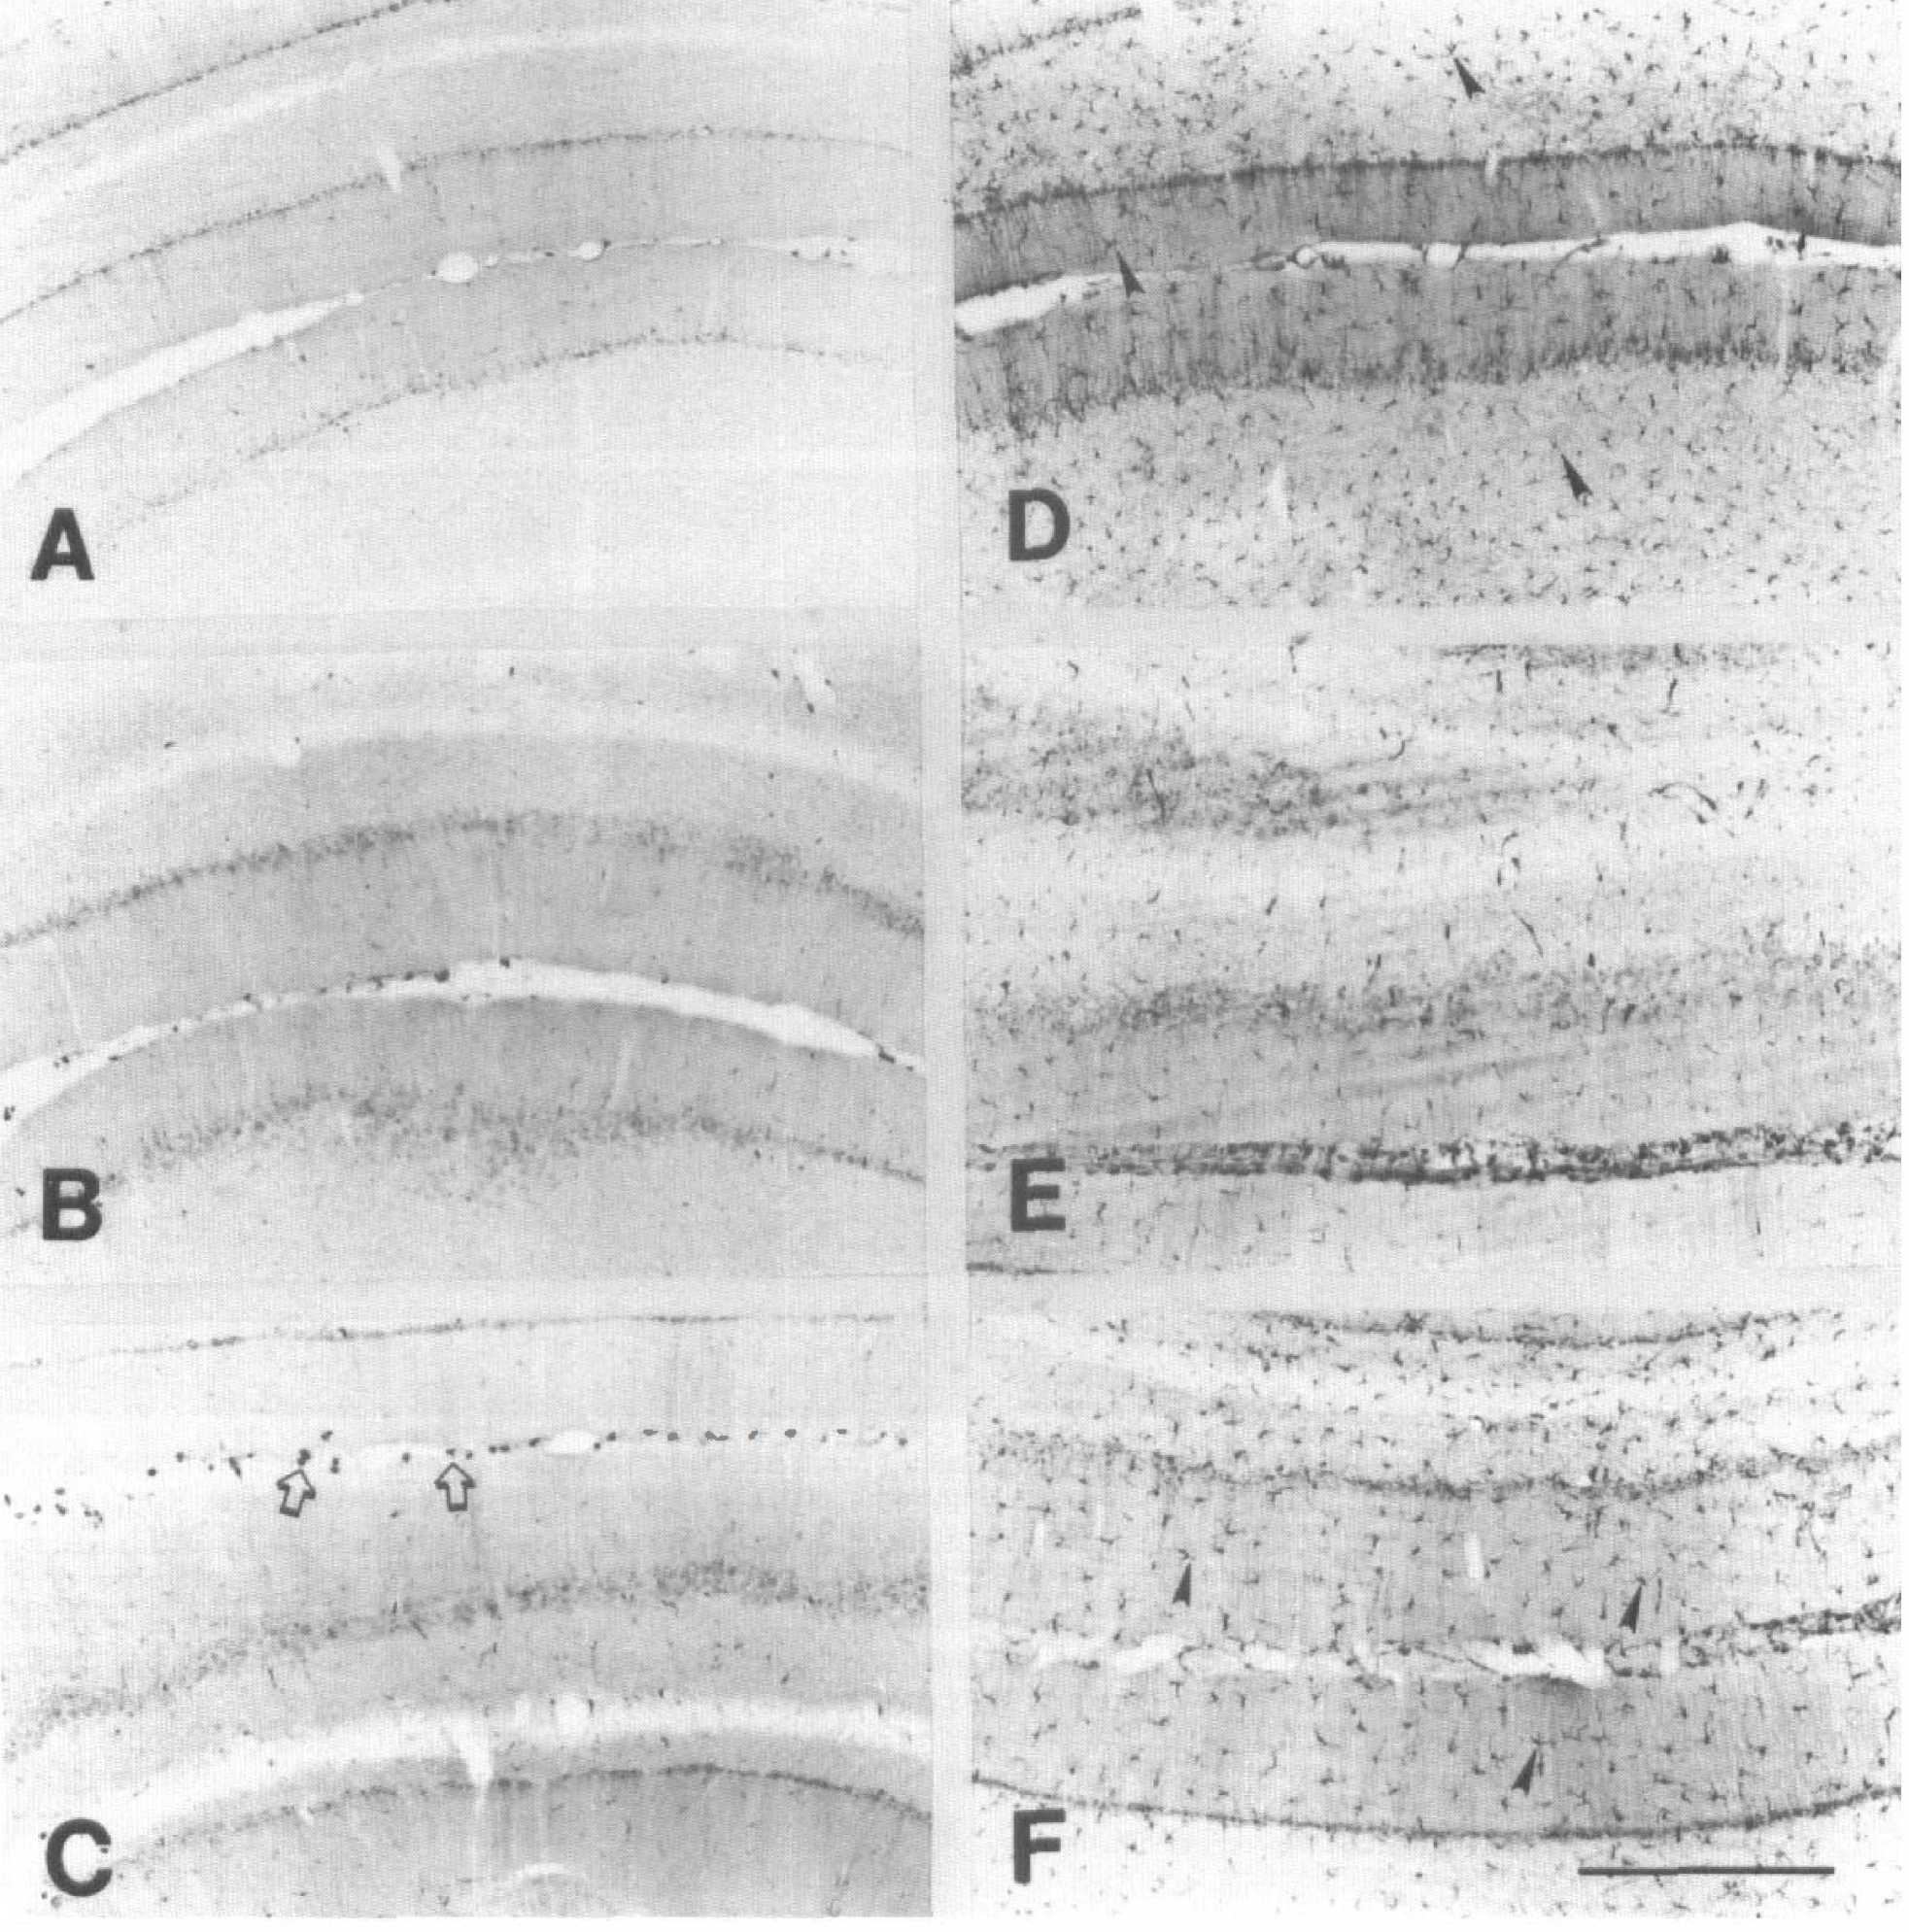
After injections of HbA0, induction of HO-1-ir in the hippocampus (Fig. 6) was evident as early as 4 hours, increasing at 12 hours with an apparent peak at 24 hours after injection. A marked decline of HO-1-ir was observed 2 days after injection, and by 8 days HO-1-ir had returned to basal levels. In the remainder of the forebrain, HbA0-treated animals displayed a paucity of staining in cortical and subcortical regions 4 hours after injection (Table 1). Regions of the striatum closer to the ventricles (dorsomedial and medial striatum) were more intensely stained than areas of the striatum adjacent to the corpus callosum (lateral and ventrolateral striatum). The cerebellum also displayed greater HO-1-ir in the superficial folia compared with the deeper regions (Table 1). At 12 hours, most regions displayed modest to intense HO-1-ir in contrast to saline-injected controls. At 24 hours after injection, robust HO-1-ir was evident in nearly all brain regions. The HO-1-ir induced by HbA0 peaked between 12 and 24 hours after injection (Table 1). By 2 days, the intensity of staining was substantially reduced, and by 8 days after injection, sections from HbA0-treated animals were similar to the saline-treated controls (Table 1). Finally, a comparison of all three Hb preparations showed that the patterns of HO-1-ir and the cell types labeled in the α-αHb and SFHb groups were very similar to the HbA0 24-hour group in all brain regions, including all regions of the cerebral cortex (Fig. 7), hippocampus (Fig. 8; a high-power view of the area around the hippocampal fissure is shown in Fig. 9), and cerebellum (Fig. 10). The intensity of HO-1-ir was not consistently greater with any one type of hemoglobin, though there was a tendency for the α-αHb group to display the least HO-1-ir (Fig. 7D, Fig. 8D, Fig. 10B).
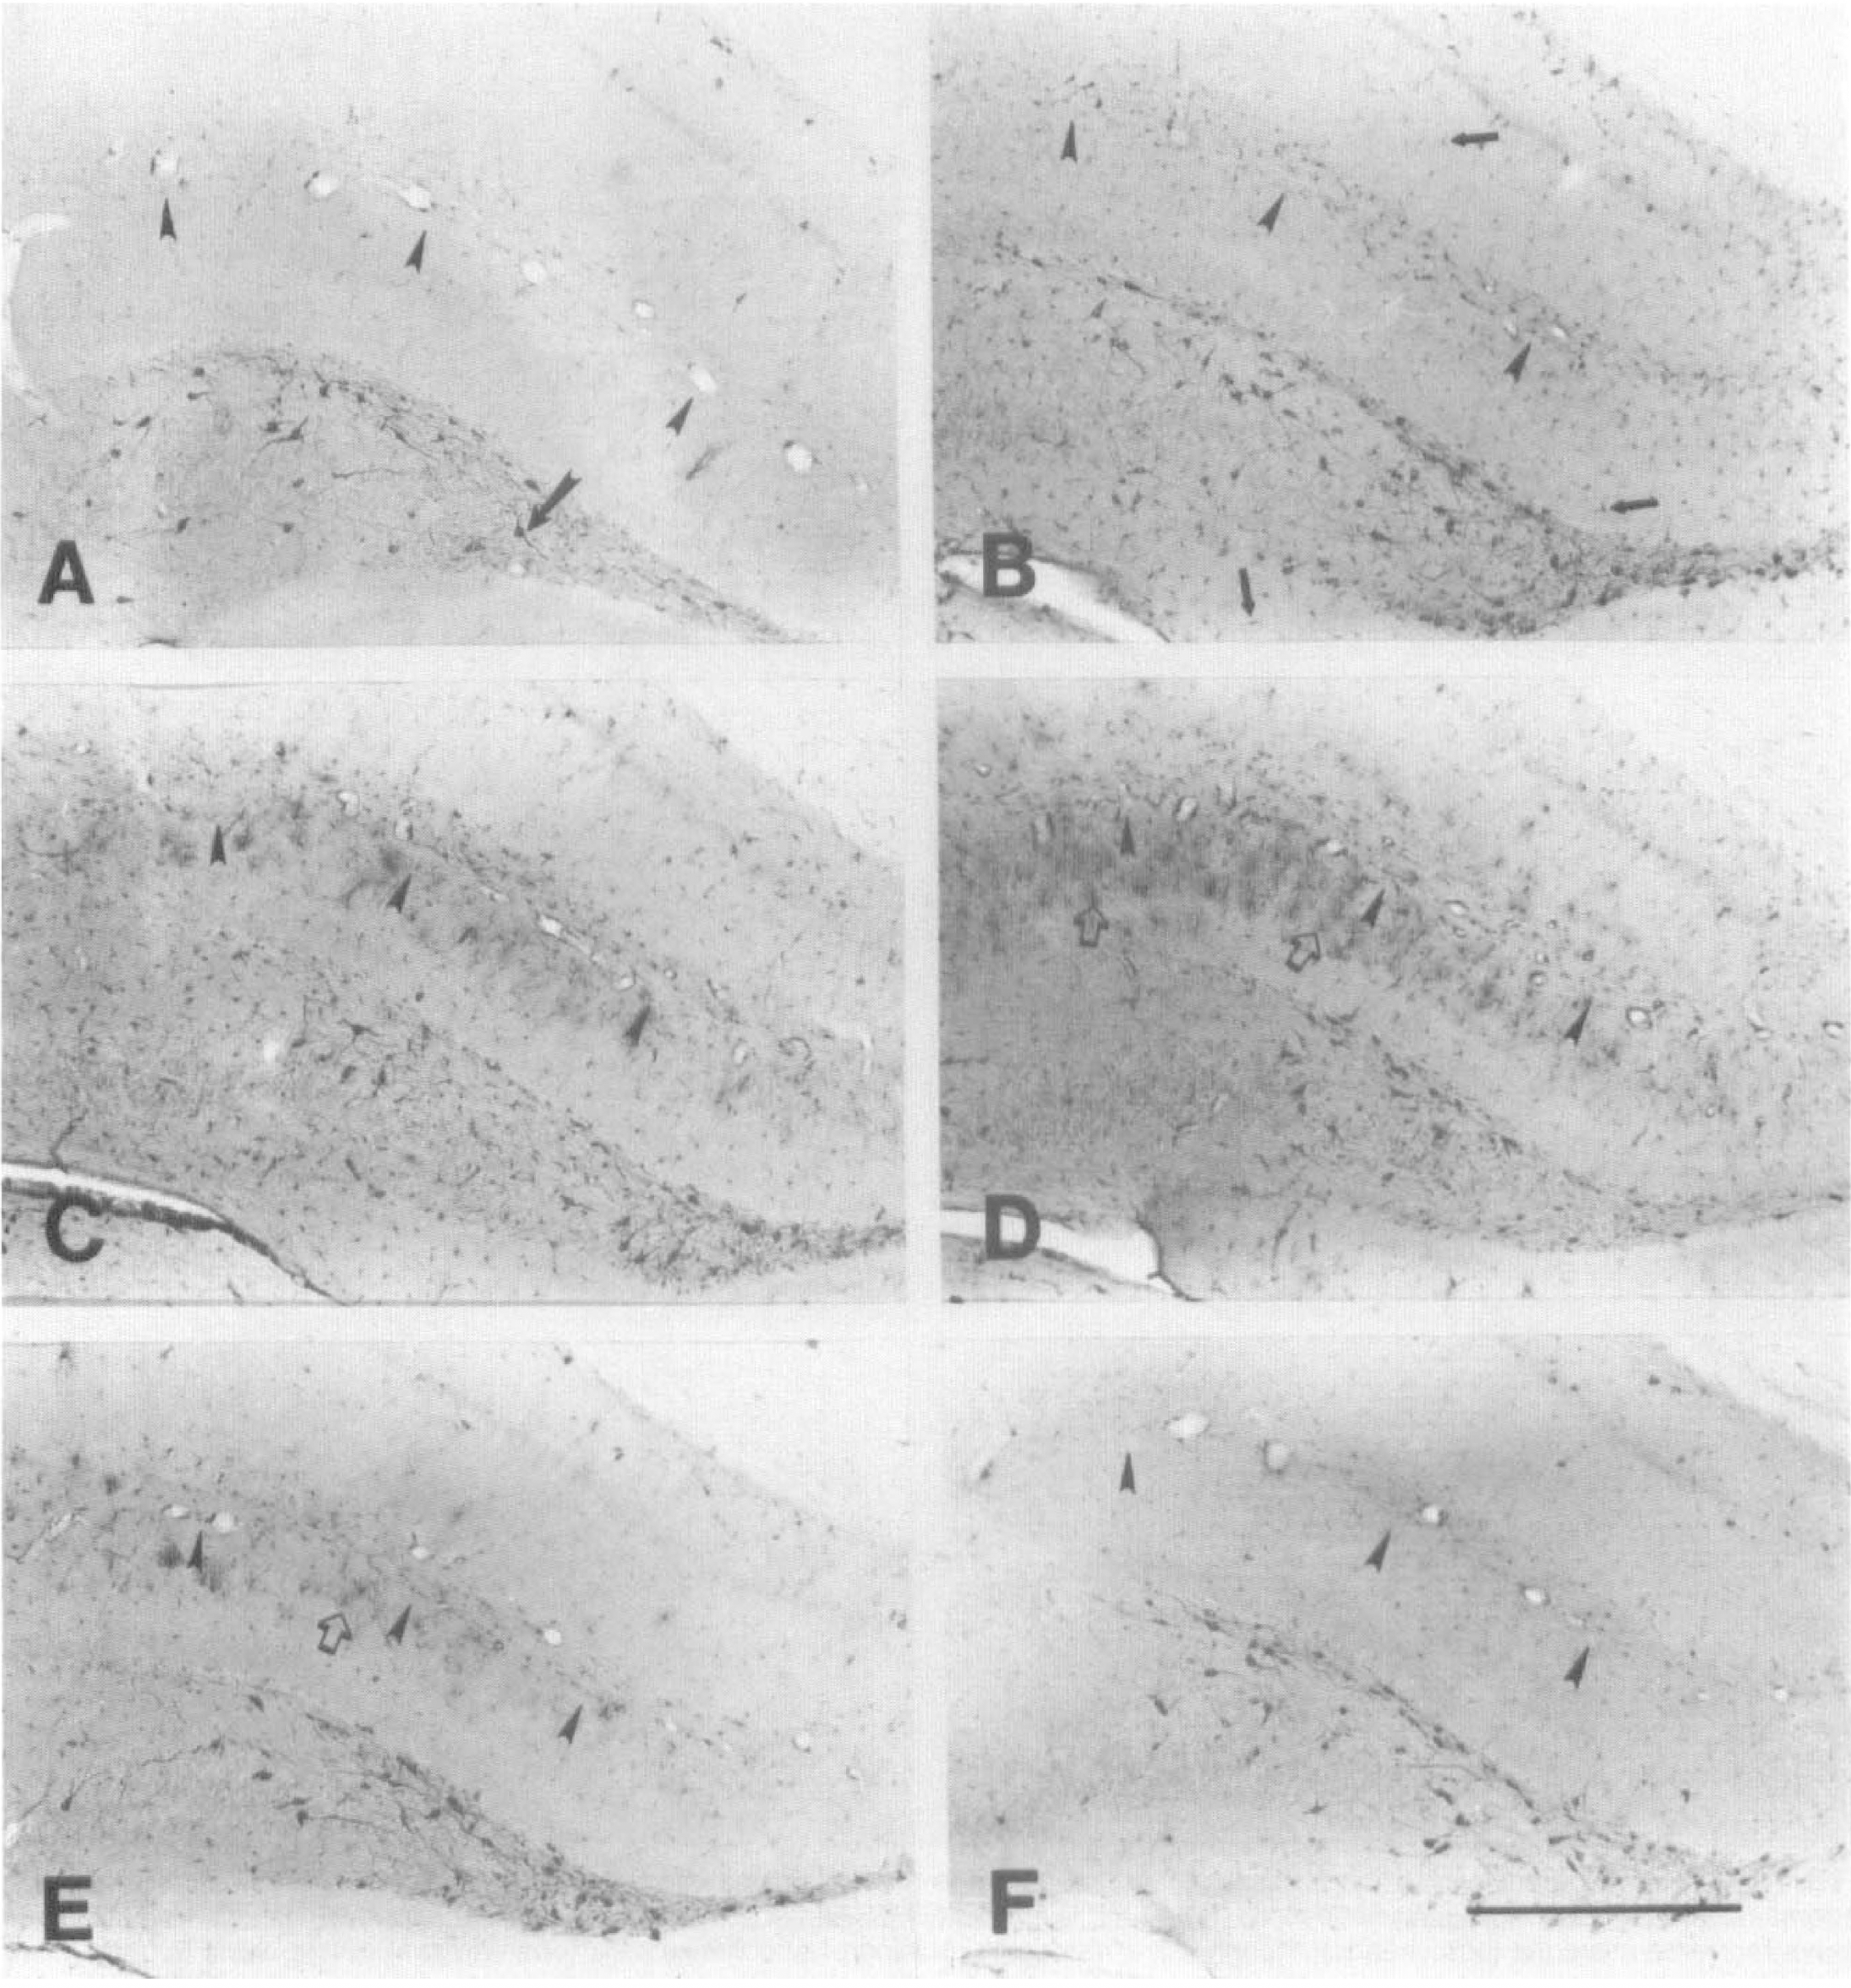
The distribution and time course of HO-1 immunoreactivity in the hippocampus after cisterna magna injection. (
HO-1 immunoreactivity in the retrosplenial cortex 24 hours after injections into the cisterna magna. (
HO-1 immunoreactivity in the hippocampus 24 hours after injections into the cistema magna. (
High-power view of the outlined areas shown in Fig. 8. Each panel in this figure corresponds to the same panel in Fig. 8. Open arrows (
HO-1 immunoreactivity in the cerebellum 24 hours after injections into the cisterna magna. (
Heme oxygenase-1 immunoreactivity in uninjected, BSA-injected, and saline-injected groups
There was little or no HO-1-ir on Western blots of brains of uninjected control animals (Fig. 3, lanes 1, 2, and 3). Small amounts of HO-1 protein were detectable on Western blots of cerebellum, hippocampus, and cerebral cortex of animals injected with saline (Fig. 3, lanes 4, 5, and 6).
Immunohistochemically, there was very little immunostaining in cerebral cortex (Fig. 7A), hippocampus (Fig. 8A), or cerebellum (Fig. 10A) of uninjected control animals. There were HO-1-positive neurons in the dentate hilus of uninjected controls (Fig. 8A) as well as in the same region after injections of saline (Fig. 6A; Fig. 8C), BSA (Fig. 8E), and hemoglobin (Fig. 6B—F; Fig. 8B, 8D, and 8F). The expression of HO-1 in these dentate hilar neurons appeared to be unaffected by any of the treatments, although the number of cells expressing HO-1-ir was not quantified.
Saline injections into the cisterna magna did induce low levels of HO-1-ir in several brain regions, including the cerebral cortex (Fig. 7C), the molecular layer of the dentate gyrus (Fig. 8C), and the Purkinje layer and molecular layer of the cerebellum (Fig. 10C). Intracisternal injections of BSA produced little induction of HO-1 in the cortex (Fig. 7E) compared with uninjected controls (Fig. 7A), but did result in a modest induction of HO-1 to a similar degree as saline in the molecular layers of dentate gyrus and the lacunosum molecular layer of hippocampus (Fig. 8E) and in the Purkinje and molecular layers of cerebellum (Fig. 10E). Most of the lightly stained cells seen in uninjected controls and in saline- and BSA-injected animals exhibited small, round cell bodies with short processes (Fig. 7–Fig. 10). The morphology of these cells was very similar to the morphology of the cells displaying profound increases in HO-1 in Hb-treated animals (Fig. 5).
Morphology of HO-1-positive cells and double labeling
In most regions of the brain of HbA0-treated animals, HO-1-ir was restricted to cells with small, rounded cell bodies. There were approximately two to four processes per cell body, which remained relatively close to the cell body without a high degree of branching (Fig. 5). Sections of cortex (Fig. 11 A, D, and G) and septum (Fig. 11B, E, and H) stained with both anti-HO-1 (Fig. 11A and B) and anti-OX42 (Fig. 11D and E) demonstrated that virtually every HO-1-positive cell was also OX42 positive (Fig. 11A and D for cortex; 11B and E for septum). However, not all OX42-positive cells (Fig. 11D and E) were HO-1-positive (Fig. 11A and B).
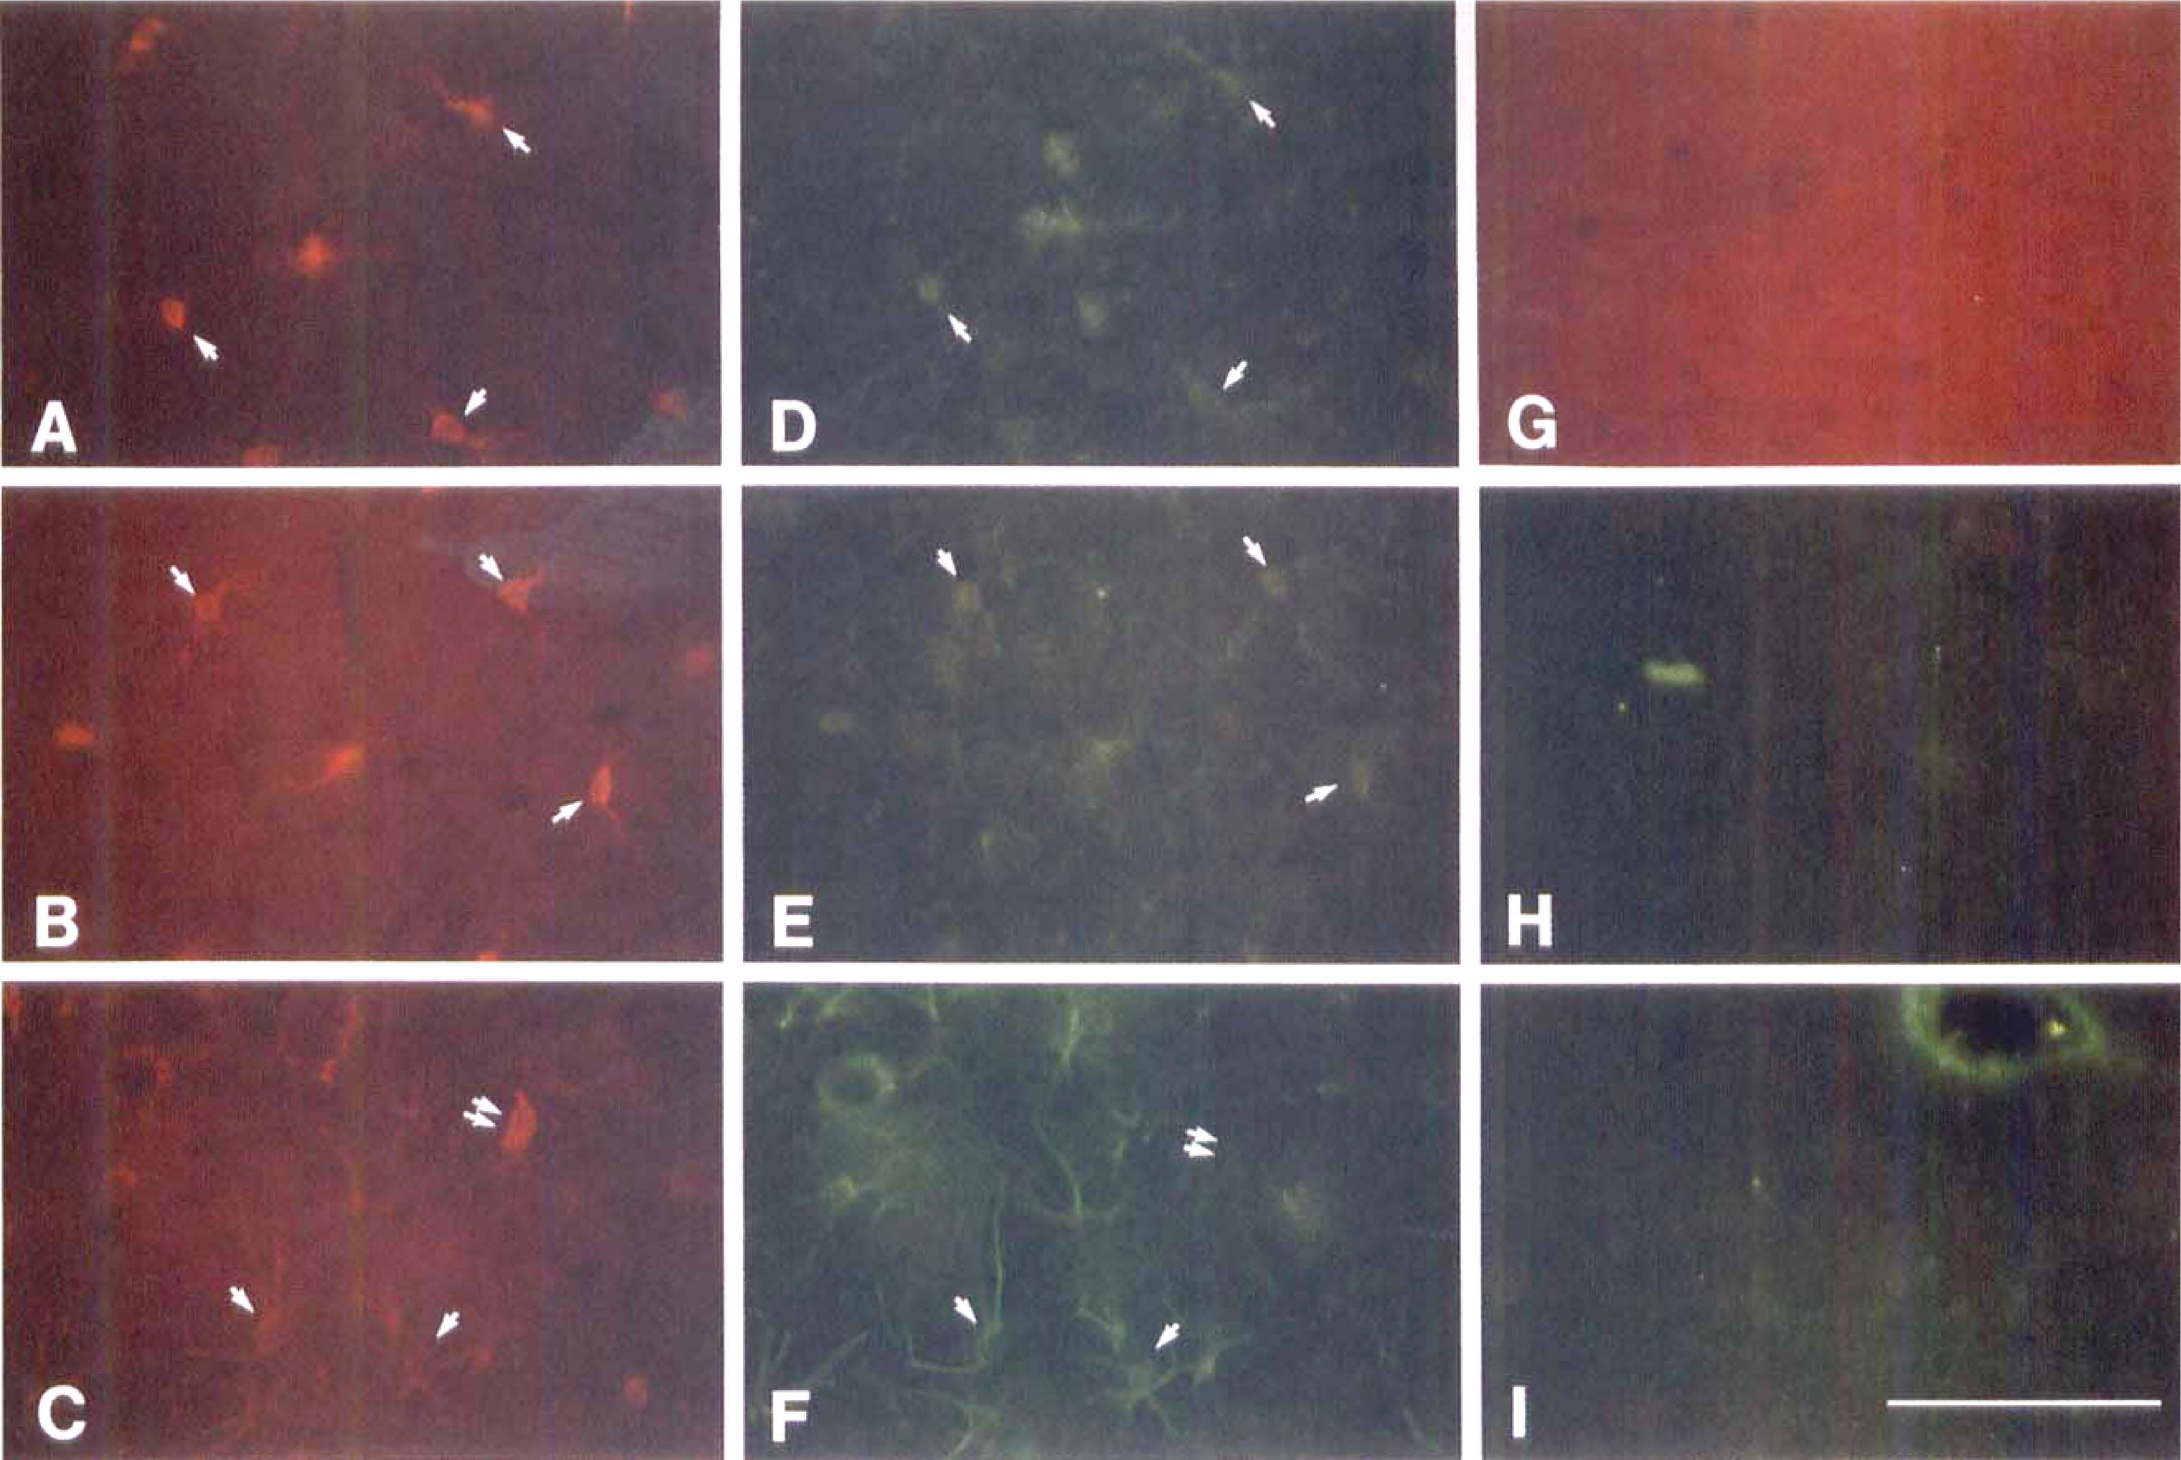
Double fluorescent staining for HO-1 and OX42 or GFAP using brain sections from rats 24 hours after intracisternal injection of HbA0. Sections were stained for HO-1 (rhodamine, red) together with either OX42 or GFAP (FITC, yellow or green). Sections were from three areas: retrosplenial cortex (
In hippocampus of hemoglobin-injected animals, many of the HO-1-ir cells appeared to be microglia. However, HO-1-ir cells with a different morphology were observed in the molecular layer of the dentate gyrus and in lacunosum molecular layer of the hippocampus (Fig. 6C—E; Fig. 8B, D, and F; Fig. 9). These HO-1-ir cells displayed more numerous and elaborate processes. Double staining with anti-HO-1 (Fig. 11C) and anti-GFAP (Fig. 11F) antibodies demonstrated that these HO-1-stained cells also stained for GFAP, confirming that they were astrocytes. In most brain regions, GFAP-positive cells were HO-1 negative (not shown). It was notable that microglial HO-1-ir in the hippocampus (Fig. 6B) preceded astrocytic HO-1-ir (Fig. 6C and D) by 8 to 12 hours.
DISCUSSION
Hemoglobin induces the stress gene HO-1 (HSP32) in microglia throughout the brain after injections of this protein into the subarachnoid space. In general, the areas of greatest HO-1 induction occurred where the Hb concentrations were highest. The distribution of Hb after injection into the cisterna magna is consistent with hemoglobin diffusing into the subarachnoid spaces and ventricles (Whitesell et al., 1993; Williams and Razumovsky, 1993). The rapid appearance of Hb in the dorsal thalamus and hippocampus would be consistent with the injected Hb entering the fourth ventricle from the cisterna magna and then diffusing into the third and lateral ventricles (Yee et al., 1994; Weller et al., 1992). Alternatively, Hb could also gain access to these structures through the velum interpositum, the subarachnoid extension above the third ventricle.
The distribution of Hb over the cortex and hypothalamus at the base of the brain, as well as over the entire cortical convexity (with the highest concentrations in the region of the sagittal sinus), is consistent with the flow of cerebrospinal fluid (CSF) from the cisterna magna to the basilar cisterns, over the convexity to the superior sagittal sinus, where CSF absorption occurs (Weller et al., 1992; Williams and Razumovsky, 1993). Similar observations were made after lysed autologous blood was injected into the subarachnoid space (Delgado et al., 1985). It is likely that the pattern of inward diffusion of biotinylated Hb occurred down Virchow Robin spaces, extensions of the subarachnoid space that accompany surface blood vessels deep into the parenchyma of all brain regions (Lee and Olszewski, 1960). However, fluid could track along the white matter fibers such as the internal capsule and so gain access to intracerebral structures.
The observation that HO-1 induction was greatest in regions where Hb concentrations were greatest, and that HO-1 induction was least in regions where Hb concentrations were the least, would suggest that Hb itself, rather than some other molecule, led to HO-1 induction. The ability of Hb-derived heme to penetrate endothelial cells in vivo and induce HO activity has been demonstrated in rat lung (Balla et al., 1995). Though Hb is shown to diffuse throughout the brain, the precise mechanism of HO-1 induction has not been addressed. The simplest explanation would be that heme enters microglia and acts on the heavy metal or heme responsive element in the HO-1 promoter (Alam et al., 1994) to induce HO-1 mRNA and protein. This would imply that heme is released from Hb and that the heme is selectively transported into microglial cells in the brain—perhaps by mechanisms similar to those that transport HRP and other proteins into cells (Roberts et al., 1993; Villegas and Broadwell, 1993; Broadwell and Sofroniew, 1993). It is also possible that there are specific extracellular and intracellular heme transporters (Lash and Saleem, 1995) located on microglial cell membranes accounting for the selective induction of HO-1. A variety of stimuli induces HO-1 in brain including heat shock and oxidative stress (Ewing et al., 1992; Ewing and Maines, 1991). Both global ischemia and focal ischemia have been shown to induce HO-1 in rat brain (Takeda et al., 1994; Paschen et al., 1994; Nimura et al., 1996). In most of these studies HO-1 was induced mainly in microglial cells and to a lesser degree in astrocytes. It is possible that HO-1 is primarily involved with processing heme- and iron-containing proteins released into the extracellular spaces in all of these stressful and cell-damaging situations, protecting the tissue against the pro-oxidant properties of heme- and iron-containing proteins (Balla et al., 1993).
The injections per se cannot account for HO-1 induction since intracisternal saline and BSA injections produced little HO-1 induction compared with the marked HO-1 induction produced by the three different Hb. The slight HO-1 induction in hippocampus and cerebellum produced by the saline or BSA injections might be explained in part by leakage of blood through the hole left in the atlanto-occipital membrane after the removal of the needle. Alternatively, the saline and BSA injections could have produced changes in intracranial pressure, CSF, or blood flow, spreading depression or other changes in cerebral homeostasis that could have induced mild HO-1 expression.
The finding that injections of BSA into the subarachnoid space produce little induction of HO-1 compared with the Hb injections suggests that the presence of a foreign protein is not a potent inducer of the HO-1 gene and that the presence of heme itself is the primary inducer of HO-1. This is consistent with findings in a related study in which introduction of either whole blood or lysed blood into the cisterna magna induced HO-1 almost exclusively in microglia throughout the brain in a distribution identical to that observed in this study after injections of hemoglobin (Matz et al., 1996a). Finally, it is possible that HO-1 might be induced by a chemical intermediary (e.g., cytokine) that is triggered by Hb in the subarachnoid space. Although such an intermediary cannot be ruled out, the direct induction of HO-1 by heme is the simplest explanation for heme induction of HO-1.
With respect to the selective induction of HO-1 in the hippocampus, the most intense HO-1-ir was displayed in layers associated with termination of the perforant path (Fig. 4E and F, open arrows). Afferent stimulation of this pathway (from the entorhinal cortex) could generate seizure-like activity, which may induce a local glial reaction. Such a glial reaction might include induction of the HO-1 gene and would account for the apparent selectivity of the HO-1 staining we have observed within the hippocampus. Even in saline-treated animals, we observed the same glial response on either side of the hippocampal fissure and in the outer blade of the dentate gyrus. The majority of these glia appeared to have an astrocyte-like morphology, with few microglia present (Fig. 9B, open arrow). In contrast, the hippocampi of Hb-treated animals displayed a far greater number of HO-1-positive microglia, in addition to the astrocyte immunoreactivity (Fig. 9D, E, and F, closed arrow). This might suggest that two separate events are taking place, with Hb directly stimulating microglia at the local level while astrocytes respond to indirect, secondary influences of Hb. Microglia might produce factors that activate astrocytes, and the delay in HO-1-ir induction between these two populations of cells (Fig. 6B and C) suggests such a link. Alternatively, if applied directly into the neuropil, Hb can induce epileptiform activity (Rosen and Frumin, 1979). Thus, it is possible that afferent projections to the hippocampus might be stimulated in such a fashion, although no obvious behavioral signs of seizures were observed. Thus, although our data cannot exclude a Hb-mediated afferent stimulation of the hippocampus, the data do not support that the onset of seizure can account for the selective induction of HO-1 in the hippocampus.
Heme oxygenase enzymatic activity releases the pro-oxidant, iron (McDonagh, 1990; Stocker et al., 1987a, 1987b). The iron is presumably bound by light chain ferritin, a protein found mainly in microglia of rat, primate, and human brain (Connor and Benkovic, 1992; Connor et al., 1994; Eisenstein et al., 1991; Kondo et al., 1995; Massa et al., 1996). Microglia may play a role in metabolizing extracellular heme containing proteins and shield other cells from free iron by binding the iron with ferritin. A loss of this putative protective role for ferritin has been suggested by Koeppen et al. (1993), who observed a diminished capacity of ferritin to bind free iron after chronic or repeated subarachnoid bleeding, leading to superficial siderosis.
Thus, microglia may be important in protecting the brain from oxidative stress produced by extracellular heme- or iron-containing proteins. In the presence of peroxides, hemoglobin increases the amount of catalytically active iron (Gutteridge, 1986), which can increase the formation of hydroxyl free radicals by the Fenton reaction (Braughler et al., 1986). This leads to degradation of DNA, lipids, and proteins (Imlay et al., 1988). In addition, lipid peroxidation can free more catalytically active iron from Hb (Gutteridge, 1987). Thus, Hb acts as a pro-oxidant by releasing catalytically active iron, which can initiate cellular oxidative stress. Of additional importance is that Hb, either alone or in concert with other substances, can lead to vasospasm (MacDonald and Weir, 1991). Rapid clearance of the hemoglobin by brain microglial cells could be important for decreasing the incidence and severity of vasospasm after subarachnoid hemorrhage.
Because the HO-1 stress gene is induced by a number of injurious stimuli, it would be important to determine whether the hemoglobin injections damage glia, endothelial cells, or neurons. We have previously demonstrated that intracisternal injection of lysed autologous blood can produce focal areas of heat shock protein-70 (HSP70) that were coincident with areas of increased HO-1 expression (Matz et al., 1996a, 1996b, 1996c). These focal areas also exhibited DNA fragmentation as evidenced by DNA nick end-labeled, terminal deoxynucleotide transferase, dUTP-biotin, nick and labeling stained dead cells. We hypothesized that these damaged regions were the result of focal vasospasm induced by the lysed blood.
Although HO-1 is markedly induced after subarachnoid injections of blood and Hb (Matz et al., 1996a, 1996b, 1996c; present study), the bulk of the brain HO enzyme activity is normally accounted for by the HO-2 gene (Maines, 1988). Heme oxygenase-2 protein is constitutively expressed mainly in neurons and is not induced by most stimuli (Ewing and Maines, 1992). It is possible that HO-1 might not be induced in neurons if HO-2 activity were sufficiently high to metabolize heme and so diminish heme's ability to induce HO-1 expression. Perhaps the microglia are efficient enough at processing extracellular heme-containing proteins that heme levels in neurons do not increase significantly to stimulate any neuronal HO-1.
The relative roles of HO-1 and HO-2 in heme metabolism are complicated by the fact that there are previous examples of HO-1 induction in tissue without an attendant change in HO enzymatic activity as measured by the production of biliverdin (Ewing and Maines, 1993). It is possible that overall HO enzymatic activity may be accounted for almost wholly by HO-2 activity, and that changes in HO-1 expression will not significantly alter total HO activity. It is also possible that HO-1 functions as a protein chaperone (Craig, 1993), in addition to its role as a heme metabolizing enzyme (Maines, 1988). Thus, HO-1 induction by hemoglobin in microglia may be related to a chaperone function for HO-1 for heme proteins in microglia, a function not shared with neurons or other cell types.
The failure of the Hb injections to induce HO-1 in neurons was paralleled by the absence of HO-1 induction in astrocytes of most brain regions. Again, this might argue for specific heme uptake into microglia. However, the Hb injections did induce HO-1 in specific subpopulations of astrocytes near the hippocampal fissure in the molecular layer of the dentate gyrus and in the lacunosum molecular layer of hippocampus. A similar induction was observed in astrocytes in the piriform cortex. This HO-1 induction in the astrocytes was prominent even in saline-injected and (to a lesser extent) BSA-injected animals, suggesting that astrocytic HO-1 induction might not be related to heme injections, but rather was related to some other effect on these astrocytes—perhaps to some physiologic response to intracisternal injections.
Modified Hb (such as crosslinked molecules similar to the α-αHb used in this study) are currently being considered as substitutes for blood itself in surgery, medical emergency, or situations in which the usual sources of blood have a high risk for viral or bacterial contamination. Such blood substitutes could have higher oxygen-carrying capacity, would not require crossmatching and could be made pathogen-free. However, considering the toxic effects of Hb on neurons in culture and the clear induction of a stress protein by a modified Hb demonstrated here, it may be of importance to weigh the rationale for using an Hb-based oxygen carrier as a substitute for red blood cells or whole blood against the potential toxic side effects of heme-based substances. Though modified Hb clearly induced HO-1 in these studies, it is not clear whether they might be more or less neurotoxic than unmodified oxyhemoglobin, and whether they would be more or less likely to produce cerebral vasospasm than oxyhemoglobin.
This study suggests that microglia may selectively transport and metabolize extracellular Hb in the brain, and secondarily sequester the intracellular iron released by HO-1. Microglia have the generalized function of metabolizing all extracellular heme- and iron-containing proteins, and hence moderating the oxidative stress posed by these iron-containing proteins.