
Abstract
Functional imaging of a language task using positron emission tomography was performed as part of the preoperative assessment of a patient with a left supplementary motor area (SMA) tumor. Positron emission tomography scans were obtained during language tasks (verb generation and word reading of visually presented nouns) that normally lead to increased blood flow in the SMA relative to a control condition (visual fixation). In the patient, the normal SMA response was an order of magnitude larger in the region of the tumor. Other regions, such as left inferior frontal cortex and right cerebellum, showed equivalent activation in the patient and normal subjects. Histopathologic study revealed an anaplastic astrocytoma. Thus, this exaggerated vascular response to local neuronal activation occurred in the setting of a proliferation of glial cells. This is consistent with models of coupling of regional CBF and neuronal activity that implicate glia as the mediatol between neurons and vasculature. The concept that tumoral disruption of normal vascular responses could, in some cases, potentially enhance rather than dampen the response is proposed.
Functional imaging techniques, like positron emission tomography (PET) or functional magnetic resonance imaging, have been increasingly used to localize neuronal substrates of brain function in the study of normal human brain function. Functional imaging also has been advocated for localization of cerebral functions in clinical settings (Binder et al., 1995; Cuenod et al., 1995; Desmond et al., 1995).
Imaging techniques take advantage of the changes in blood flow and metabolism that are coupled to neural activity (Raichle, 1987; Sokoloff, 1981). Positron emission tomography imaging relies on the coupling of regional CBF to local changes in neural activity. However, tumors, and brain in the region of tumors, may not exhibit the normal relation between regional blood flow and metabolism. Intraoperative observations, including early observations of Penfield regarding cystic lesions (Penfield, 1937), and later expanded to tumors by Feindel and Perot (1965), suggest that, in regions of tumor, normal CBF and oxygen metabolism patterns may be disrupted. In particular, the observation of “red veins” was thought to indicate blood flow to the region of tumors well in excess of local oxygen metabolic demands. If normal blood flow and metabolism coupling mechanisms are disrupted, the unique assumptions behind a given imaging modality may not hold in patients with cerebral neoplasms.
We report a patient with a left medial frontal tumor in the region of the supplementary motor area (SMA). Functional imaging with PET was used preoperatively to map language cortex using a language task, verb generation, chosen for its reliable lateralized response in normal right-handed subjects (Herholz et al., 1996; Petersen et al., 1988; Petersen et al., 1989; Raichle et al., 1994; Wise et al., 1991). In this patient, the usual pattern of functional activation was found, but with greatly increased activation in the region of the tumor.
METHODS
Case description
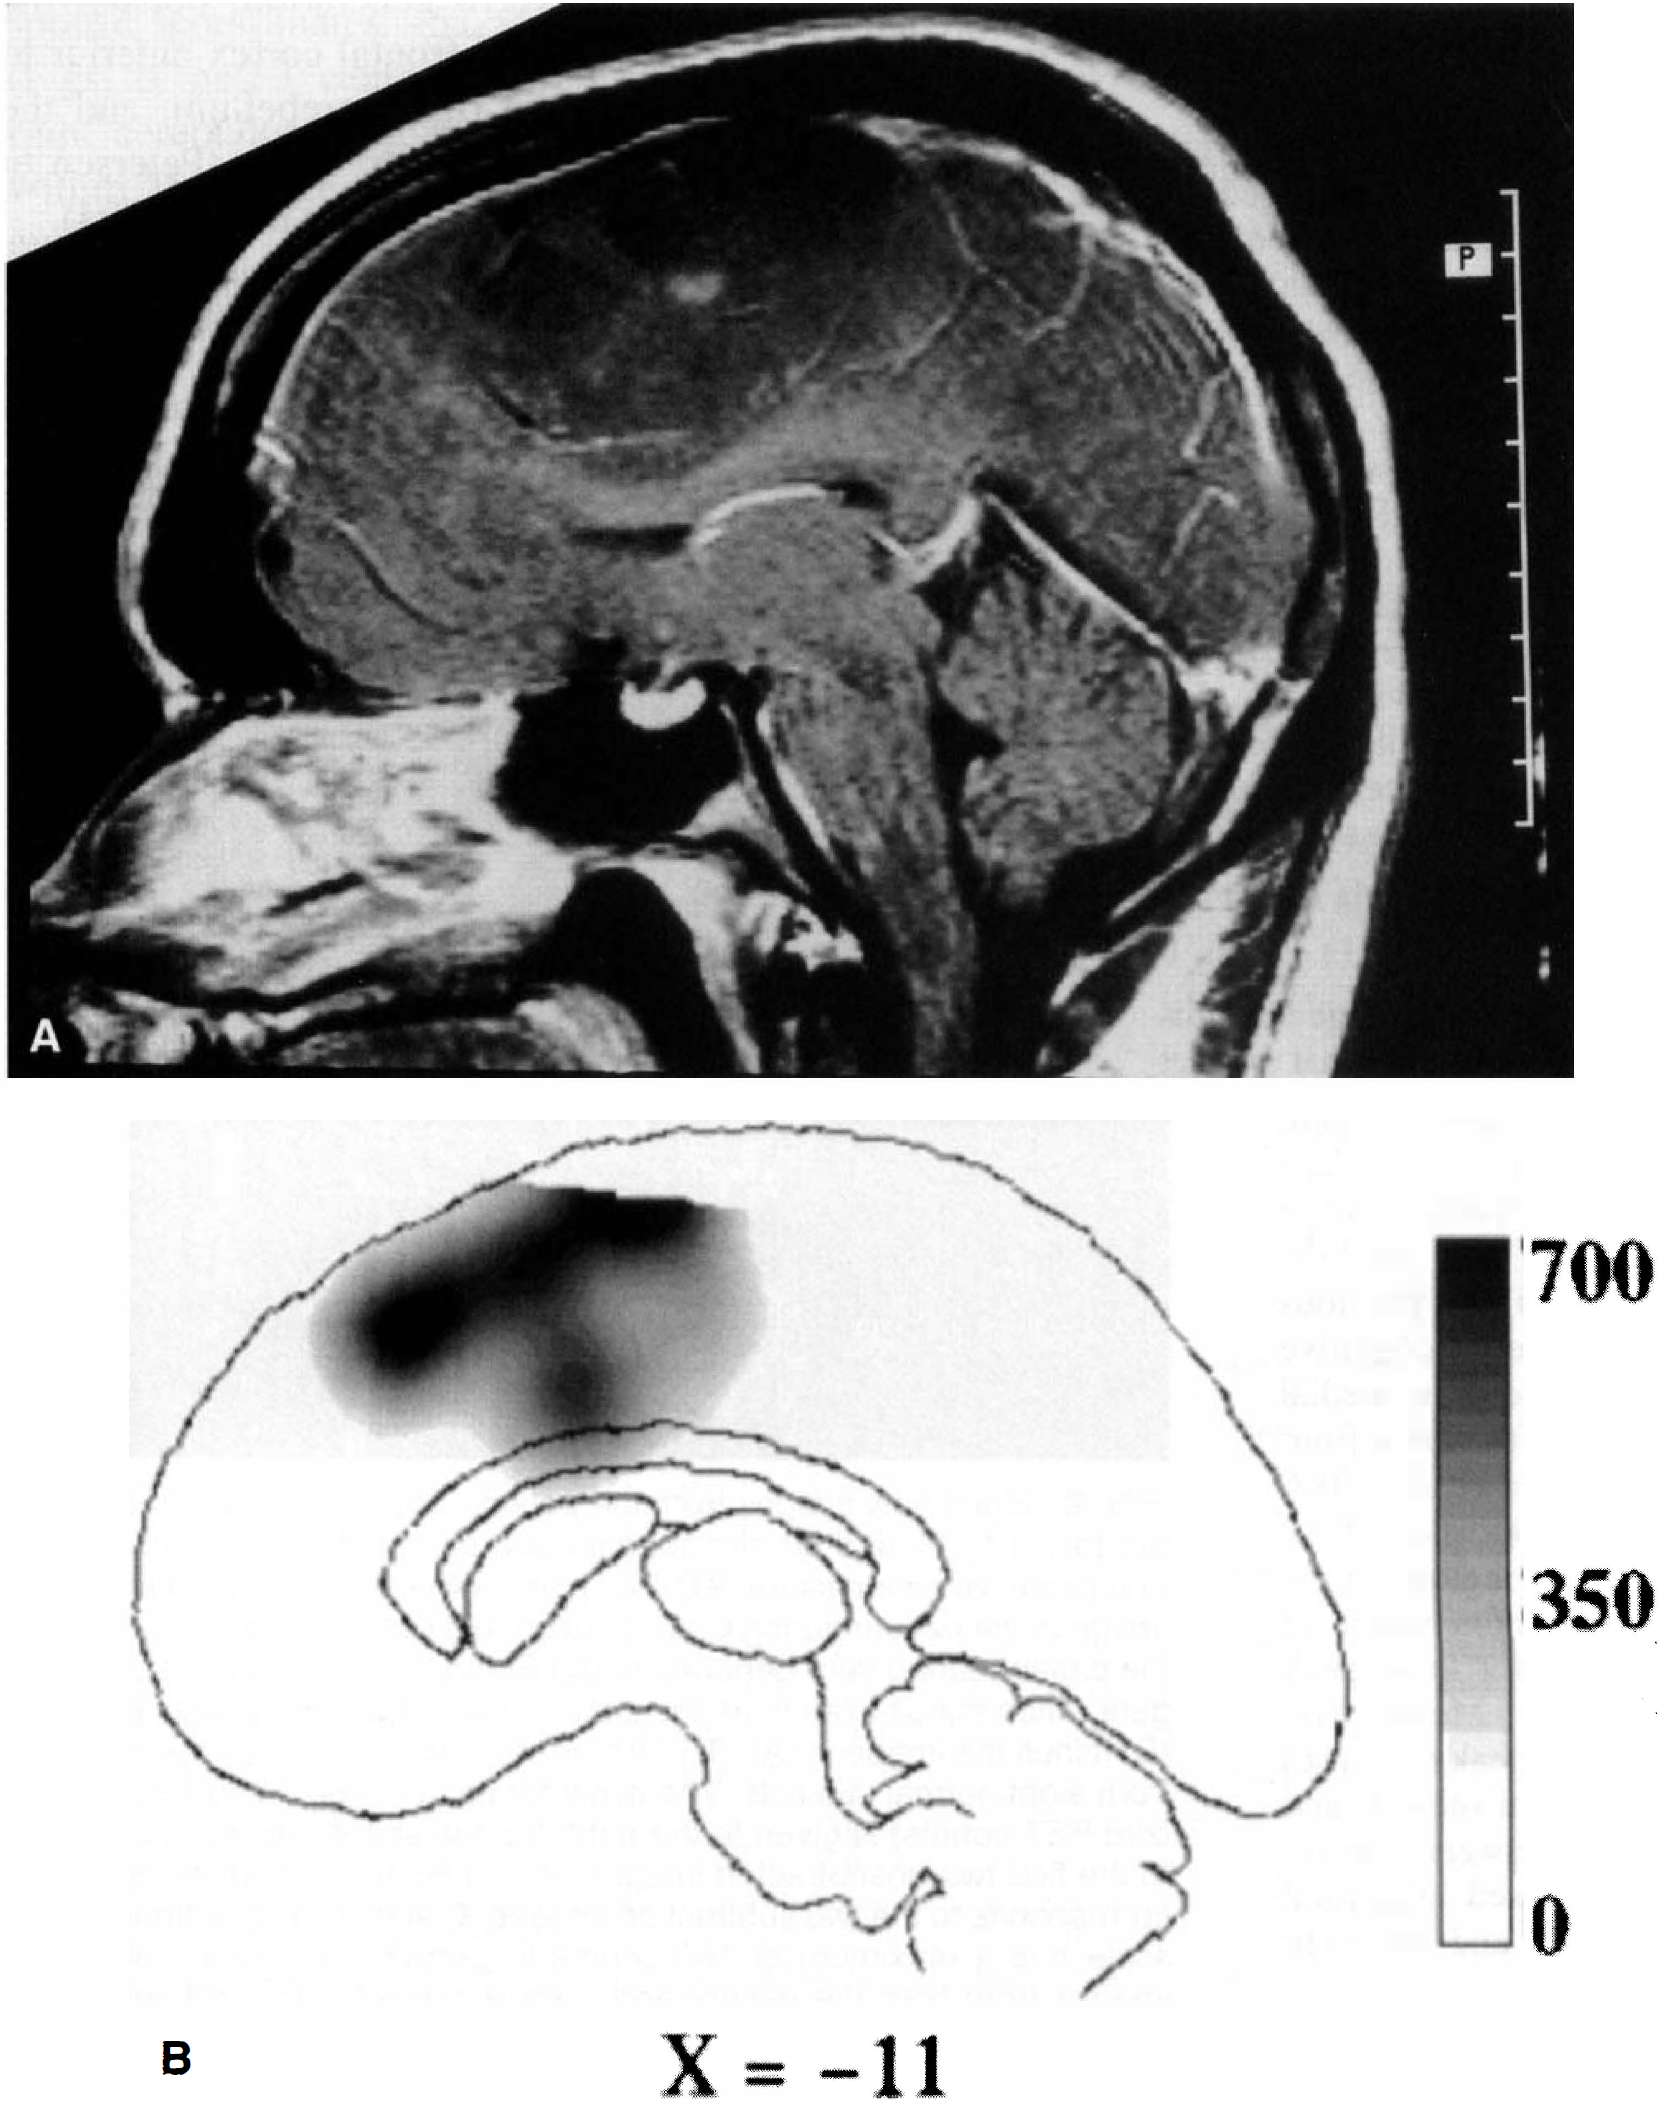
A 24-year-old right-handed man presented with new-onset motor and generalized seizures and mild clumsiness of his right hand. He had no clinically evident language deficits, and no motor deficit could be demonstrated on bedside examination. A large, enhancing lesion in the left medial frontal lobe, in the region of the SMA, was found (Fig. 1A). Angiography showed the lesion to be nearly avascular, with a slight left-to-right round shift. Cerebral Amytal study (Wada and Rasmus sen, 1960) showed the left hemisphere to be dominant for language. Craniotomy was performed with intraoperative localization of motor cortex posterior to the tumor boundary. After gross total resection of a grade III astrocytoma, the patient awoke with intact language and unchanged motor function. Preoperatively, the patient underwent PET imaging during two cognitive tasks and control conditions to localize language function.
Data from normal subjects (N = 8, 2 men, aged 20 to 23 years) had been obtained using the same PET system. These subjects were used as a control population for the patient. All subjects were strongly right-handed by the Edinburgh handedness inventory (Raczkowski et al., 1974). For all studies, informed consent was obtained in accordance with guidelines set by the Human Studies and the Radioactive Drug Research Committees of Washington University.
Imaging
Positron emission tomography studies during various behavioral conditions (see later) were obtained. Emission and transmission measurements were made using a Siemens 953B-CTI scanner with 3.38-mm transverse slice separation (31 slices) in three-dimensional mode with septa retracted (Spinks et al., 1992).
The PET scanning methodology developed at Washington University was used (Fox et al., 1988; Mintun et al., 1989). The subject was positioned on a flat bed, and a plastic face mask was placed to reduce head movement (Fox et al., 1985). A lateral skull x-ray was obtained to locate the line between the anterior and posterior commissure (Fox et al., 1985; Talairach and Tournoux, 1988).
Images were obtained during 40-second scans each after intravenous injection of 15 mCi H2-15O. Because of the linear relation between tissue counts and blood flow for scans of less than 1-minute duration, measurements of arterial blood radioactivity were not made. Regional tissue counts were used instead to estimate local blood flow (Fox and Mintun, 1989; Herscovitch et al., 1983).
Images were reconstructed and filtered giving a final resolution of approximately 14 mm full-width at half-maximum. To account for differences in tissue activity caused by differences in global flow or amount of 15O injected, global counts were normalized to 1000 (Fox et al., 1988). Each image was transformed into the stereotactic space of Talairach and Tournoux (1988). The transformed image consisted of cubic voxels (2 mm3) with coordinates reported as x (right = positive), y (anterior = positive), and z (superior = positive).
Task design
Subjects performed three different tasks: word reading, verb generation, and visual fixation. These tasks were based on those from earlier studies of normal language function (Petersen et al., 1988; Petersen et al., 1989; Raichle et al., 1994). “High” frequency (more than five occurrences per million; Kucera and Francis, 1967), concrete nouns were presented on a color monitor placed about 35 cm from the subject. Words were presented at 1.5 seconds per word for the normal subjects. The patient had some difficulty performing the verb generation task at 1.5 seconds per word, thus the rate was slowed to 2.25 seconds per word for the patient. During the word reading task, subjects were instructed to read aloud the noun shown. During the verb generation task, the same list of nouns was shown, but subjects were instructed to say aloud an associated verb for each noun seen. During visual fixation, subjects were instructed to look at a cross-hair in the center of the screen for the duration of the scan.
Image analysis
Subtraction images were made from each language task minus the visual fixation control studies. For the normal subject data, 16 pairs of each task minus control (two per subject) were averaged in atlas coordinates. The patient also performed each task twice, and the subtracted data (task minus control) were averaged in atlas coordinates.
The analysis of regions was guided by the results of previous studies of these tasks. Specifically, changes related to cognitive function in the verb generate task had been seen in medial frontal regions (SMA and anterior cingulate), left inferior frontal cortex, and right cerebellar regions (Petersen et al., 1988; Petersen et al., 1989; Raichle et al., 1994). The location of the peak response was identified for each of these regions in the average verb generation minus fixation subtraction image of the normal subjects in this study. Coordinates for these peak responses are reported for the normal subjects. Mean voxel values (in a 14-mm sphere centered around each peak response) were determined for subtraction images in normal subjects and in the patient. Thus, comparison was made between the regional value in the patient to the range measured in normal subjects for the SMA, the left frontal region, and the right cerebellar region.
Activation of SMA is also seen in normal subjects during word reading minus fixation (Petersen et al., 1988; Petersen et al., 1989). The SMA peak seen in normal subjects during reading minus fixation is more superior than the center of SMA activation during verb generation. The patient in this report was not imaged adequately in the more superior regions, thus the coordinates for SMA from the reading task could not be applied to the patient's data. Therefore, to assess changes near the tumor during word reading, the same SMA peak coordinate was used as determined in normal subjects in the verb generation task minus fixation subtraction.
RESULTS
Normal subjects had several areas of increased activation in both the verb generation (Fig. 2D) and word reading tasks compared with fixation, consistent with other reports (Petersen et al., 1988; Petersen et al., 1989; Raichle et al., 1994). Visual and motor cortex were active as was medial cerebellum. The SMA was active during both tasks. Areas active in the verb generation, but not the reading task, were left inferior frontal cortex anterior to the classic Broca's area, the right cerebellum, and the anterior cingulate cortex adjacent to SMA (Petersen et al., 1988; Petersen et al., 1989; Raichle et al., 1994).
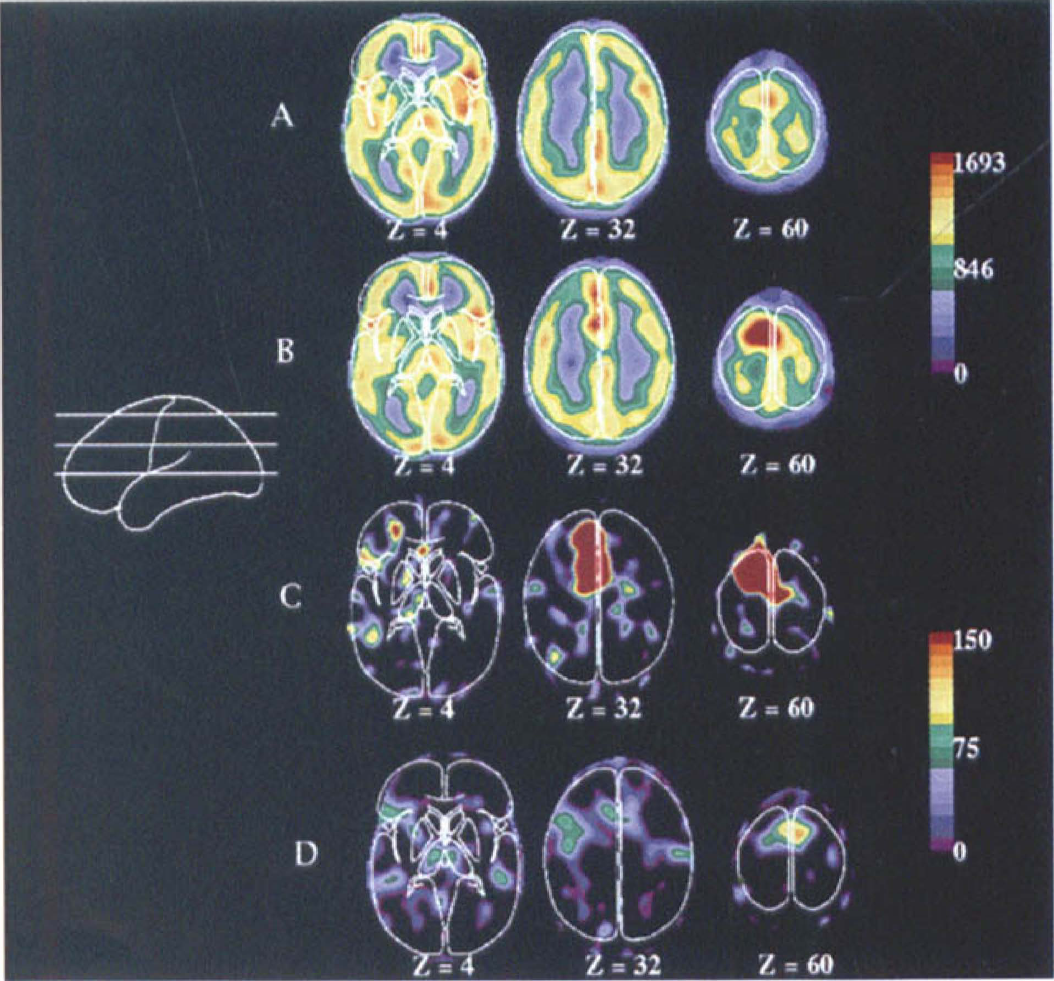
Blood flow images from the patient. Transverse sections are taken 4, 32, and 60 mm superior and parallel to the anterior and posterior commissure (AC-PC) plane.
During verb generation task minus fixation in the patient, a large activation was seen in the left SMA in the region of the tumor. Figure 1 shows the large, overlapping, spatial extent of both the tumor (Fig. 1A) and the activation (Fig. 1B). Although the location of the response corresponded to that found in the normal subjects during this task (x, y, z = −3, 11, 44), the magnitude of the response was dramatically different. In normal subjects, the mean response was 57 counts (globally normalized to 1000 counts, thus representing approximately a 6% change in flow). In the patient, the mean response over two runs was 650 counts (Fig. 3, left graph). This mean was over 9 SD larger than the mean response in normal subjects. The spatial extent of the SMA response was greater in the patient (Fig. 2, Z = 32 mm and 60 mm). Both the anterior–posterior and the superior–inferior extent of the response were exaggerated in the region of the tumor.
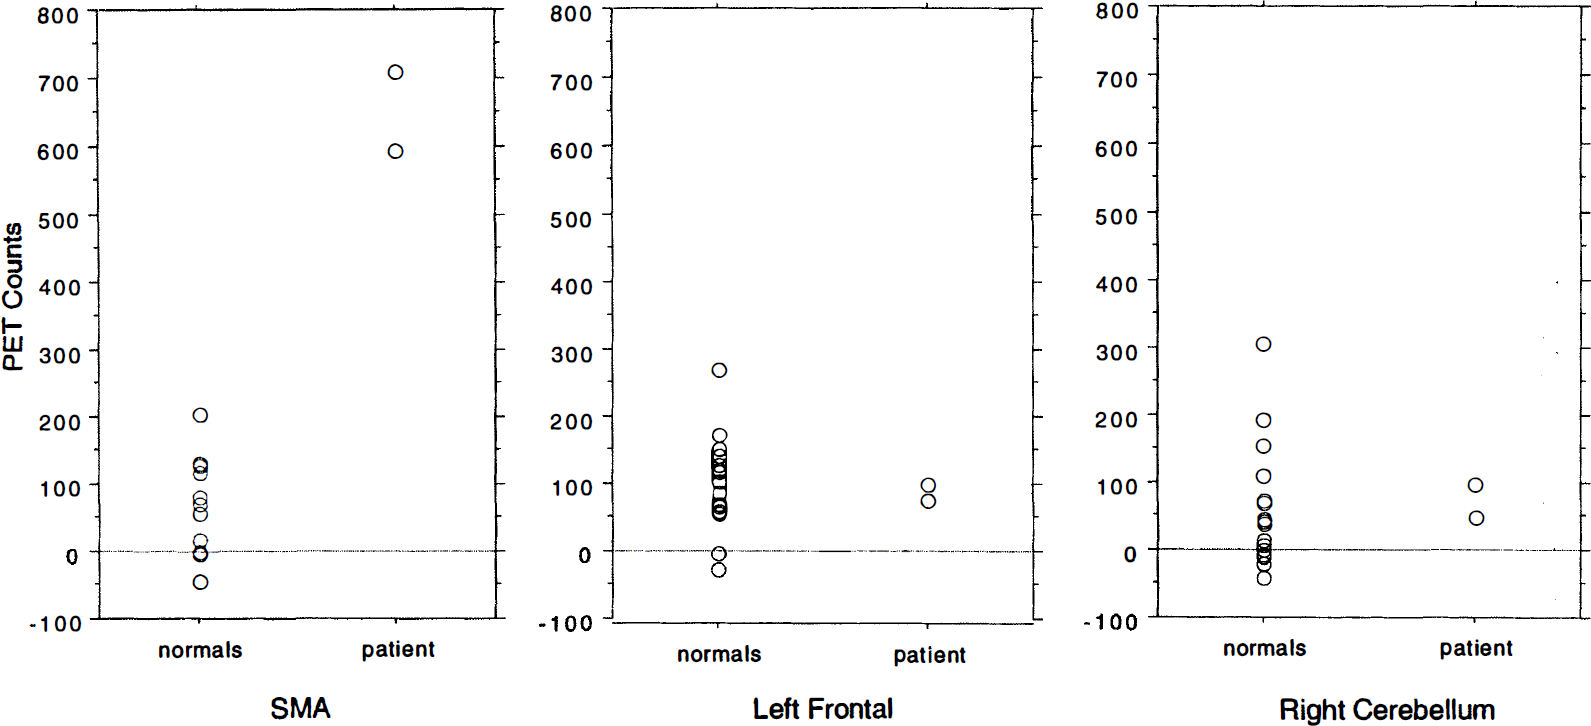
Regional activity in normal subjects and the patient for several regions for verb generation minus fixation. Each measurement (two per subject) is represented by a circle. The anatomical location of the region is indicated. The SMA activation in verb generation minus fixation was much greater in both measurements in the patient than in any measurement in normal subjects. Activations in the left frontal and right cerebellar regions were within the range of normal subjects.
In addition to the SMA activation, a left frontal response (coordinates −51, 17, 6) of normal magnitude (Figs. 2C and 3, center graph) was seen. Increases in the right cerebellum (coordinates 17, −59, −12) also were within the range of normal responses (Fig. 3, right graph).
Using the same SMA coordinates from the verb generate task (i.e., −3, 11, 44), mean SMA activation during word reading was dramatically increased in the patient. The patient had a mean of 278 counts in the two-word reading minus fixation images compared with a mean of 27 counts in this region for normal subjects.
No region was seen, in the vicinity of the tumor, where blood flow was higher in the resting state than during functional activation. Thus, no evidence existed that increased flow in the region of the tumor corresponded to a “steal” of CBF to nearby tissue.
In the resting state (visual fixation) blood flow was decreased in the region of the tumor relative to the contralateral side (Fig. 2A). This relation was reversed during activation of the SMA (Fig. 2B). In other words, the baseline decrease in resting blood flow was well exceeded by the dramatic increase in regional blood flow occurring with functional activation.
DISCUSSION
In both paradigms tested, the patient had an anatomically normal distribution of activation, but the response, in the region of the tumor, was an order of magnitude greater than that seen in normal subjects. The SMA responses to either reading or verb generation are readily seen in normal subjects, but are of approximately equal magnitude to the left frontal lobe and right cerebellar activations during verb generation. Although the methodology used does not permit accurate quantitative measurements of the magnitude of blood flow changes for changes of this magnitude (Herscovitch et al., 1983; Fox et al., 1988), the relative relation between PET counts and blood flow is preserved. At worst, for high blood flow, tissue counts underestimate blood flow due to the brain permeability limitation of water (Raichle et al., 1983).
Few previous studies have investigated functional changes in the setting of tumors. Using functional magnetic resonance imaging to study the blood oxygen level–dependent signal, Atlas and colleagues (1995) found a diminished signal in motor cortex during a motor task when the motor cortex was involved with tumor. However, their subjects had decreased motor performance and could not always perform the task reliably.
Previous intraoperative observations of red veins draining regions of cerebral lesions (Penfield, 1937; Feindel and Perot, 1965) led to the hypothesis that blood flow and metabolic relations may be altered in some pathologic conditions. Red veins are the consequence of blood flow to a region in excess of the oxygen requirements of the region, compared with neighboring regions. Feindel (1965) describes both “structural arteriovenous shunts” (associated with vascular malformations and many types of tumors) and “metabolic arteriovenous shunts” (associated with some cerebral lesions such as tumors or glial scars). In this latter case, “metabolic shunts” represent a change in the relation between blood flow and oxygen consumption, with regional blood flow delivering more oxygen than required for normal metabolism in the absence of an actual anatomical shunt.
The fact that an excessive vascular response to activation occurred in the area of a glial tumor raises the possibility that the cellular constituents of the tumor may have been important in determining this response. In this regard, a role for glial cells in the metabolic response to increased neuronal activity has been described (Tsacopoulos and Magestretti, 1996). These investigators have postulated that glutamate released during excitatory neural transmission is metabolized in adjacent glial cells. As a result, it has been hypothesized that glial cells account for much of the increased glucose consumption associated with neuronal activation. Additionally, it has been suggested that astrocytes are responsible for the regional regulation of blood flow (Magistretti, 1997; Tsacopoulos and Magistretti, 1996). Perhaps, in this patient, proliferating glial cells have increased sensitivity to the release, during behavioral tasks, of local excitatory neurotransmitters like glutamate. Abnormal expression of other agents, such as nitric oxide (Faraci and Brian, 1994), vasoactive intestinal peptide (Magistretti, 1997), or agents involved in ion or adenosine regulation (Villringer and Dirnagl, 1995) also could mediate an exaggerated blood flow response. It has been demonstrated that blood vessels associated with tumors can retain responsiveness to stimuli such as carbon dioxide (Robinson et al., 1995), and brain invaded by tumor has been reported to retain function in some instances (Skirboll et al., 1996; Ojemann et al., 1996).
Abnormalities of capillary architecture have been documented in the setting of intrinsic tumors (Long, 1970). Specific abnormalities of endothelial cells, including increased cellular vesicles and breakdown of the intercellular junction, contribute to the absence of a blood–brain barrier. Breakdown of the investing glia also has been described (Long, 1970). However, blood flow was not elevated in the region of the tumor (Fig. 2A). Even if the permeability to water were increased in the region of the tumor, tissue counts would not overestimate blood flow (Herscovitch et al., 1983; Raichle et al., 1983). Additionally, during normal activation, water appears to behave as a freely diffuseable tracer (Quarles et al., 1993). Thus, measurements of activation would not be greatly elevated because of alterations in the permeability of water.
Our findings have implications for clinical applications of functional imaging in patients with tumors. In many tasks, smaller blood flow changes are seen in various cortical areas separate from predominant changes. These changes sometimes are in the opposite hemisphere. For example, it is common to see smaller right inferior frontal changes, homologous to large left inferior frontal changes, during language tasks in left hemisphere–dominant patients without tumors (Binder et al., 1995; Cuenod et al., 1995; Desmond et al., 1995). If this phenomenon of enhanced blood flow activation around a tumor were to occur near such a right inferior frontal region, it would be possible for the right frontal response to exceed that on the left. In such a case, using the location of largest activation would lead to incorrect lateralization of language function.
CONCLUSION
Cerebral tumors may alter normal regional blood flow and metabolic relations. In the presence of a glial cell tumor, the normal blood flow response to local neuronal or synaptic activation was markedly enhanced. This provides convergent evidence that glial cell mechanisms may play an important role in regional blood flow responses during functional activation. These mechanisms may be altered in some pathologic conditions.