
Abstract
Using repeated positron emission tomography (PET) measures of regional cerebral counts, we investigated the regional cortical activations induced in eight normal subjects performing eight different frequencies of fingertapping (0.5–4 Hz) with the right index finger. The task was auditorially cued and the performance recorded during the scanning procedure. Performance evaluation showed increased error rates, during fingertapping, of high and low frequencies, and the best tapping performance was measured in the midrange of frequencies. Significantly activated areas (p < 0.05) of normalized cerebral counts were located in the left sensorimotor cortex (M1S1), right motor cortex, left thalamus, right insula, supplementary motor area (SMA), and bilaterally in the primary auditory cortex and the cerebellum. Statistical evaluation showed a significant (p < 0.01) and positive dependence of cerebral activation upon movement rate in the contralateral M1S1. There was no significant rate dependence of cerebral activation in other activated motor areas. The SMA and the right cerebellar hemisphere showed a more uniform activation throughout the tapping frequency range. Furthermore, we found a stimulus rate dependence of cerebral activation in the primary auditory cortex. We believe that the present data provide useful information for the preparation and interpretation of future motor activation studies of normal human subjects and may serve as reference points for studies of pathological conditions.
Keywords
The human motor system has been investigated during the last decades using functional brain imaging of regional cerebral blood flow (rCBF) as an in vivo measurement of localized synaptic activity (Olesen, 1971). Major interests in motor activation studies have been concerned with the primary sensorimotor cortex (M1S1), supplementary motor area (SMA), and the cerebellum. Some studies of the human motor system have focused on the functional organization and anatomical localization of voluntary movements (Grafton et al., 1991; Colebatch et al., 1991). Other studies have focused on the changes in rCBF using the complexity of the movement (Shibasaki et al., 1993; Deiber et al., 1991; Sabatini et al., 1993) or the frequency of the movement (Sabatini et al., 1993; Seitz et al., 1990) as a variable. Concerning the latter, results have shown a rate dependence of rCBF in human motor cortex. However, little effort has been made to thoroughly characterize this relationship during performance of simple motor tasks. Complexity of movement has been suggested to have an additional effect on the activation of the contralateral and ipsilateral M1/S1, as well as the SMA (Shibasaki et al., 1993). Regarding ipsilateral motor cortex activation, its presence is still a matter of controversy (Shibasaki et al., 1993; Kawashima et al., 1993; Roland et al., 1982; Sabatini et al., 1993). but parameters such as motor recruitment (Kim et al., 1993) and anatomical localization of the joint in terms of distance from body axis (Colebatch et al., 1991) seem to be determining factors for its statistical detection. The available evidence, therefore, suggests that several parameters affect the presence and extent of activation in cerebral motor areas. To enlighten some of these issues, we designed a simple auditory-paced and performance-controlled motor paradigm, with a fixed amplitude of movement and a predefined range of movement frequencies. Regional cerebral activation was measured using positron emission tomography (PET) and H215O in normal human subjects. The primary aim of the present study was to determine the relationship between the movement rate of a simple motor task and the activation of cerebral motor areas.
MATERIALS AND METHODS
Subjects
Eight healthy male volunteers (age range, 20–28 years) participated in the study. All subjects were strongly right-handed as assessed by the Edinburgh handedness inventory (Oldfield, 1971). None of the subjects had a history of neurologic or psychiatric disorders. Informed consent to participation was given by each subject according to the declaration of Helsinki II, and the study was approved by the Danish Central Scientific Ethical Committee (j.nr.c–1992–30).
Data collection
The PET tomograph was a GE-Advance whole body scanner (General Electric Medical Systems, Milwaukee, WI, U.S.A.), collecting 35 slices spaced by 4.25 mm through an axial field of view of 15.2 cm. This allowed sampling of the whole brain volume with a transaxial resolution of ∼5 mm (DeGrado et al., 1994). Images were reconstructed with an 8.5 mm Hanning filter and all slices were corrected for tissue attenuation, measured by an initial transmission scan.
Subjects were positioned parallel to the canto meatal (CM) line in the PET scanner and the head was fixed individually using molded head holders of expandable polystyrene foam.
Twelve studies were acquired for each subject, with 10–12 min interscan intervals. A bolus of ∼0.9 GBq (25 mCi) H215O was administered intravenously to the cubital vein of the left arm. Integrated counts were collected by the PET scanner for 90 s after bolus arrival to the brain.
Activation paradigm
The experimental condition consisted of fingertapping with the right index finger on the “space” key of a computer keyboard. Eight different frequencies, ranging from 0.5 to 4 Hz, with increments of 0.5 Hz were used; frequencies were randomized across scans in each subject. The amplitude of the movement was 3 mm. This distance was not measured for each tap, but the subject was instructed repeatedly to move the finger only as much as the key of the keyboard allowed, while maintaining physical contact with the key. It can be argued that the amplitude of movement tends to get smaller with increasing rate, although visual inspection did not reveal such a trend. During execution of the motor task, subjects did not report signs of physical exhaustion at any frequency. The task was cued by an amplified computer signal and the sound (500 Hz) was generated by a loudspeaker that was placed 1 m behind the scanner. Subjects were briefly trained and instructed before each scan. Activation started 30 s before injection and the pace signal was terminated 30 s after bolus arrival to the brain. The subject returned to a resting condition in order to optimize the signal-to-noise ratio during the activation task (Silbersweig et al., 1993). Performance was recorded by a regular personal computer via the computer keyboard.
Before and after the eight activated conditions, a baseline study was performed in which the subjects had their eyes closed, were lying motionless, and had no auditory input or motor activity. Two similar rest scans were obtained some days later while the same subjects were participating in a different motor activation experiment.
Image analysis
Image analysis was performed on a Hp Apollo 735 work-station using Statistical Parametric Mapping (SPM) software (MRC Cyclotron Unit, London, England). Calculations and image matrix manipulations were performed in MATLAB (Mathworks Inc. Sherborn MA, U.S.A.).
The 35 original contiguous 4.25-mm scan slices were interpolated to 59 planes to render the voxels approximately cubic. All images were aligned on a voxel-by-voxel basis using a three-dimensional (3-D) automated algorithm (AIR software) (Woods et al., 1992). The intercommisural (AC-PC) line was identified as previously described by Friston et al. (1989) and the volume transformed into the standard stereotactic space utilized in the atlas of Talairach and Tournoux (1988). Stereotactically normalized images comprised 26 planes of 2 times; 2 times; 4 mm voxels, corresponding to the horizontal sections in the atlas. Each image was smoothed with a Gaussian filter of 10 × 10 × 6 mm to increase the signal-to-noise ratio and accommodate normal variability in functional and gyral anatomy for group analysis.
The whole brain mean pixel count in each image volume was proportionally normalized to a value of 50, to obtain images of normalized cerebral counts (NC). Quantitative measurements of CBF were not used since the distribution image of NC was used as an indirect measurement of regional neural activity (Fox and Mintun, 1989). Further data analysis comprised two steps. First, SPM was used to identify the activated regions of interest (ROIs) in the motor task, by a pixel-by-pixel calculation of the t-value, SPM (t), at a threshold of p < 0.05, corrected for multiple nonindependent comparisons. SPM analysis was performed by comparing all movement conditions weighted for movement frequency, with the mean of the resting conditions. Contrasts [5, 10, 15, 20, 25, 30, 35, 40] and [–45, −45, −45, −45] were used for the activated and resting conditions, respectively. ROI values were selected using the peak coordinates of all significantly activated areas. Second, the relationship between movement frequency and physiological response was characterized using a post hoc analysis of the selected ROI values, as described below.
Statistical methods
For each subject, an individual regression line was calculated using the regional NC (rNC) of all significantly activated ROIs and the stimulus rate as the independent variable. Slopes of the eight individual regression lines were compared to zero using f-statistic (p < 0.01). If the Mests of the individual regression lines were significantly different from zero, it was concluded that there was a positive linear dependence between frequency and rNC (Matthews et al., 1990). To describe the regression line of the whole data set in each ROI, linear regression analysis on a mean of all values was used. (We note that because we weighted the condition means according to frequency in the SPM analysis, we were biased to find significant regressions in the post hoc analysis. However, since we had already established statistical significance, the linear regressions still served as useful and revealing characterizations of the responses.) Regression analysis was also performed using the error rate as the independent variable to test for a possible coupling between rNC and difficulty of the motor task.
When values were compared between the four rest conditions and one or more activated conditions, analysis of variance (ANOVA) for repeated measurements was used. The main effect of hemisphere and condition was evaluated using the same statistical approach, i.e., ANOVA, assessing the interaction term between areas of bilateral activation.
RESULTS
Cerebral areas with significant (p < 0.05) increase of rNC during the eight different motor tasks are listed in Table 1. Sagittal, coronal, and transverse projections of the SPM (t) are displayed in Fig. 1. Peak activated areas were located in the contralateral primary sensorimotor cortex, i.e., M1S1 (posterior part of the precentral gyrus), in the ipsilateral motor cortex (M1) (middle part of the precentral gyrus), bilaterally in the primary auditory cortex (A1) (transverse temporal gyri), bilaterally in the cerebellar hemispheres, SMA (paracentral lobulus), left thalamus, and right insular cortex.
Foci of significant a change in rNC
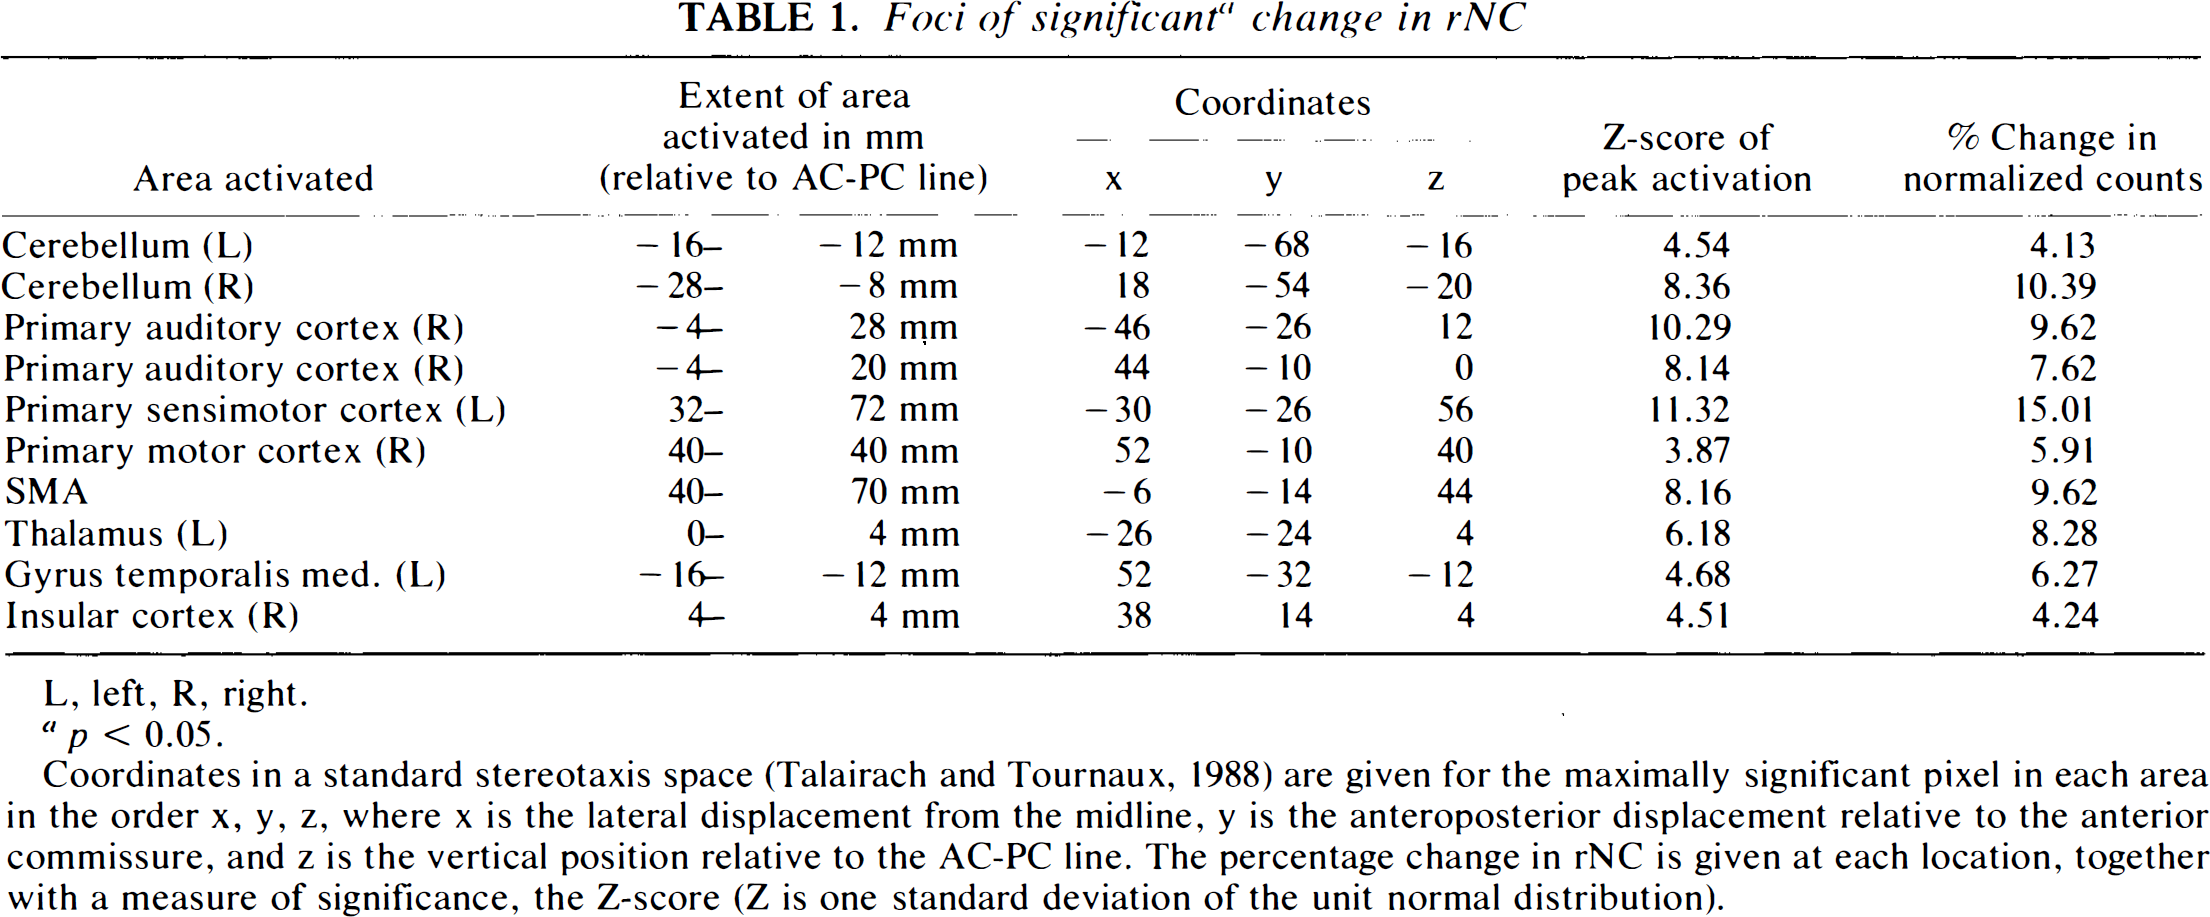
L, left, R, right.
p < 0.05.
Coordinates in a standard stereotaxis space (Talairach and Tournaux, 1988) are given for the maximally significant pixel in each area in the order x, y, z, where × is the lateral displacement from the midline, y is the anteroposterior displacement relative to the anterior commissure, and z is the vertical position relative to the AC-PC line. The percentage change in rNC is given at each location, together with a measure of significance, the Z-score (Z is one standard deviation of the unit normal distribution).
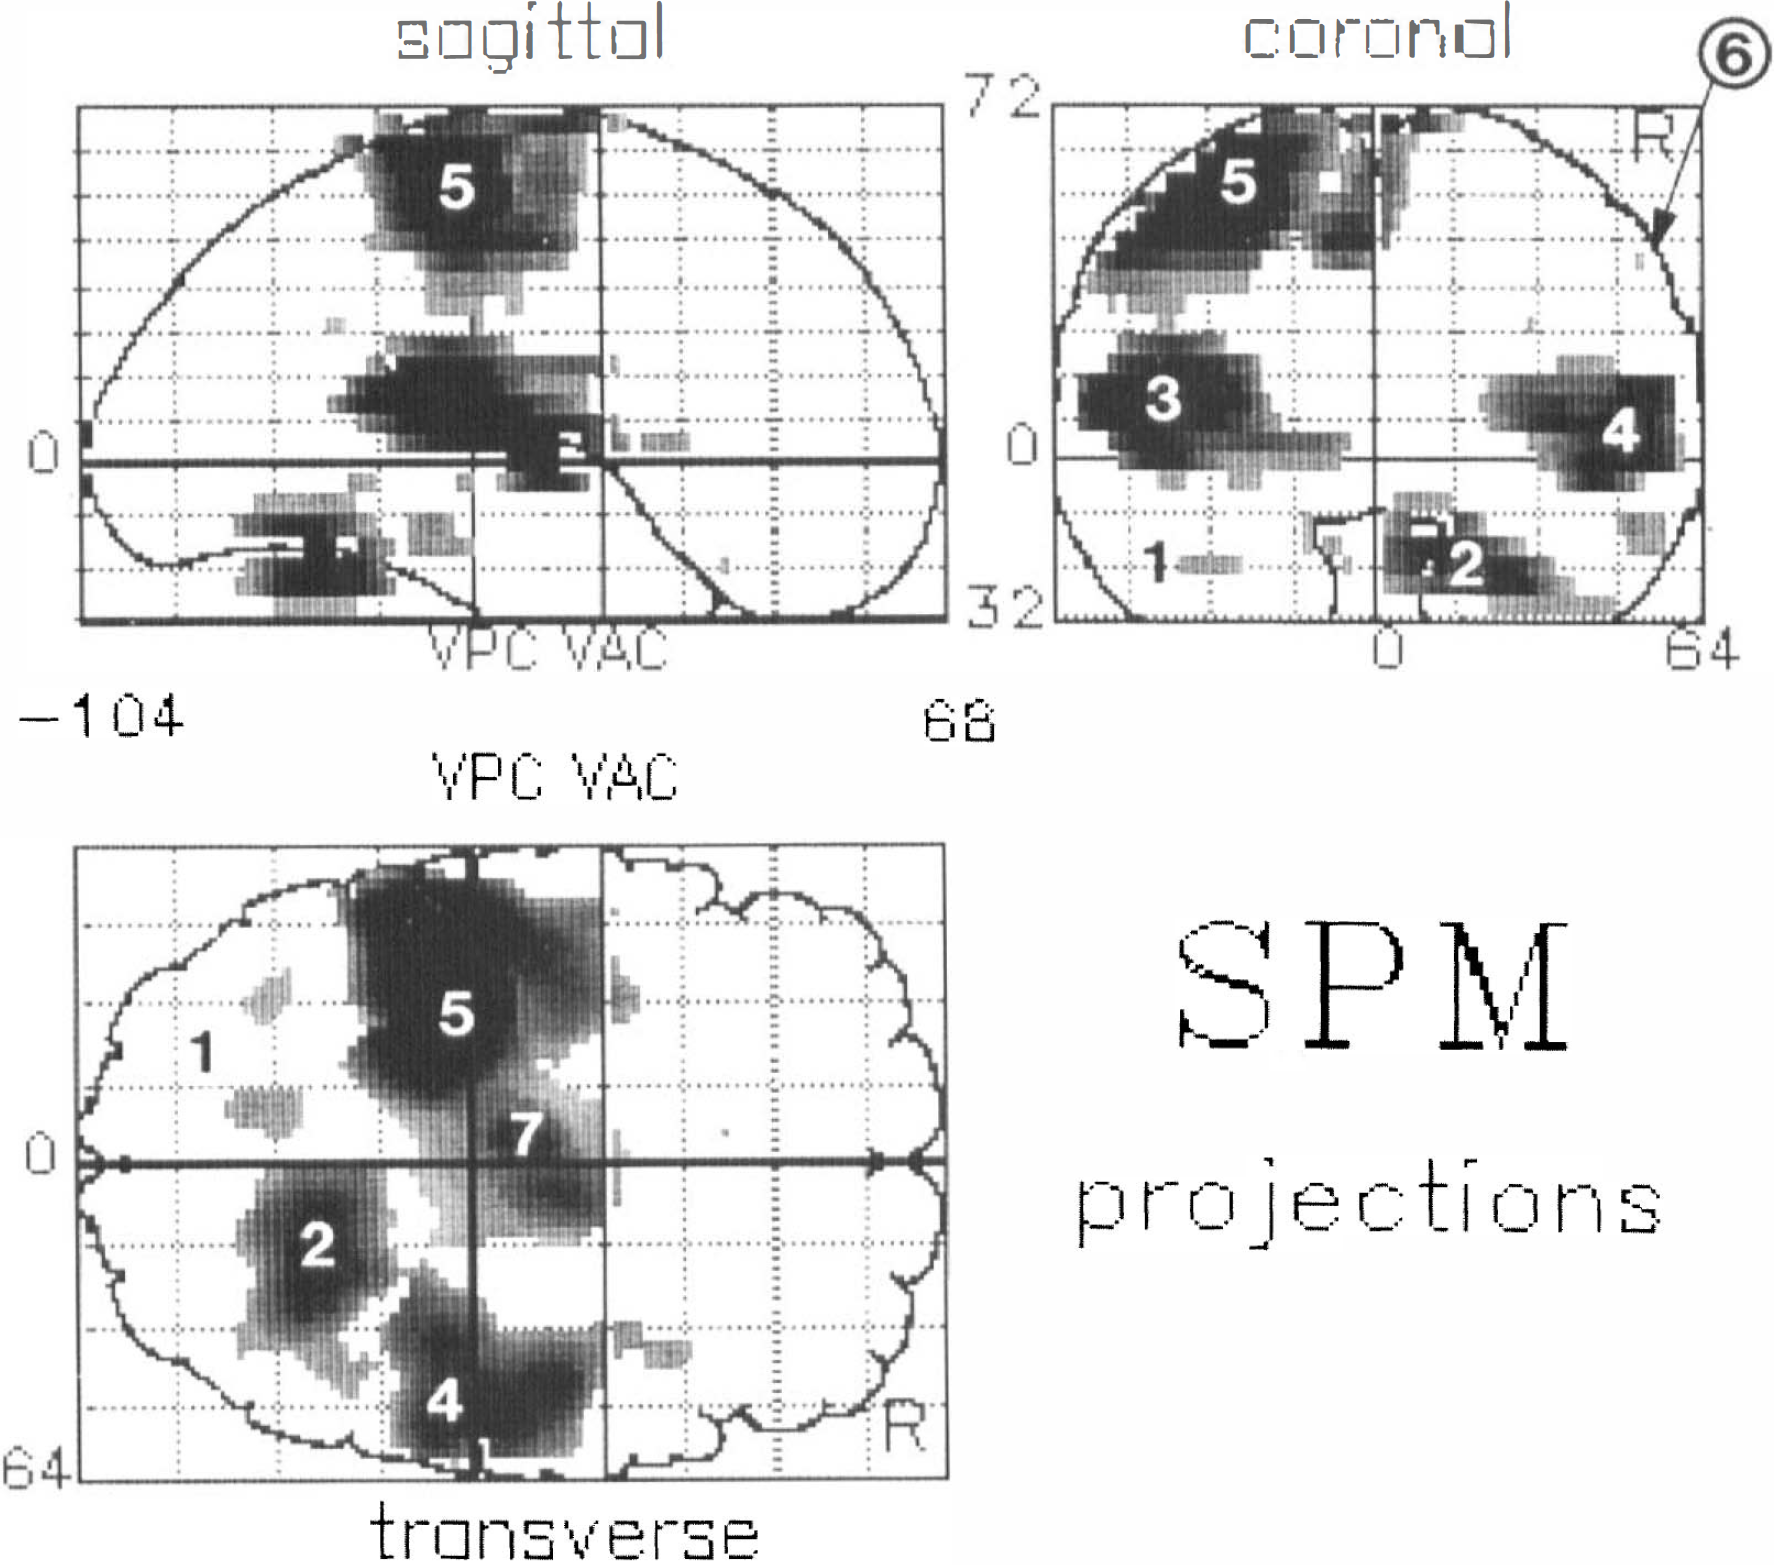
Statistical parametric map (SPM) of orthogonal projections showing the comparison between the mean of all movement conditions weighted for movement frequency and the mean of the resting conditions. SPM projections correspond to the stereotactic grid of Talairach and Tournaux (1988). VPC and VAC denote the vertical projections of the anterior and the posterior commissurals, respectively. 1, left cerebellum; 2, right cerebellum; 3, left auditory cortex; 4, rigiht auditory cortex; 5, left sensorimotor cortex; 6, right motor cortex; 7, supplementary motor area.
In the bilaterally activated areas, post hoc statistical evaluation showed a significant (p < 0.01) interaction of hemisphere versus condition for cerebellum as well as A1. The activation response was significantly larger in the right cerebellar hemisphere compared to the left, and the opposite was true for A1.
The performance of the motor task was evaluated using the actual tapping frequency and error rate as parameters. Actual tapping frequency (Table 2), which is the average tapping frequency performed by the subjects, had the largest deviation (>0.03 Hz) from the cue during performance of the high frequencies. In addition, the standard deviation of the fingertapping was high in this and the low frequency range. The lowest standard deviation and the lowest deviation from the actual tapping frequency were seen in the mid frequency range, as an indicator of accurate performance. The error rate is shown in Fig. 2. An error was defined as a deviating number of taps compared to the number of cues given during the scanning procedure (acquisition of the cerebral counts). Halfan interval, Δt/2, on each side of the cue was used for registration of taps. If there were no taps during this interval it was considered to be an error (missing tap), and if there were more than one tap, each was considered to be an error (excess tap). Subjects had a high total average error ratio (number of errors divided by total number of taps) of ∼7% during fingertapping at 0.5 Hz (Fig. 2) and ∼4% at 4 Hz. Lowest values were recorded in the midfrequency tapping range (1–2%). Performance data showed a considerable intersubject variance throughout the frequency range. Figure 3 shows changes in normalized cerebral counts during performance of the motor task. The response function of left M1/S1 has a mean value of 57.9 rNC during performance at 0.5 Hz, which increases to 62.4 rNC during performance at 4 Hz. There is a significant dependence of rNC to frequency (p < 0.01) (Table 3), and the slope of the regression line is 1.08 (p < 0.01). The response function of the SMA (Fig. 3B) peaks primarily at 1 Hz to a mean value of 60.1 rNC, then decreases to lower, but still significant, activated values compared with those at rest. At 4 Hz, activation peaks to a value of 62.5 rNC. The slope of the mean regression line is not significantly different from zero (p > 0.05) (Table 3), with no statistically significant dependence of rNC to movement rate. Figures 3D and E show similar results for the right cerebellar hemisphere and M1, with no significant rate dependence upon frequency. Figure 3C shows the stimulus rate dependence of the left primary auditory cortex. There is a significant dependence of rNC upon frequency (p < 0.01), and the slope of the mean regression line is 1.13 (p < 0.01). In all figures, a level of significance is indicated next to the measurement, which is the result of ANOVA calculations. Looking at Fig. 3 gives the impression of a tendency towards a considerable relative increase of rNC during execution of 4 Hz tapping compared to the rest of the frequency range (A1 excepted). The result of an exclusion of the 4 Hz frequency from the regression analysis is shown in Table 3. It is clear that the slopes of the regression lines tend to approach zero, except for A1, while the significance level of the regression line remains relatively unchanged.
Means of actual tapping frequencies with SD
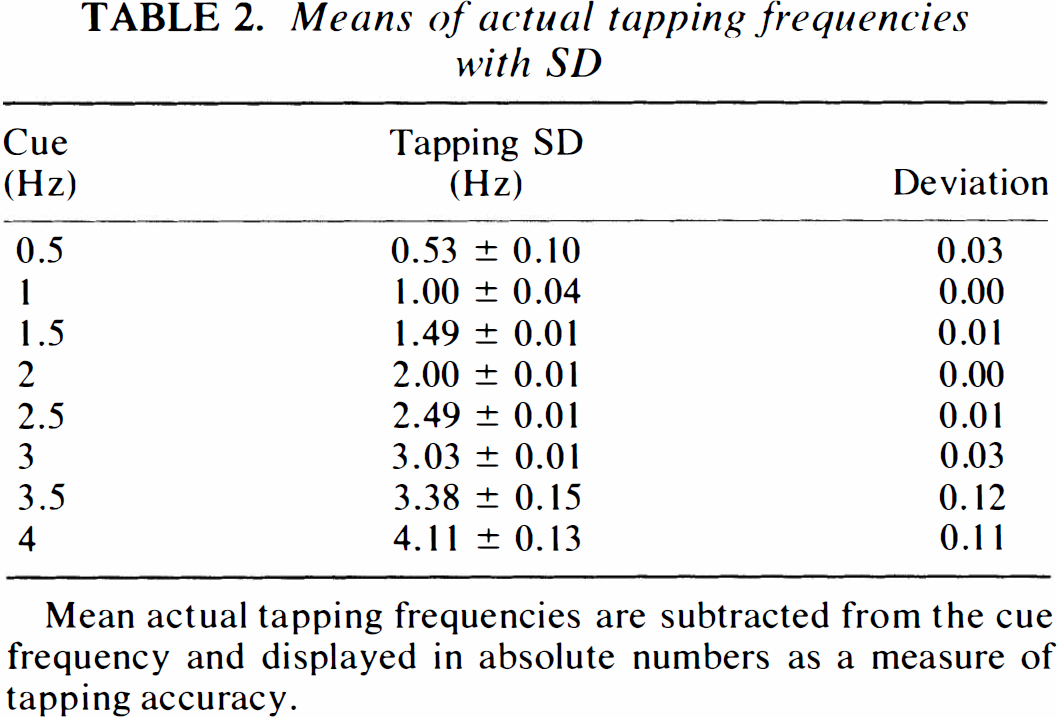
Mean actual tapping frequencies are subtracted from the cue frequency and displayed in absolute numbers as a measure of tapping accuracy.
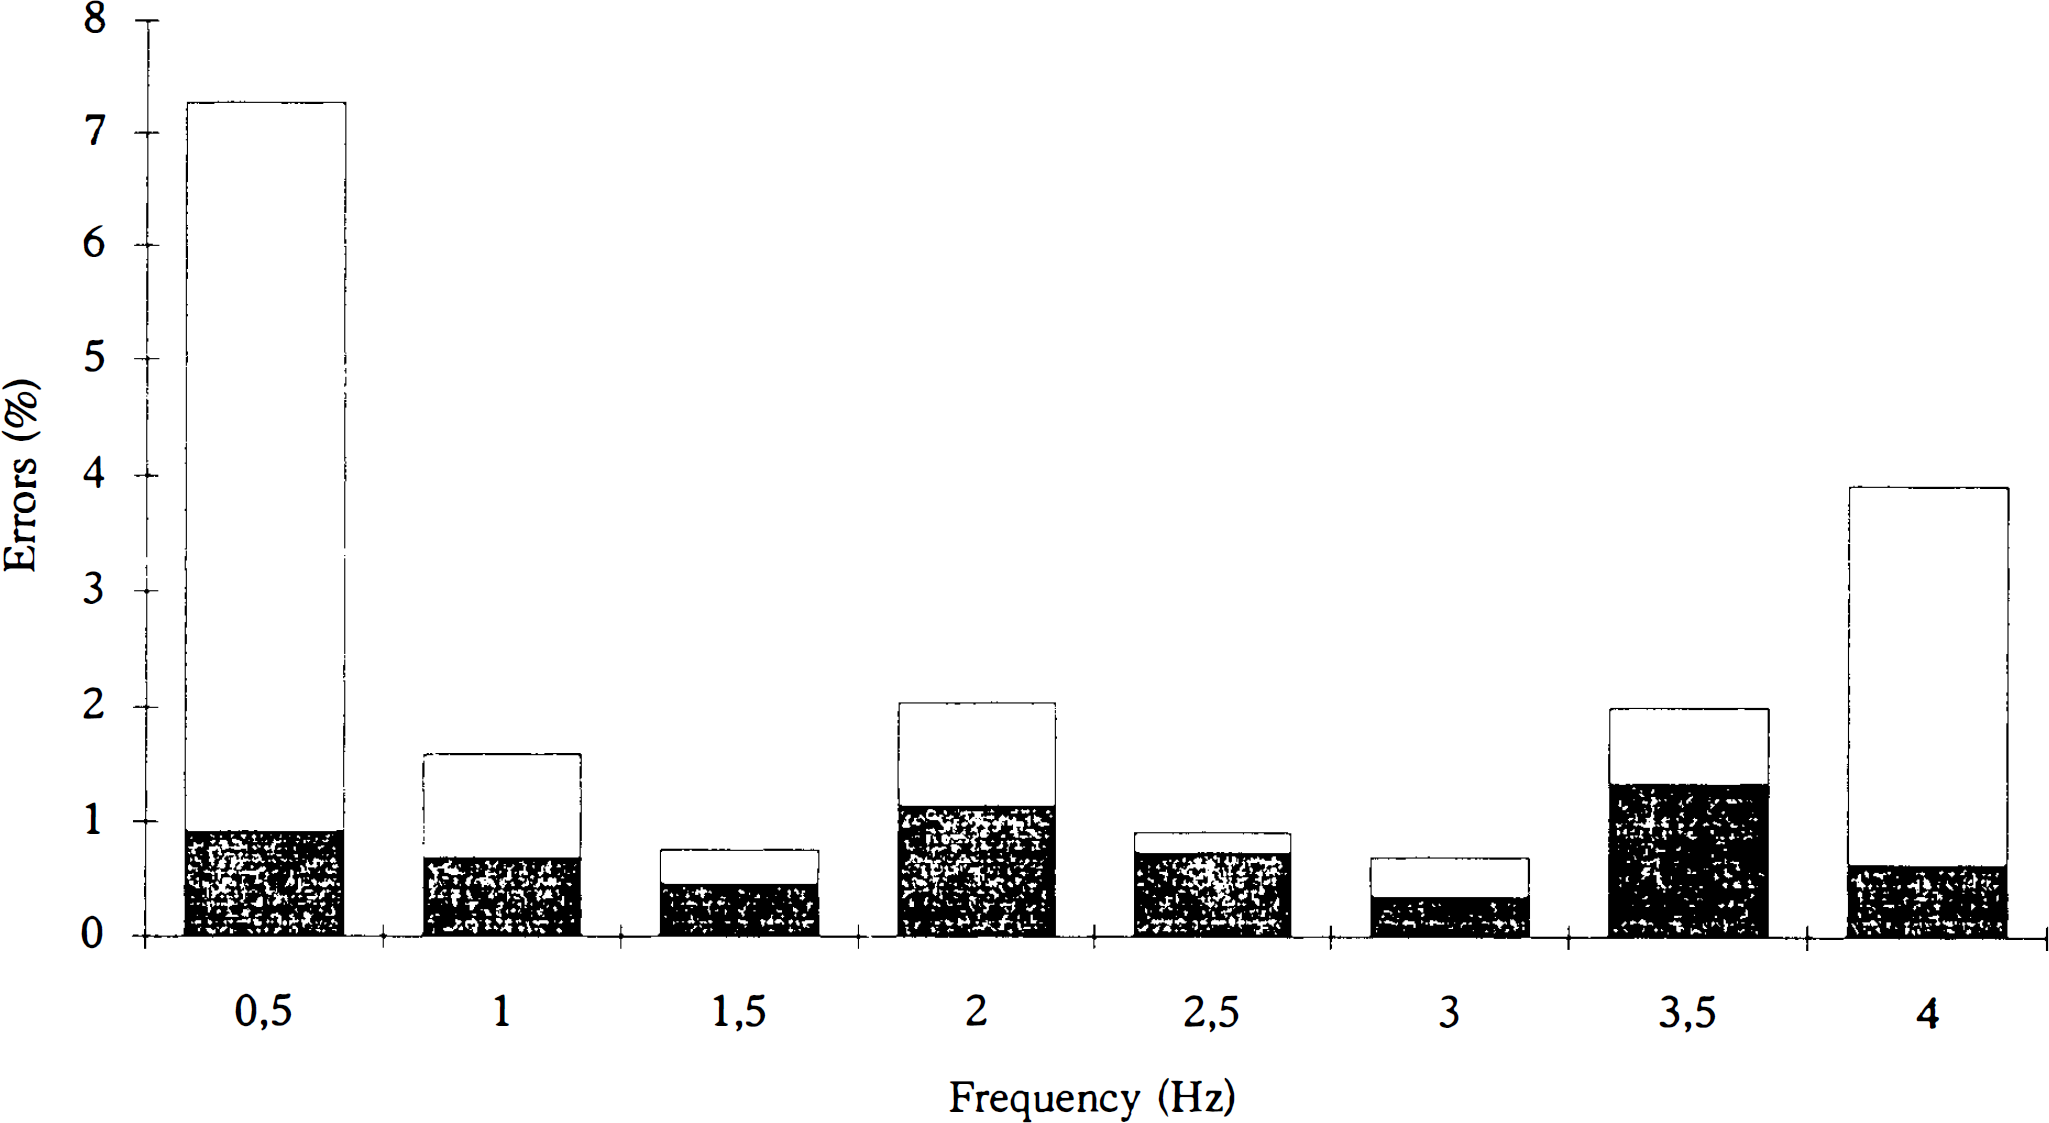
Average error rate of fingertapping is shown as a percentage of the total number of taps during performance at the different frequencies. Bottom bars (shaded) show the number of missing taps; top bars (white) show the number of excess taps.
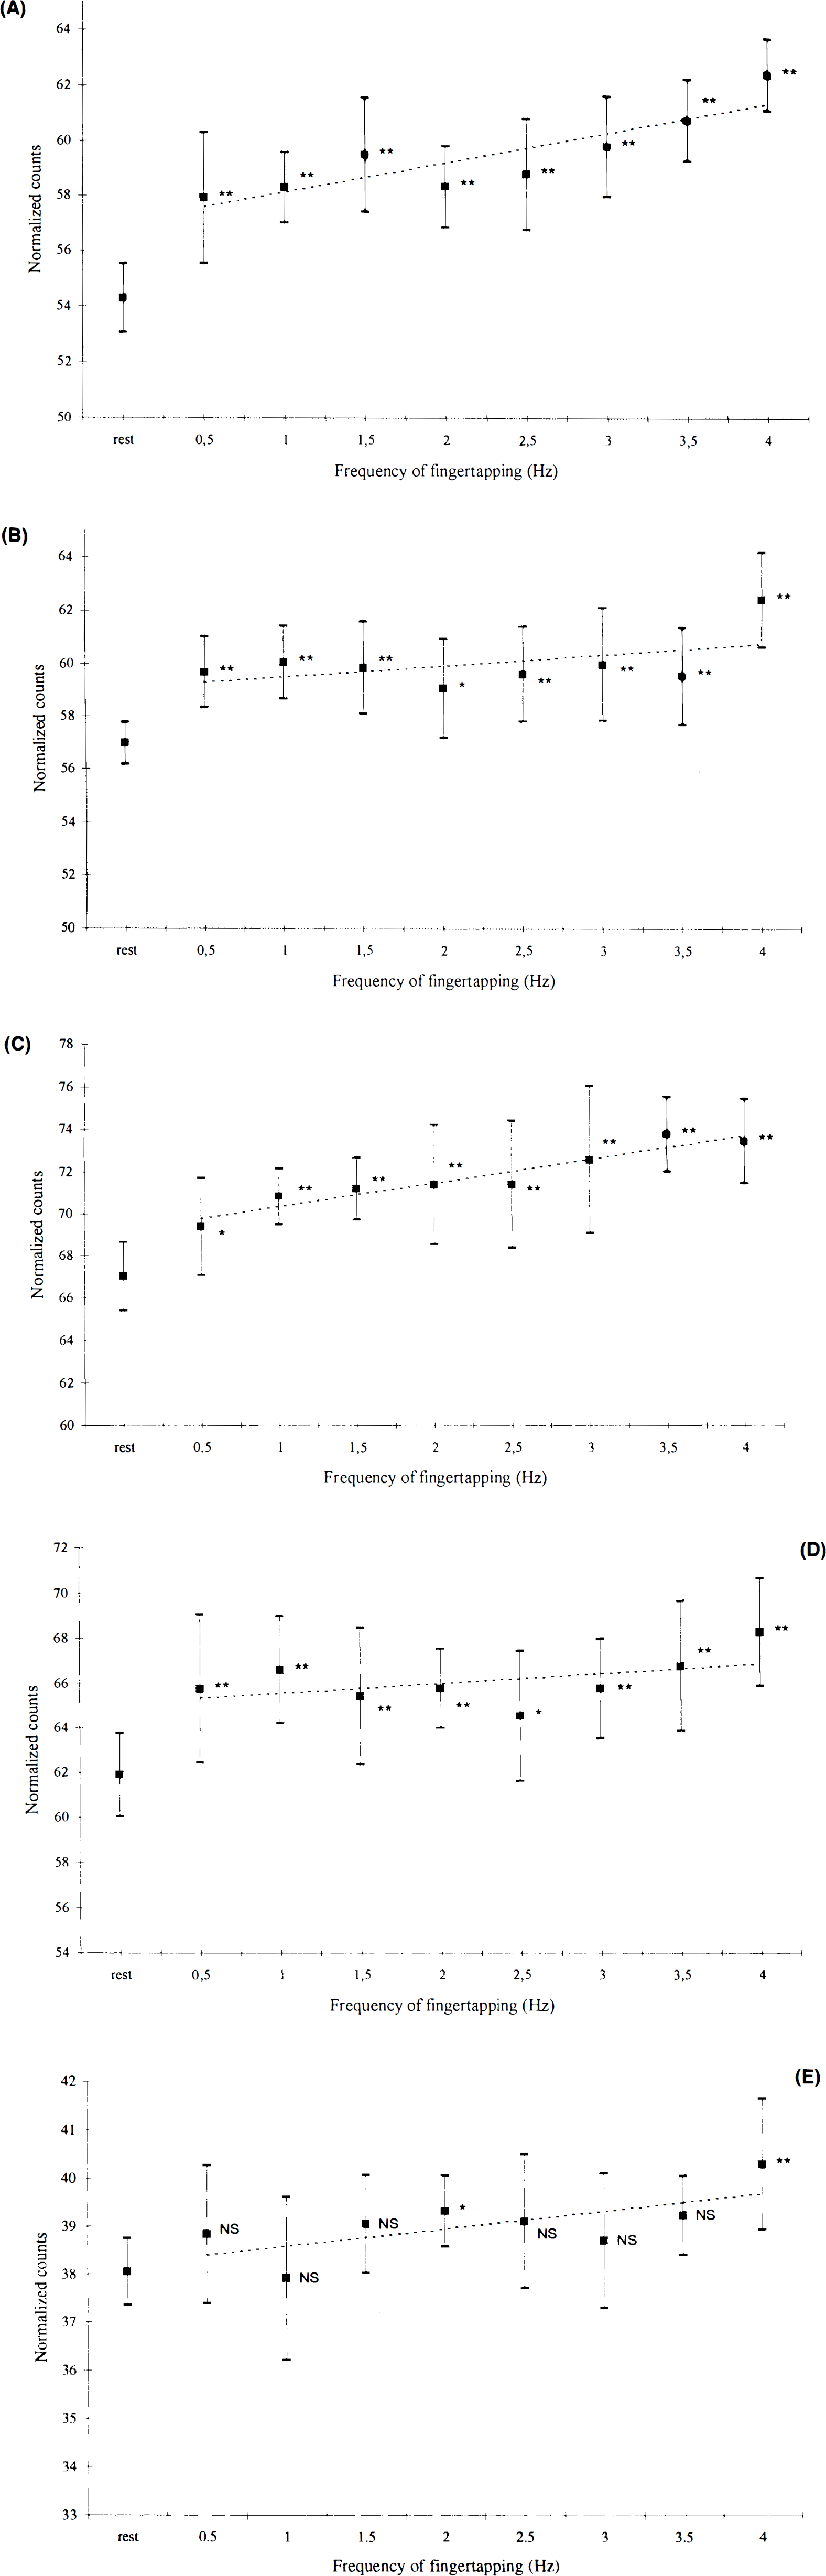
Response functions showing measurements of normalized cerebral counts versus frequency of fingertapping (with SD) in
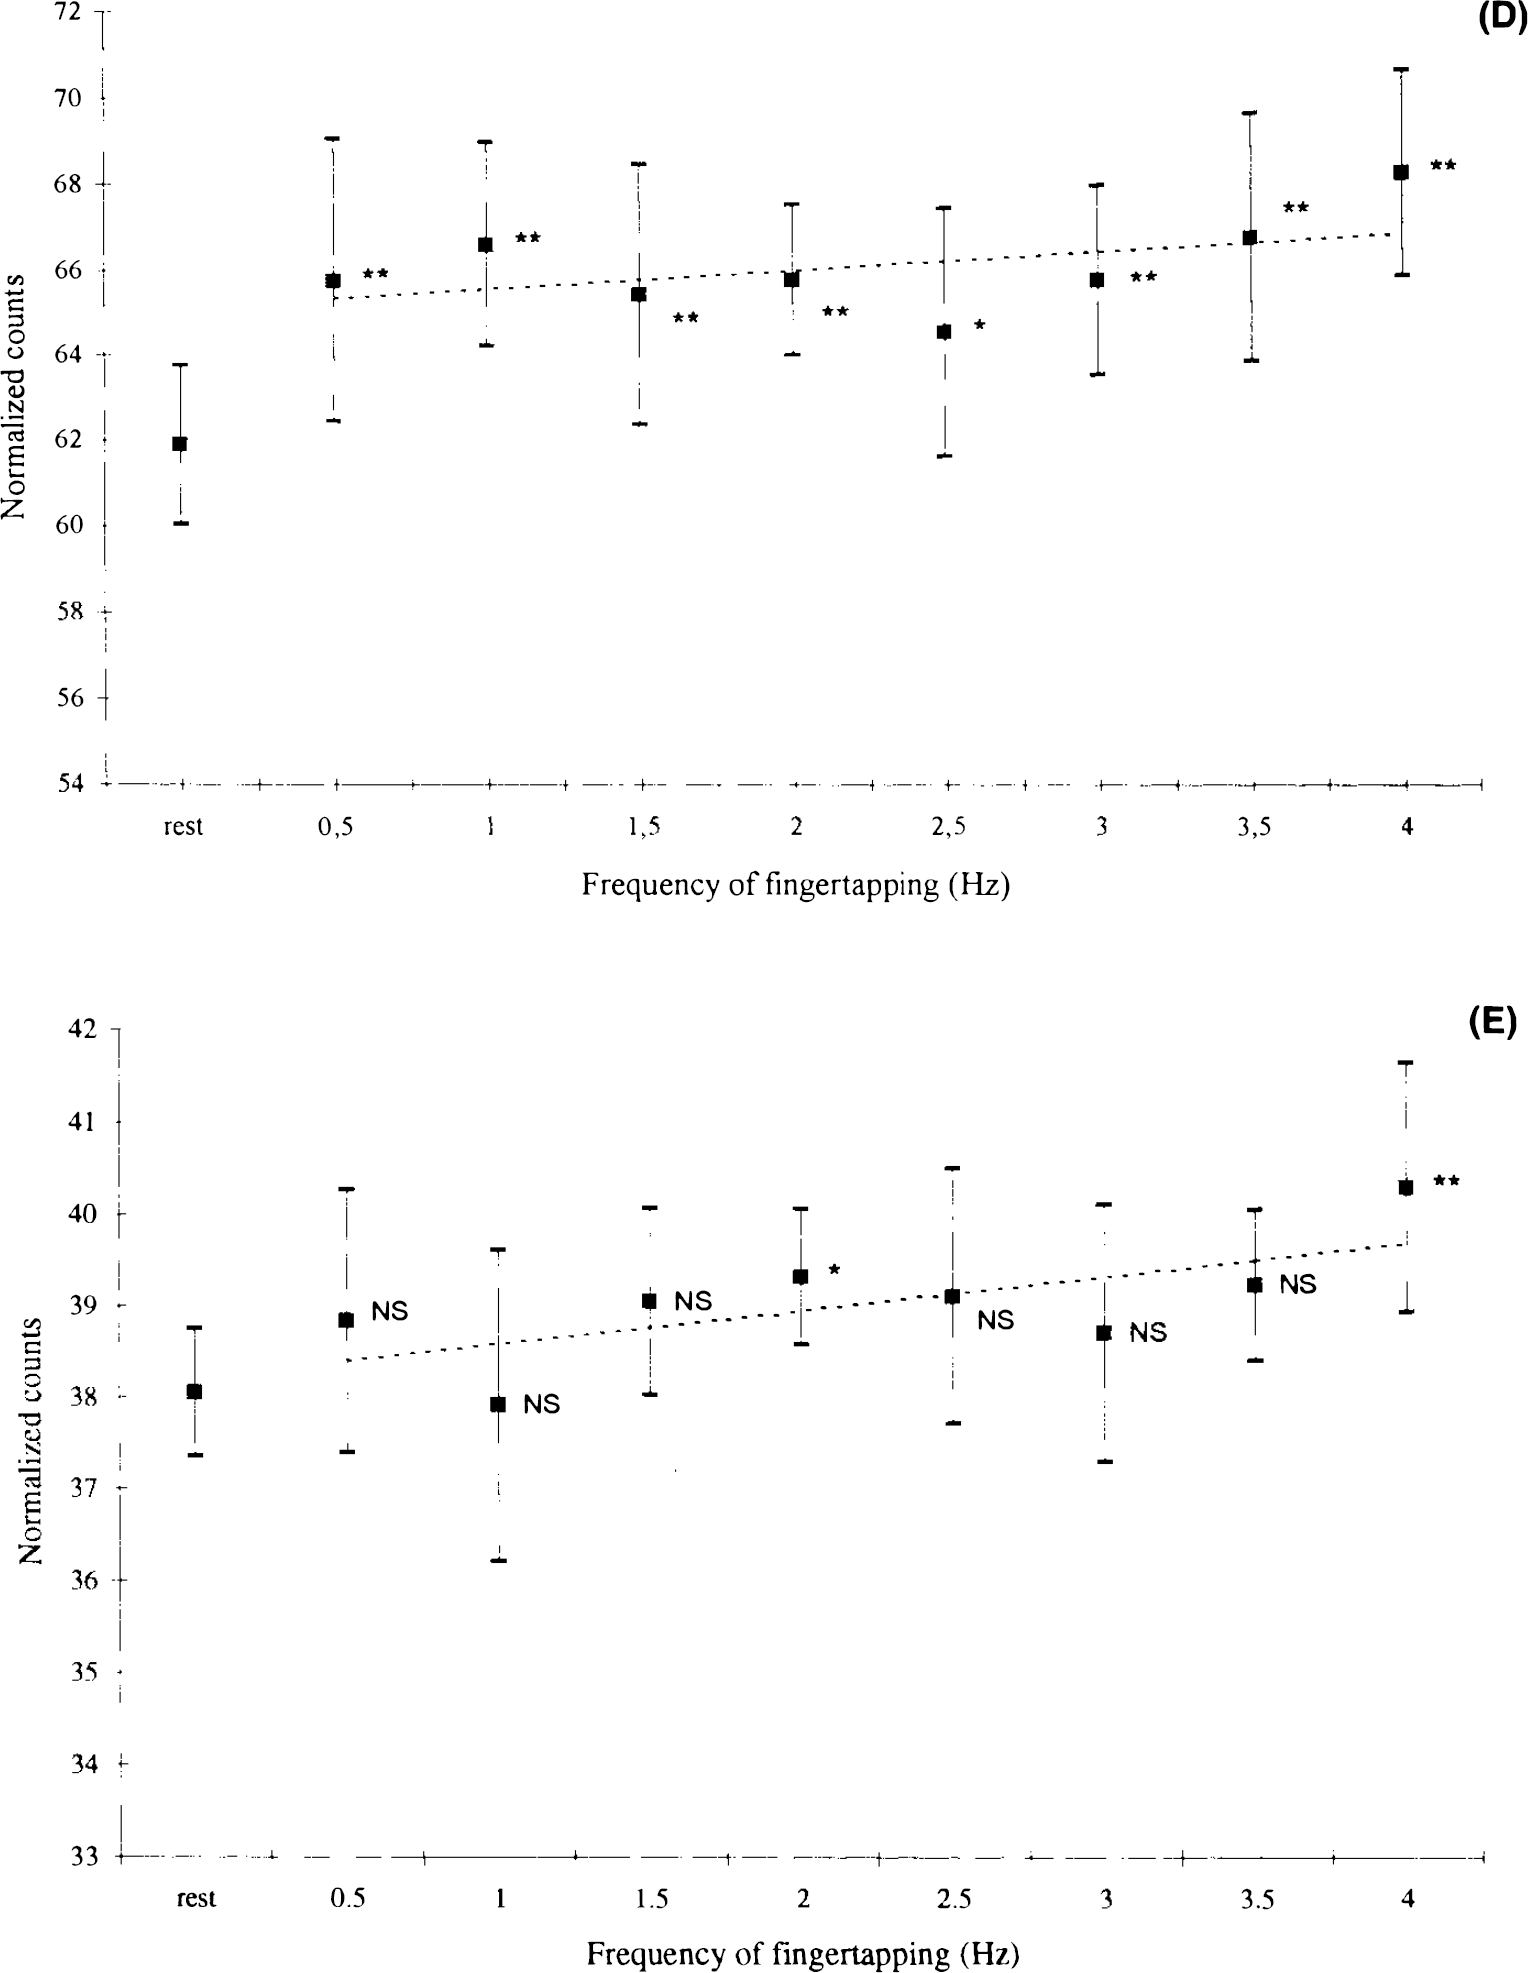
and
Regression analysis of rNC and error rate was not statistically significant in any of the motor areas; this could be due to the variability in the performance data. A larger sample size would have been preferable in order to obtain a more reliable statistical evaluation. The following discussion will, therefore, be descriptive in relation to the issue of a possible coupling between rNC and performance of the motor task.
DISCUSSION
The five areas of major interest—left M1S1, SMA, A1, M1, and cerebellum—will be discussed below.
M1/S1
Present data show a movement rate dependence of the rNC in M1S1. Former PET studies have proven that stimulus rate is a significant determinant of the rCBF response in primary perceptive cortices (Fox and Raichle, 1984; Wise et al., 1991; Price et al., 1992), but little effort has been made to characterize the effect of movement rate on cerebral motor activation. In animals, a rat study (Collins et al., 1986) showed increasing metabolic response to electric motor cortex stimulation rate in the range of 0.25–3 Hz. Emission tomography studies in humans, using two different frequencies of finger movement (Seitz et al., 1990; Sabatini et al., 1993), have shown that CBF in M1/S1 depends on rate and amplitude. Our experiment showed that cortical rNC increases as a linear function of movement temporal frequency between 0.5–4 Hz (Fig. 3A). A descriptive approach would argue that the curve has a sigmoid shape with a plateau in the range of 2–2.5 Hz. It has been suggested that complexity of movement has a marked effect on rCBF change in M1S1. Shibasaki et al. (1993) found an increased activation of M1S1 when the complexity of a finger movement (as the only parameter) was increased that was believed to reflect an increased demand for motor control. Our performance evaluation showed an increase in difficulty of the task in the high and low range of frequencies. In the high range, the cue is fast, and it is hard for the subject to keep the pace; in the low range, it is difficult to time the tapping correctly. In the midrange of frequencies, the subject relies on a more automatic and easier generation of motor performance. The characteristic shape of the response function (Fig. 3A) could, therefore, reflect an increased demand for motor control in the high and low movement frequency ranges, as was suggested by Shibasaki et al. (1993). Our data show that activation of the primary motor area probably depends on the difficulty as well as the movement rate of the motor task. We suggest that there is an optimum movement frequency at ∼2–2.5 Hz, reflecting a less complicated neural composition of the motor task during execution of more trivial motor procedures. An important error source is recruitment of different or additional muscles during execution of slow and fast tapping which was not observed during the experiment. The use of electromyography (EMG) would have been a proper way of monitoring the subjects.
SMA
The role of the SMA has been a matter of controversy in motor activation studies. Early studies in humans (Lassen et al., 1977; Ingvar and Philipson, 1977) proved that the SMA participates in the organization of movement sequencing and planning. Roland et al. (1980) showed that the activation of the SMA is related to complexity, an observation that has also been reported by other authors (Kawashima et al., 1993; Deiber et al., 1991; Grafton et al., 1991; Shibasaki et al., 1993; Ráo et al., 1993). Some reports have shown contradictory results (Colebatch et al., 1991; Sabatini et al., 1993; Matelli et al., 1993), the diversity of which is confusing and may be as result of differences in paradigms and varying performance controls. We found no rate dependence of cerebral activation in the SMA, but a slight decrease of the response function during automatic behavior in the midfrequency tapping range (Fig. 3B). Animal studies (Aizawa et al., 1991) have shown that overlearning of a simple motor task gradually decreases the activity of SMA neurons, while a subsequent lesion in the M1 causes a reactivation of the same cells. We suggest that the activation of the SMA is dependent on qualitative aspects of the movement, such as the difficulty or complexity rather than frequency, and that this effect is reflected in our results. It must, however, be emphasized that we were not able to detect this coupling statistically. Our findings could explain why different investigators obtain different results regarding the role of the SMA in fast versus slow or complex versus simple repetitive movements. Furthermore, our findings underline the need for paradigm control and uniformity in motor activation studies with regard to frequency of movement, complexity, and amplitude, if a comparison is to be made between studies of different research centers.
A1
In the left primary auditory cortex (Fig. 3C), we found a significant auditory stimulus rate dependence of rNC. The A1 of the right hemisphere is significantly less activated than that of the left, probably due to a facilitation effect in the active left hemisphere. Our results support the findings of Wise et al. (1991), who reported a significant positive correlation between different frequencies (0.5–1 Hz) of word presentation and rCBF. We found a stronger association between stimulus and activation, presumably the result of a more strict paradigm using electronically generated sounds and a safer conduction of the stimulus (regarding sound volume) interval between the cues, etc. A recent functional magnetic resonance imaging (MRI) study (Binder et al., 1994), using presentation of syllables in the frequency range of 0.17–2.50 Hz as the auditory stimulus, showed an exponentially decaying, nonlinear relationship between increasing stimulus rate and A1 activation. In our measurements, mean values have a close relationship to the regression line, with a slight sigmoid deviation form linearity. Looking at the interval from 0.5 to 2 Hz (Fig. 3C), the response function could be described as decaying exponentially, while including the rest of the interval clearly argues against this relationship. Our measurements show quite large standard deviations that weaken the arguments of the discussion, but it seems that there could be merging conclusions from the two experiments, explained by the differences between stimulus ranges alone. A comparison of the same paradigm using PET and functional MRI would be interesting in this context.
M1
The physiological basis for ipsilateral motor activation has been thoroughly described by Kawashima et al. (1993), who found ipsilateral motor activation when subjects were using the nondominant hand. Other authors have related the presence of ipsilateral motor activation to complexity of movement (Shibasaki et al., 1993; Ráo et al., 1993) or to movement of more axial limbs (Colebatch et al., 1991); a functional MRI study (Kim et al., 1993) showed that ipsilateral activation is always present, but reduced by a factor of 20, compared to the contralateral hemisphere. We found a small activation of the M1 that is only significantly present during fast motor performance (Fig. 3E). The entire activated area is located in the middle of the precentral gyrus, in the transition zone between the primary motor area and the premotor area, more rostral and lower compared to the contralateral M1S1. There is no activation of sensory cortex, which clearly underlines the neural selection of the activation. According to the human motor homunculus, the region is located between the digit and the face representation areas. Animal studies in monkeys (Aizawa et al., 1990) have shown a similar localization of M1 activation, which is a physiological phenomenon that is poorly understood. Conclusions regarding rate dependence seem dubious since the increment of the activation is small, reducing the sensitivity of the post hoc regression analysis. We can only conclude that ipsilateral motor activation is present during performance of simple distal limb movement. Regarding sources of error, visual inspection of subjects during the experiment did not reveal co-movement of the left arm, although this was not electrophysiologically controlled.
Cerebellum
It is well known that the cerebellum is ipsilaterally activated in the execution of human motor performance. Activation studies using two movement frequencies have shown no rate dependence (Seitz et al., 1990), but performance and training effects have been shown to decrease cerebellar activation (Jenkins et al., 1994; Friston et al., 1992). It is well known that learning a new motor sequence normally seems difficult in the beginning, while training shifts the behavior to a more automatic execution. In our experiments, there was only a brief introduction to the rate of the different tapping frequencies, and automatic and good performance was in the midfrequency range. PET data reflect this pattern (Fig. 3D), with a relative decrease of activation in the midfrequency range. There was no movement rate dependence (Table 3); this indicates a more central and nonfrequency-dependent role of the cerebe Ilum in the processing of sensorimotor input. The possible coupling of PET and performance evaluation data support the hypothesis of performance-dependent ipsilateral cerebellar activation, although we were not able to detect such an effect statistically. Furthermore, we find a smaller sized and significantly less activated area in the upper part of the left cerebellar hemisphere (Table 1). Bilateral cerebellar activation during performance of unilateral motor tasks has been reported by other authors (Friston et al., 1992; Shibasaki et al., 1993); however, further discussion of this issue is, unfortunately, not within the limits of the present report. We believe that the present data provide useful information for the planning and interpretation of future motor activation experiments regarding rate of execution and difficulty of task. The importance of a reliable performance control is also emphasized in this report. Our experiments can serve as possible references for studies of pathological conditions, in the attempt to describe and understand the consequences of focal or diffuse lesions on cerebral activation.
Slopes and significant thresholds for activated areas
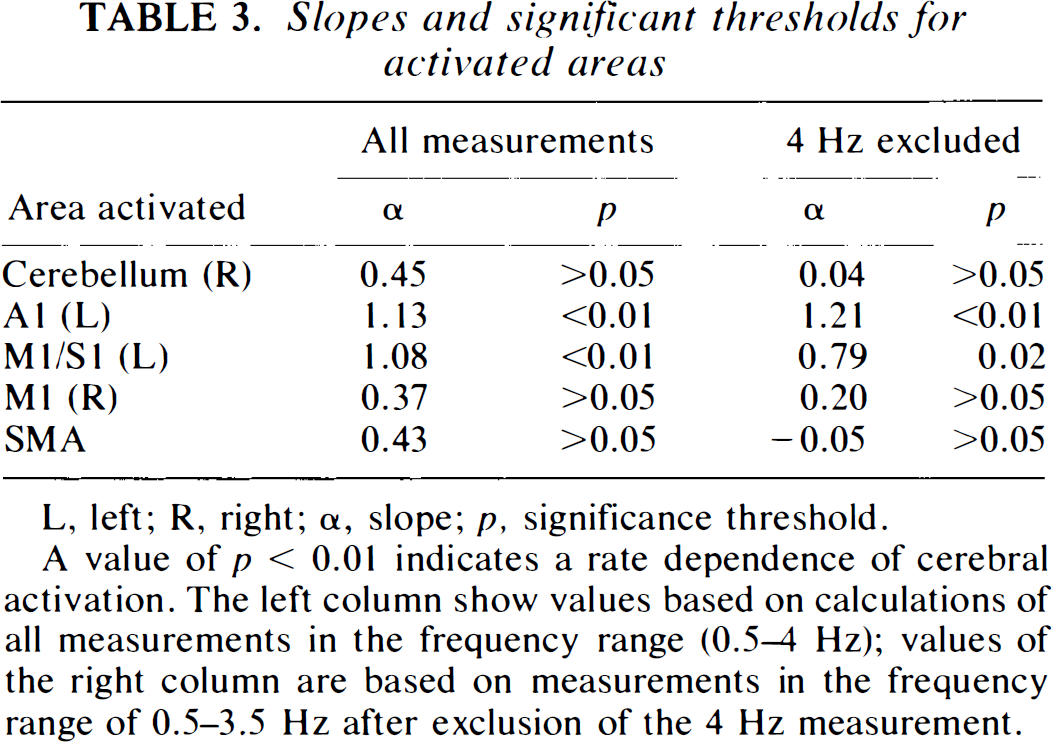
L, left; R, right; a, slope; p, significance threshold.
A value of p < 0.01 indicates a rate dependence of cerebral activation. The left column show values based on calculations of all measurements in the frequency range (0.5–4 Hz); values of the right column are based on measurements in the frequency range of 0.5–3.5 Hz after exclusion of the 4 Hz measurement.
Footnotes
Acknowledgment:
The study was aided with a grant from the Alfred Benzons Fond, Kong Christian IX og Dronning Louises Jubilasumslegat, Lily Benthine Lunds Fond, Fondet for Dansk-Norsk Samarbejde, and Laege-foreningens Forskningsfond/Wacherhausens legat. We wish to thank Karin Stahr for technical assistance during the experimental procedures.