
Abstract
Positron emission tomography studies have identified a common set of brain regions activated by pain. No studies, however, have quantitatively examined pain-induced CBF changes. To better characterize CBF during pain, 14 subjects received positron emission tomography scans during rest, during capsaicin-evoked pain (250 μg, intradermal injection), and during innocuous vibration. Using the H215O intravenous bolus method with arterial blood sampling, global CBF changes were assessed quantitatively. Painful stimulation produced a 22.8% decrease in global CBF from resting levels (P < 0.0005). This decrease was not accounted for by arterial PCO2 or heart rate changes. Although the exact mechanism remains to be determined, this pain-induced global decrease represents a previously unidentified response of CBF.
Global CBF generally is thought to remain stable during normal physiologic conditions (Lassen, 1959). This stability is actively maintained by an autoregulatory process that constricts or dilates the cerebral vasculature to compensate for changes in peripheral blood pressure. The autoregulatory mechanism is capable of maintaining stable CBF over perfusion pressures ranging from approximately 60 to 150 mm Hg (Lassen, 1959; Harper, 1966; Paulson et al., 1990).
Global CBF does not, however, remain constant across all conditions. Deviations in arterial partial pressure of carbon dioxide (P
Painful stimulation generally elicits sympathetic activation and both cardiac and respiratory changes. Positron emission tomography (PET) studies of CBF changes during acute pain have not been fully quantitative and have not addressed the possibility that significant global CBF changes may occur (Talbot et al., 1991; Jones et al., 1991; Casey et al., 1994; Coghill et al., 1994; Derbyshire et al., 1994; Casey et al., 1996; Craig et al., 1996; Vogt et al., 1996; Hsieh et al., 1996; Iadarola et al., 1997; Adler et al., 1997). The current study sought to better characterize global CBF changes during somatosensory stimulation and to determine whether painful stimuli are selectively involved in these changes. A preliminary report of these data has been presented (Coghill et al., 1995); regional blood flow changes observed during these experiments will be reported separately.
METHODS
Subjects
Fourteen normal volunteers (4 women, 10 men) participated in all phases of these experiments. Subjects ranged in age from 23 to 47 years (mean ± SD, 29.6 ± 6.22) and were healthy, pain-free, and had no detectable magnetic resonance imaging abnormalities. Pregnancy tests were performed on all female subjects of childbearing potential. All procedures were approved by the Institutional Review Board of the National Institute of Dental Research and the Radiation Safety Committee of the National Institutes of Health. All volunteers gave written, informed consent acknowledging 1) that they would receive radioactive tracers, 2) that they would experience experimental pain stimuli, 3) that all methods and procedures were clearly explained, and 4) that they were free to withdraw from the experiment at any time.
Stimulation
Subjects were scanned during rest (REST), vibrotactile stimulation (VIBE), capsaicin-evoked pain (CAP), and during the waning period of capsaicin-evoked pain (WANE). The rest state consisted of subjects lying still in the scanner with no somatosensory stimulation provided. Vibrotactile stimulation was provided by 83-Hz vibration (Panasonic, Japan) of the lateral upper right arm. This stimulus was alternated among three contiguous 13.5-mm2 areas (5-second stimulation/5-second interval) to avoid habituation (Coghill et al., 1994). For painful stimulation, capsaicin (the active ingredient of chili peppers) was injected intradermally (250 μg in 25-μL vehicle) into the skin of the same area. This stimulus produces a severe burning or stinging pain immediately after injection (Simone et al., 1989). After several minutes, the burning pain gradually subsides and disappears in approximately 60 to 90 minutes. Subjects were scanned both immediately after capsaicin injection, and 12 minutes later while pain was waning.
A minimum of 1 day before the PET scans, subjects participated in a training session in which they received a standard series of heat pulses to give them experience rating pain intensity using a numerical scale (integers from 0 to 20) anchored with verbal descriptors (Coghill et al., 1993; Coghill and Gracely, 1996). After the heat training session, vibrotactile and capsaicin stimuli were applied to the subjects' left arms to familiarize them with the stimuli to be used during the scans.
Positron emission tomography scans
Before PET scanning, catheters were placed in the subjects' left radial arteries and right antecubital veins. To minimize possible pain arising from these areas, both catheter sites were superficially anesthetized with topical lidocaine/prilocaine (2.5%/2.5%) cream (EMLA, Astra Pharmaceuticals, Södertälje, Sweden); deeper tissue adjacent to the radial artery was further anesthetized with local lidocaine (1%) injections. Subjects reported no pain from these sites during scanning. Once both lines were in position, subjects were placed in the PET scanner (Scanditronix 2048-15B), fitted with a thermoplastic mask to minimize head movement, and positioned such that the most superior aspect of the cerebral cortex was within the field of view. Transmission scans then were performed for attenuation correction during image reconstruction. For all PET scans, subjects were instructed to lie on the bed with their eyes closed and to not move or say anything until prompted for a pain rating after the end of the scan. Before actual PET scanning, a sham scan (saline injection) was carried out to minimize anxiety associated with the PET scan procedure (Talbot et al., 1991). Subjects then received six PET scans for measurement of CBF during REST (two scans), VIBE (two scans), CAP (one scan), and WANE (one scan). The scanner room was quiet except for the noise of the vibrotactile stimulator, which remained on for all scans.
After bolus injection of H215O (50 mCi/scan), scanning began automatically after a step increase in the scanner count rate. Dynamic PET data were acquired over the next 4 minutes (12 10-second images, 4 30-second images). Arterial blood gases were measured 2 minutes and 20 seconds after tracer injection. Heart and respiratory rates were assessed 2 minutes before tracer injection, at tracer injection, and every minute thereafter. The arterial input function was measured with an automated blood counting system. Blood was withdrawn at 3.8 mL/min, and coincident events were counted at 1-second intervals by paired NaI(T1) detectors. The blood counts then were corrected for randoms, dead time, sensitivity, and dispersion (Daube-Witherspoon et al., 1992). Peak counts and time-to-peak (i.e., the time until arterial counts reached their maxima) values then were extracted from the corrected blood curves for further analysis.
Positron emission tomography images were reconstructed with a Hanning filter (transverse resolution 7 mm) and corrected for measured attenuation, randoms, scatter, and dead time. Time shifts between scanner count rate data and blood data were determined in a manner similar to that described by Iida and others (1988). The CBF images (15 slices, 6.5-mm thick) were produced by a pixel-by-pixel least squares fit for flow and partition coefficient using the method of Koeppe and coworkers (1985).
Magnetic resonance imaging scans
Fast gradient recalled echo magnetic resonance imaging scans (124 × 1.5 mm thick sagittal images with an in-plane resolution of 0.98 mm, extended dynamic range, 256 × 256 matrix, 1 nexus, TE = minimum, flip angle = 20°) also were obtained for each subject. These high-resolution images were used to rule out structural abnormalities and to provide anatomic information not available in the PET data.
Cerebral blood flow analysis
Whole-brain (i.e., global) CBF (mL/100 g/min) was obtained by averaging all intracranial voxels from roll-yaw and movement-corrected CBF images (Minoshima et al., 1992). Intracranial voxels were identified by a mask produced from the average of the six PET scans for each subject. Differences among scan conditions were evaluated by single-factor analysis of variance (ANOVA), repeated within subjects.
Psychophysical and physiologic data analysis
All statistical comparisons were performed using SAS software (Statistical Analysis Systems, Inc.). In all analyses, data from each of the two REST scans and each of the two VIBE scans were averaged together, yielding four levels (REST, VIBE, CAP, WANE) for scan condition.
Differences in psychophysical ratings of pain, blood gases, and blood curves (peak and time-to-peak) across scan conditions were evaluated by single-factor ANOVA repeated within subjects followed by univariate contrasts between scan conditions. Heart rate differences across scan conditions were analyzed by two-factor ANOVA, repeated over time. Changes in heart rate over time were evaluated by univariate contrast analyses, whereas effects attributable to scan condition at each time point were evaluated by Dunnett's t tests.
Blood gas assessment outside of the PET scanner
To eliminate the possibility that highly transient pain-evoked changes in blood gases may have influenced CBF during the PET scan, five additional subjects (four men, one woman) were recruited for measurement of blood gases outside of the PET scanner. Each subject was prepared and stimulated in a manner identical to subjects who underwent PET scans. Arterial blood gases and pH were measured during both rest and capsaicin trials. An additional trial directly examining the effects of hyperventilation also was included. Each trial was separated by approximately 10 minutes. In all trials, subjects were instructed to lie quietly. In the resting trial, blood samples were drawn at 30-second intervals for 6 minutes. In the capsaicin trial, blood samples were drawn at 15-second intervals over a 6-minute period. The capsaicin trial was divided into 75 seconds of rest, 105 seconds of anticipation (while the skin was prepared for capsaicin injection by alcohol swabbing), and 180 seconds of postinjection pain (250 μg capsaicin, injected intradermally in the upper arm). In the hyperventilation trial, blood gases were measured at 30-second intervals during a 6-minute period. The hyperventilation trial was divided into 60 seconds of rest, 60 seconds of maximal hyperventilation, and 240 seconds of recovery from hyperventilation.
To identify possible changes in blood gases and pH during capsaicin-induced pain, data were first averaged (for each subject) over the 6-minute resting trial, the 3 minutes immediately after capsaicin injection, and the 1 minute of rest before hyperventilation (as pain was waning). Differences among these three averages were evaluated by single-factor ANOVA repeated within subjects, and followed by univariate contrasts between conditions. Differences from hyperventilation were identified by first averaging data from the 1 minute before hyperventilation, the 1 minute during hyperventilation, and the 4 minutes of recovery. These averages were analyzed, as described earlier, with a single-factor ANOVA repeated within subjects.
RESULTS
Psychophysical ratings of pain
Pain ratings changed significantly across scan conditions (overall ANOVA f = 134.2, P < 0.0001). All subjects experienced significant pain on capsaicin injection (Fig. 1), and most subjects exhibited moderate pain during the waning period of capsaicin pain. No subjects experienced pain during the REST and the VIBE scans. Capsaicin-evoked pain frequently was described as an initial stinging or burning pain followed by a prolonged burning pain. Pain was rated more intense during the CAP scan than during the WANE scan (ANOVA f = 75.79, P < 0.0001). Pain during both conditions was significantly greater than REST (CAP ANOVA f = 367.20, P < 0.0001; WANE ANOVA f = 36.70, P < 0.0001).
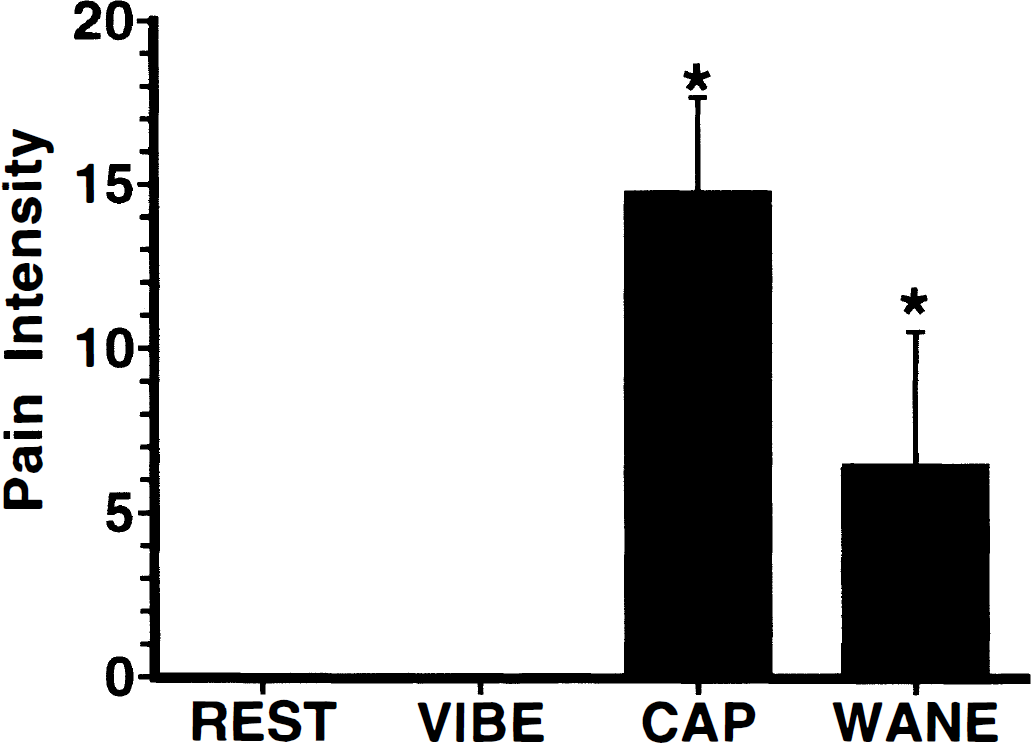
Psychophysical ratings of pain intensity (mean ± SD). Capsaicin produced substantial pain during the positron emission tomography (PET) scan immediately after injection (CAP, *P < 0.0001). Pain remained at moderate levels during the waning phase of capsaicin pain, 12 minutes after injection (WANE, *P < 0.0001). Subjects reported no pain during either rest or vibration scans.
Decreases in cerebral blood flow
Global CBF changed significantly across scan conditions (overall ANOVA f = 14.7, P < 0.0001; Fig. 2). Capsaicin-evoked pain produced a significant decrease in global CBF when compared with REST (ANOVA f = 22.8, P < 0.0005). No reliable differences were detected when global CBF values during WANE and VIBE were compared with those during REST. The global CBF change during CAP was robust (average decrease of 22.8%); 12 of the 14 subjects exhibited decreases exceeding 10% when compared with REST. Of the two remaining subjects (both female), one displayed no substantial change (0.7% decrease) and one displayed a minor increase (3.2%).
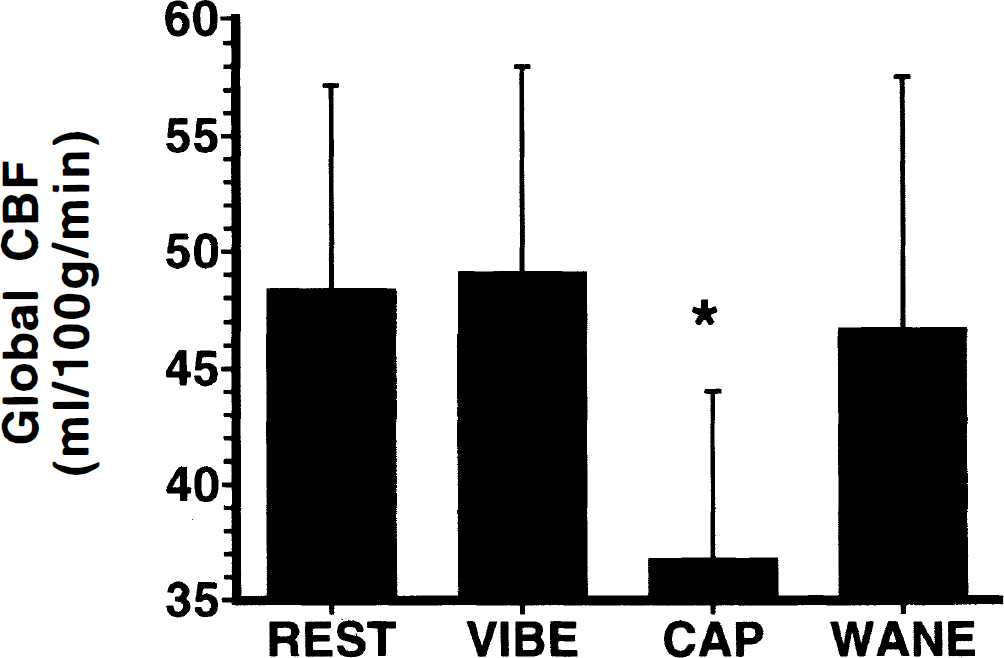
Global CBF (mean ± SD). Capsaicin-evoked pain produced a 22.8% global CBF decrease when compared with resting levels (CAP, *P < 0.0005). Global CBF returned to levels indistinguishable from rest during the waning phase of capsaicin-evoked pain (WANE). Nonpainful stimulation (VIBE) produced no reliable global CBF change. Notice that in all figures, means and SD represent between-subjects data, but that statistical analysis is performed in a within-subjects manner.
Cardiovascular effects during PET scans
Blood gas measurements differed slightly, but reliably, across scan conditions (P
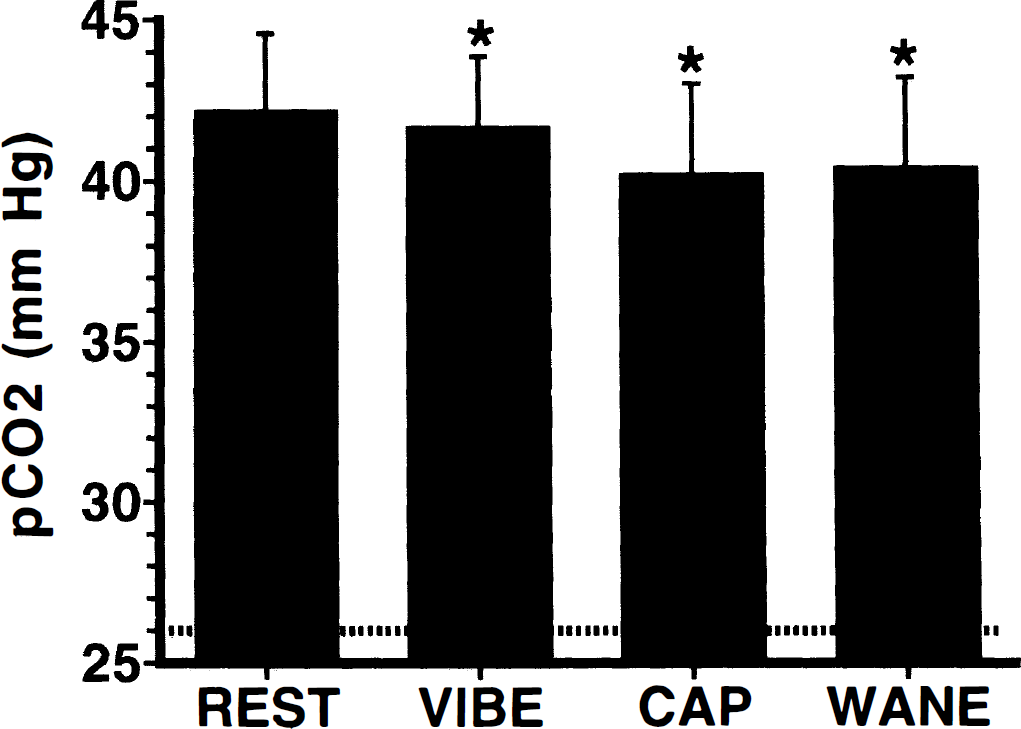
Changes in P
Heart rates changed significantly over time (ANOVA f = 14.5, P < 0.0001) in a manner dependent on scan condition (ANOVA f = 6.6, P < 0.0001; Fig. 4). Heart rates were elevated significantly at the time of tracer injection (relative to all other time points; ANOVA P < 0.05). This was the only time point where heart rate differed significantly among scan conditions (ANOVA f = 13.6, P < 0.0001); heart rates during the CAP scan were significantly greater than heart rates during REST, VIBE, and WANE scans (Dunnett's t test, P < 0.05). Despite this large increase at the time of capsaicin injection, heart rates returned to resting levels within 1 minute, such that they were indistinguishable from REST at all remaining time points (Fig. 4).
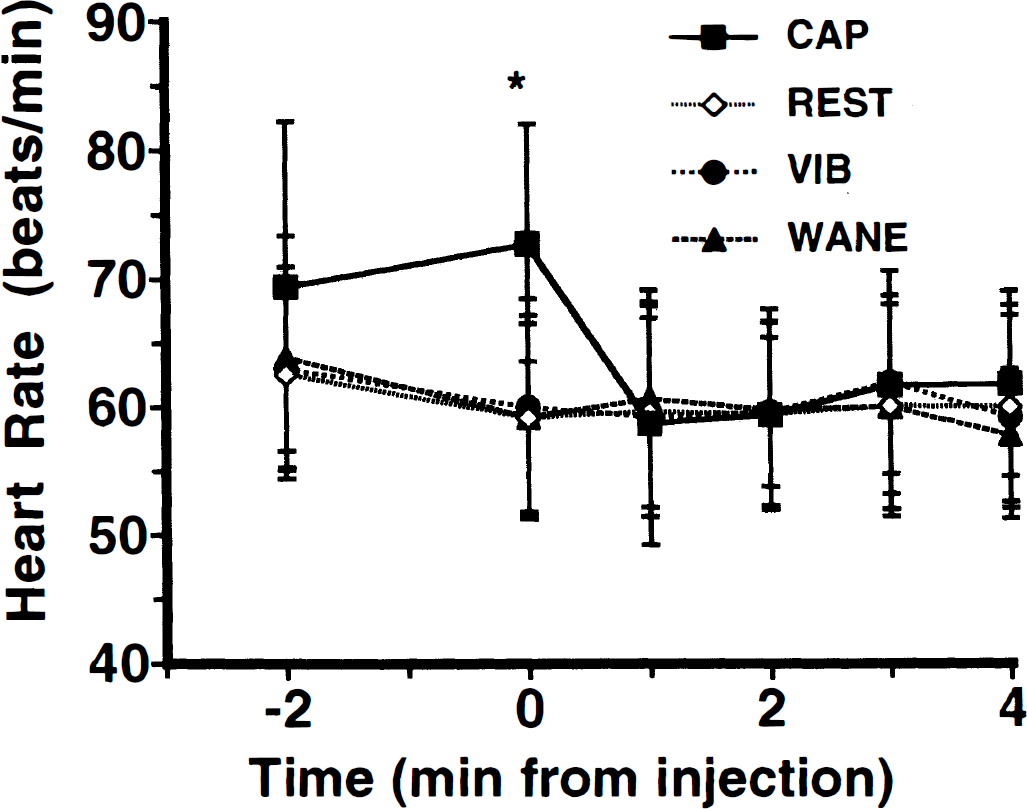
Heart rates before and during PET scans (mean ± SD). Heart rates are plotted over time relative to H215O injection. Injection of capsaicin at minute 0 produced a significant increase in heart rate compared with resting levels (*P < 0.05). This increase was transient, and heart rates returned to levels indistinguishable from rest within 1 minute. No other reliable changes were noted.
Arterial input function
The arterial input function remained remarkably consistent across both painful (CAP, WANE) and nonpainful (REST, VIBE) scan conditions (Fig. 5). However, slight differences in the arterial blood curves did exist. The peak blood counts differed among scan conditions (ANOVA f = 6.4, P < 0.005; Fig. 5). Peak arterial counts were significantly elevated above resting levels during the CAP scan (ANOVA f = 6.5, P < 0.05). Conversely, arterial tracer peak counts were reduced reliably during the VIBE scan when compared with REST (ANOVA f = 8.7, P < 0.05). Additionally, in 8 of the 14 subjects, the time-to-peak values tended to be slightly shorter during the CAP scan than during the REST scan. However, this effect did not reach statistical significance.
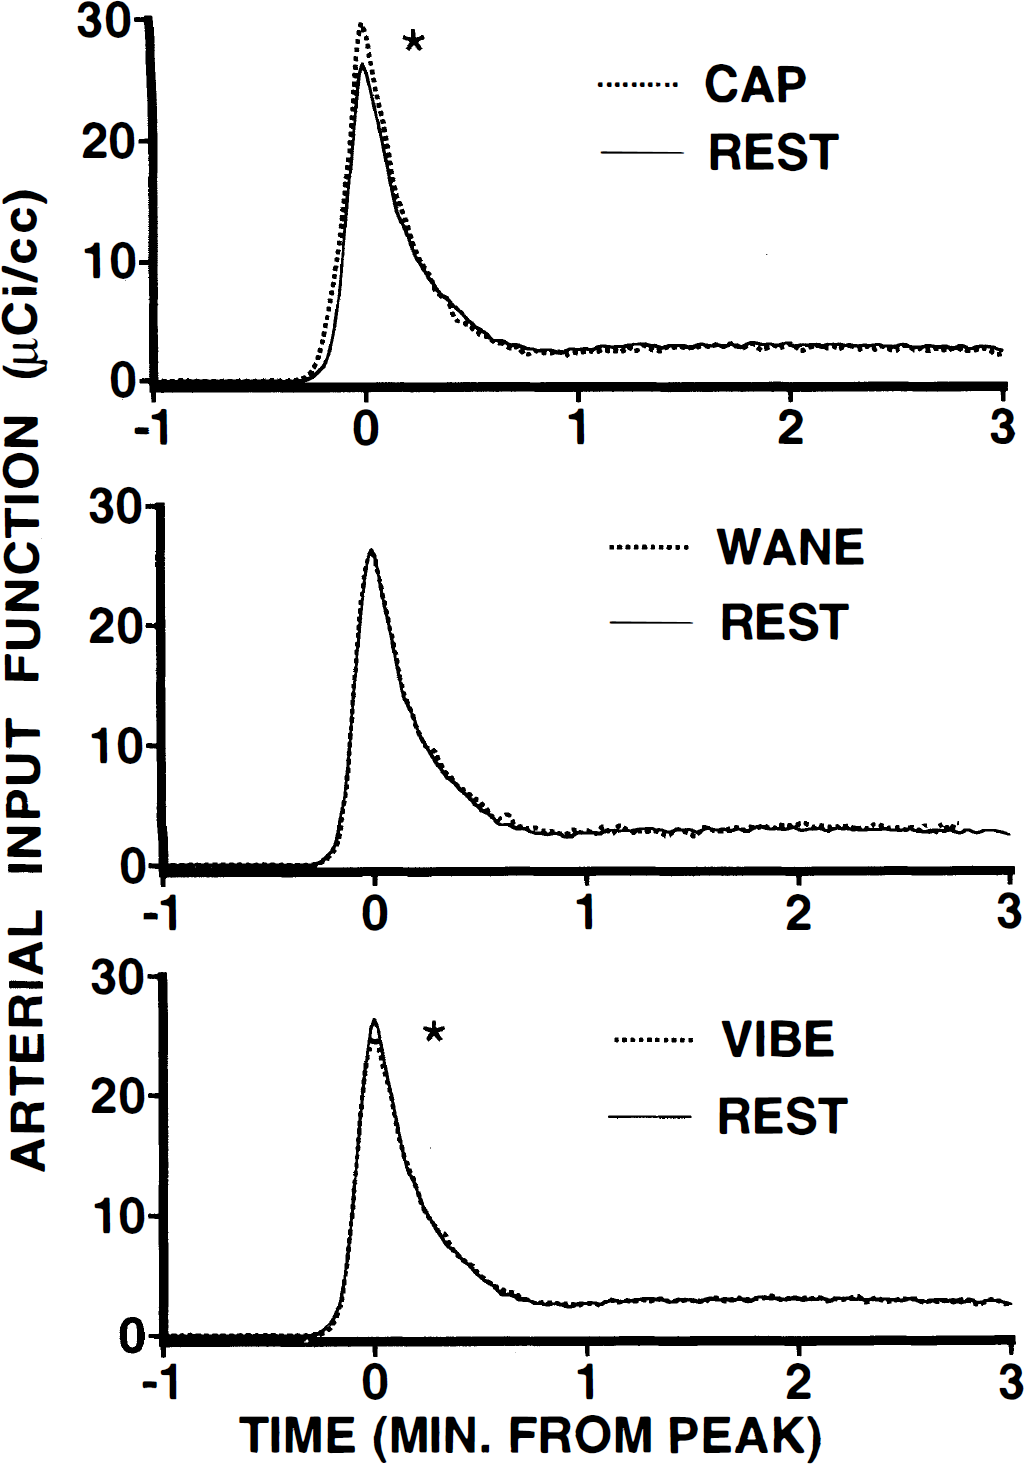
Arterial input functions during painful and nonpainful scanning conditions (means). Counts from arterial blood samples are plotted over time. These curves are normalized temporally, such that peak values are centered at minute 0. All active scans are plotted against REST. Peak counts for CAP (top panel) were significantly greater than REST (*), and peak counts for vibe (bottom panel) were significantly less than REST (*). Peak counts during the WANE scan (center panel) were indistinguishable from REST. Despite these changes in the peak counts, no obvious distortions of the input function occurred during any scan condition.
Blood gas changes during pain and hyperventilation outside of the PET scanner
When blood gases were measured in five volunteers outside of the PET scanner, pain from capsaicin injection was rated as substantially intense (16.4, mean), similar to ratings obtained from subjects during PET scans. Consistent with findings during the PET scans, and seen in Fig. 6, blood gases and pH remained highly stable during capsaicin-induced pain and did not change significantly from resting levels (P
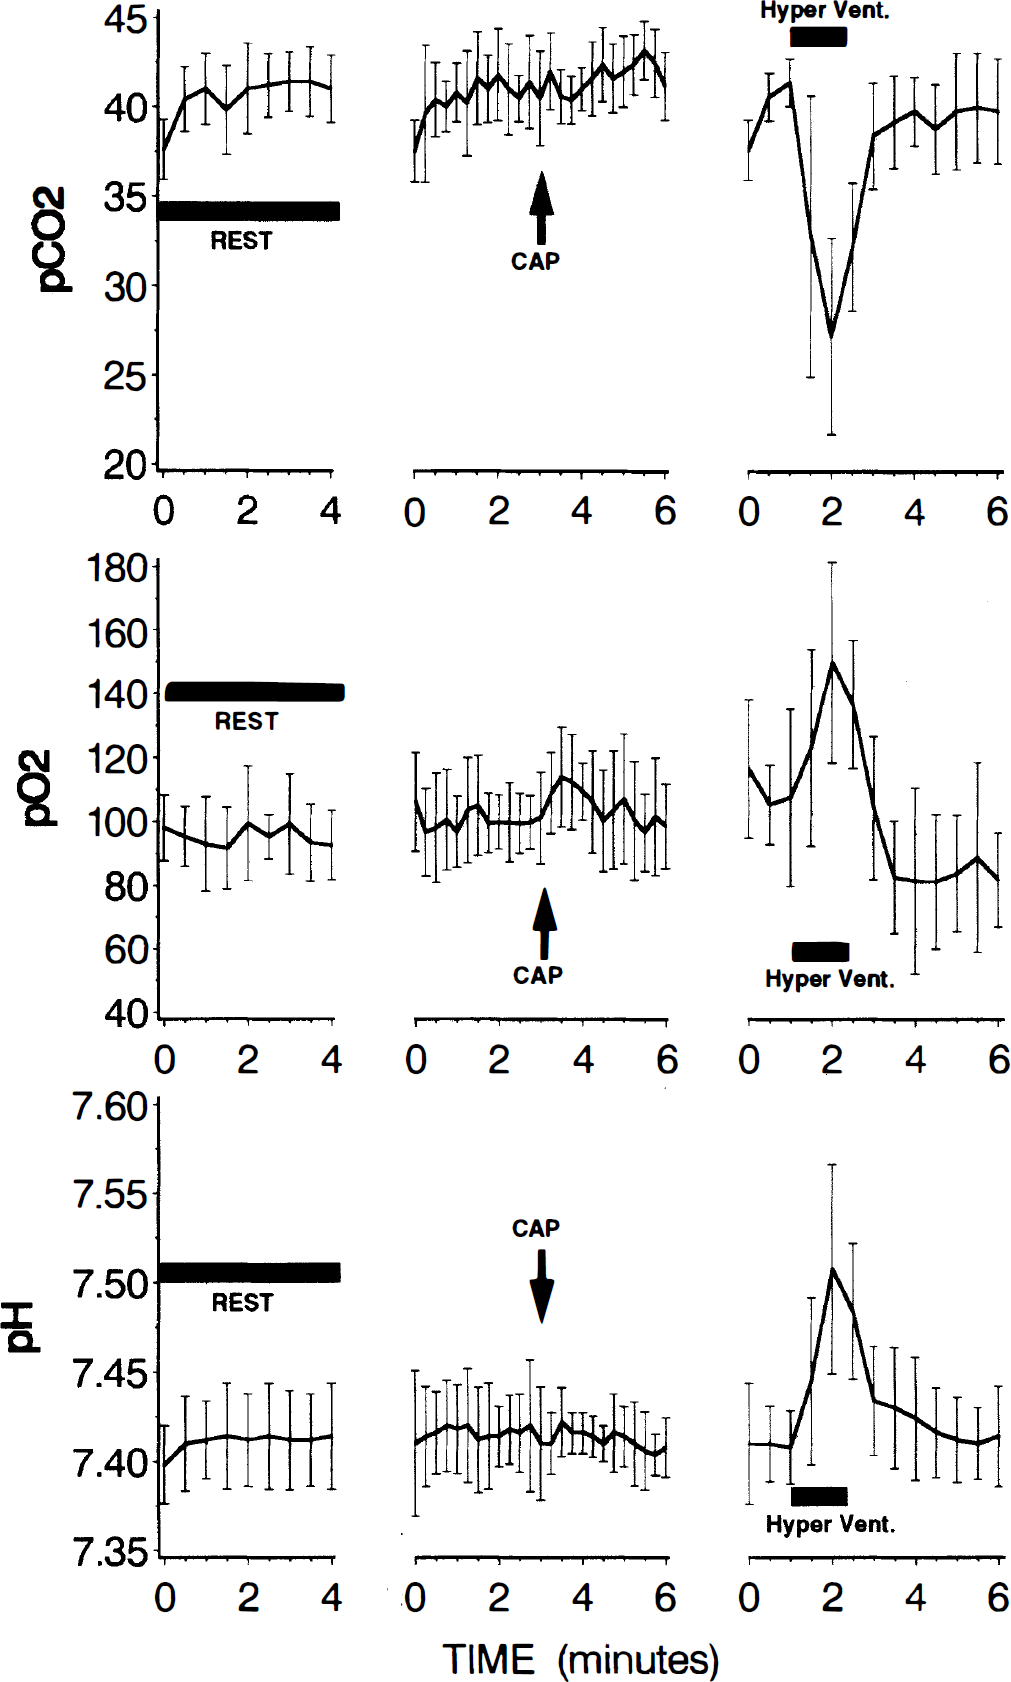
Arterial blood gas and pH levels during rest, pain, and hyperventilation (means ± SD, n = 5). Blood gases and pH exhibited no statistically reliable changes after injection of capsaicin. In contrast, hyperventilation produced marked alterations in these parameters. Although P
Blood gases and respiratory rates
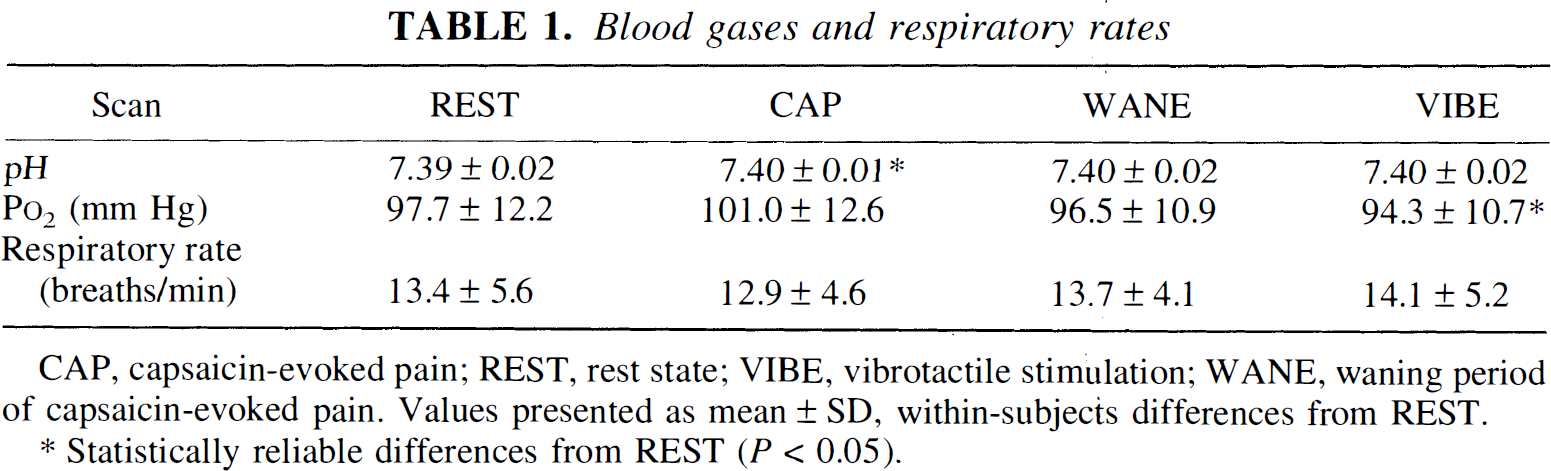
CAP, capsaicin-evoked pain; REST, rest state; VIBE, vibrotactile stimulation; WANE, waning period of capsaicin-evoked pain. Values presented as mean ± SD, within-subjects differences from REST.
Statistically reliable differences from REST (P < 0.05).
In contrast, hyperventilation produced profound changes in blood gases and pH (Fig. 6). Statistically reliable changes were noted in P
DISCUSSION
Painful stimulation produced robust (22.8%), statistically reliable decreases in global CBF (Fig. 2). These decreases appear to result from factors largely independent of changes in blood gas concentration and heart rate (Figs. 3,4, and 6). Such a decrease in global CBF during painful or other stressful conditions has not been described previously and likely represents a unique response of CBF.
Carbon dioxide and cerebral blood flow
Several factors such as P
There is, however, the possibility that highly transient changes in blood gases may have not been detected by the one measurement taken 2:20 minutes after capsaicin injection. In a parallel control study performed outside of the PET scanner, analysis of five subjects revealed no such changes in P
Systemic cardiovascular factors
Another factor known to influence CBF is cardiac output. Although CBF autoregulation is well maintained between blood pressures of 50 and 140 mm Hg (Lassen, 1959; Harper, 1966), subjects may have experienced a presyncopal episode after capsaicin injection. Such events often are characterized by rapid decreases in heart rate and blood pressure, leading to loss of consciousness if not promptly treated by changes in posture, fluid infusion, or pharmacologic intervention (Adams, 1993). However, heart rates were observed to increase significantly during capsaicin injection (Fig. 4). At no point during the CAP scan were they observed to decrease below resting levels (Fig. 4). Importantly, no subject lost consciousness or reported feelings of nausea or impending syncope during either the scanning or prescanning session. Additionally, the arterial input functions showed no evidence of decreased cardiac output during capsaicin pain in that time-to-peak values were not lengthened during the CAP scan. Thus, some factor other than systemic cardiovascular changes must account for the observed global CBF decrease. One such mechanism is proposed later.
Possible mechanism of global cerebral blood flow decrease during pain
Intradermal injection of capsaicin is a potent, stressful, noxious stimulus and, like many painful stimuli, has been demonstrated to activate the sympathetic nervous system (Liu et al., 1996). Multiple, converging lines of evidence indicate that activation of the sympathetic nervous system can substantially affect CBF (Edvinsson, 1982; Edvinsson and MacKenzie, 1977). Many cerebrovascular resistance vessels receive direct sympathetic innervation (Edvinsson et al., 1973), which is capable of releasing both norepinephrine (Edvinsson et al., 1973; Edvinsson and MacKenzie, 1977) and neuropeptide Y (Edvinsson et al., 1983). Both agents have been demonstrated to produce substantial vasoconstriction (Edvinsson et al., 1983; Edvinsson and MacKenzie, 1977), although species and methodologic differences have caused the role of norepinephrine to remain controversial (Lou et al., 1987; Edvinsson and MacKenzie, 1977). In animal studies, direct stimulation of sympathetic nerves has been shown to produce vasoconstriction of arteries (Kuschinsky and Wahl, 1975; Auer et al., 1981; Edvinsson and MacKenzie, 1977) and to reduce cerebral blood volume (Edvinsson et al., 1971). Conversely, in human studies, loss of sympathetic input (through stellate ganglion block) can increase CBF (Umeyama et al., 1995). Taken together, these lines of evidence indirectly suggest that the sympathetic nervous system may play a significant role in the genesis of this global CBF decrease. Future studies are needed to clarify the mechanism and implications of such pain-induced CBF decreases.