
Abstract
We conducted a pixel-based analysis of the acute hemodynamic and metabolic determinants of infarctive histopathology in a reproducible model of temporary (2-hour) middle cerebral artery occlusion (MCAO) produced in rats by an intraluminal suture. Three-dimensional averaged image data sets of local cerebral blood flow (LCBF) and glucose utilization (LCMRglc) acquired in the companion study (Belayev et al., 1997) either at the end of a 2-hour period of MCAO or after 1 hour of recirculation were comapped (using digitized atlas-templates) with data sets depicting the frequency of histological infarction in a matched animal group (n = 8) in which 2 hours of MCAO was followed by 3-day survival, sequential neurobehavioral examinations, and perfusion-fixation and paraffin-embedding of brains for light-microscopic analysis. All rats developed marked postural-reflex and forelimb-placing deficits at 60 minutes of MCAO, signifying high-grade ischemia. Tactile placing deficits persisted during the 72-hour observation period while visual placing and postural-reflex abnormalities variably improved. Comapping of LCBF and histopathology showed that in those pixels destined to undergo infarction, LCBF measured at 2 hours of MCAO showed a sharp distributional peak centered at 0.14 mL/g/min. In 70% of pixels destined to infarct, LCBF at 2 hours of MCAO was 0.24 mL/g/min or below, and in 89% LCBF was below 0.47 mL/g/min (the upper limits of the ischemic core and penumbra, respectively, as defined in the companion study [Belayev et al., 1997]). Local cerebral glucose utilization measured at ~1 hour after 2 hours of MCAO was distributed bimodally in the previously ischemic hemisphere. The major peak, at 22 μmol/100 g/min, coincided exactly with the distribution peak of pixels destined to undergo infarction, while in pixels with a zero probability of infarction, LCMRglc was higher by 12 to 13 μmol/100 g/min. These results indicate that local blood flow at 2 hours of MCAO is a robust predictor of eventual infarction. Pixels with ischemic-core levels of LCBF (0% to 20% of control) have a 96% probability of infarction, while the fate of the penumbra is more heterogeneous: below LCBF of 0.35 mL/g/min, the probability of infarction is 92%, while approximately 20% pixels in the upper-penumbral LCBF range (30% to 40% of control) escape infarction. Our data strongly support the view that the likelihood of infarction within the ischemic penumbra is highly influenced by very subtle differences in early perfusion.
The intent of this study is to analyze, as precisely as possible, the early hemodynamic and metabolic determinants of infarctive histopathology in focal cerebral ischemia. To this end, we have implemented a computer-assisted method of multimodal image analysis that permits the comapping of multiple digitized data sets derived from both light-microscopic histopathology as well as autoradiography. We have applied this approach to study middle cerebral artery occlusion (MCAO) produced in the rat by insertion of an intraluminal suture, using a modification that results in highly consistent histological infarction (Belayev et al., 1996).
In the preceding study (Belayev et al., 1997), we presented a detailed autoradiographic analysis of local cerebral glucose metabolism (LMRglc) and blood flow (LCBF), and their interrelationships, during 2 hours of MCAO and after 1 hour of postischemic recirculation in this model. In the current investigation, we used a pixel-based strategy to analyze these alterations vis-a-vis the patterns of histological infarction in a matched series of rats with 2 hours of MCAO followed by 3-day survival. By fitting the histological data set to a digitized anatomic atlas (Zilles, 1985), we were also able to quantitate precisely the extent of histological infarction within functional-anatomic brain areas—an analysis that aids in the interpretation of the neurobehavioral deficits produced in this model.
MATERIALS AND METHODS
The studies reported here were conducted on male Sprague-Dawley rats subjected to a 2-hour period of right MCAO. Animals were fasted overnight, anesthetized with halothane/nitrous oxide, orally intubated, mechanically ventilated, and monitored for rectal and cranial temperatures, arterial blood pressure, arterial blood gases and pH, and plasma glucose by procedures that are fully described in the companion article (Belayev et al., 1997). Two hours of MCAO was induced by the retrograde insertion of an occlusive intraluminal suture via the external carotid artery into the middle carotid artery, according to the procedure of Zea Longa et al. (1989) (see Belayev et al., 1997, for full description). The tip of the suture was blunted by heating near a flame before use. A 20-mm distal segment of the suture was then coated with poly-L-lysine solution as previously described (Belayev et al., 1996, 1997).
Twenty rats were studied autoradiographically, for either local cerebral blood flow (LCBF) or local cerebral glucose utilization (LCMRglc) by means of 14C-labeled iodoantipyrine and 2-deoxyglucose, respectively. Five rats underwent LCBF studies after 1.75 hours of MCAO, and another 5 were studied after 2 hours of MCAO plus 1 hour of postischemic recirculation. In the LCMRglc series, 5 rats were studied at 1.5 to 2.25 hours after MCAO; and another 5, at 0.75 to 1.5 hours of postischemic recirculation; the temporal centroid of the latter two study-intervals corresponded to the time-points used in the respective LCBF groups, thus facilitating intergroup comparisons. The companion article (Belayev et al., 1997) is devoted to an extensive presentation of the methods and results of these LCBF and LCMRglc studies.
In another 8 rats (weighing 265 to 320 g) subjected to 2 hours of MCAO in identical manner to the above studies, a 3-day survival was permitted, during which sequential neurobehavioral testing was performed. These rats were then perfusion-fixed for histopathological analysis.
Neurobehavioral evaluation
Behavioral tests were performed on all rats before MCAO and at 60 minutes of MCAO by an investigator (L.B.) who was blinded to the experimental groups. The battery consisted of two tests to evaluate various aspects of neurologic function: the postural reflex test and the forelimb placing test. (Each behavioral test is described in detail below.) Rats not showing a high-grade behavioral deficit at 60 minutes of MCAO were excluded from further study. In rats of the histological series, neurobehavioral testing was repeated at 24, 48, and 72 hours.
Postural reflex test. This test, designed to examine upper-body posture, is regarded as being sensitive to both cortical and striatal lesions (Bederson et al., 1986). Rats were suspended by the tail 1 m above the floor. Intact rats extended both forelimbs toward the floor; animals displaying this behavior were assigned a score of 0. A score of 1 was given if the rat flexed one or both forelimbs. The animal was then given the lateral push test, which involved placing the rat on a sheet of plastic-coated paper and applying lateral pressure behind the shoulders in the left and right directions. If the rat was unable to resist the force equally in both directions, it received a score of 2.
Elicited forelimb placing. Forelimb placing reactions to visual and tactile stimuli were measured for each forelimb to examine sensorimotor integration (De Ryck et al., 1989). For visual placing, the animal was cupped in the experimenter's hands with the forelimb hanging free and was slowly tilted and lowered from each side toward a tabletop. Intact rats reached for the table with both forelimbs extended. By moving the animal laterally toward the table edge, sideways visual placing could be assessed as well. Tactile placing was judged by lightly contacting the dorsal and then the lateral surface of the rat's forepaw to the table edge while slightly elevating its head to obscure its view of the table. Intact rats immediately placed the paw on the tabletop, while impaired rats either were slow to place or did not place at all. For each of these tests, a score of 0 was given for normal, immediate placing. A score of 1 was given if the placing was delayed or incomplete. A score of 2 indicated absent placing.
Total neurological score. Total neurological score was calculated as the sum of scores on forward visual placing (range, 0 to 2), lateral visual placing (0 to 2), dorsal (0 to 2) and lateral (0 to 2) tactile placing, and postural reflex (0 to 2); the maximally abnormal score was 10.
Image-analysis of histopathology
In 8 rats with 2 hours of MCAO followed by 72 hours of reperfusion, a quantitative light microscopic histological analysis of brain infarction was performed. Brains were perfusion-fixed as previously described (Nakayama et al., 1988) with a mixture of 40% formaldehyde, glacial acetic acid, and methanol (FAM, 1:1:8 by volume), and brain blocks were embedded in paraffin. Sections 10 μm thick were cut in the coronal plane and stained with hematoxylin and eosin. To quantitate infarct volume and depict infarct frequency distribution, histological sections were digitized at 8 standardized coronal levels by means of a Xillix CCD-based camera system (with a Nikon macro lens and green filter) interfaced to an MCID image-analysis system (Imaging Research, Inc., St. Catherines, Ontario, Canada), from which the data were exported to a DEC-Alpha workstation for processing. An investigator blinded to the experimental groups (L.B.) then outlined the zones of infarction (which were clearly differentiable tinctorially from normal tissue) as well as the outlines of the left and right hemisphere on each section. Pixels corresponding to the infarcted zone of each section were set to 1, and the remaining pixels to 0. The resulting digitized maps of individual animals at corresponding coronal levels were then mapped into a common template (derived from the appropriate sections of the atlas of Zilles et al., 1985) and were summed to produce aggregate histological maps showing the frequency of infarction at each pixel location (Zhao et al., 1996). These are shown in Fig. 1.
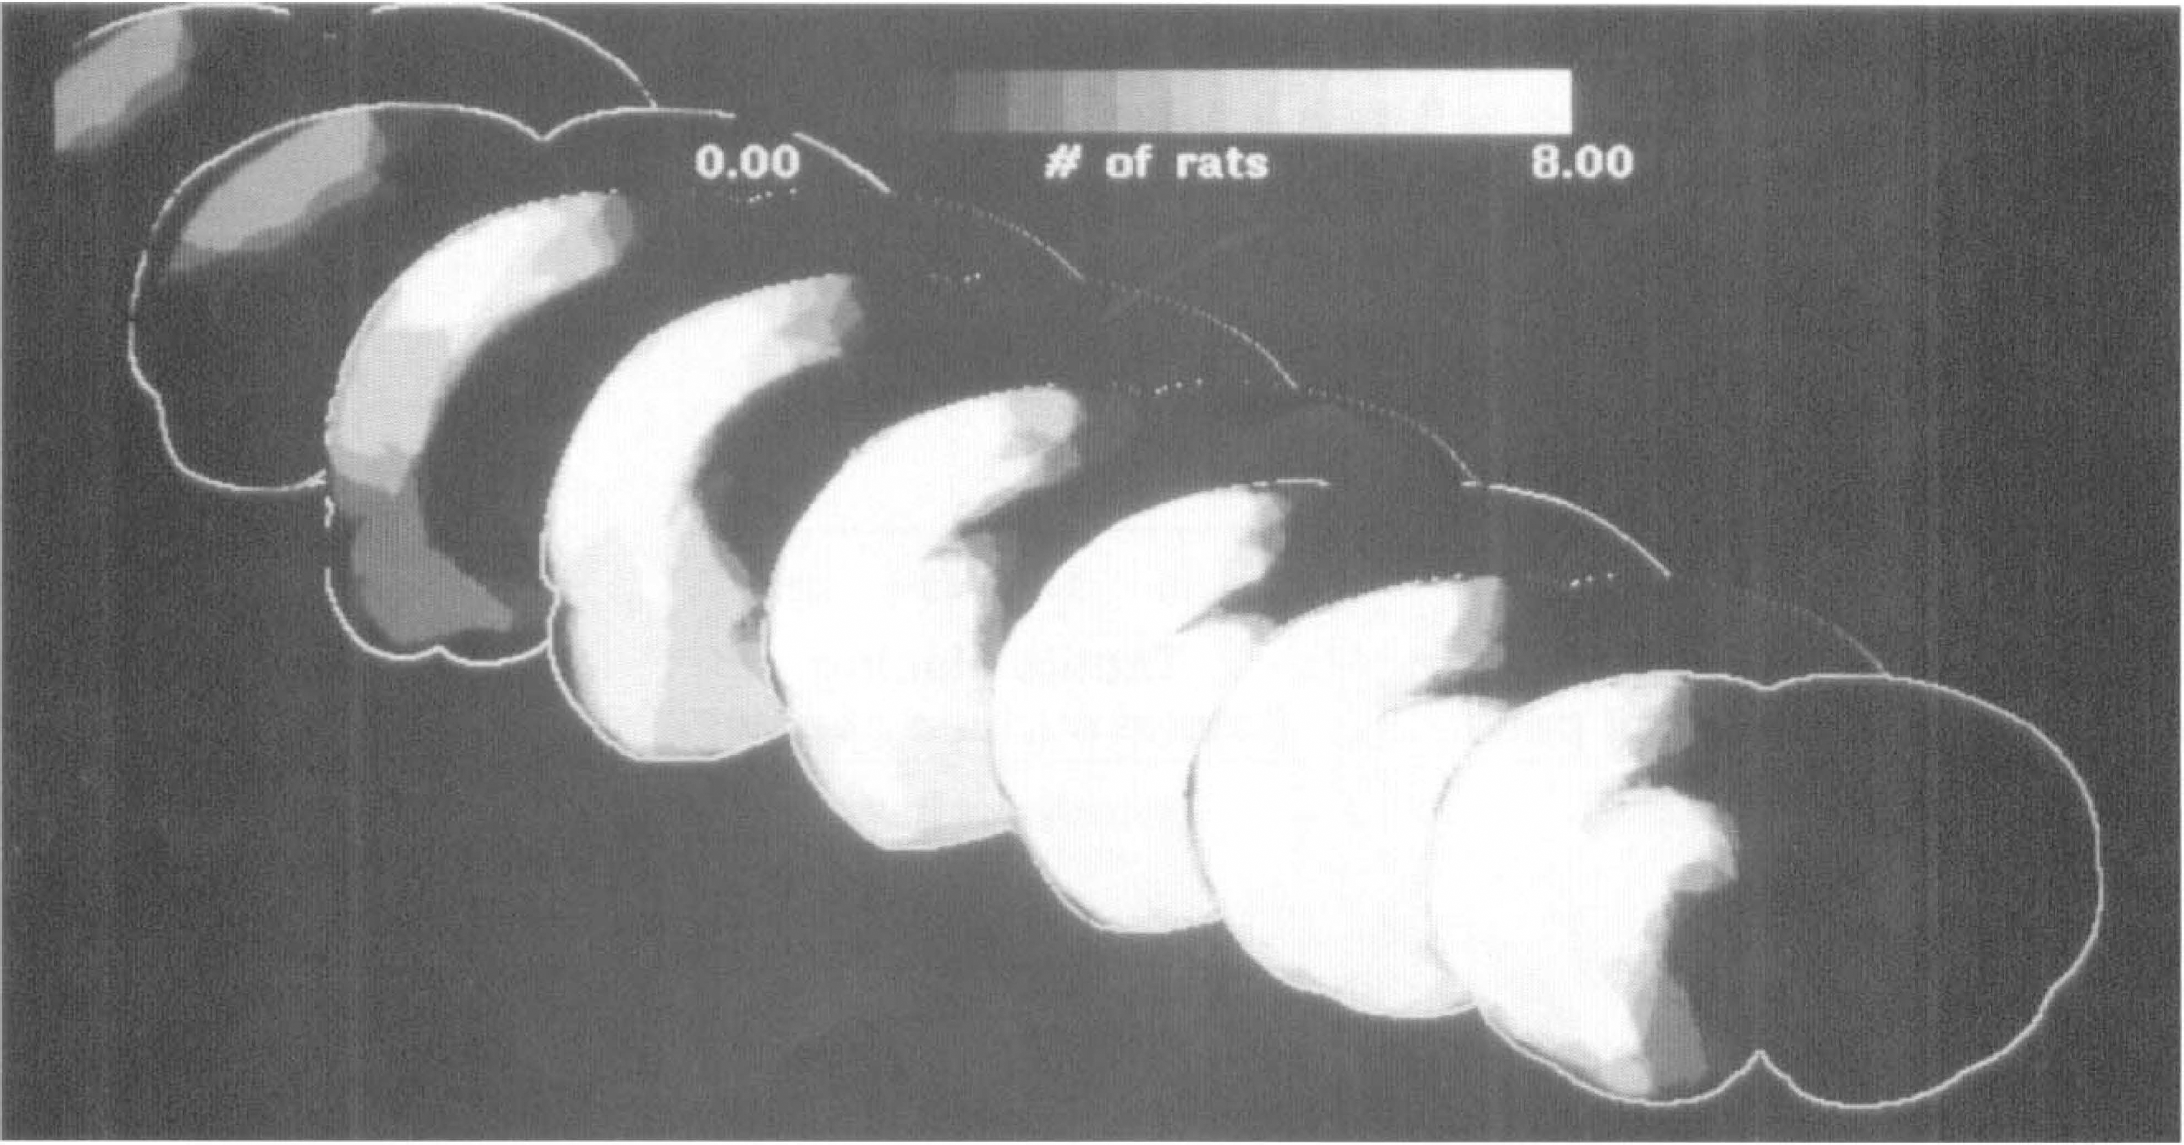
Histological frequency maps depicting numbers of rats (of a possible 8) showing infarction at each pixel location. The eight coronal levels are bregma +1.2, −0.3, −1.8, −3.8, −4.8, −6.3, and −7.8 mm, corresponding to the atlas levels used for analysis of local cerebral blood flow (LCBF) and local cerebral glucose utilization (LCMRgl) in the companion study (Belayev et al., 1997).
For purposes of this analysis, we wished to compare the histological frequency data set on a pixel-by-pixel basis with the corresponding LCBF and LCMRglc data sets derived in the companion study (Belayev et al., 1997). To this end, at each of the 8 coronal levels corresponding to the histological data set, the average LCBF and LCMRglc data sets of the companion study (Belayev et al., 1997) were comapped into the same atlas template (Zhao et al., 1995), permitting pixel-by-pixel correlations of infarction frequency with blood flow or glucose metabolism in the same focal-ischemia model.
RESULTS
Physiological variables
These did not change over time when measured 15 minutes before and 15 minutes after MCAO. Mean values (± SD, n = 8 rats) are cranial temperature, 37.2 ± 0.1°C; rectal temperature, 37.4 ± 0.1°C; arterial pH, 7.41 ± 0.05; PO2, 112 ± 14 mm Hg; PCO2, 38.3 ± 1.5 mm Hg; arterial blood pressure, 106 ± 13 mm Hg; and plasma glucose level, 116 ± 10 mg/dL. All physiological data were comparable between this series and the autoradiographic series presented in the companion article (Belayev et al., 1997).
Neurobehavior
Consistent with the observations reported in the companion study (Belayev et al., 1997), all 8 rats of the histological series had a normal neurological score (= 0) before MCAO, and all animals developed a marked deficit (= 9 out of a possible 10) when first assessed at 60 minutes of MCAO (Fig. 2). Repeated neurobehavioral testing at 24, 48, and 72 hours after MCAO revealed a persistence of maximal tactile placing deficits (both dorsal and lateral) at all time points. By contrast, visual placing deficits and postural reflex abnormalities improved variably at 24 to 72 hours in 1 or 2 animals, as shown in Fig. 2. Thus, the total neurological score, on average, improved over the 3-day survival period (from 9 ± 0 [SD] at 60 minutes to 8.1 ± 0.8 at 72 hours; Fig. 2).
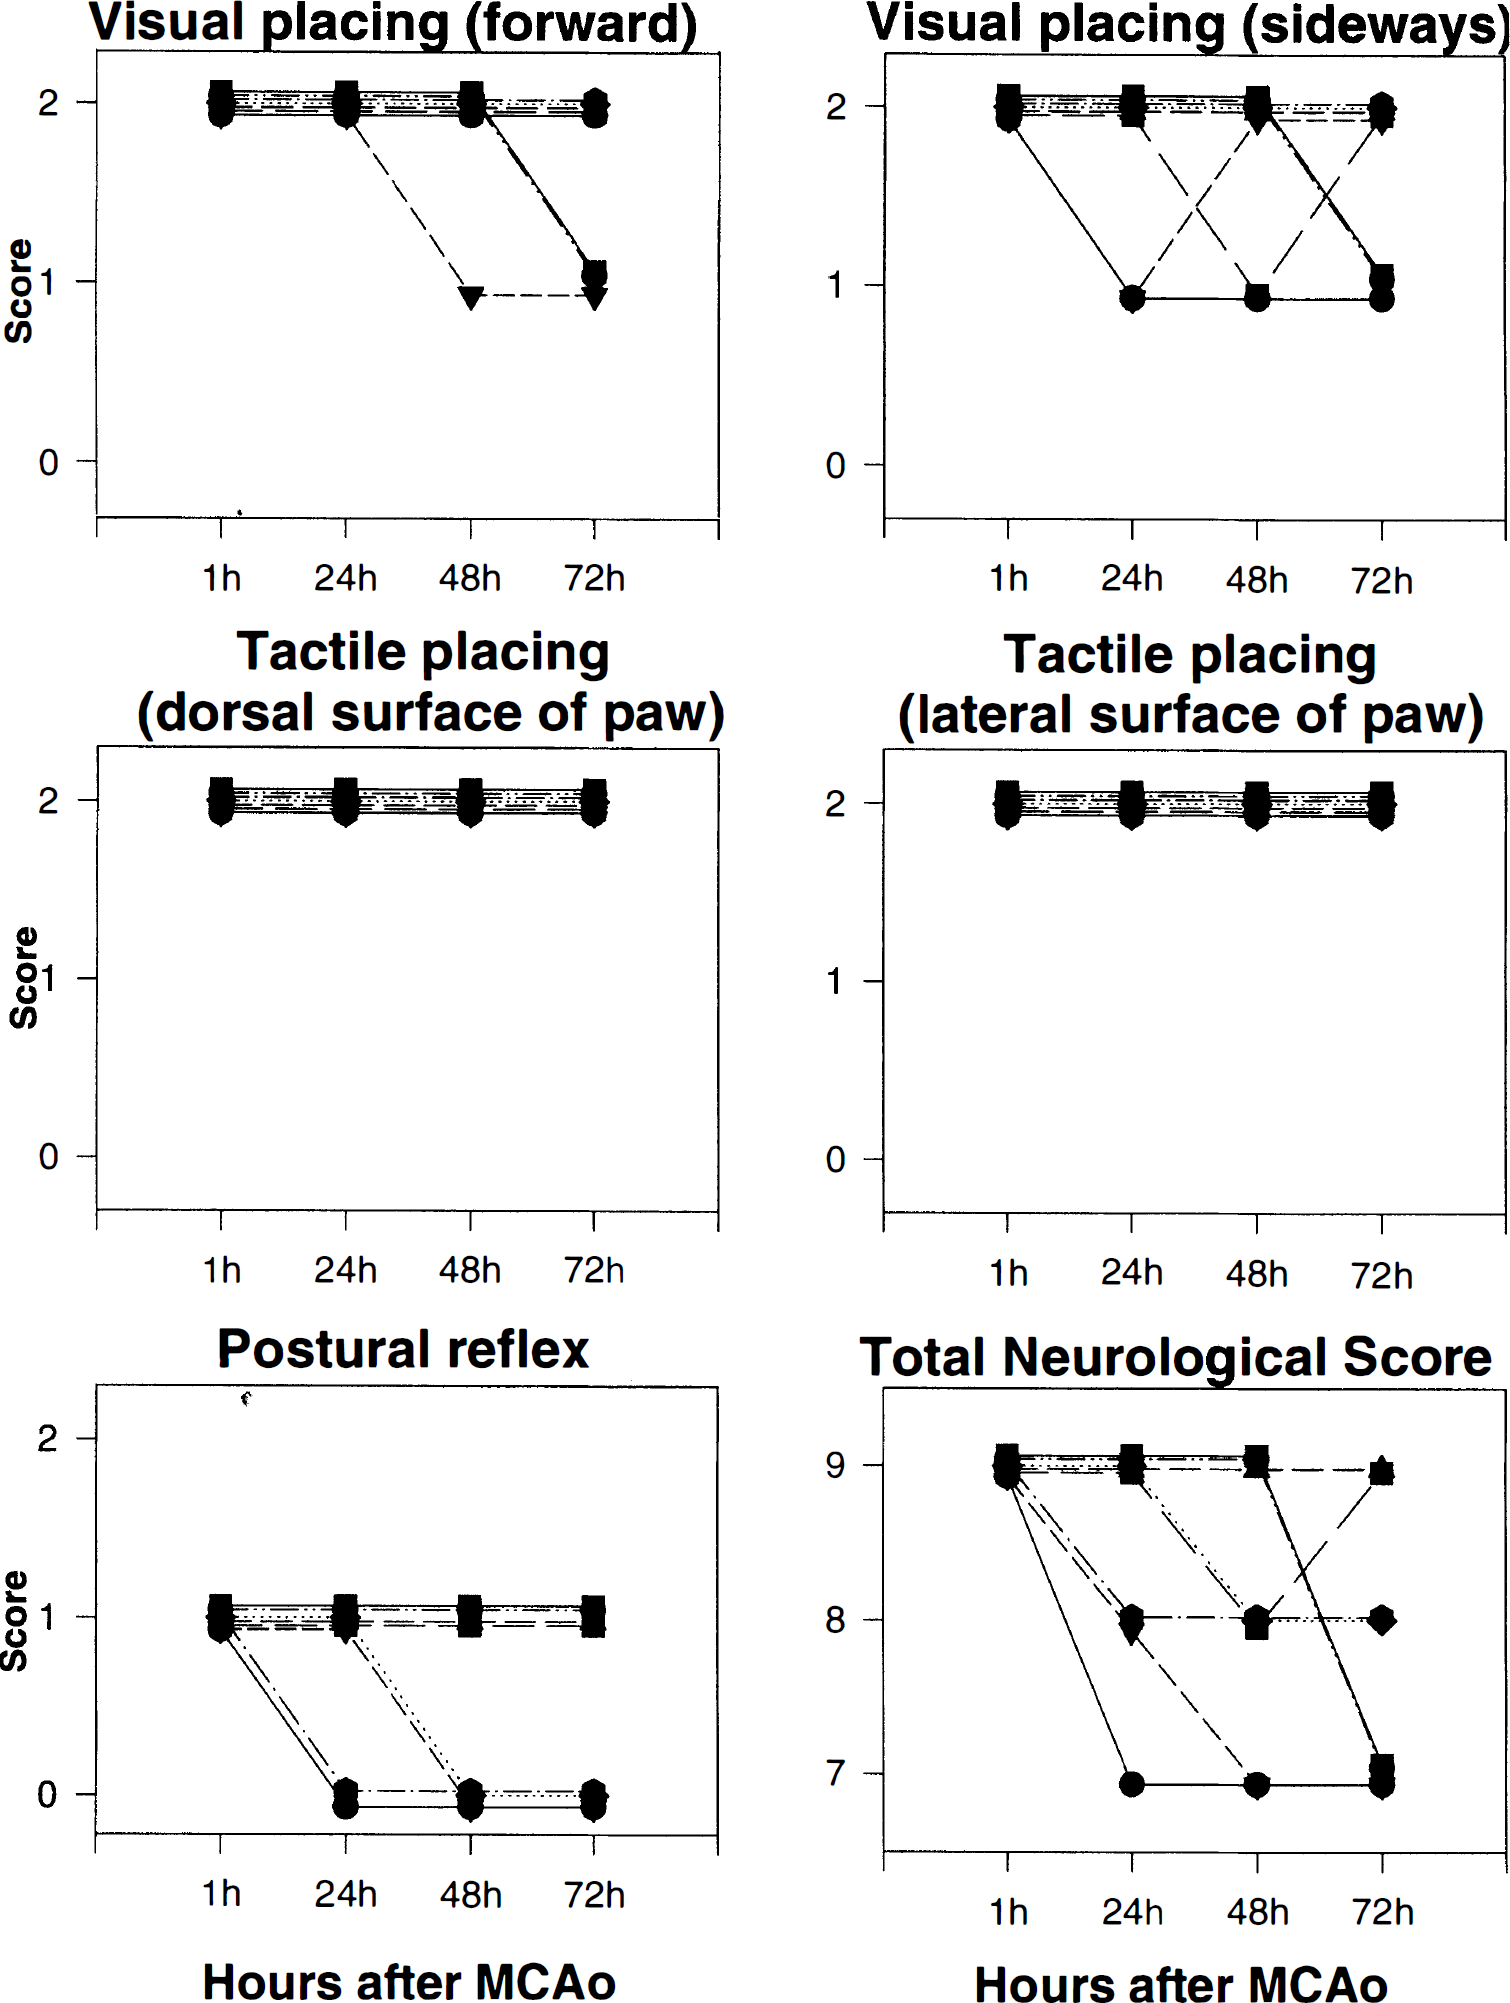
Plots of component and total neurological scores in 8 rats assessed at 1, 24, 48, and 72 hours after middle cerebral artery occlusion (MCAO). Lines connect sequential data points from a single animal.
Functional-anatomic distribution of histopathology
By fitting digitized sections of the functional-anatomic atlas of Zilles et al. (1985) (see Fig. 1 of companion article [Belayev et al., 1997]) to the histopathological maps of individual rats, we could compute the percentage of total pixels of each rat showing infarction within each anatomic area. These data are shown in Table 1 (in which the anatomic structures are listed in a manner identical to that used to present LCBF, LCMRglc, and the LCMRglc/LCBF ratio in Tables 2 to 4 of the companion article [Belayev et al., 1997]). Among cortical regions, the somatosensory, temporal, and lateral occipital cortices showed the most extensive and consistent involvement (80% to 100%, coefficient of variation 8%). The posterior caudoputamen was also infarcted throughout virtually its entire extent in all rats. A variety of other structures showed lesser involvement (Table 1).
Pixel-based analysis of regional infarctive histopathology
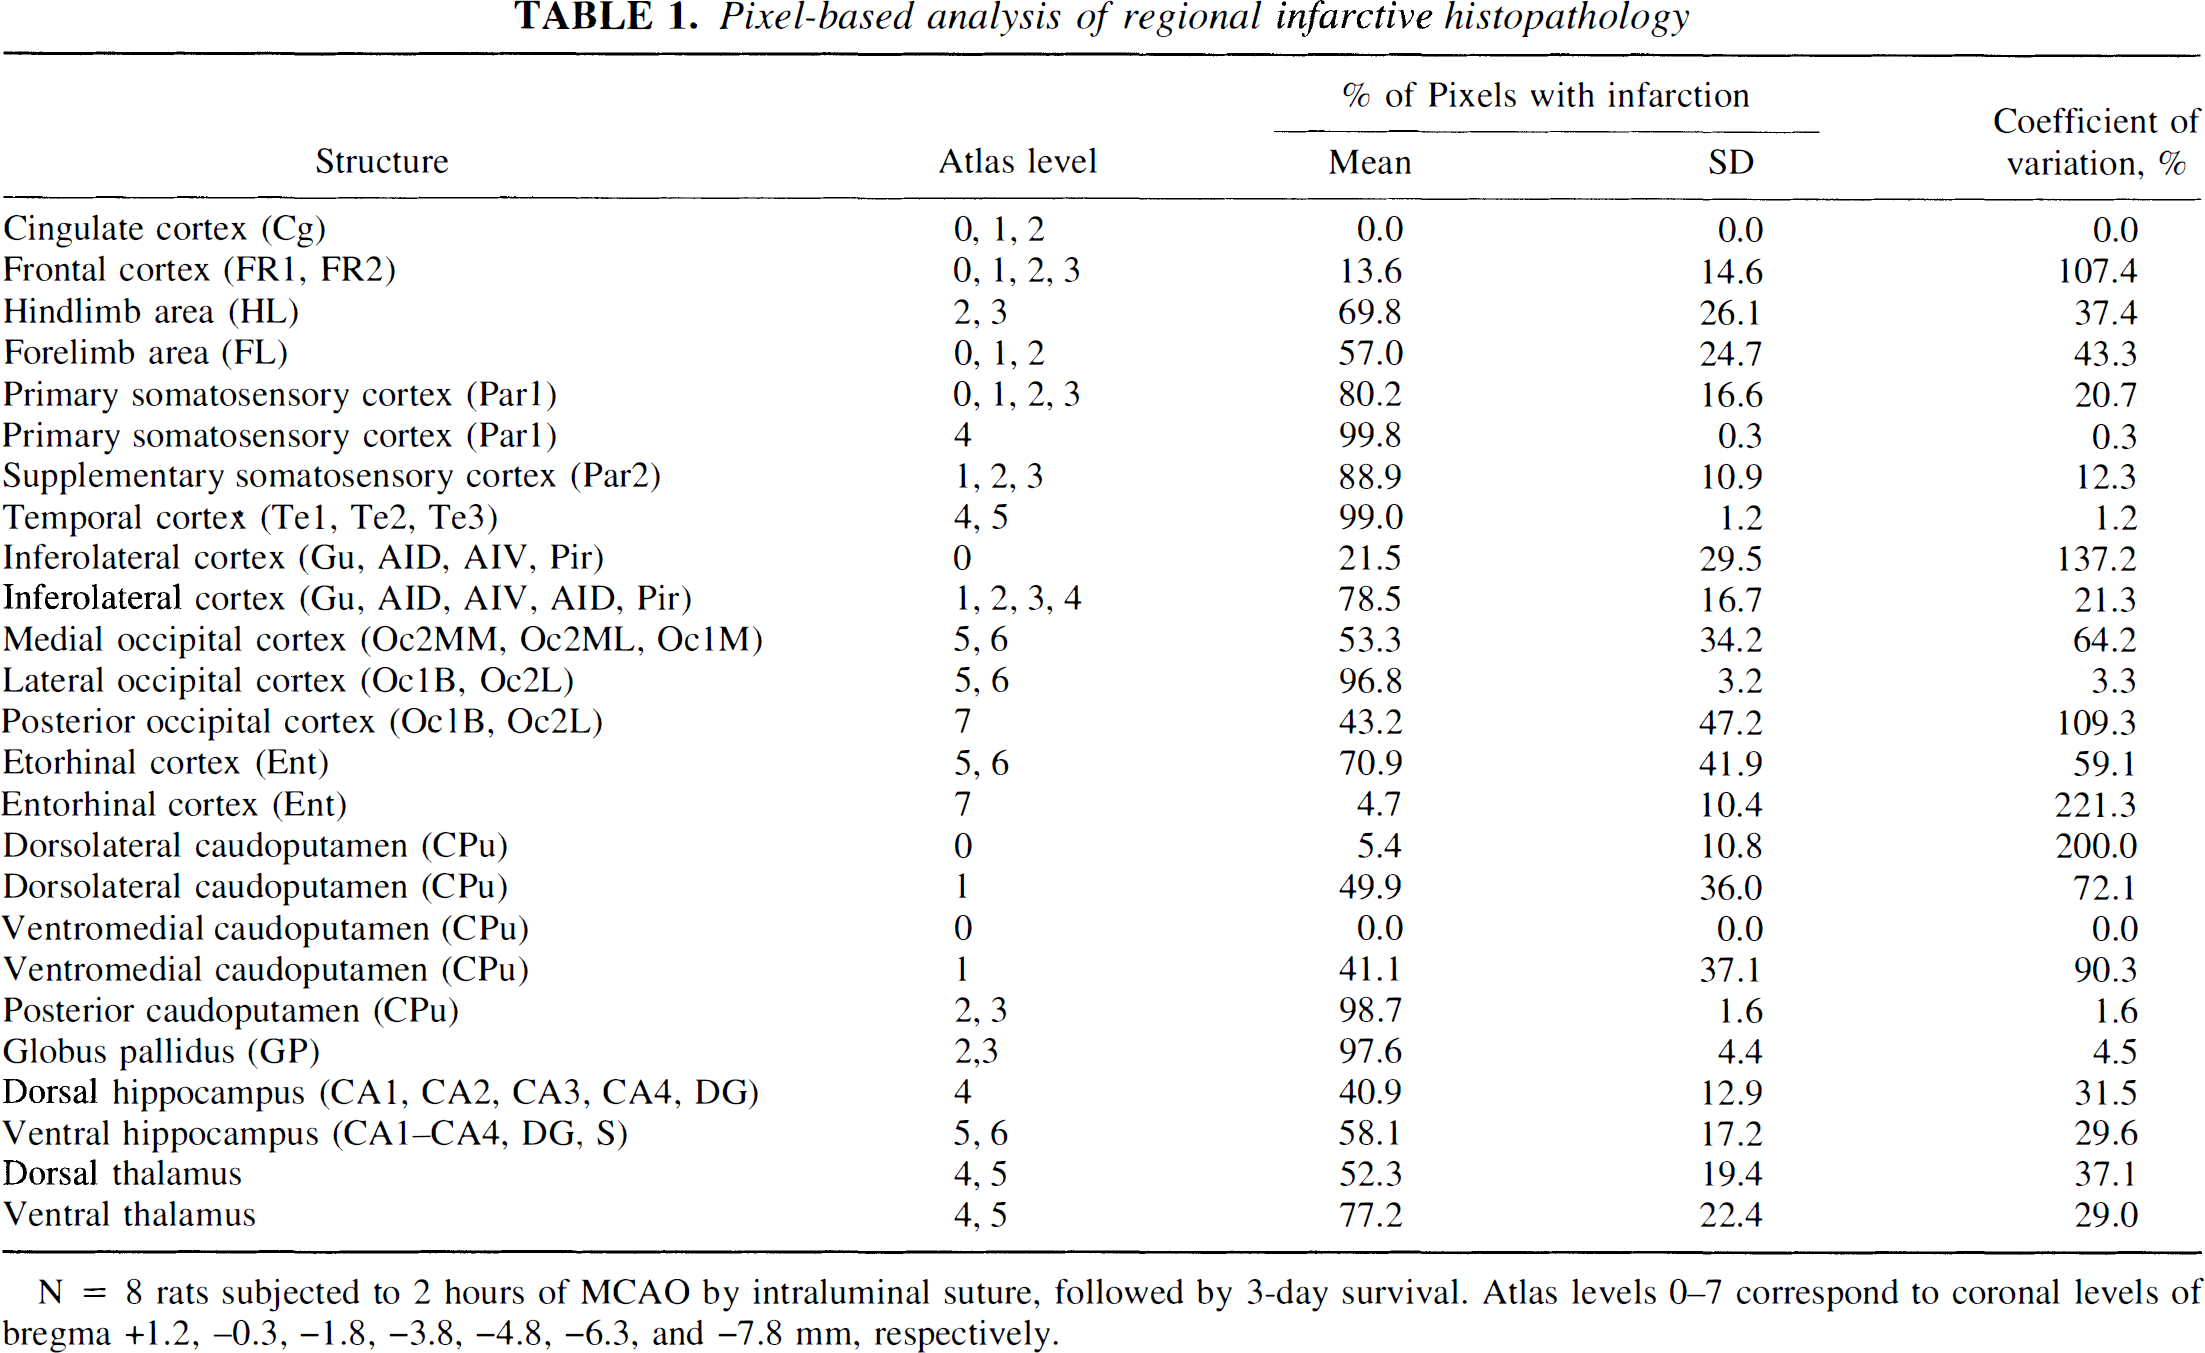
N = 8 rats subjected to 2 hours of MCAO by intraluminal suture, followed by 3-day survival. Atlas levels 0–7 correspond to coronal levels of bregma +1.2, −0.3, −1.8, −3.8, −4.8, −6.3, and −7.8 mm, respectively.
Correlation of histopathology with alterations of local blood flow and glucose utilization
Using the aggregate histological infarct-frequency data set (Fig. 1), we analyzed all right-hemisphere pixels at the 8 chosen coronal levels to determine the distribution of LCBF within those pixels after 2 hours of MCAO. These data are shown in Fig. 3A. A sharp LCBF distribution peak was evident at 0.14 mL/g/min, together with gradually diminishing numbers of pixels with higher LCBF values, which extended into the normal range. One-half of all right-hemisphere pixels had LCBF below 0.30 mL/g/min.
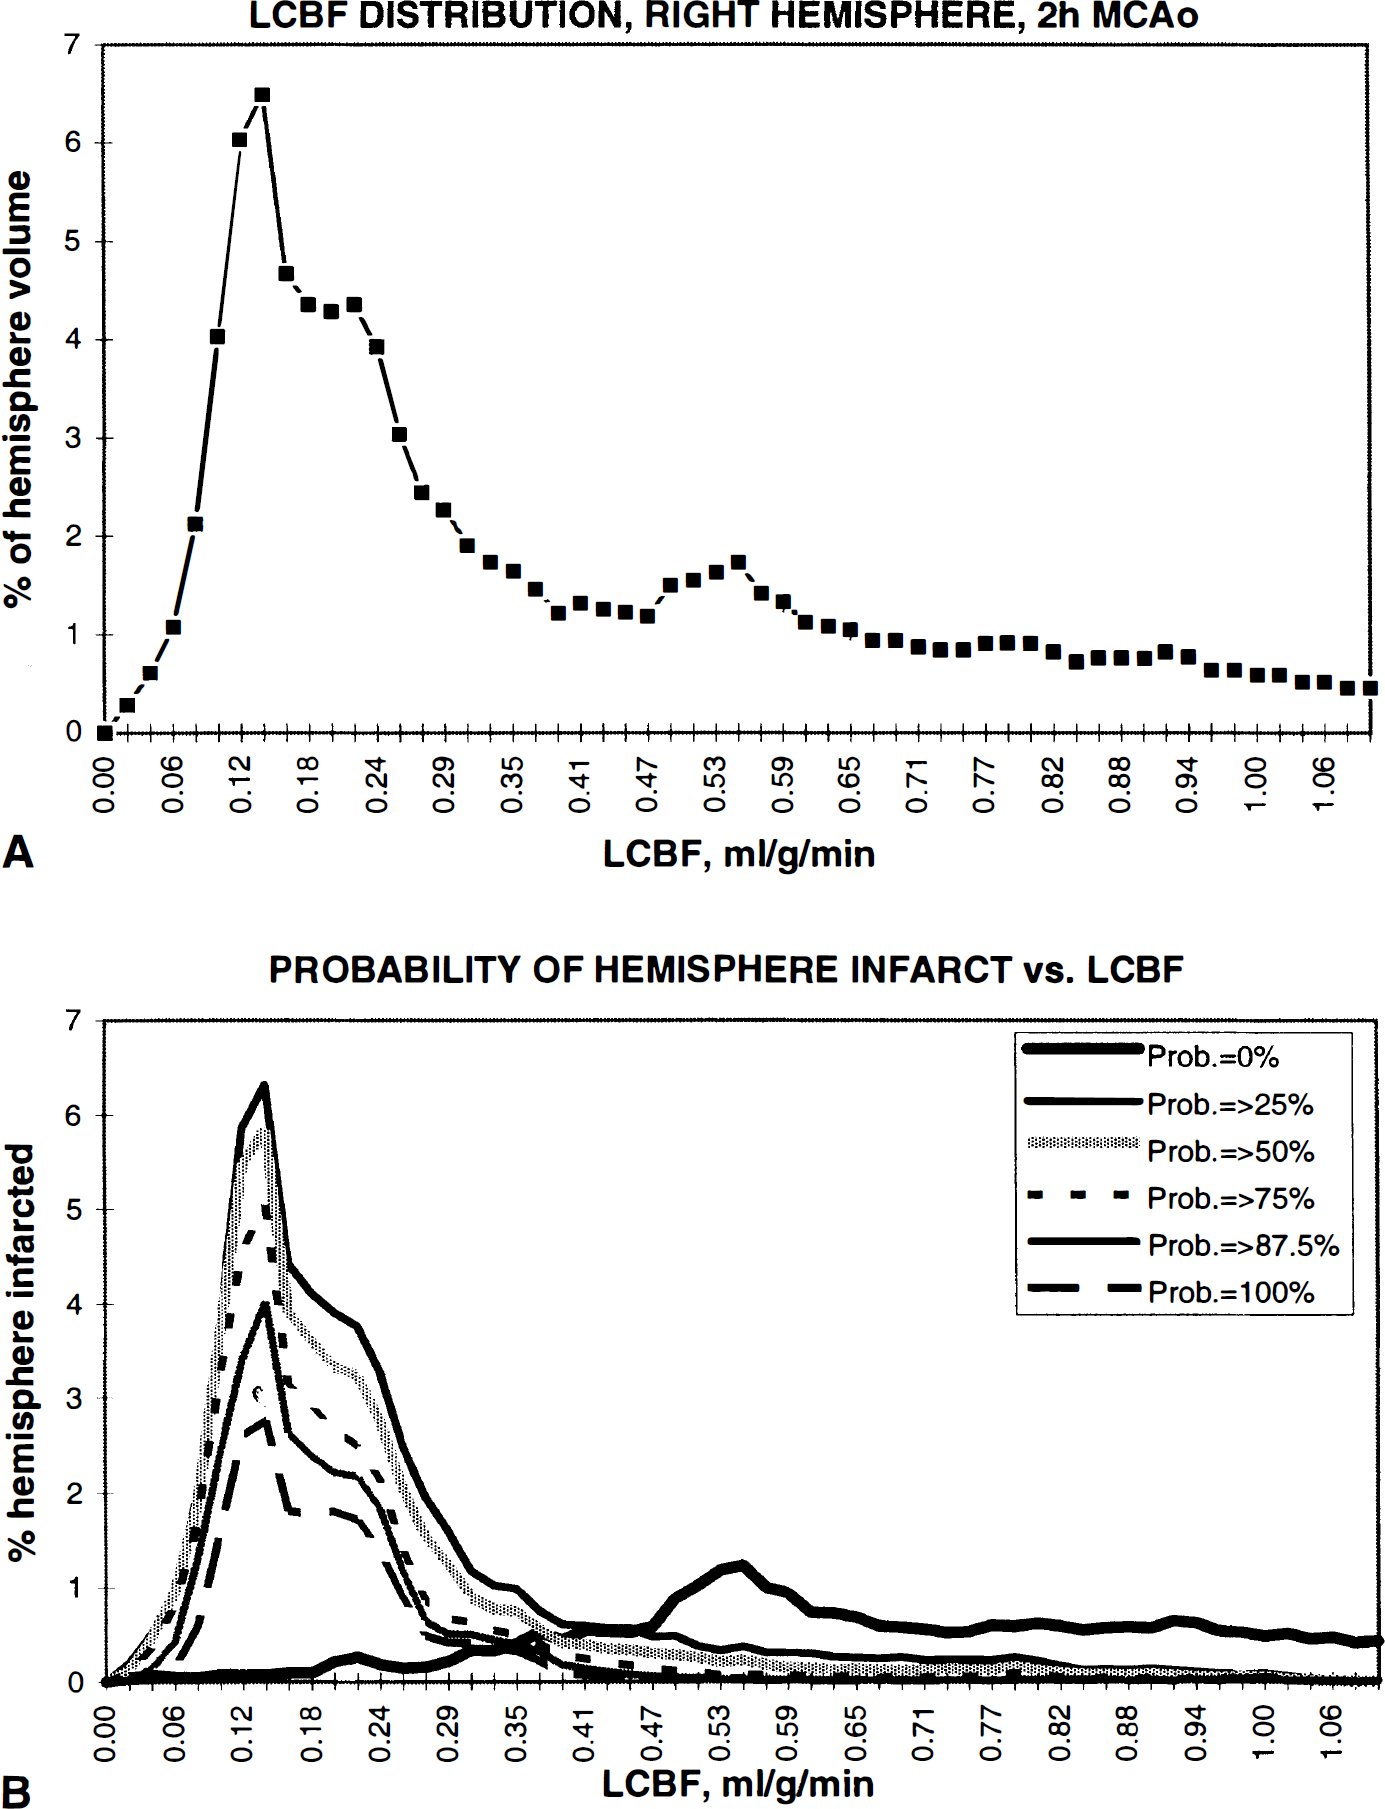
(A) Distribution of average LCBF in right-hemisphere pixels at the eight coronal levels of the aggregate histopathology data set chosen for analysis. The LCBF distribution peak is at 0.14 mL/g/min, followed by a broad plateau within the penumbral and normal ranges. One-half of right-hemisphere pixels have average LCBF below 0.30 mL/g/min. (B) Pixel-based analysis of infarct extent (expressed as a percentage of right-hemisphere pixels) as a function of LCBF measured at 2 hours of MCAO. Data are plotted for various right-hemisphere pixel subsets, defined according to their respective probabilities of showing infarction. (For example, the 100% probability curve corresponds to that pixel subset showing infarction in 8 of 8 rats studied histologically; the “=>25%” probability curve corresponds to those pixels showing infarction in at least 2 of 8 rats; etc.) The contours of all the non-zero probability curves mirror that of the LCBF distribution itself (top panel) within the ischemic range; these curves decrease steeply above an LCBF value of 0.22 to 0.24 mL/g/min.
Figure 3B depicts the relationship between LCBF at 2 hours of MCAO and the extent of infarction within various right-hemisphere pixel subsets defined on the basis of their respective frequency of infarction (ranging from 0 of 8 rats, or 0% probability of infarction, to 8 of 8 rats, or 100% probability of infarction). For each of the non-zero-probability pixel subsets in Fig. 3B, the extent of infarction (expressed as a percentage of total right-hemisphere pixels) precisely mirrored the ischemic portion of the LCBF distribution (Fig. 3A), and each showed an LCBF peak at 0.14 mL/g/min and a broader “shoulder” extending to an LCBF value of 0.22 to 0.24 mL/g/min. Above that LCBF level, the extent of infarction decreased steeply.
We conducted a similar pixel-based analysis to relate histological infarction to LCMRglc measured at ~1 hour of recirculation after 2 hours of MCAO. These data are shown in Fig. 4. Within the previously ischemic right hemisphere, LCMRglc values were distributed bimodally, with a major peak at 22 μmol/100 g/min, and a minor peak at 34 to 35 μmol/100 g/min. As is evident in Fig. 4B, the major LCMRglc peak corresponded exactly to those pixels with a non-zero probability of undergoing histological infarction. By contrast, those pixels with a zero probability of infarction had a modal LCMRglc value corresponding to the 34 to 35 μmol/100 g/min peak but subsumed, as well, a range of lower and higher values. Nonetheless, by ~1 hour of recirculation, those pixels destined for infarction had, by and large, a substantially lower modal value of LCMRglc (by 12 to 13 μmol/100 g/min) than those pixels destined to survive without infarction.
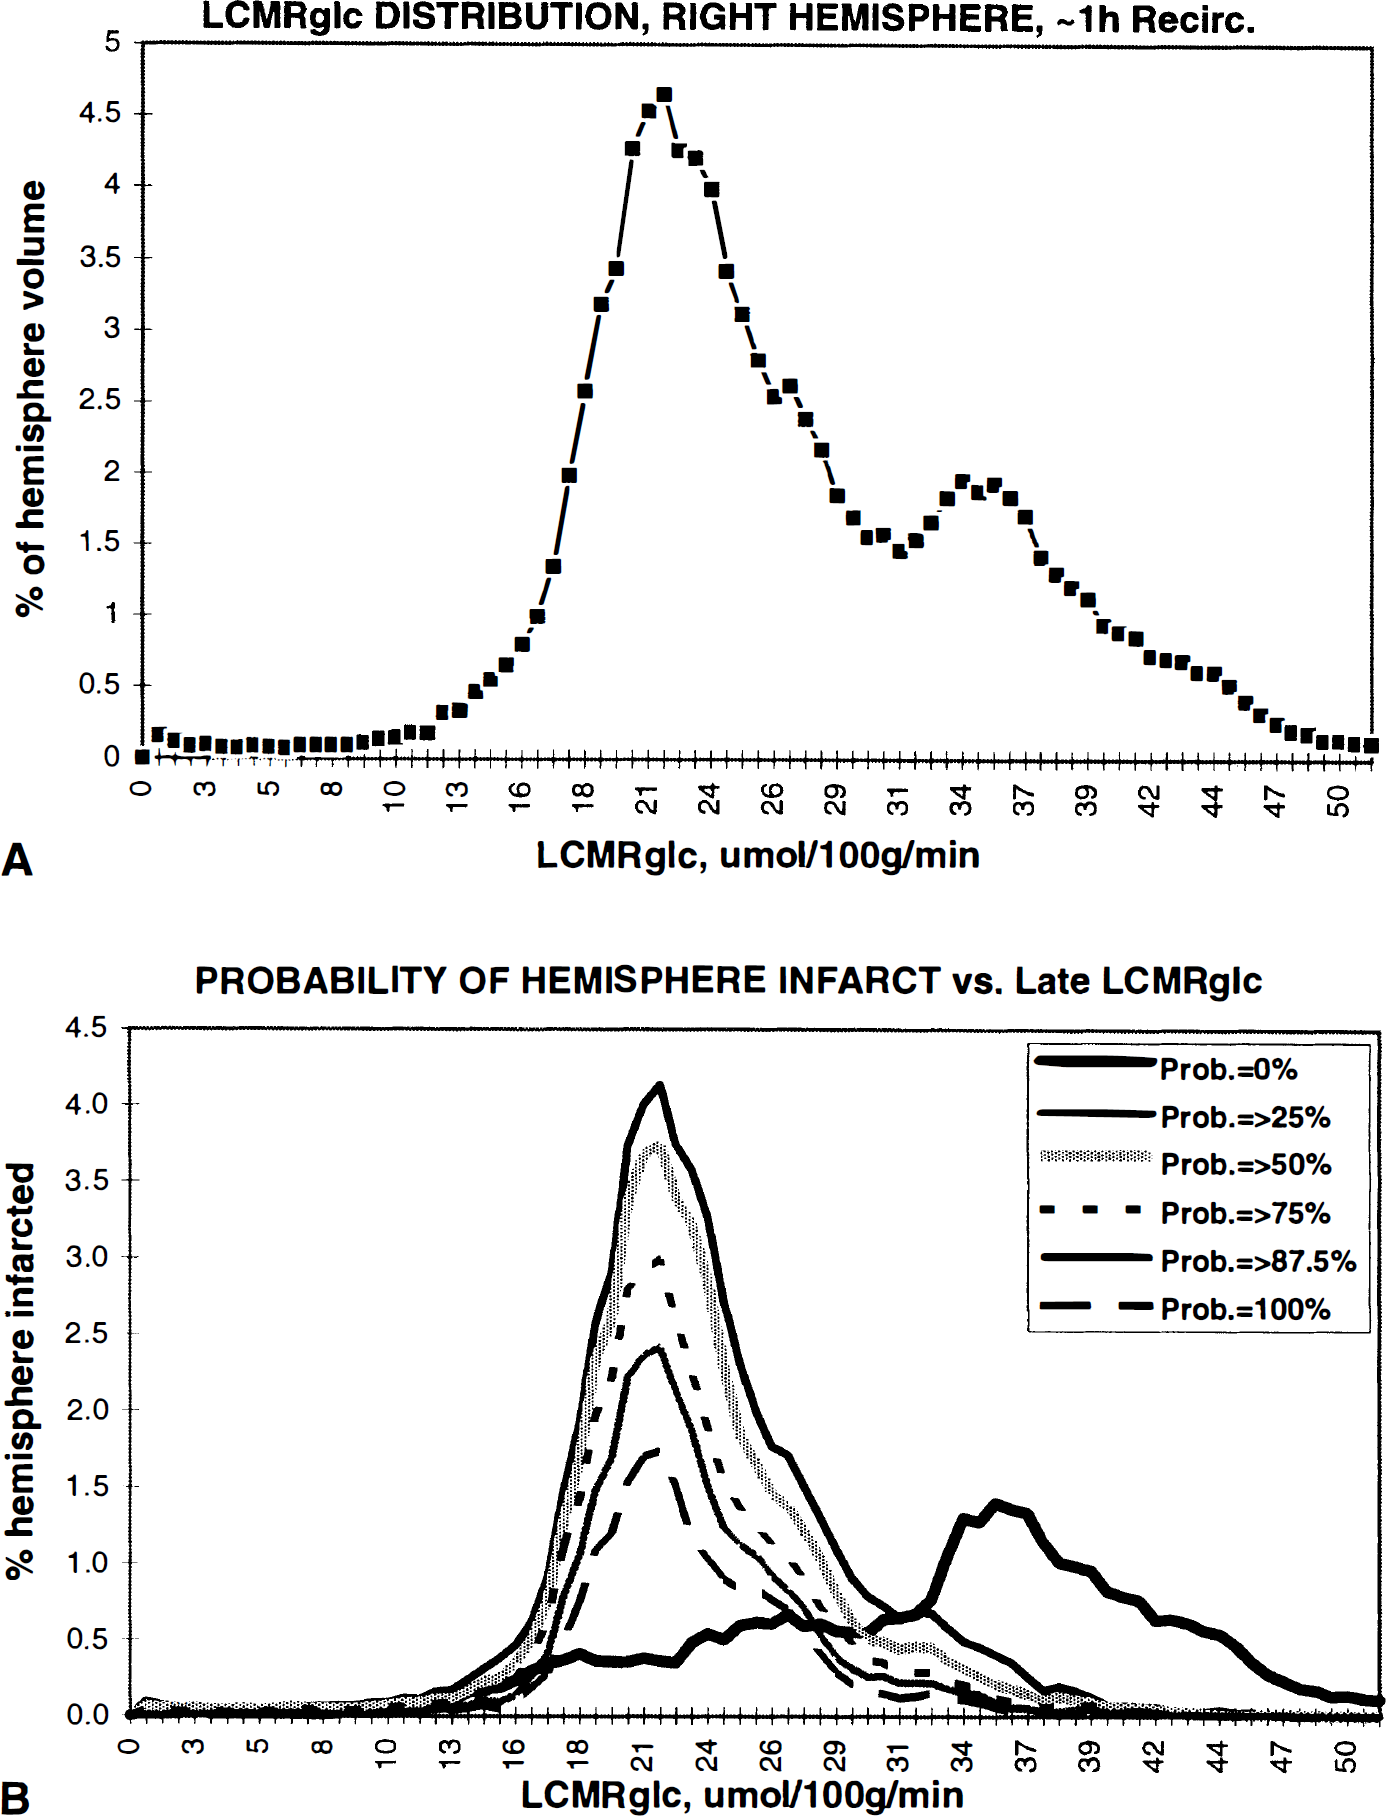
(A) Distribution of LCMRglc measured at ~1 hour of recirculation after 2 hours of MCAO in right-hemisphere pixels at the eight coronal levels selected for histological analysis. LCMRglc is distributed bimodally: the major peak is centered at 22 μmol/100 g/min, and the minor peak at 34 to 35 μmol/100 g/min. (
These data were used as a basis for an analysis of cumulative infarction frequency as a function of LCBF at 2 hours of MCAO, and of LCMRglc at ~1 hour of postishemic recirculation. These curves are shown in Fig. 5. Of all pixels destined to undergo infarction (weighted data from n = 8 rats), 70% had LCBF values at 2 hours of MCAO of 0.24 mL/g/min or below (the level defined as the upper limit of the ischemic core in the companion study [Belayev et al., 1997]); and 89% of pixels had LCBF values of 0.47 mL/g/min or below (the level chosen as the upper limit of the ischemic penumbra). As shown in Fig. 5B, by ~1 hour of postischemic recirculation, the majority of pixels destined for infarction showed a narrow range of glucose utilization: 50% of pixels destined to undergo infarction had LCMRglc of 22 μmol/100 g/min or below; and 90% had LCMRglc values of 31 μmol/100 g/min or below.
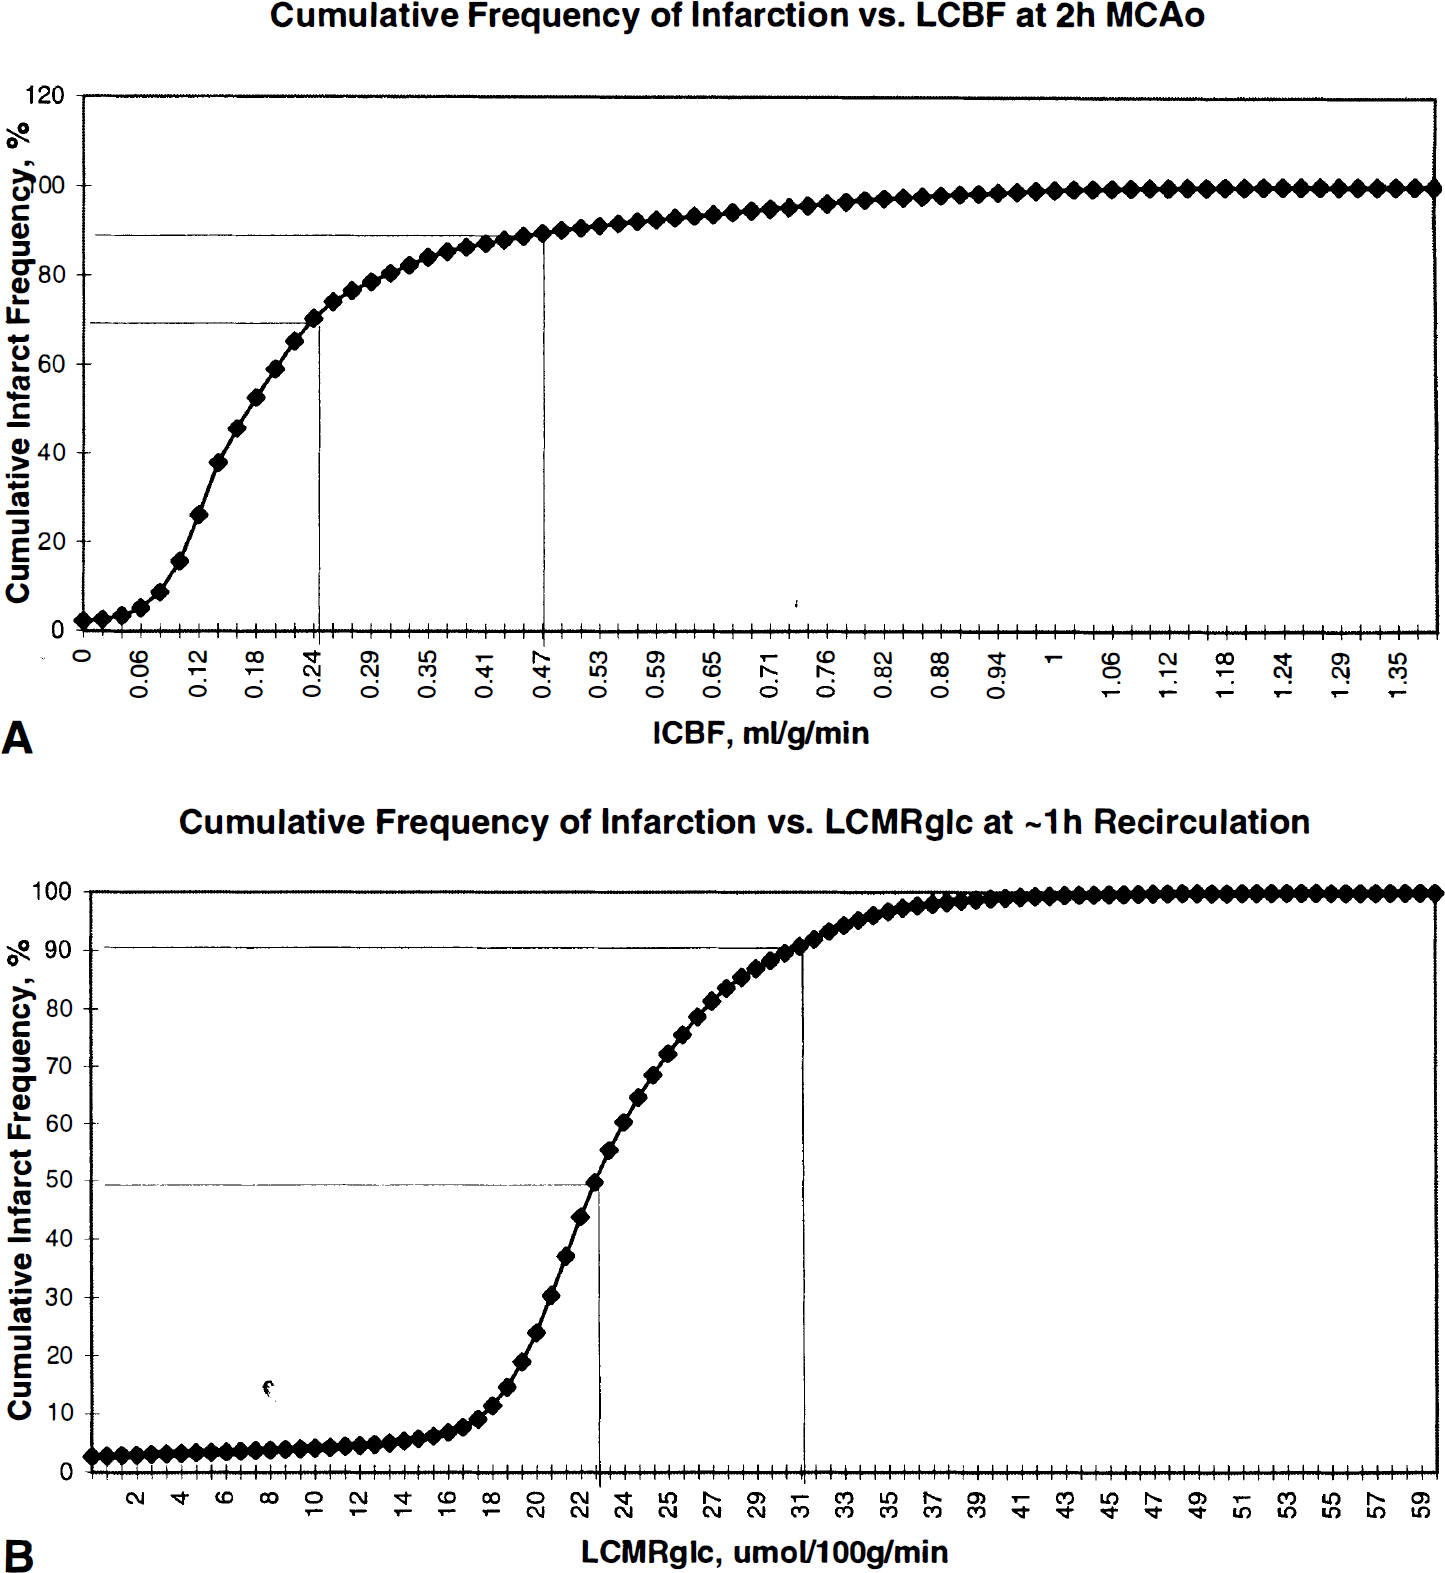
Cumulative frequency plots of infarction within right-hemisphere pixels at eight coronal levels, plotted versus average LCBF measured at 2 hours of MCAO (
The above analysis thus establishes a narrow range of LCBF during MCAO that predicts histological infarction. Furthermore, those pixels destined to undergo infarction showed substantially depressed levels of LCMRglc by ~1 hour of recirculation—values that distinguished them from those right-hemisphere pixels destined to survive without infarction. Figure 6 presents a three-dimensional pixel-based plot of the extent of infarction as a function both of LCBF at 2 hours of MCAO and of LCMRglc at ~1 hour of postischemic recirculation. The narrow range within which infarction occurs is readily evident.
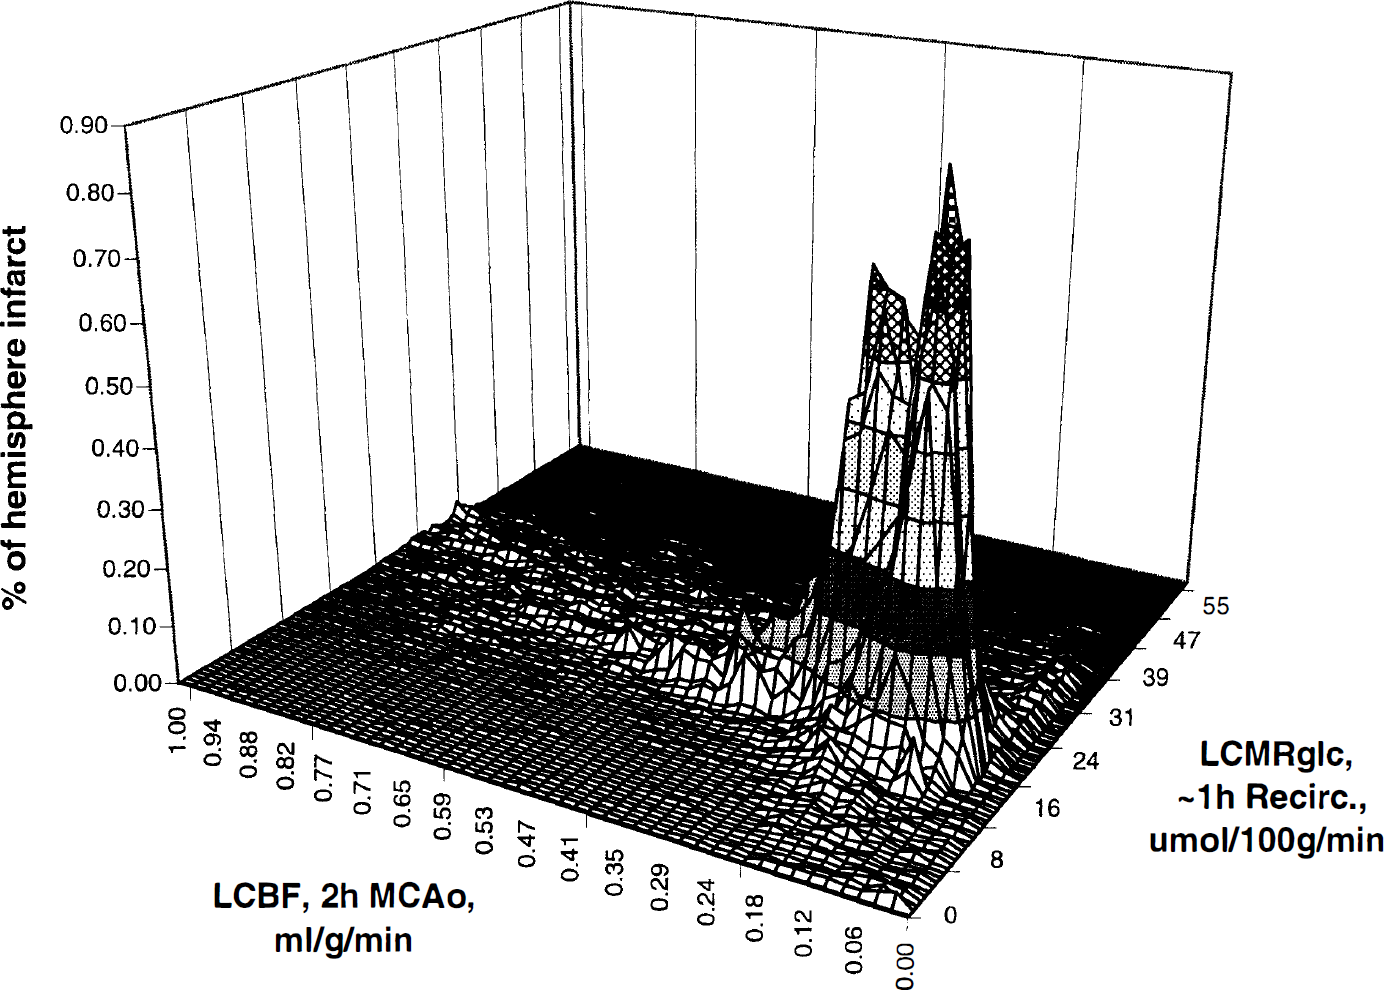
Three-dimensional pixel-based plot of histological infarction as a function both of LCBF measured at 2 hours of MCAO, and of LCMRglc measured at ~1 hour of recirculation. All right-hemisphere pixels showing infarction were used for this analysis and were weighted by their infarction frequency and expressed as a percentage of total infarcted pixels in the 8 rats analyzed histologically. The magnitude of the distributional peak shown in this figure reflects the overwhelming probability that pixels destined for infarction will have early LCBF within the ischemic-core or low penumbral ranges. However, there is a plateau of considerably lower infarction probability, amounting to about 10% of the total infarcted pixels, extending to somewhat higher CBF levels.
DISCUSSION
In this study, we report a novel and powerful pixel-based strategy for the correlative analysis of ischemic histopathology vis-a-vis antecedent hemodynamic and metabolic events, taking advantage of a highly reproducible method of transient MCAO combined with sophisticated multimodal image-processing. Our results build on several previous reports of the distribution and time course of light-microscopic histopathological alterations in models of MCAO by intraluminal suture (Zea Longa et al., 1989; Nagasawa and Kogure, 1989; Memezawa et al., 1992a, 1992b; Garcia et al., 1995; Bartus et al., 1995). In a different model of focal ischemia in rats, Hakim et al. (1992) have introduced an image-based strategy resembling that of the current study, to relate histopathology to local blood flow alterations.
Correlation of local blood flow with histopathology
Local blood flow at 2 hours of MCAO proved to be a robust predictor of eventual histological infarction in this study. The distribution of pixels destined to develop infarction showed a prominent LCBF peak centered at 0.14 mL/g/min and extending to approximately 0.35 mL/g/min (Fig. 3B), whereas right-hemisphere pixels with zero probability of infarction had substantially higher LCBF (modal values 0.5 to 0.6 mL/g/min, Fig. 3). The cumulative frequency plot of Fig. 5A indicates that only 4% of pixels destined not to infarct had early LCBF values at or below 0.24 mL/g/min—corresponding to the range of the ischemic core as defined in the companion study (Belayev et al., 1997); and that another 14% of pixels escaping infarction had early LCBF values within the range of 0.24 to 0.47 mL/g/min, corresponding to our definition of the ischemic penumbra in the earlier study. Thus, while the probability of noninfarction is very low for pixels within the ischemic-core LCBF range, it is more substantial for penumbral pixels.
The above analysis thus indicates that the histological fate of brain regions having 2 hours of MCAO LCBF within the penumbral range (i.e., 0.24 to 0.47 mL/g/min) is heterogeneous. At LCBF values below 0.35 mL/g/min at 2 hours of MCAO, the probability of escaping infarction altogether was low (8%), whereas an additional 9% to 10% of pixels in the upper-penumbral flow range (0.35 to 0.47 mL/g/min) completely failed to show infarction. As indicated in Fig. 3B, the likelihood that a given brain region would show infarction in 25% or more of rats declined very sharply even at LCBF values above 0.25 mL/g/min. This analysis points out that subtle LCBF differences (amounting to just 0.1 to 0.2 mL/g/min) within the early hemodynamic penumbra exert a very great influence on the probability of infarction.
Our companion study (Belayev et al., 1997) demonstrated that the early ischemic core and penumbra, as defined by LCBF criteria, constituted 56% and 44% of the total hemodynamic lesion, respectively. By contrast, the present histological results in 8 rats (Fig. 5A) show that 70% of pixels destined for infarction have early LCBF values in the ischemic-core range; another 19% are in the penumbral range; and the remaining 11% are at suprapenumbral levels. These percentages reinforce the concept that the fate of the penumbra is variable and highly dependent on the precise level of early LCBF.
Correlation of local glucose utilization with histopathology
Local glucose utilization at ~1 hour of recirculation after 2 hours of MCAO showed a strongly bimodal distribution (Fig. 4), with the major LCMRglc peak centered at 22 μmol/100 g/min and extending from approximately 16 to 30 μmol/100 g/min. This peak corresponded exactly to those pixels undergoing infarction in the matched histological series. Although a minority of pixels in the 16 to 30 μmol/100 g/min range escaped infarction, most noninfarcted pixels had appreciably higher LCMRglc values, centered at 34 to 36 μmol/100 g/min. This bimodal behavior of LCMRglc strongly suggests that depressed glucose utilization, even when present as early as ~1 hour of recirculation after 2 hours of MCAO, is a strong predictor of eventual infarction in the setting of focal ischemia. A shown in Fig. 5B, 90% of infarcted pixels had LCMRglc values of 31 μmol/100 g/min or below at this time point.
The spectrum of ischemic histopathology
We have confined our attention in the current study to an analysis of infarctive histopathology, i.e., regions of pan-necrosis, in which (by definition) all tissue elements are affected. Selective injury to neurons with preservation of the neuropil is also known to occur at the periphery of brain infarcts (Strong et al., 1983)—changes also referred to as “incomplete infarction” (Lassen, 1982), comprising acidophilic neurons with nuclear condensation surrounded by swollen astrocytes (Back et al., 1996). The contribution of selective neuronal injury to the total histological lesion varies according to the precise conditions of the model used. For example, when we compared the histopathologic consequences of photothrombotic distal MCAO in two rat strains, Sprague-Dawley rats had larger and more consistent zones of pan-necrosis but smaller zones of selective neuronal injury (9% of total lesion), while Wistar rats had smaller and more variable cortical infarcts but a greater contribution of selective neuronal injury to the total lesion (30%) (Markgraf et al., 1993). Other workers have described a narrow transition zone of damaged cortical neurons between the infarct margin and normal tissue (Nedergaard, 1987), whose density is determined in part by the magnitude of local CBF decrements (Mies et al., 1983). More pronounced reductions in collateral blood flow result in smaller transition zones showing selective cell loss (see Back et al. (in press) for review).
The cascade of injury mechanisms at play in the acute ischemic penumbra is apparently exquisitely sensitive to small differences in local perfusion (e.g., Takagi et al., 1993). Among these injurious processes are ischemic depolarizations arising in the acute penumbra. In a previous study, the induction of additional depolarizations significantly increased the extent of selective neuronal necrosis produced by MCAO (Alexis et al., 1996; Back et al., 1996). Finally, recent studies have also adduced evidence for apoptosis as a component of neuronal injury in focal ischemia (Linnik et al., 1995; Charriaut-Marlangue et al., 1995; Li et al., 1995; Du et al., 1996). In future studies, we hope to extend our pixel-based correlative analysis to these types of neuronal injury as well.
Neurobehavioral observations
This MCAO model led to a consistent neurobehavioral deficit, with an initially severe disturbance of both visual and tactile placing and a lesser affection of the postural reflex. In individual rats, visual placing and postural reflex scores improved over 24 to 72 hours while tactile placing remained severely disturbed even at 72 hours (Fig. 2). Correspondingly, pixel-based analysis of histological infarction within atlas-defined anatomic structures (Table 1) revealed the primary and supplementary somatosensory cortices to be among the most consistently infarcted loci (percent of pixels infarcted, 80% to 100%).
The behavioral tests used in the current study have been found to be sensitive to asymmetries produced by large unilateral brain lesions (Barth et al., 1990). Forelimb placing deficits have been related to damage the frontoparietal region located between the medial agranular cortex and the primary somatosensory cortex (De Ryck et al., 1992). Tactile/proprioceptive forelimb dysfunction has been attributed to damage to frontal areas Fr1 and Fr3, with some involvement of Fr2 and parietal forelimb areas (terminology based on Zilles, 1985). Sensorimotor dysfunction has been commonly noted in previous studies of focal cerebral ischemia in the rat (Bederson et al., 1986; Markgraf et al., 1992; Wahl et al., 1992), and the magnitude of the behavioral deficits has correlated well with the size of the infarcted area (Bederson et al., 1986; De Ryck et al., 1992; Belayev et al., 1995). Visual placing was initially severely impaired in all rats of this study but recovered partially in some animals over 72 hours (Fig. 2). Correspondingly, occipital cortical regions showed a high incidence of infarction (Table 1).
CONCLUSION
This article establishes the utility of a pixel-based approach for accomplishing a correlative analysis of histopathology, hemodynamics, and metabolism in focal ischemia. The results described are consistent with the view that the precise LCBF decrements present during a 2-hour period of MCAO strongly determine the subsequent distribution of infarctive histopathology, and that tissue regions destined to undergo infarction become evident as early as ~ 1 hour of postischemic recirculation by virtue of having levels of local glucose utilization substantially below those zones destined to survive. Our finding of a large, consistent zone of infarction following just 2 hours of MCAO in a suture-occlusion model supports the findings of Memezawa et al. (1992b), who described striatal infarcts and selective cortical necrosis after 30 minutes of MCAO; and consistent cortical infarcts with 60 minutes MCAO, which increased in size when the duration of MCAO was extended to 2 to 3 hours. Other workers, using other focal-ischemia models in rats, have substantiated that a 3 to 4 hour period of MCAO produces infarcts as large as those resulting from permanent vascular occlusion (Kaplan et al., 1991; Buchan et al., 1992). The fact that a large, consistent infarct was seen in the current study after only 2 hours of MCAO may be abetted, in part, by the constrained nature of postischemic cortical recirculation in this model (Belayev et al., 1997).
Footnotes
Acknowledgments
The authors thank Ms. Susan Kraydieh for her superb preparation of histological material, and Mr. David W. Smith for his outstanding computer-system support.