
Abstract
Intermittent peri-infarct depolarizations (PID), which spread from the vicinity of the infarction over the cortex, have been reported in focal ischemia. These depolarizations resemble cortical spreading depression except that they damage the cortex and enlarge the infarct volume possibly because of compromised oxygen delivery. The main purpose of this study was to evaluate the noninvasive technique of near-infrared spectroscopy (NIRS) for the identification of PID and to evaluate its capability for further pathophysiological studies. We used male barbiturate-anesthetized Wistar rats (n = 10) in which middle cerebral artery occlusion had been performed with a surgical thread. Middle cerebral artery occlusion resulted in a drop in parietally measured regional cerebral blood flow (laser Doppler flowmetry) to 31 ± 8% of baseline flow. Six ± 4 minutes after the induction of focal ischemia, 5 ± 2 direct current deflections were recorded during a one-hour measurement period which may be regarded as PID. Measuring regional cerebral blood oxygenation changes with a NIRO 500 revealed dynamic concentration changes in the three chromophores oxyhemoglobin [HbO2], deoxyhemoglobin [Hb], and the oxidized form of cytochrome aa3 [CytO] during PID. Typically, an initial slight decrease of [HbO2] (−6.1 ± 1.7 arbitrary units [AU]) and an increase of [Hb] (+1 1.5 ± 7.7 AU) were followed by an increase of [HbO2] (+10.8 ± 4.7 AU) and a decrease of [Hb] (−4.7 ± 5.5 AU); [CytO] decreased during the depolarizations (−2.0 ± 1.2 AU). We conclude that NIRS can detect typical PID-associated changes in blood oxygenation. We hypothesize that during the course of PID, unlike “normal” spreading depression, hypoxygenation precedes hyperoxygenation of the microcirculation in a given cortex volume as the depolarization wave propagates through hemodynamically compromised to intact tissue. This would accord with the known damaging effect of PID. The NIRS “fingerprint” of PID encourages the search for PID during early stroke in patients.
Keywords
In focal cerebral ischemia, peri-infarct depolarizations (PID) resembling cortical spreading depression have been observed, the majority of which originate at the core of the evolving infarction whereas others may be elicited by independent foci of low regional cerebral blood flow (rCBF) within the ischemic border (Nedergaard and Hansen 1993). Peri-infarct depolarizations have been shown to enlarge the infarct volume at the cost of the surrounding tissue, i.e., the penumbra (Back et al., 1996; Mies et al., 1993). However, during spreading depression in a normally perfused brain, the massive and sustained depolarization of most parenchymal cells causes no tissue damage (Nedergaard and Hansen 1988). A major difference between these two electrophysiologically similar phenomena is the respective capability of the tissue to increase the rCBF in response to each. Thus, the damaging mechanism in PID is likely to be based on a discrepancy between oxygen demand and supply. It has been shown previously that PID is accompanied by a significant decrease of tissue oxygen partial pressure (Back et al., 1994).
The specific interest in near-infrared spectroscopy (NIRS) derives from its noninvasive data acquisition, which allows its use in humans, and the potential for measuring the redox state of cytochrome oxidase, the final enzyme cytochrome aa3 of the respiratory chain.
METHODS
We used male Wistar rats weighing 280 to 320 g (n = 10). The animals were anesthetized intraperitoneally with pentobarbital (100 mg per kg body weight). After tracheotomy, they were ventilated (Effenberger small animal ventilator, Pfaffingen, Germany) and end-expiratory CO2 was monitored (Heyer Artema MM204, Sweden). Body temperature was kept at 37.5 ± 0.5°C using an electrical heating pad. The femoral artery and vein were cannulated to allow continuous monitoring of mean arterial blood pressure (RFT Biomonitor, Zwönitz, Germany); intermittent sampling of arterial blood gases (AVL Compact I, Graz, Austria)‘; and continuous infusion of saline (1 mL per hour). With the animal in a supine position, the right common carotid artery was carefully exposed, and a piece of tubing (PVC, outer diameter 1.3 mm) was inserted and fixed. A surgical thread (vicryl) with a blunted tip (diameter 0.3 mm) was introduced and advanced into the base of the skull for later occlusion of the middle cerebral artery (Nagasawa and Kogure, 1989; Longa et al., 1990). Next, the animal was carefully rotated into a prone position and fixed in a stereotaxic frame. The scalp was partially removed. With a saline-cooled drill, a parietal burr hole was drilled for epidural measurement of DC-potential by a calomel electrode (differential voltage meter WPI, FD223, Sarasota FL, U.S.A.).
The sending and collecting fiber optodes (optical diameter 3.4 mm) of a four-wavelength near-infrared spectrometer (NIRO 500, Hamamatsu Photonics, Japan) were placed adjacent to the calomel electrode (probe position see Figs. 1 and 2). The technique of NIRS has previously been described in detail (Villringer et al., 1993).
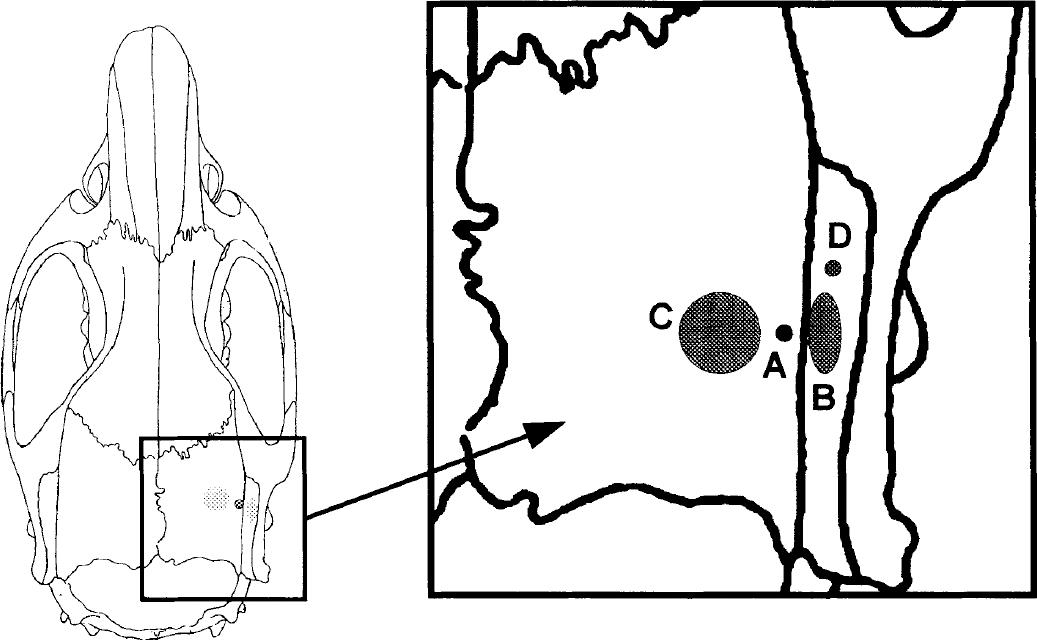
Probe positioning on the skull (schematic).
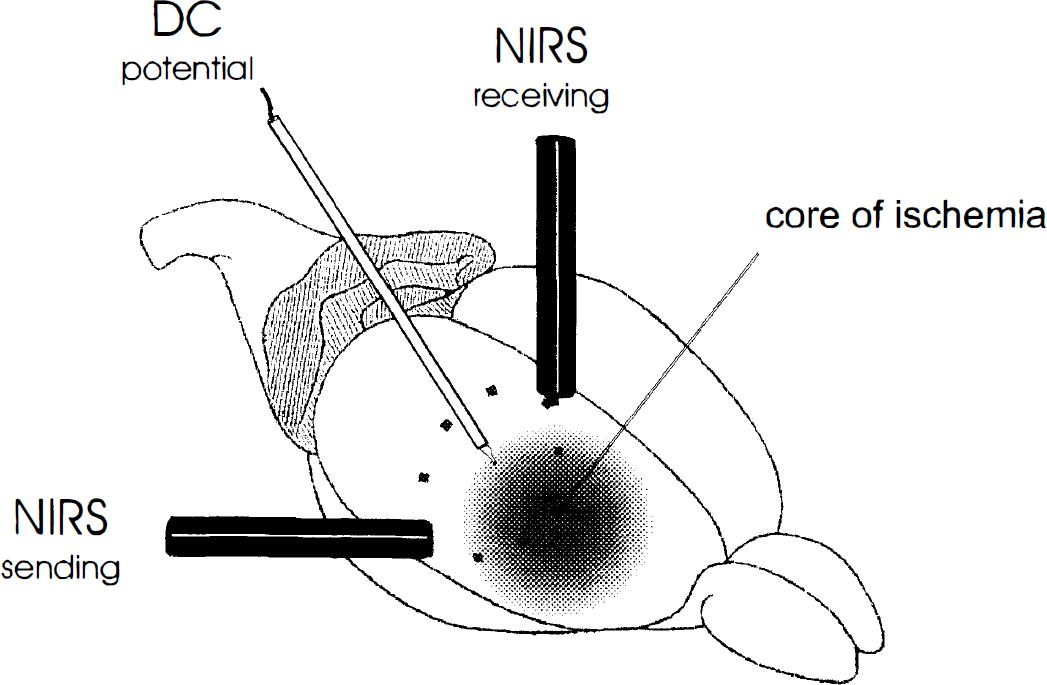
Schematic view of the optical geometry of NIRS in the experimental setup. The high sampling volume includes parts of the core and the penumbra of ischemia as well as uncompromised tissue. Because only changes of concentration are recorded by NIRS, only the tissue that is affected by peri-infarct depolarizations (PID) contributes to the recorded signal. This may explain the change of pattern to that of normal spreading depression when the PID enters the uncompromised tissue. Direct current potential; NIRS, near-infrared spectroscopy.
The vicryl thread was advanced during monitoring of ipsilateral parietal rCBF with a temporal laser Doppler probe (Vasamedics BPM2, St. Paul, Minneapolis, U.S.A.) until a rapid decrease was observed (rCBF was determined as relative change compared with the baseline that defines 100%). Because laser Doppler flowmetry and NIRS interfere with each other, measurement was switched to NIRS immediately after ischemia was established with laser Doppler flowmetry. During the 60 minutes after switching, we monitored regional cerebral blood oxygenation changes (rCBO), i.e., relative concentration changes of the three relevant chromophores oxyhemoglobin, the deoxyhemoglobin, and the mitochondrial cytochrome aa3 in its oxidized state. Near-infrared spectroscopy data were measured in arbitrary units as maximum deflections from the baseline. Data were obtained every 2.5 seconds using a personal computer and ASYST data acquisition software (Macmillan). All quantitative data are expressed as means ± standard deviation.
RESULTS
The physiological variables of the animals were kept within normal ranges throughout the experiment (Table 1). Advancing the vicryl thread resulted in a decrease in rCBF to 31 ± 8% of the baseline. Six ± 4 minutes after middle cerebral artery occlusion, a negative deflection of the epidural DC-potential by 10 to 30 mV was observed. Within 1 hour, 5 ± 2 further steep transient negative DC-deflections of 5 to 10 mV followed. During these transient depolarizations (PID), an increase of deoxyhemoglobin was evident, frequently accompanied by an initial decrease in oxyhemoglobin. Within a minute or two, this pattern gave way to a relative increase of oxyhemoglobin and decrease of deoxyhemoglobin (Fig. 3). Oxidized cytochrome aa3 always decreased during PID (−2.02 ± 1.20). A recording of subsequent PID is shown in Fig. 4.
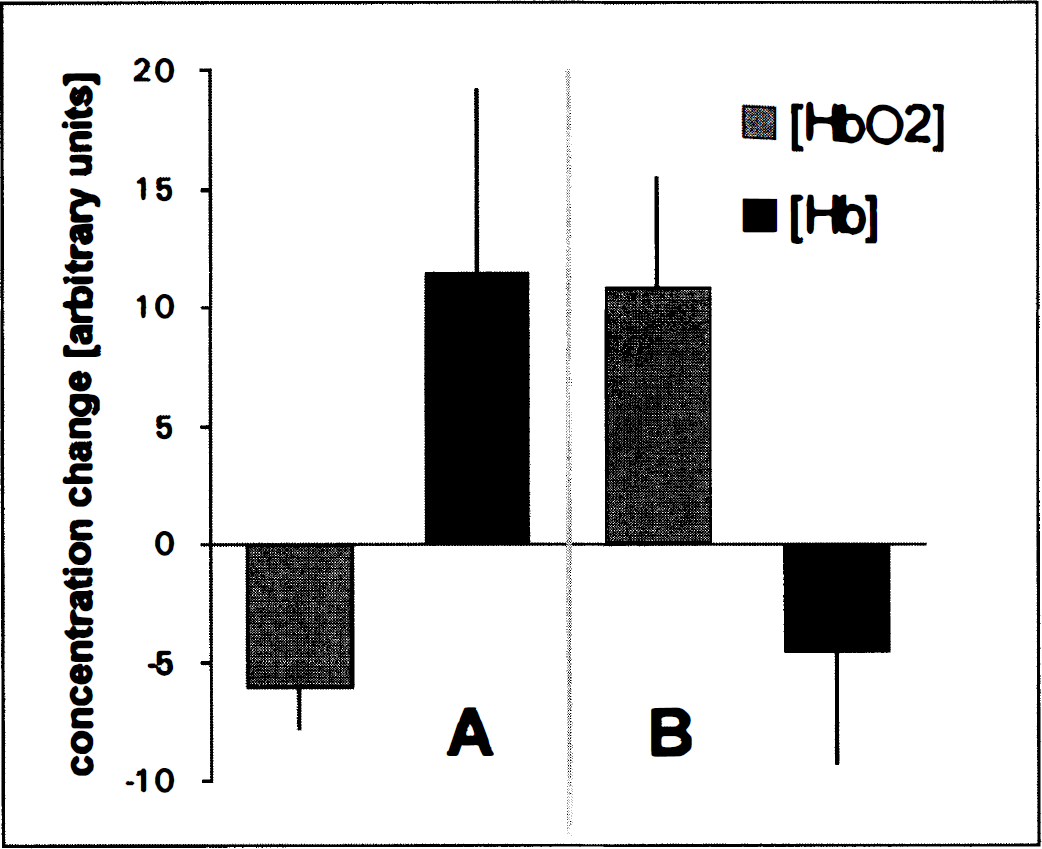
Mean values (±SD) of the changes in regional blood oxygenation during PID in nine barbiturate-anesthetized Wistar rats. The first column gives the decrease of oxyhemoglobin and increase of deoxyhemoglobin (second column) during the first phase
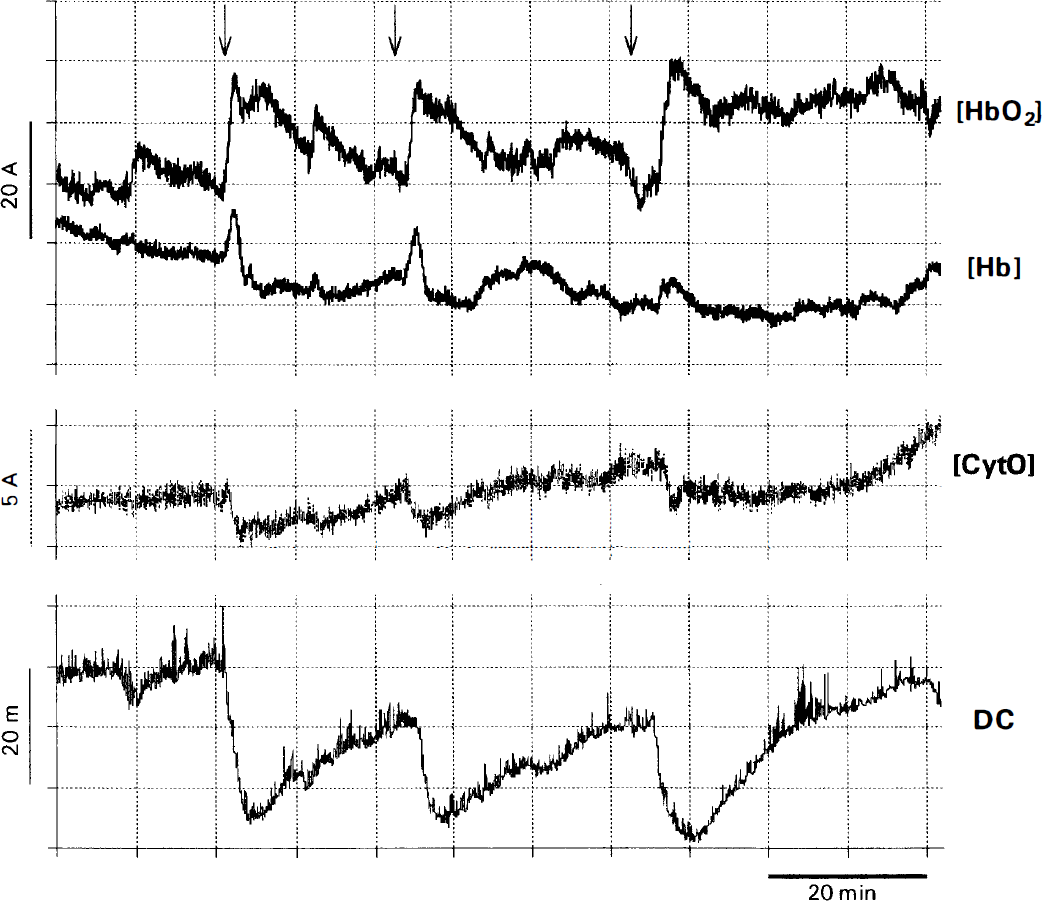
Recording of subsequent PID in NIRS (upper 3 traces) with the corresponding DC-potential deflections (lower trace). The concentration changes of the chromophores are given in arbitrary concentration units (the arrows indicate the initial decrease of oxyhemoglobin). The ordinate gives no information about the actual concentrations but indicates dynamic concentration changes. Slow baseline shifts over many minutes occur also without any stimulation. [CytO], the oxidized form of cytochrome aa3; DC, direct current; [Hb] deoxyhemoglobin; [HbO2], oxyhemoglobin.
Physiological data
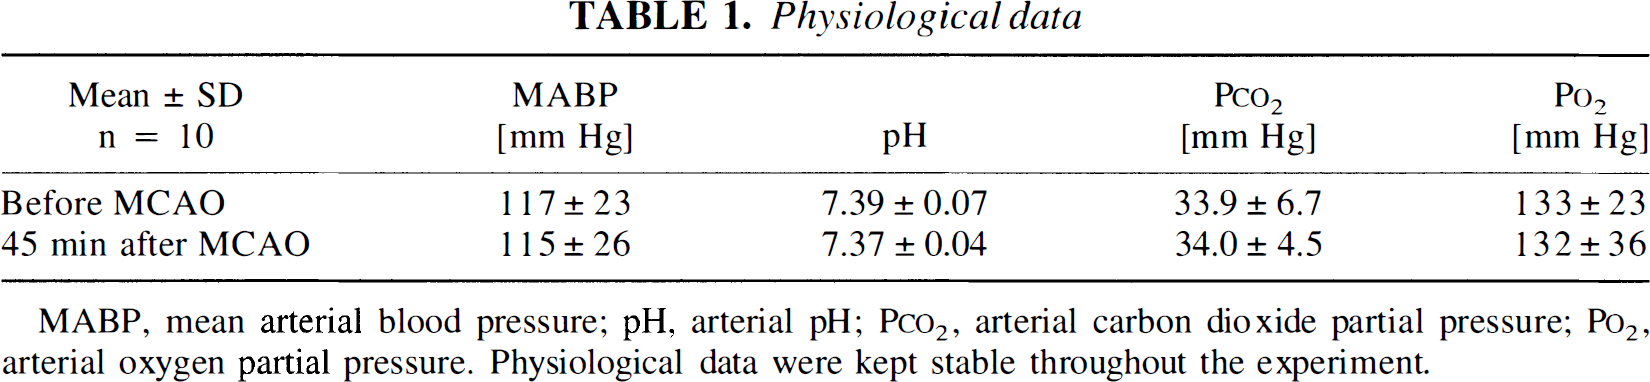
MABP, mean arterial blood pressure; pH, arterial pH; P
DISCUSSION
During PID, it was possible to monitor rCBO changes using NIRS. The pattern of rCBO changes differs from that previously reported in normal spreading depression (Wolf et al., 1996) (Fig. 5). Hence, we find that NIRS allows the two experimental phenomena to be distinguished.
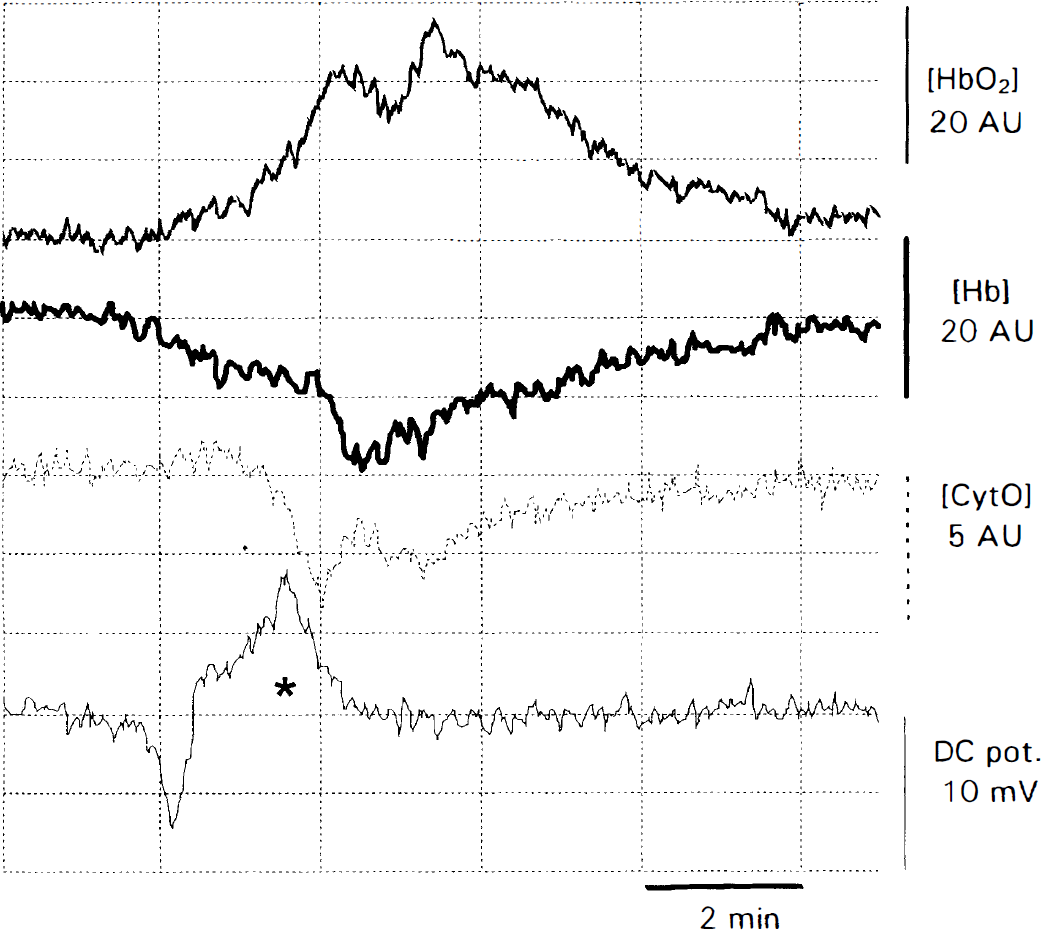
Example for a single episode of spreading depression for comparison with PID. In contrast to PID, the response to cortical spreading depression in regional blood oxygenation consists of an decrease of deoxyhemoglobin associated with increased oxyhemoglobin, both suggesting an excessive blood oxygenation. However, the cytochrome aa3 shows in cortical spreading depression, like in PID, a shift toward a more reduced state. *The maximum negative DC deflection in the spreading depression experiment in which, in a somewhat different setup, DC was measured differentially with two electrodes at 5-mm distance on the way of propagation. AU, arbitrary concentration units; [CytO], the oxidized form of cytochrome aa3; DC pot.; [Hb], deoxyhemoglobin; [HbO2], oxyhemoglobin.
Interpreting the NIRS data pathophysiologically is constrained by technical problems of the NIRO 500 including a lack of correction for the changing optical tissue properties during PID and spreading depression, a low spatial resolution, and a possible cross-talk among the chromophore-signals in spectroscopy with only four wavelengths. Changes in reflectance and scattering can influence the optical densities that are measured by the NIRO 500. Hence, the spectrophotometrically calculated dynamic concentration changes are subject to a certain pathlength error. However, because a changing optical pathlength affects all chromophores at the same scale, they can not mimic divergent concentration changes of decreasing deoxyhemoglobin and increasing oxyhemoglobin. This lead us to conclude from the pattern in normal spreading depression (Fig. 5) that blood oxygenation exceeds oxygen extraction. The pattern observed during PID is more complex. Its main feature is a concentration increase of deoxyhemoglobin and a slight concentration-decrease of oxyhemoglobin at the onset of each PID episode (Fig. 3). Because spreading depression in an intact brain is accompanied throughout by opposite changes, it seems reasonable to conclude that in the early phase of our PID measurements, blood oxygenation does not exceed oxygen extraction. Instead, both increasing deoxyhemoglobin and decreasing oxyhemoglobin indicate a decrease of rCBO at the onset of the episode. This difference in oxygen supply between spreading depression and PID, indicating a possible net hypoxygenation during PID, may be of pathophysiological relevance in PID. However, the hemoglobin data cannot provide information about the sufficiency of oxygen supply. With the observed subsequent reversal of oxyhemoglobin and deoxyhemoglobin changes, the second phase of the rCBO response recalls the blood oxygenation pattern in normal spreading depression. When simultaneous unidirectional concentration changes occur, this indicates changes in blood volume. A greatly increased blood flow may also increase blood volume which will cause an increase in both hemoglobin signals, especially in normally perfused brain areas beyond the penumbra. However, because blood flow can be increased also by increased blood velocity, the NIRS data is not an immediate measure of blood flow.
Because of the low spatial resolution inherent in our NIRS setup (especially in a small rat head) and to the temporal (and spatial) evolution of the depolarizations, we can not relate the components of the monitored rCBO patterns to regions of the cortex or stages of the depolarization. However, the observed pattern suggests a scenario that is worth exploring in further studies using a more refined technique. We know that in the penumbra rCBF does not increase in response to PID, whereas in spreading depression, it reaches almost double the baseline level (Back et al., 1994). Hence, it seems unlikely that hypoxygenation occurs only initially in PID and is followed by a “reactive” hyperoxygenation. Thus, a spatial effect seems more likely. Because of the light scattering properties of the skull and brain, NIRS has a sampling volume that is not known with precision given the optical geometry of this experimental setup. Certainly, it is much higher than that of laser Doppler flowmetry (which is about 1 mm3 [Dimagl et al., 1989]). For this reason, NIRS may be sampling parts of the ischemic core and the penumbra as well as portions of uncompromised tissue simultaneously (Fig. 2). Because NIRS measures only dynamic changes, only the penumbra and the healthy tissue can contribute to the signal. We hypothesize that the first part of the response (decrease of oxygenation) may represent PID in the penumbra whereas the later change to an increased oxygenation reflects the entry of the PID into uncompromised brain tissue, turning into spreading depression. The latter view finds support in recently published data on propagating changes in NADH fluorescence in cat cortex during PID (TFD), showing a swing from a reduced to an oxidized NADH redox state in the temporal and spatial propagation of the depolarization wave (Strong et al., 1996).
The redox changes of cytochrome aa3 are potentially of the highest interest for the pathophysiological interpretation of the observed patterns in PID and spreading depression. With its tendency toward a more reduced state, the oxidized cytochrome aa3 trace displays a robust response associated to PID. Surprisingly, this response is similar to that in spreading depression, despite the differences in blood oxygenation. This finding is difficult to reconcile with a pathophysiological hypothesis that is based on tissue hypoxia during the repolarization of PID but not of spreading depression. However, the interpretation of oxidized cytochrome aa3 data obtained with the NIRO 500 is hampered by the relatively low signal-to-noise ratio in view of the above mentioned possible artifacts. The signal of oxidized cytochrome aa3 is, of all NIRS data, the most prone to distortions by pathlength changes as well as signal cross-talk due to the low concentration of the chromophore when compared to the hemoglobins. The similarity of its time course to that of the DC potential during PID also warrants cautious interpretation because optical pathlength changes are largely caused by cell swelling and water shifts during depolarization. A reliable interpretation of this data appears possible only if spectroscopy can be combined with simultaneous measurements of the optical pathlength, which would allow for a correction of concentration changes. Obtaining such pathlength measurements may be possible by measuring the water absorption peak in full range near infrared spectra because the water content of the tissue remains stable despite its shifting between the compartments. Measurements of optical pathlength would also allow the conversion of arbitrary concentration units to micromoles.
SUMMARY
Near-infrared spectroscopy is capable of noninvasive detection of a “fingerprint” of PID in rats, which distinguishes it from spreading depression. Further NIRS studies with a higher spatial resolution (e.g., with a device allowing the use of smaller optodes), a better signal separation (e.g., with a full range spectrometer), and simultaneous pathlength measurements (e.g., by measuring water absorption) may allow for more specific studies of the pathophysiologic mechanisms by obtaining more reliable data on redox changes of cytochrome aa3.
The detection of PID via NIRS opens the prospect for clinical-experimental applications of the method in patients with strokes. We have been able to record rCBO in probands during physiological stimulation. In all measurements in probands so far, stimulation by all paradigms produced a decrease of deoxyhemoglobin in the activated cortex area (Obrig et al., 1996), while an increase of oxyhemoglobin was not so well localized (Hirth et al., 1996). Measurement of deoxyhemoglobin concentration changes would have to be relied on when looking for PID in patients. When sampling the penumbra, we expect NIRS to show an increase of deoxyhemoglobin, while oxyhemoglobin should decrease, remain unchanged, or increase to a significantly lower extent than deoxyhemoglobin. Changes of deoxyhemoglobin concentration are of particular clinical interest because this signal is also the basis of the bold signal in functional magnetic resonance imaging (Ogawa et al., 1990, Gardner-Medwin et al., 1994). Near-infrared spectroscopy recordings that show increases in oxyhemoglobin, coupled with decreases in deoxyhemoglobin, would indicate hyperoxygenation and thus suggest measurement in intact brain tissue. Currently, we are investigating stroke patients using a bed-side NIRO 500.