
Abstract
Cortical spreading depression (CSD) has been implicated in the migraine aura and in stroke. This study demonstrates near-infrared spectroscopy (NIRS) for the first time as capable of noninvasive on-line detection of CSD in the pentobarbital-anesthetized rat. CSD was accompanied by a brief and rapid increase of regional CBF (by laser-Doppler flowmetry) to 200–400% baseline. NIRS demonstrates that this hyperperfusion is associated with concentration increases of oxyhemoglobin, while deoxyhemoglobin decreases. Simultaneously, oxygen partial pressure, measured on the brain surface with a solid-state Polarographic probe, was shown to be raised by at least 14 mm Hg during CSD. Oxygen-dependent phosphorescence life-time quenching measurements confirmed this finding. NIRS data on cytochrome aa3, however, showed a CSD-related shift toward a more reduced state, despite raised blood oxygenation. This may suggest either limited O2 transport from the blood to mitochondria or decreased oxygen utilization during CSD as supposed by theories about compartmentalization of energy metabolism favoring glycolytic rather than aerobic energy supply during CSD. However, the data on cytochrome aa3, warrant caution and are discussed critically. Nitric oxide synthase inhibition by systemic application of N′-nitro-
Cortical spreading depression (CSD) is a wave of initial neuronal excitation followed by sustained depolarization of neuronal and glial cells that spreads at 2–5 mm/min over the cerebral cortex. It is characterized by temporary loss of specific cell function, i.e., flattening of EEG. CSD was first described 50 years ago (Leão, 1944) and has not ceased to intrigue researchers ever since. Due to the associated massive ionic changes, it is known to challenge the energy metabolism of cortical parenchymal cells (Mies and Paschen, 1984; Gault et al., 1994) without causing any damage to the affected brain tissue (Nedergaard and Hansen, 1988). An acute increase of regional CBF (rCBF) follows the ionic changes with little delay (Lauritzen, 1987; Duckrow, 1993), suggesting that it matches increased demand for substrate and oxygen. In the hemodynamically compromised penumbra of focal ischemia, though, CSD-like periinfarct depolarizations have been shown to enhance ischemic injury (Iijima et al., 1992; Mies et al., 1993; Back et al., 1994).
Apart from its clinical implication in stroke, CSD has become more and more attractive in the pathophysiological scenario of migraine, mainly by virtue of accumulating evidence for neuronal mechanisms found in the pursuit of Moskowitz's theory of neurogenic inflammation in migraine (Moskowitz and MacFarlane, 1993; Lauritzen, 1994). Nevertheless, CSD has defied numerous attempts to detect it in the human cerebral cortex in vivo (e.g., McLachlan and Girvin, 1994), and the possibilities of invasive investigation are limited. Near-infrared spectroscopy (NIRS) as a spectrophotometric technique, up to now, has been used clinically for monitoring of cerebral and cardiovascular oxygen sufficiency (Jöbsis, 1977; Edwards et al., 1991). It operates with infrared light near the visible end of the spectrum and penetrates even dense tissue such as bone easily. It is absorbed mainly by three chromophores: oxyhemoglobin [HbO2], deoxyhemoglobin [Hb], and the mitochondrial cytochrome aa3 in its oxidized state [CytO]. A laser is pulsed successively in different wavelengths and the light is transmitted to the skull by fiber optics. Photons that have passed the tissue and leave the skull again, carrying the spectrophotometric information, are collected by another fiber bundle. The signal is amplified in a photomultiplier tube, and optical densities of the tissue for the different wavelengths are calculated continuously. From changes in these optical densities, concentration changes of the chromophores can be derived (Cope and Delpy, 1988; Cope et al., 1988; Wray et al., 1988).
The mediators of the blood flow response to CSD in intact brain remain uncertain. As a potent vasodilator, nitric oxide (NO) plays a role in the coupling of CBF and metabolism during neuronal activation in the rat (Dirnagl et al., 1993). Colonna et al. (1994) demonstrated the relevance of NO to CSD-related arteriolar dilatation in the rabbit. Goadsby and colleagues (1992) were able to abolish CSD-associated hyperemia by systemic inhibition of nitric oxide synthase (NOS) in the cat. For the rat, the Moskowitz group found that systemic NOS inhibition did not significantly influence rCBF during CSD (Zhang et al., 1994).
Considering the study data on typical blood flow changes in CSD, we tested in our study (a) NIRS as a promising tool to detect CSD noninvasively by means of its hemodynamic sequelae. If we are able to monitor CSD by NIRS in the rat model, we can venture to search for it noninvasively in humans, too. In addition, we expected NIRS (b) to yield valuable noninvasive on-line information about the oxygenation of cortical tissue during CSD. Furthermore, we tested the hypothesis (c) as to whether inhibition of NOS by systemic application of N′-nitro-
METHODS AND MATERIALS
Preparation
We used male Wistar rats of 280–320 g in weight. The animals were anesthetized with pentobarbital (100 mg/kg body wt i.p.). Anesthesia was maintained by intermittent application of further intraperitoneal barbiturate doses (5 mg), aiming at absence of a reaction to a tail pinch. After tracheotomy, they were ventilated (Effenberger small-animal ventilator, Pfaffin-gen, Germany), and end-expiratory CO2 was monitored (Heyer Artema MM204, Sweden) throughout the experiment. Body temperature was kept at 37.5 ± 0.5°C by an electrical heating pad. A femoral artery and vein were cannulated for permanent monitoring of MABP (RFT Biomonitor, Zwönitz, Germany), intermittent sampling of arterial blood gases (AVL Compact I, Graz, Austria), and continuous infusion of saline (1 ml/hr). The animals were fixed in a stereotaxic frame, and two symmetrical open cranial windows were installed in the frontal bones. The dura was carefully removed to expose the frontal cortex of both hemispheres for elicitation of CSD, and artificial CSF [for composition, see Levasseur et al. (1975)] was superfused. As illustrated in Fig. 1, 5 and 10 mm occipitally from this triggering site, burr holes were drilled with a saline-cooled drill. At both trephinations, the wicks of calomel electrodes were placed for registration of direct current (DC) potential deflection. DC potential was measured differentially between the two electrodes by a differential voltage meter (FD223; WPI, Sarasota, FL, U.S.A.), so that the velocity of the CSD could be calculated from the distance of the two peaks of the resulting biphasic curve. For measurements of brain surface oxygen partial pressure (Po2) in the burr hole at 10-mm distance from the triggering site, a Polarographic solid-state oxygen probe (Licox-Po2 monitoring system; GMS, Mielkendorf, Germany) was slit through the dura and placed on the cortical surface by a micromanipulator. In the same area, the transmitting and the receiving optodes (fiber bundle diameter 3.4 mm) of the four-wavelength near-infrared spectrometer (NIRO 500; Hamamatsu Photonics, Japan) were positioned over the intact skull. To sample the cortex of the right hemisphere, they were arranged at an angle of ˜70° and ˜6 mm apart from each other perpendicular to the direction of propagation of CSD (van der Zee et al., 1990). rCBF was measured by laser-Doppler flowmetry (LDF) (Vasamedics BPM2, St. Paul, MN, U.S.A.) through the thinned bone (Dirnagl et al., 1989; Lindauer et al., 1993). Since the laser signals of both LDF and NIRS interfered with each other if employed in the same site, we chose to measure rCBF symmetrically in the opposite hemisphere, supposing that CSDs behave in an analogous fashion in both hemispheres when triggered at the same time.
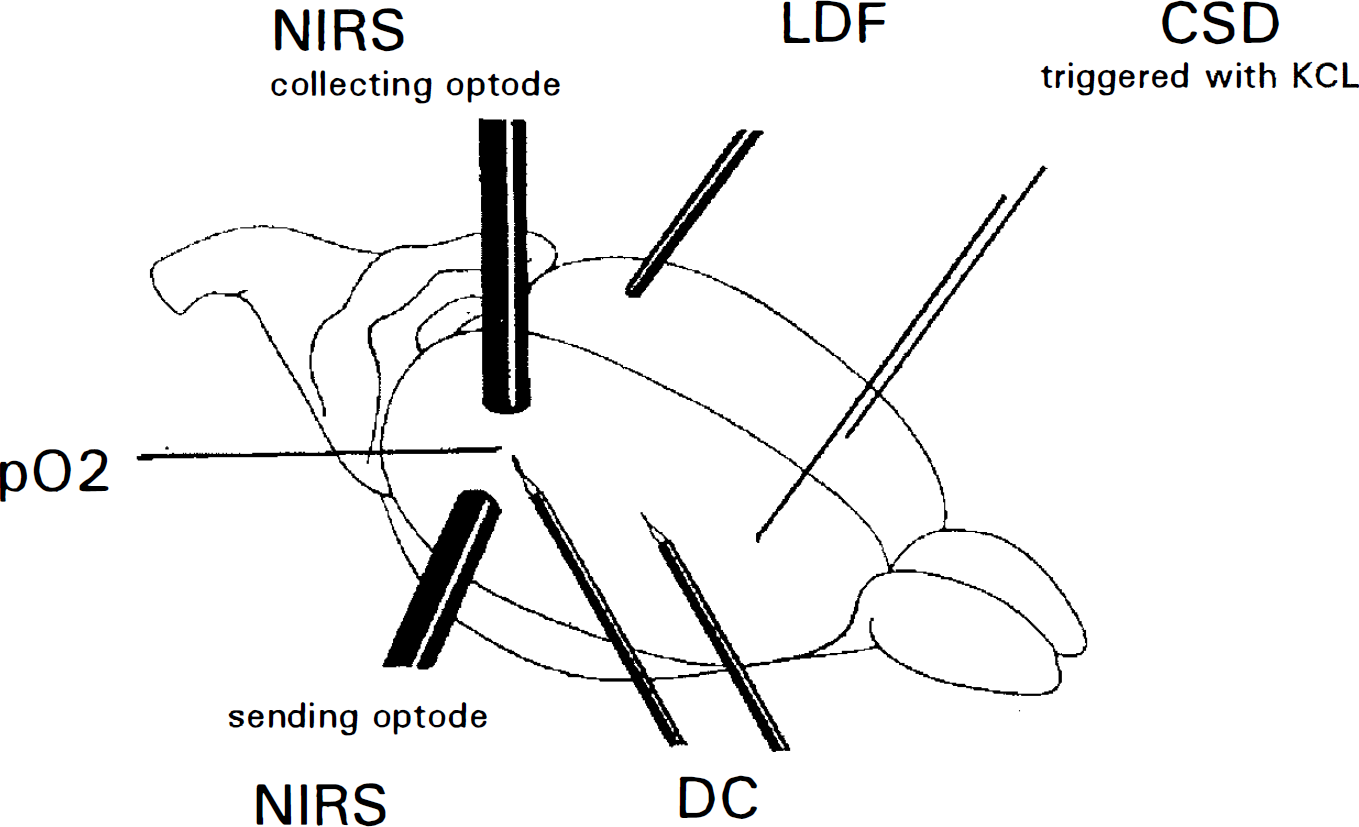
Schematic view of the experimental setup. The skull is intact apart from an open cranial window over the frontal poles and burr holes for calomel electrodes and a Polarographic solid-state oxygen probe; regional cerebral blood flow (rCBF) is measured by laser-Doppler flowmetry (LDF) through the thinned bone; the sending and collecting near-infrared spectroscopy (NIRS) optodes are placed over the preserved skull and measure changes of the regional blood oxygenation. Cortical spreading depression (CSD) is triggered in the frontal region of both hemispheres by simultaneous superfusion of high potassium aCSF, the propagating deflection wave of the cortical direct current potential (DC) is followed by calomel electrodes. NIRS, LDF, and Polarographic Po2 probe are placed 10 mm from triggering site.
Protocol
CSDs were triggered by topical application of 150 mM KCl solution for ˜30 s, after which it was replaced again by artificial CSF. The interval between these episodes was 45 min.
In the experimental group (14 animals),
In the control group (nine animals), NOS was not inhibited. A control with
In three separate animals that received no
Data analysis
Cortical DC potential, [HbO2], [Hb], [CytO], rCBF, Po2, and MABP were measured continuously. Data were acquired every 2.5 s by a PC running ASYST data acquisition software (Macmillan); Po2 data were acquired separately every 5 s with the manufacturer's software. Total hemoglobin [HbT] was calculated from raw data by addition of [HbO2] and [Hb]. Data of [HbO2], [Hb], [HbT], [CytO], and Po2 were compared regarding their maximum deflection from baseline. NIRS data are expressed in arbitrary units that will be discussed later. rCBF was determined as relative change compared with the baseline, defined as 100%. The velocity of CSD propagation was calculated from the time that passed between the registration of DC potential shift with either calomel electrode. We compared the CSD before with the CSD after NOS inhibition within the experimental group. We also compared the CSD before and after
RESULTS
Physiology
Physiological parameters were kept in normal ranges throughout the experiment and are documented for the instances of measured CSD in Table 1. MABP increased in the experimental group significantly after systemic
Physiology data for experimental (n = 14) and control groups (n = 9)
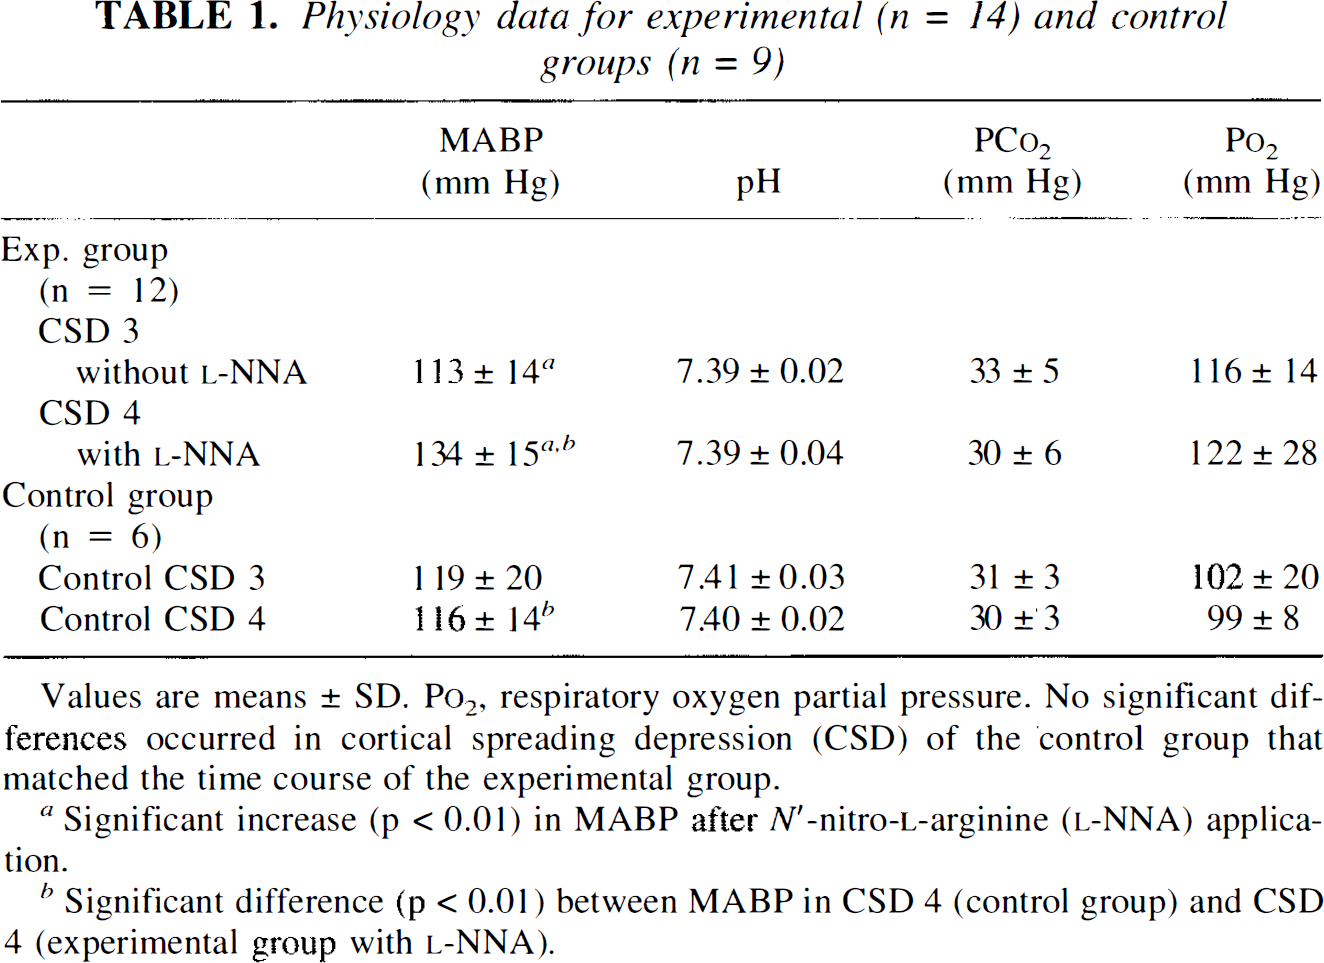
Values are means ± SD. Po2, respiratory oxygen partial pressure. No significant dif-ferences occurred in cortical spreading depression (CSD) of the control group that matched the time course of the experimental group.
Significant increase (p < 0.01) in MABP after N′-nitro-
Significant difference (p < 0.01) between MABP in CSD 4 (control group) and CSD 4 (experimental group with
MABP dip occurring during last cortica spreading depression (CSD) before and first after NO synthase (NOS) inhibition by N′-nitro-
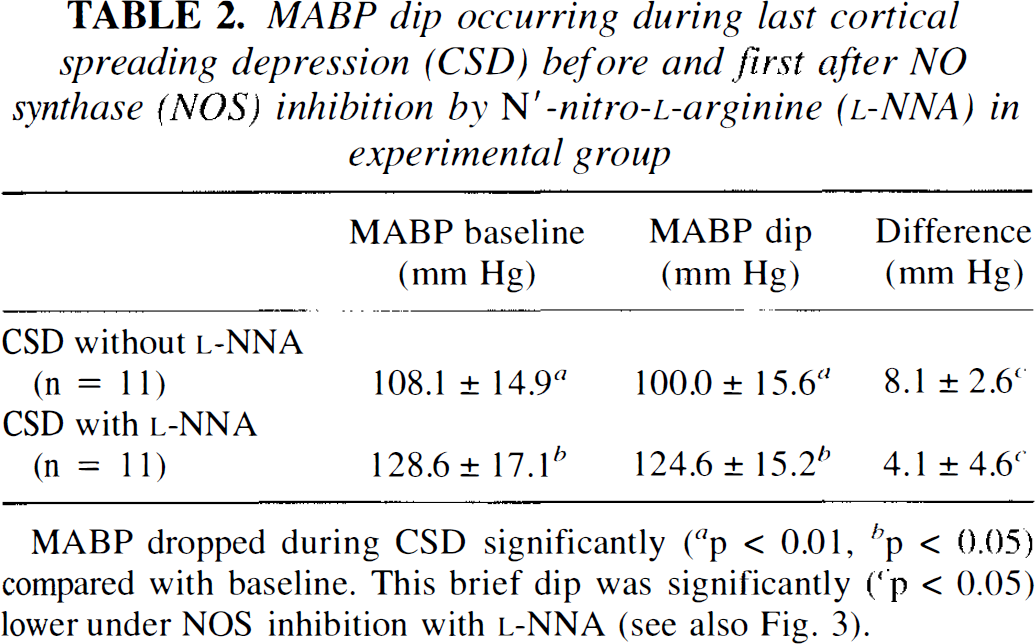
MABP dropped during CSD significantly (
a
p < 0.01,
b
p < 0.05) compared with baseline. This brief dip was significantly (
c
p < 0.05) lower under NOS inhibition with
Velocity of DC potential deflection, rCBF, Po2, and NIRS data are listed in Table 3. A typical recording of the DC potential shift is shown on the bottom of Fig. 2. The biphasic curve results from differential recording of the same wave of CSD passing the first calomel electrode at 5-mm distance from the triggering point ˜90 s after the start (negative deflection) and the second one 5 mm more occipital after another 90 s (positive deflection). CSD velocity was not changed by
Velocity of cortical direct current (DC) potential deflection, increase of regional CBF (rCBF), concentration changes of oxyhemoglobin [HbO2], deoxyhemoglobin [Hb], total hemoglobin [HbT], and oxidized cytochrome aa3 [CytO], as well as rise in oxygen partial pressure of cortex surface (Po2) measured during cortical spreading depression (CSD) before and after NO synthase (NOS) inhibition by systemic application of N′-nitro-
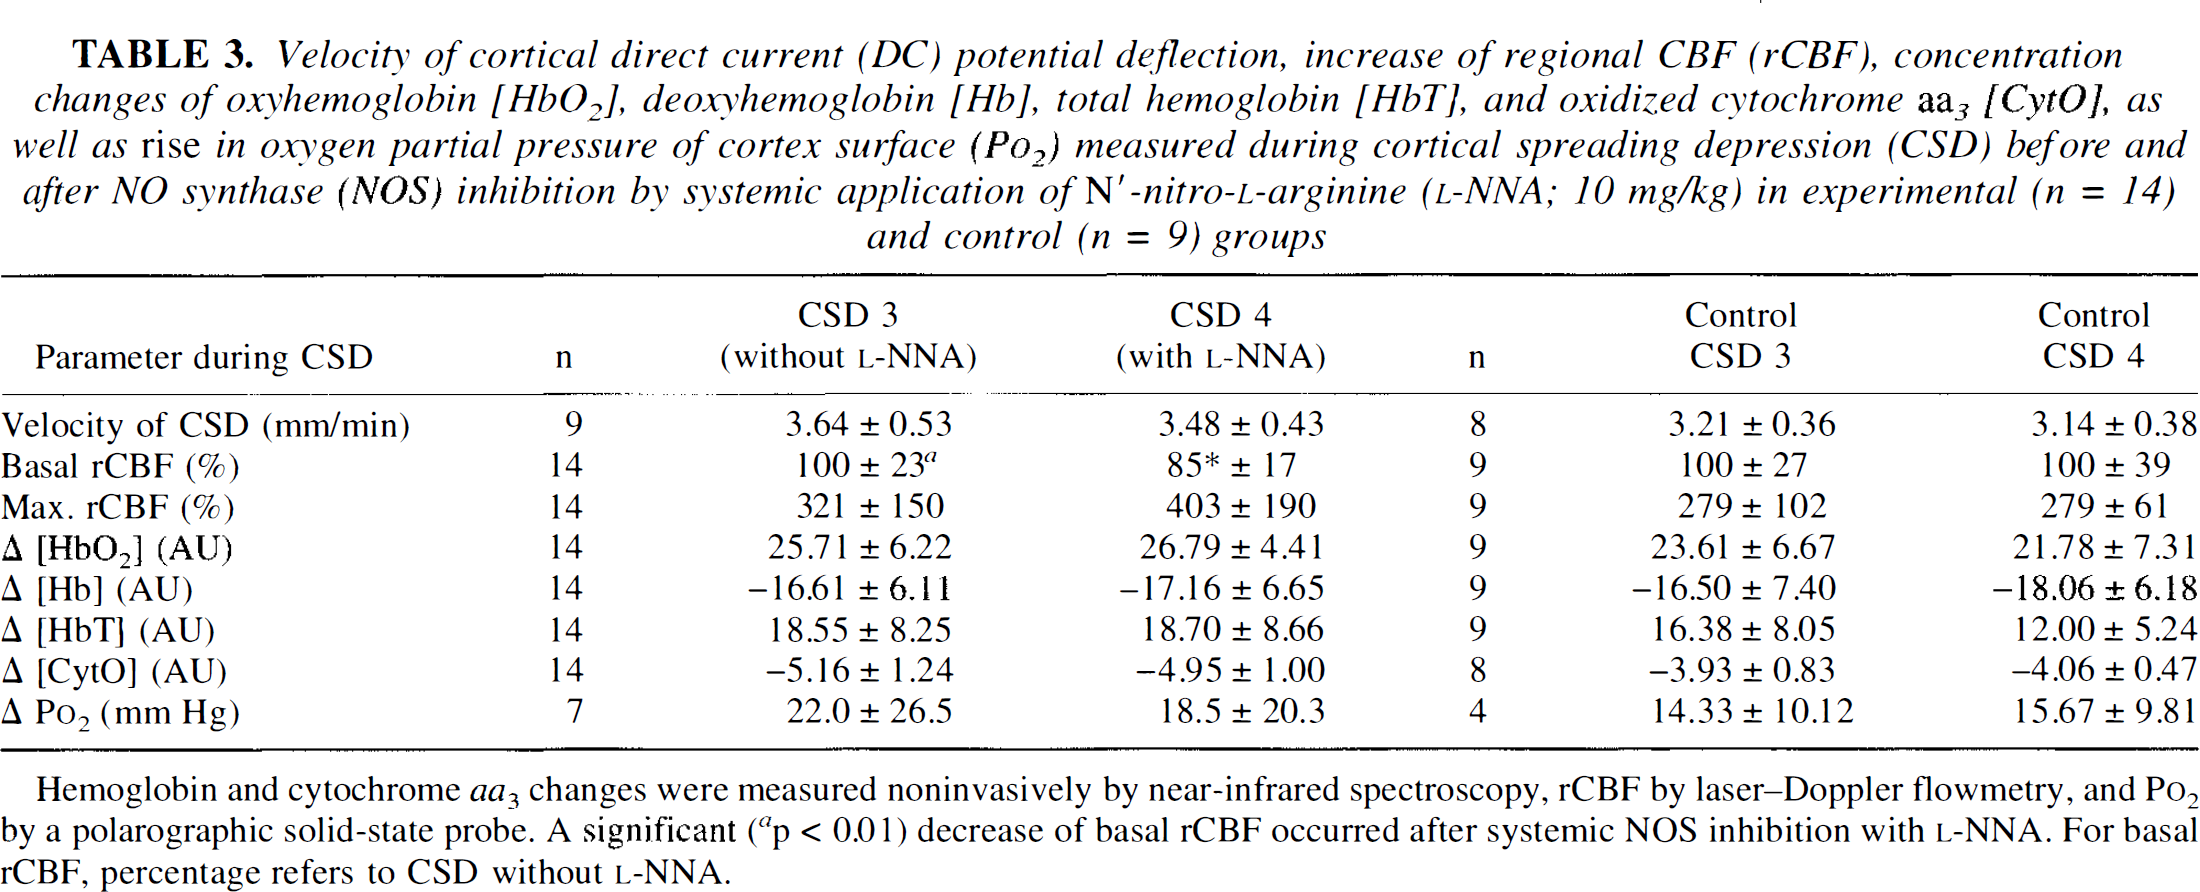
Hemoglobin and cytochrome aa3 changes were measured noninvasively by near-infrared spectroscopy, rCBF by laser-Doppler flowmetry, and Po2 by a Polarographic solid-state probe. A significant (
a
p < 0.01) decrease of basal rCBF occurred after systemic NOS inhibition with
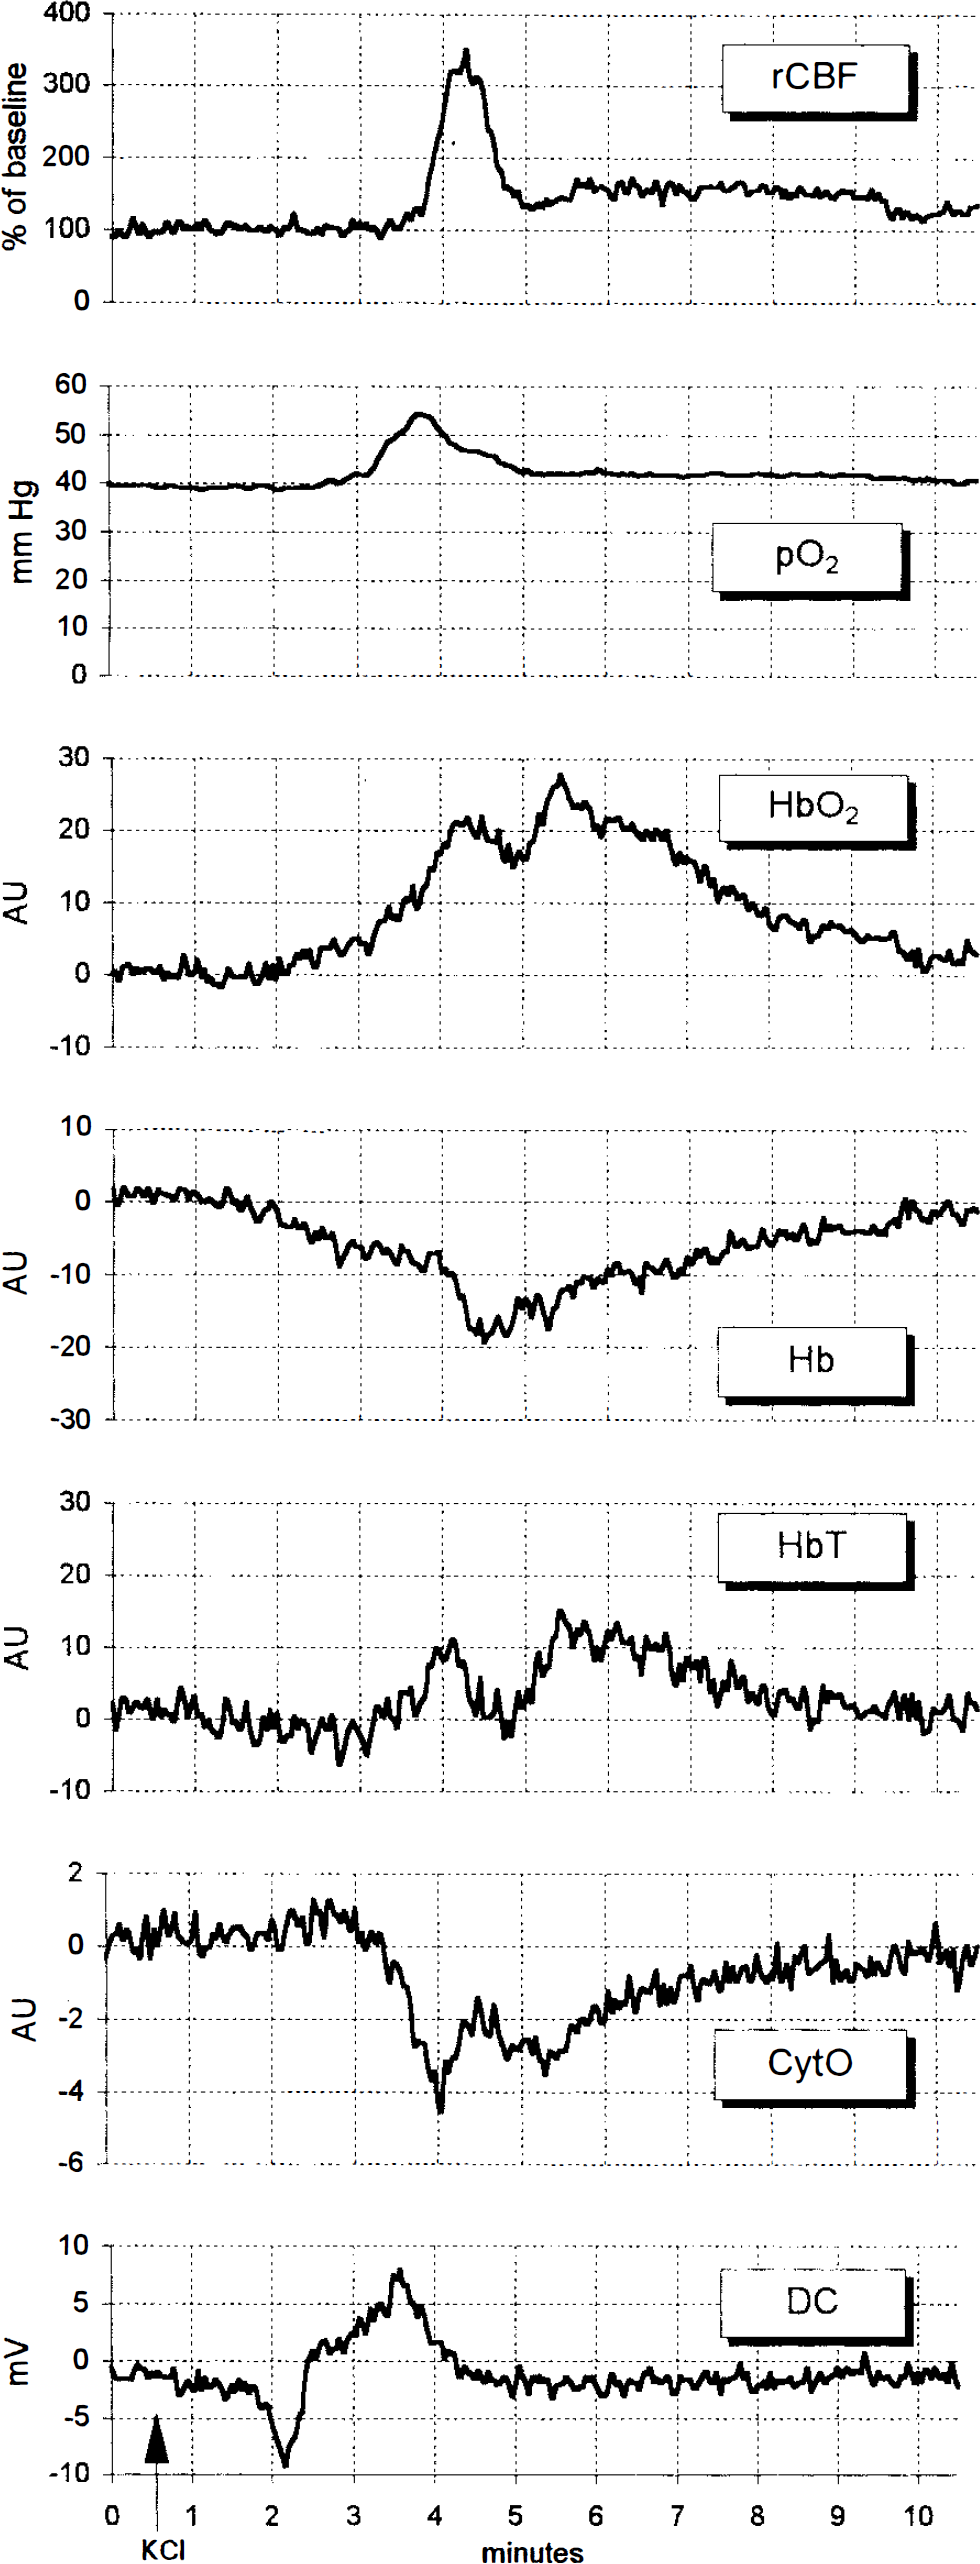
Typical changes during one single episode of cortical spreading depression (CSD) (CSD was triggered at 30 s). The pattern was unchanged after systemic N′-nitro-
NIRS was clearly able to monitor changes of hemoglobin and cytochrome aa3 signals during CSD, the patterns of which are also shown in Fig. 2. All NIRS signals were above noise range. Oxyhemoglobin increased, indicating arterialization. Deoxyhemoglobin decreased, not fully compensating for the [HbO2] rise, though. Accordingly, a total hemoglobin increase suggests hyperemia during CSD. During passage of CSD, cytochrome aa3 showed a distinct shift toward a reduced state (i.e., a concentration decrease of its oxidized fraction [CytO]). NOS inhibition by systemic
The predominant change in brain surface oxygen partial pressure was a rise by ˜15 min Hg, lasting for ≥2 min. NOS inhibition with
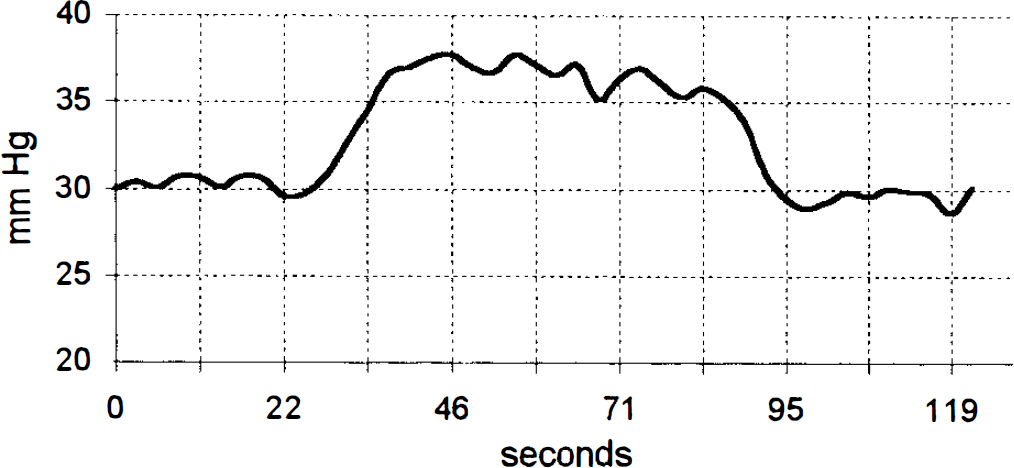
Brain surface Po2 by phosphorescence life-time quenching during a single cortical spreading depression. (The recording was restricted to a smaller time window than in Fig. 2.)
The baseline of rCBF dropped significantly as a consequence of
DISCUSSION
NIRS changes were the first to be noticed and the last to return to baseline, which indicates that the NIRS optodes have the largest sampling volume of all probes employed. In the face of this spatial resolution, the collected NIRS information refers simultaneously to those cortical areas that are affected by CSD as well as to those that are either not yet or no longer in the wave front. This allows only for interpretation of gross changes and makes drawing conclusions from subtle patterns, such as the occasionally occurring “dichrotic” curves, difficult. Employment of optodes with a smaller optical diameter should improve the spatial resolution.
The measured increase in oxyhemoglobin concentration corresponds well to the hyperperfusion phase, as it is known to be due to arterial (Colonna et al., 1994) and arteriolar (Shibata et al., 1992; Wahl et al., 1994) dilatation. This arterialization appears to exceed oxygen extraction because deoxyhemoglobin is cleared from the tissue, resulting in lowered [Hb] concentration. An increase in brain surface Po2 in CSD was shown with two different methods and may reflect the increased arterialized perfusion in the cortex. This finding supports data of Back et al. (1994). However, the oxygen measurements of this study are hampered by the fact that both used methods restricted to superficial structures (see later). No difference between NOS inhibition and normal CSD was found. However, with the given standard deviations, a type II error is not unlikely; that is, the difference in the Po2 response of NOS-inhibited and noninhibited CSD may have been too low to be detected.
Cytochrome aa3 shows a reduction in spite of the raised blood oxygenation. This is in discordance with previous findings of other workers on cytochrome aa3 spectrophotometry in the visible light range (Jöbsis et al., 1977; Sylvia and Rosenthal, 1979). However, NADH reflectance studies of the mitochondrial oxidation state during CSD produced evidence for mitochondrial reduction during CSD in anesthetized gerbils (Mayevsky et al., 1980) and cats (Dora et al., 1984). Due to the temporal resolution of both Polarographic and phosphorescence-quenching Po2 measurements, an initial brief dip in Po2 may have been missed. Furthermore, both methods sample the cortical surface and are unlikely to reflect the tissue oxygen partial pressure in deeper layers that are sampled by NIRS. Other workers who implanted micro-electrodes to deeper structures reported biphasic responses of tissue Po2 (Tsacopoulus and Lehmenkühler, 1977; Dietrich et al., 1994) or found an increase with superficial oxygen sensors while probes in deeper layers recorded a monotonic decrease of oxygen tension (LaManna et al., 1989), so that the cytochrome aa3 reduction in our experiments may well have been accompanied by an actual drop of tissue Po2. However, there remains still the puzzling coexistence of raised blood oxygenation ([HbO2]↑ [Hb]↓) and apparent decreased mitochondrial oxygenation ([CytO]↓) as both are recorded with the same method, namely, NIRS. The discordant findings of different groups in different animals and models seem to indicate that the primary variables may be signal penetration depth and depth of anesthesia.
The shift of cytochrome aa3 toward a more reduced state during increased blood oxygenation could be interpreted as increased oxygen demand of mitochondria during CSD that is unmet despite excessive blood oxygenation, possibly by a diffusion barrier (Hotez et al., 1977; Kreisman et al., 1981) or as physiologically decreased oxygen utilization by mitochondria during CSD. While the first speculation would stress a pathological aspect of CSD, the second supports theories of compartmentalization of energy metabolism that suppose a glycolytic rather than aerobic energy supply of ionic pumps during CSD (Fox et al., 1988; Andersen and Marmarou, 1992). The assumption of a temporary drop in tissue Po2 that we mentioned would put more weight on the first speculation. Although excessive blood oxygenation during CSD does suggest that oxygen is not the coupling agent between metabolism and blood flow, this seems obvious only under the presumption that no bottleneck exists for oxygen transfer from hemoglobin to cytochrome aa3.
Though much work has been done on the validation of multiple wavelength NIRS measurements of cytochrome aa3 (Kariman and Burkhart, 1985; Wray et al., 1988; Ferrari et al., 1990), the question must be raised of the degree to which the [CytO] data are based on changes other than in absorption. Because of the low concentration of cytochrome aa3 compared to hemoglobin (Cooper et al., 1994), this signal is prone to distortions by hemoglobin spillover, by cytochrome c contamination, or by alterations of the optical properties of the tissue as they may be caused by cell swelling during CSD (Lipton, 1973; Bureš et al., 1974b; Hansen and Olsen, 1980; Jing et al., 1994).
The Hamamatsu NIRO 500 expresses data as micromolar changes, provided a differential path length factor is given. For the human head, this factor has been estimated (van der Zee et al., 1992), but in our setup it is unknown. Simultaneous optical path length measurements, however, would provide the opportunity to calibrate arbitrary units to micromolar. Nevertheless, arbitrary units are suitable for comparisons of the kind we undertook.
A reduction of basal rCBF due to NOS inhibition is a well described phenomenon (Prado et al., 1992; Dirnagl et al., 1993; Pelligrino et al., 1993; Fabricius and Lauritzen, 1994). In this study, it was found in the same range and was regarded as evidence for successful inhibition of NOS. In a quite similar protocol of
In this study, we did not observe the previously described prolonged hypoperfusion (Lauritzen, 1984; Duckrow, 1991) after the first CSD had passed. The reason for this may be pentobarbital narcosis. We did not, with NOS inhibition, encounter an initial brief dip preceding the hyperperfusion phase as reported by Duckrow (1993).
The brief dip in MABP during CSD may reflect functional decortication by CSD that influences the activity of vegetative brain structures (Bureš et al., 1974a). Although this change is not in a range of any significance to blood flow, this reaction recalls vegetative features occurring during human migraine. The lessening of this MABP change with
Nitric oxide is not only a vasodilator but also a transmitter [for review see Bredt and Snyder (1994)] and may hence theoretically be involved in CSD propagation itself. But so far there has been no evidence for such involvement, nor did this study produce any: Neither susceptibility of the cortical tissue to CSD nor velocity of the DC deflection wave was influenced by
CONCLUSIONS
In this study, it is shown for the first time that NIRS is capable of detecting CSD noninvasively in the rat. We now investigate patients in the aura phase of migraine with the same method.
Acquisition of spectra over the entire NIR range (e.g., 600–1000 nm) instead of in only four wavelengths remain to be desired. This would make path length measurements possible (for instance, with the water absorption peak) (Matcher and Cooper, 1994) and could yield a much improved separation of cytochrome aa3 from hemoglobin spectra, thus enabling us to continuously obtain reliable information about intracellular and blood oxygenation at the same time.
The use of optodes with a smaller optical diameter could enhance the spatial resolution, thus providing a sharper temporal correlation to DC and oxygen measurements.
Footnotes
Abbreviations used
Acknowledgment:
This study was supported by the Deutsche Forschungsgemeinschaft (DFG Vi93/7-1, Di454/4-2).