
Abstract
The blood vessels in the brains of adult rats subjected to chronic normobaric hypoxia and control animals housed under normoxic conditions were morphometrically studied. Hypoxic male inbred Wistar rats were exposed over a period of 130 days to decreasing amounts of oxygen starting from 21% down to 7% (15%: 15 days; 12%, 10%, 8%: 22 days, respectively; 7%: 49 days). Areas of cerebral cortex, striatum, hippocampus, cerebellum, and medulla oblongata were investigated. The ratio vessel number per mm2 tissue and the average vessel size were measured using a Quantimet Q570. In the hypoxic animals, cerebral cortex, striatum, and hippocampus showed a significant increase of the vessel density per mm2 tissue (P < 0.01 or P < 0.05). The differences in both groups were highest in the striatum and hippocampus. In the cerebellum and the medulla oblongata of hypoxic animals, only a tendency to higher vessel numbers per mm2 tissue was found. The average blood vessel size differed only in the cerebral cortex and the cerebellum, but not in the other brain regions tested. The results indicate that the adaptation of the brain circulation to hypoxia is achieved by both angiogenesis and dilatation of microvessels, and that the pattern of the microcirculatory changes is not homogenous in all regions.
Experimental studies in extreme hypoxic conditions in the brain have been performed mainly by acute or subacute but not chronic exposition (Arregui and Barer, 1980; Hughes et al., 1983; Schulze and Jaenicke, 1986). Because the oxygen supply is reduced in chronic hypoxia, one might assume that microvessel changes may be present. Early authors, who performed experiments in animals exposed to severe hypobaric hypoxia of long duration (Opitz, 1951; Diemer and Henn, 1965), in fact found an increase of the number of vessels in the brain. However, because their methods, which only visualized erythrocytes within the vessels, were not conclusive, it may be doubted whether in adult rats oxygen deficiency was an adequate stimulus to cause capillary proliferation. Thus, in chronic hypoxia of the brain only a dilatation of the vessels was assumed, and 'vascular growth' was attributed to changes in size and shape of a relatively constant population of endothelial cells. Moreover, none of the early studies reported regional quantitative differences of blood vessel numbers, and only moderate but not severe hypoxia, which is considered when the fraction of inspired oxygen (FIO2) is below 10%, has been studied (LaManna et al., 1992).
It becomes evident from these data that the knowledge of the altered microvasculature in the brain under chronic hypoxia is still very sparse. However, because changes in the microvessels may be very important with regard to adaptation mechanisms, detailed investigations are necessary. We thus decided to use our rat model of chronic normobaric severe hypoxia for the study of microvessels. We have applied this model so far to a variety of investigations of hypoxic changes in many organs (Wolman et al., 1993) including the brain, where an altered expression of glial fibrillary acidic protein was found (Cervós-Navarro et al., 1991; Zimmer et al., 1991). Here we morphometrically studied the blood vessels within six selected brain areas. We addressed the question whether the density and size of microvessels are changed in hypoxic animals when compared with controls and whether microvessel changes, if present, display regional differences.
MATERIALS AND METHODS
Animals
Experiments were performed on 60 inbred male adult Wistar rats housed at controlled ambient temperature (22 ± 1 °C) with a 12-hour light and a 12-hour dark schedule. At the beginning of the experiments, the body weight was 335 ± 18 g and the age of the animals 90 days. Food and tap water were available ad libitum. Forty-eight rats were housed under hypoxic conditions and 12 controls under normoxic conditions.
Experimental protocol
Experiments were divided into two groups. In control rats, morphometry was performed in brains of 12 normal animals after 130 days comparable to the commencement of the hypoxic group. In hypoxic rats, 48 animals exposed to chronic hypoxia were studied at day 130 after the onset of hypoxia.
Exposure to chronic hypoxia
Rats were exposed to an increasing degree of normobaric hypoxia in chambers made of Plexiglas (0.36 m3). Four Nalgene plastic cages, each housing two rats, were placed in one chamber. The air or gas mixtures containing decreasing concentrations of oxygen were pumped into the chambers in desired proportions by means of specially constructed flowmeters. The ambient temperature (22 ± 1 °C), relative humidity (58 to 60%), air flow (30 L/min), and atmospheric pressure (759 ± 4 Torr) were kept constant. During cleaning of the cages and replenishing of food and water, at 2-day intervals, normoxia was induced for a few minutes. The time schedule after a week of adaptation to the chamber at 21% oxygen was 15 days at 15% oxygen, followed by 12%, 10%, 8% oxygen for 22 days at each level; and 49 days at 7%; for a total of 130 days. The control animals were kept for the whole time of the experiment in similar cages in the same conditions but in normoxia.
Tissue preparation
Under anesthesia (100 mg/kg body weight, ketamine, intraperitoneally and 1 mL/kg xalazine, subcutaneously) the chest was opened and the ascending aorta was cannulated via the left cardiac ventricle. The descending aorta was clamped and the right atrium was excised. The animals were then perfused with about 100 mL of a glutaraldehyde-based fixative (2.5% glutaraldehyde, 2% paraformaldehyde in 0.1 mol/L phosphate buffer, pH 7.4 containing 2.5% picric acid) preceded by a brief saline rinse (0.9 NaCl, about 50 mL). The brains were immediately removed. Several blocks of 1 to 2 mm3 per selected brain area (cerebral cortex, striatum, hippocampus, cerebellum, medulla) were prepared and kept in the same fixative for 12 hours. In the cerebellum, gray and white matter were not separately investigated. The tissue blocks were rinsed and post-fixed in a buffered solution of 1% OsO4 for 120 minutes, followed by dehydration in a graded series of acetone and embedding in Araldite (Merck, Germany). In three blocks of every animal and every selected area, semithin sections of 1 μm were stained with Richardson solution.
Morphometric analysis
Per animal, between 1 (corresponding to 0.076 mm2 tissue, see blue frame in Fig. 1) and 15 regions (= 1.14 mm2 tissue) of cerebral cortex, striatum, hippocampus, cerebellum, and medulla oblongata were randomly selected under a 40× objective of an Olympus microscope (Olympus Optical Co. (Europa) Hamburg, Germany). The total numbers and the total area of lumina of all blood vessels within these selected brain regions were analyzed by an image analyzing system (Quantimet Q570, Leica, Bensheim, Germany) with a specific designed program ('Gefäße', designed by Bruno Linn, Leica, Bensheim, Germany) in an interactive measure mode. The values were given as 'blood vessel numbers per mm2 brain tissue' and 'average blood vesselsize'. Large and small vessels, that is, arteries, arterioles, capillaries, and venules, were included together. Morphometric evaluation was performed in a blind manner by two independent observers (Stephan Patt and Gundula Hamdorf).
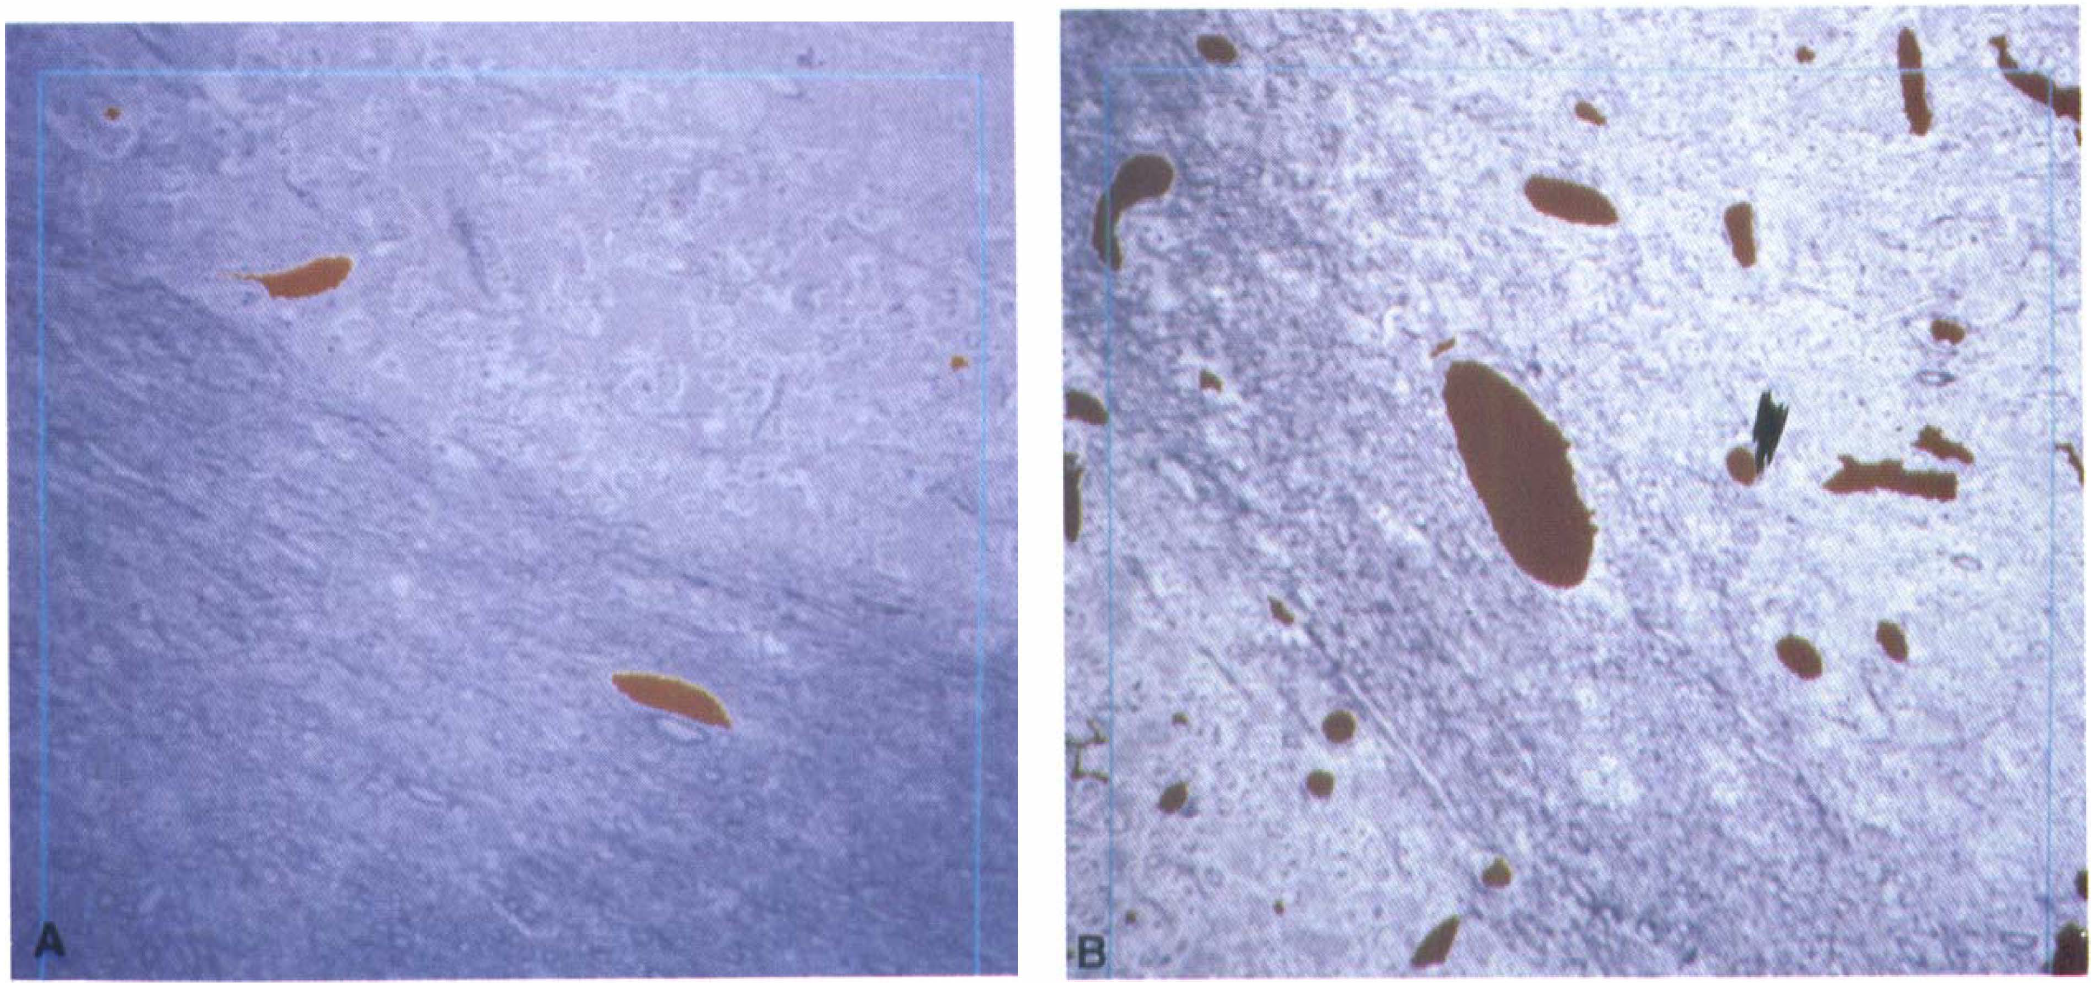
Semithin sections. The pronounced difference between the blood vessel number of the cerebellum from an animal without (
Biostatistics
Statistics were performed using SPSS for Windows (SPSS Inc, Chicago, IL, U.S.A.). The correlation coefficients were calculated for the dependencies of two variables, whereby the significance level P = 0.005 was maintained. The rank sum test for two independent groups was performed by the Mann-Whitney-U-test.
RESULTS
Number of blood vessels per mm2
The most pronounced differences between the hypoxic and normoxic group with respect to the number of blood vessels per mm2 brain tissue (mean vessel number per mm2 ± SD) were found in the striatum (264.4 ± 49.4 in hypoxic versus 65.8 ± 56.3 in normal rats, P < 0.01); and in the hippocampus (320.5 ± 41.6 versus 17.9 ± 103.4, P < 0.01). The relationship in the cerebral cortex was 381.5 ± 81.2 vessels per mm2 under hypoxia and 225.0 ± 56.2 in normal animals (P < 0.05). In the cerebellum only a trend toward higher vessel numbers per mm2 tissue could be observed; the values were 434.0 ± 62.4 versus 326.9 ± 152.1 (P = 0.09). Statistically significant differences between the two groups were lacking in the medulla oblongata because of large standard deviations in the controls (180.6) when compared with the hypoxic animals (43.1); however, the mean of the vessel numbers per square millimeter tissue differed in both groups (318.1 in hypoxic rats, 197.9 in controls, P = 0.1). One exceptionally high vessel number was found in the medulla oblongata of a hypoxic animal when compared with the other animals of the same group (see circle in Fig. 2).
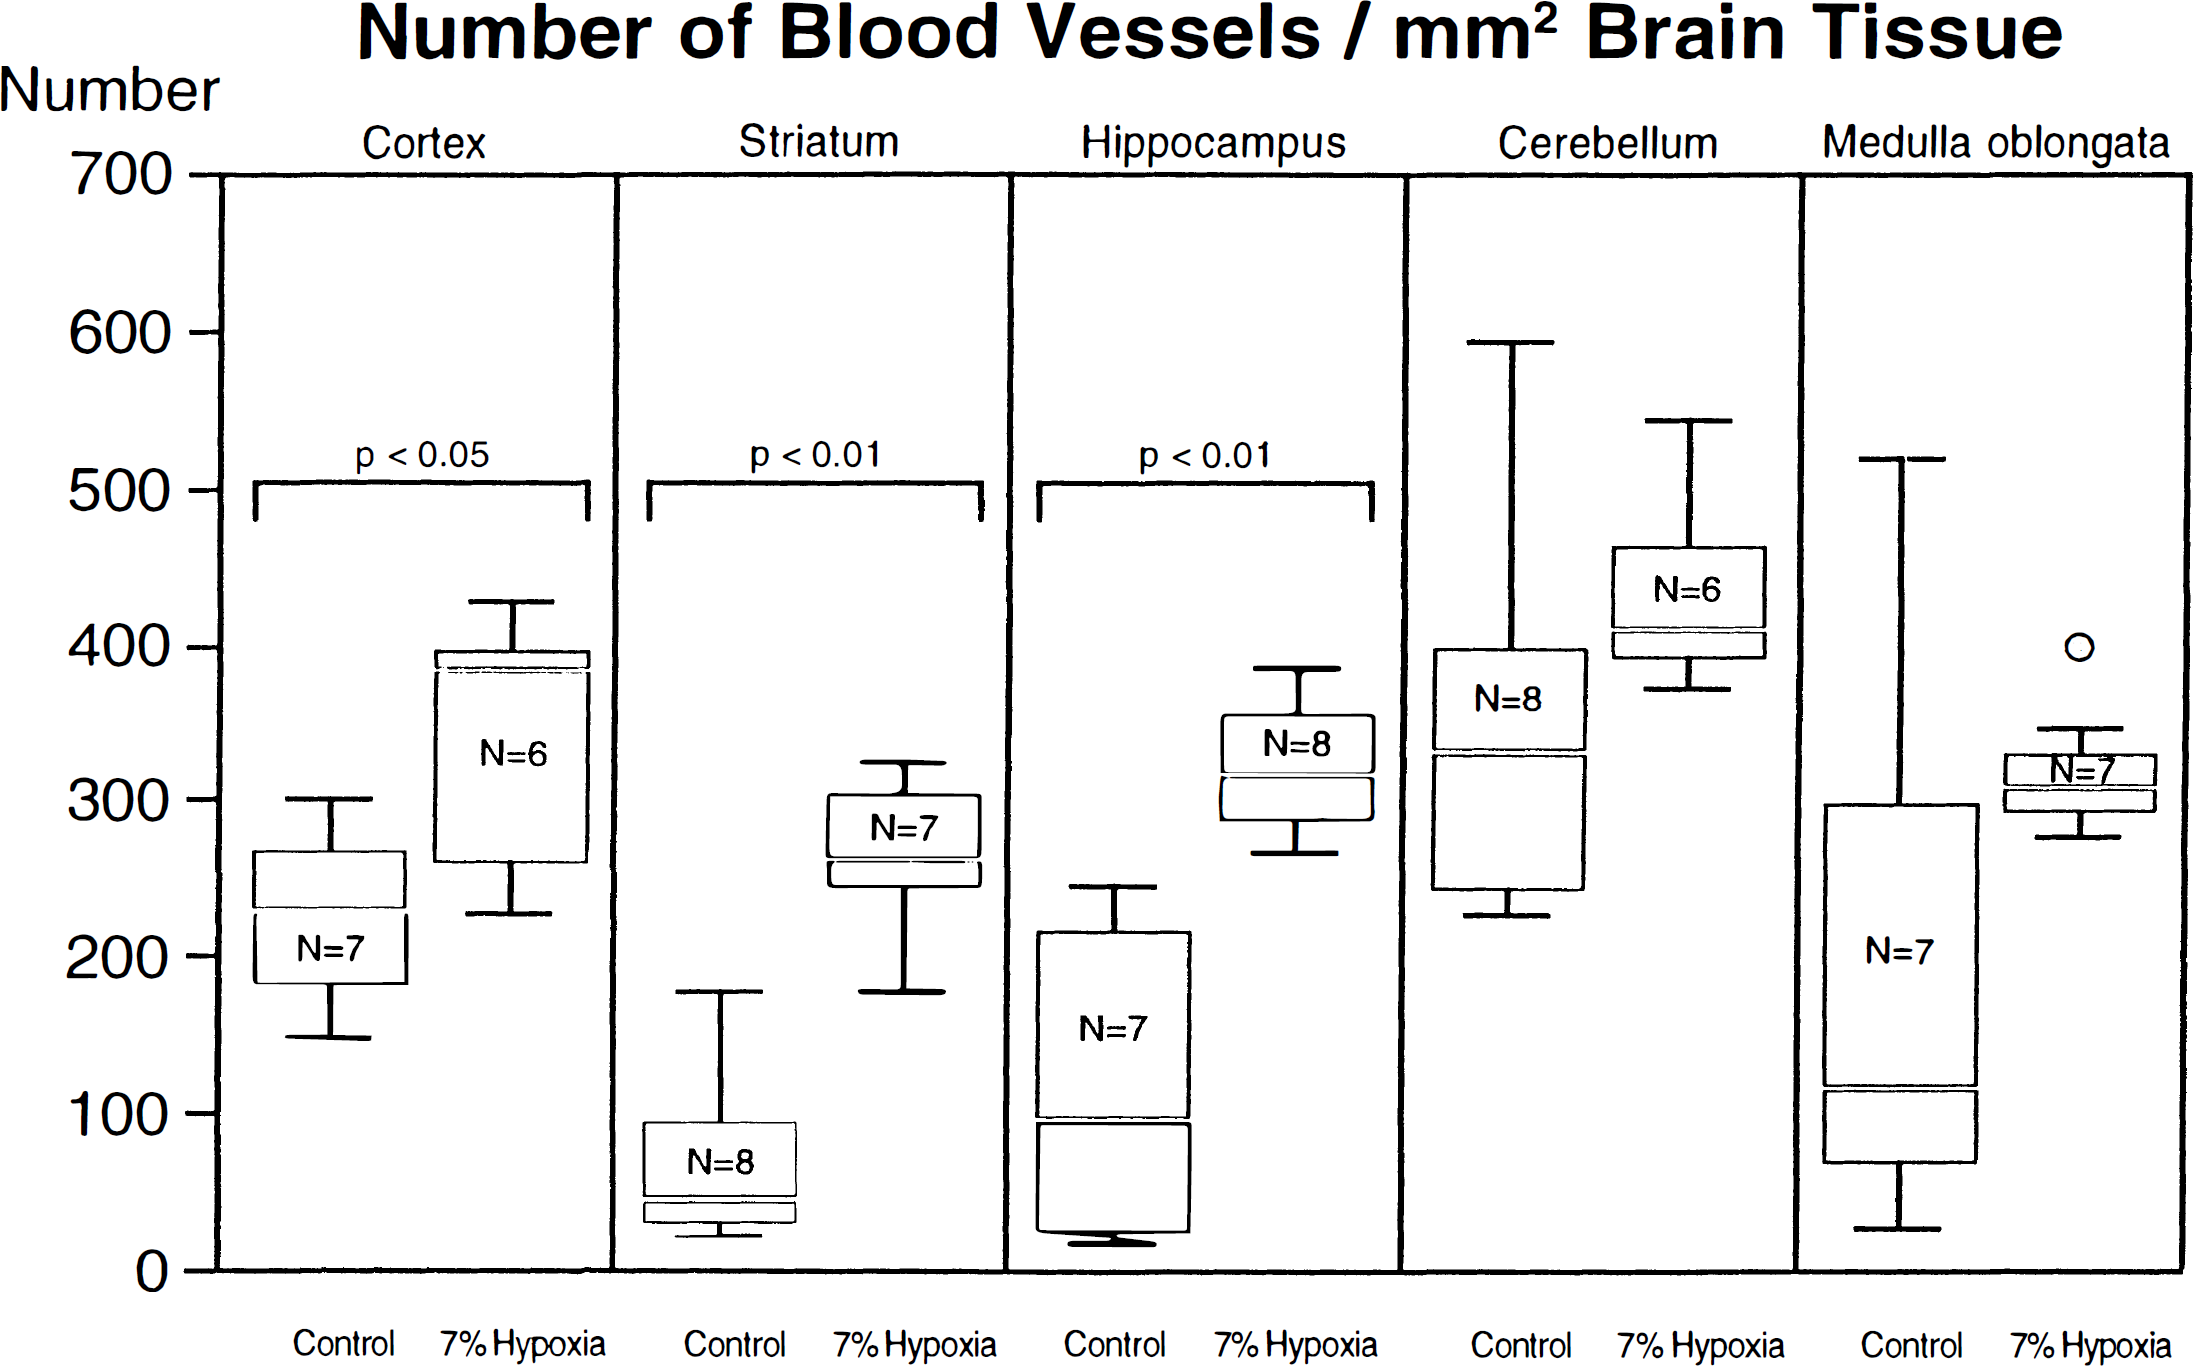
Number of blood vessels per mm2 brain tissue. The numbers of all blood vessels within 1 mm2 tissue of the six selected brain regions were measured using a Quantimet Q570. The values are given as numbers per 1 mm2 tissue × SD. In controls, highest relative vessel numbers were observed in the cerebral cortex and cerebellum. The most pronounced differences between controls and hypoxic animals were found in the striatum (P < 0.01), and in the hippocampus (P < 0.01). Differences could also been found in the cerebral cortex (P < 0.05). In the cerebellum, only a trend toward higher vessel numbers per mm2 tissue could be observed (P = 0.09). One exceptionally high vessel number was found in the cerebellum of a hypoxic animal (circle). No differences between the two groups could be demonstrated in the medulla oblongata (P = 0.1). Lack of differences in the cerebellum and medulla is attributable to high SD in controls.
Average blood vessel size
Large and small blood vessels were included together. The average vessel size (μm2) differed only in the cerebral cortex and cerebellum (Fig. 3). The mean blood vessel size in the cerebral cortex of hypoxic rats was 84.3 ± 10.7 SD μm2, that in controls of 45.8 ± 16.6 (P < 0.05). The values concerning the cerebellum were 95.7 ± 31.7 versus 35.1 ± 11.0 (P < 0.01). In the other areas, no statistically significant differences could be observed (striatum: 138.3 ± 141.1 versus 104.9 ± 29.3; hippocampus: 159.4 ± 54.0 versus 126.1 ± 86.6; medulla oblongata: 128.4 ± 80.6 versus 127.5 ± 87.0). Exceptionally large vessel sizes were found in the striatum and hippocampus of individual control cases and in the cerebellum and medulla oblongata of hypoxic animals, very small vessel sizes were found in the hippocampus of one hypoxic animal (see asterisk or circles in Fig. 3).
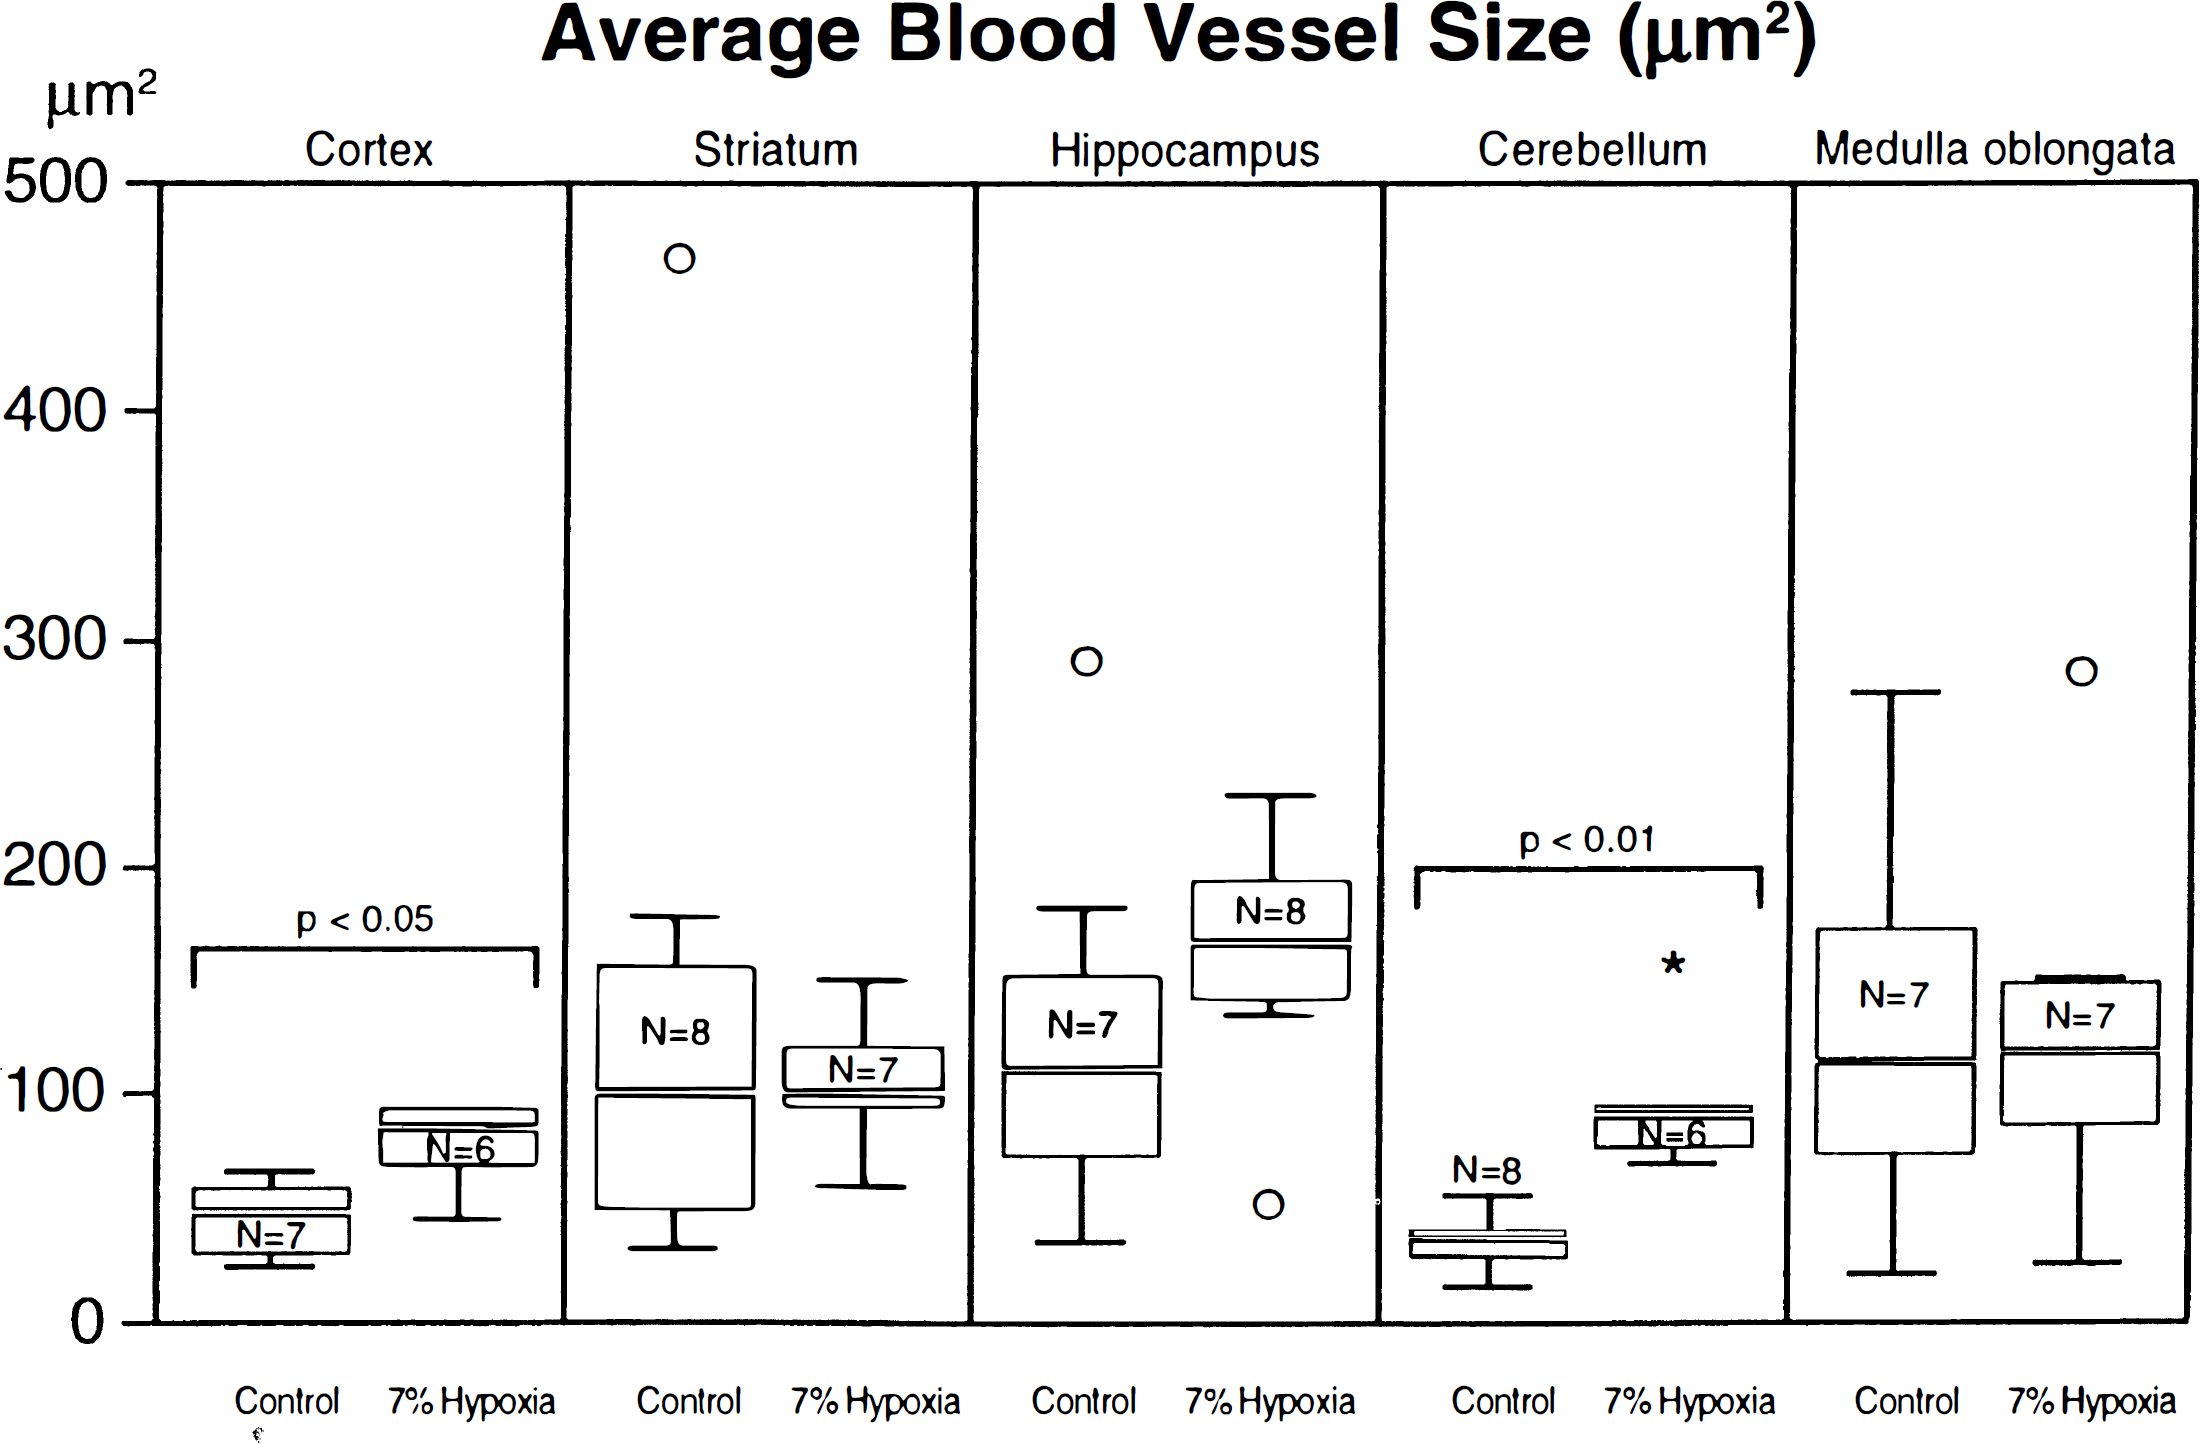
Average blood vessel size (μm2) In the six selected brain regions, the total area of all blood vessels within randomly selected tissue pieces of defined size (see blue frame in Fig. 1) were morphometrically measured and divided through the total vessel number in these tissue pieces. The values were set as average blood vessel size (μm2) ± SD. All types of vessels were put together. The average blood vessel size differed only in the cerebral cortex (P < 0.05) and cerebellum (P < 0.01). In the other areas, no statistically significant differences could be observed. Large vessel sizes were found in the hippocampus of one hypoxic animal (asterisk) and exceptionally large vessel sizes in the striatum and hippocampus of individual control cases and in the cerebellum and medulla oblongata of hypoxic animals (circles).
DISCUSSION
Angiogenesis, defined as formation of new blood vessels from an established microvasculature, occurs in the normal adult organism in the cyclic evolution of transient structures, for instance in the female reproductive system and mammary gland associated with lactation, as well as in a variety of nonpathological and pathological conditions such as chronic inflammation, wound healing, organization of thrombi, collateral circulation development, neoplasias, and in several conditions in which the term 'angiogenic disease' has been proposed (Diaz-Flores et al., 1994). Because the turnover rates of endothelial cells are extremely low, angiogenesis is generally a quiescent process in the healthy adult organism (Shweiki et al., 1993). A feature that may be confused with true angiogenic changes is lengthening of arterioles with tortuosity and formation of glomeruli in human geriatric brains (Gertz and Cervós-Navarro, 1986). These vessel changes seem to be a consequence of the altered hemodynamics in the aging brain rather than an adaptation mechanism. In the brains of our rats, no glomeruli or tortuosity of vessels were visualized. The central nervous system depends basically on oxygen supply and oxidative metabolism. If the oxygen pressure in the brain decreases, regulatory mechanisms come into play to compensate for the low oxygen supply. There are different mechanisms of vascular adaptation, mitotic proliferation of the endothelium and dilatation of vessels, which both may occur simultaneously. Further adaptive mechanisms in chronic hypoxia are upregulated expression of erythropoietin and production of erythrocytes (Jelkman, 1992).
True mitotic endothelial proliferation was thought to occur only during very particular situations, for instance, in a limited period of normal ontogeny (Bär, 1980). The development of new capillary branches in the adult brain was thought to be only possible if there was a disturbance of the structural continuity of the tissue. However, that cerebral capillary endothelial cells can indeed show an increase of mitotic activity has been well documented in spontaneously hypertensive rats. When compared with controls, the cerebral capillaries in these animals showed increased numbers of labeled endothelial cells that could be detected in early stages of hypertension, when no definite morphological changes in the microvessels were present (Yukioka et al., 1992).
The increased number of vessels in hypoxia in the heart and striated muscle and the improved oxygen diffusion at the tissue level was thought to be accomplished mainly by the opening of preexisting capillaries (Cassin et al., 1970). This capillary recruitment was also thought to be the only possible mechanism for the brain (Bär, 1980). However, Göbel et al. (1989), using a highly sensitive fluorescent microscopical method, showed that all of the capillaries in the brain were perfused and a capillary recruitment did not exist.
Angiogenesis in the brain has been reported by early investigators after prolonged hypoxic exposure (Opitz, 1951; Diemer and Henn, 1965; Miller and Hale, 1970). However, these studies involved capillaries visible by erythrocytes stained with benzidine or by perfusion with India ink, and it was unclear whether some of the assumed proliferation was just based on an improved visualization of dilated capillaries caused by their increased blood content. In the present study, the quantitative evaluation was performed on perfused vessels that completely lacked blood cells so that the possibility of an improved visualization of the blood content, that was suspected in early studies, could be excluded. Thus a real capacity for angioneogenesis in the brain after chronic hypoxia should be assumed.
The increased number of capillaries in our hypoxic rats suggests that angiogenesis is initiated by hypoxia and corroborates the results of LaManna et al. (1992), who found an increase in capillary density in rats housed in hypobaric chambers maintained at 1/2 atmosphere of pressure (10.5% O2) for 3 weeks. The increase in capillary density is compounded by an increase in the density of a stereo-specific D-glucose facilitative transport carrier at the blood-brain barrier in vitro and in vivo (Harik et al., 1991, 1994), suggesting a markedly increased capacity for glucose influx into the brain of rats adapted to hypoxia. Angiogenesis in the brain has also been observed in association with experimentally induced increases in neuropil volume in rats after 21 days of age, when vasogenesis is essentially completed (Black et al., 1991; Isaacs et al., 1992).
In our hypoxic rats, the vessel number per mm2 tissue was significantly different in striatum, hippocampus, and cerebral cortex. Notwithstanding the large standard deviations in the controls, the median of the vessel numbers per mm2 was different in both groups in the cerebellum and especially in the medulla. However, in a previous study of likewise chronic normobaric hypoxia in cats, the number of vessels in the cerebral cortex was higher than in the cerebellar cortex. In both areas, however, the number of small vessels was increased compared with the normoxic controls (Aruffo et al., 1985).
In our study, both vascular adaptation mechanisms, angiogenesis and vasodilatation, occurred. In particular areas one mechanism predominated and was sometimes inversely correlated. For example, the average vessel size per mm2 brain tissue was especially increased in the cerebellum, which correspondingly showed only a moderate increase in vessel number thus indicating a predominant vasodilatation in these areas. On the contrary, in the striatum and hippocampus, the areas with high numbers of vessels per mm2 pointing to a vigorous angiogenesis, vasodilatation was missing. This was indicated by the relatively small caliber size of the newly formed vessels. However, with respect to function, both mechanisms may not be equally efficient. Concerning the same enlarged total vessel area, angiogenesis means a many-fold increase of the blood-brain surface for the diffusion of oxygen, which does not hold true for vasodilatation, where the increase of surface is smaller.
Footnotes
Acknowledgements
The authors thank Dr. Hopfenmüller, Institute of Medical Statistics, Free University of Berlin, for his kind support in the biostatistical work, and Dr. Hamdorf for supporting the morphometric analysis.